health services financing and utilization services financing and utilization the availability of and...
TRANSCRIPT
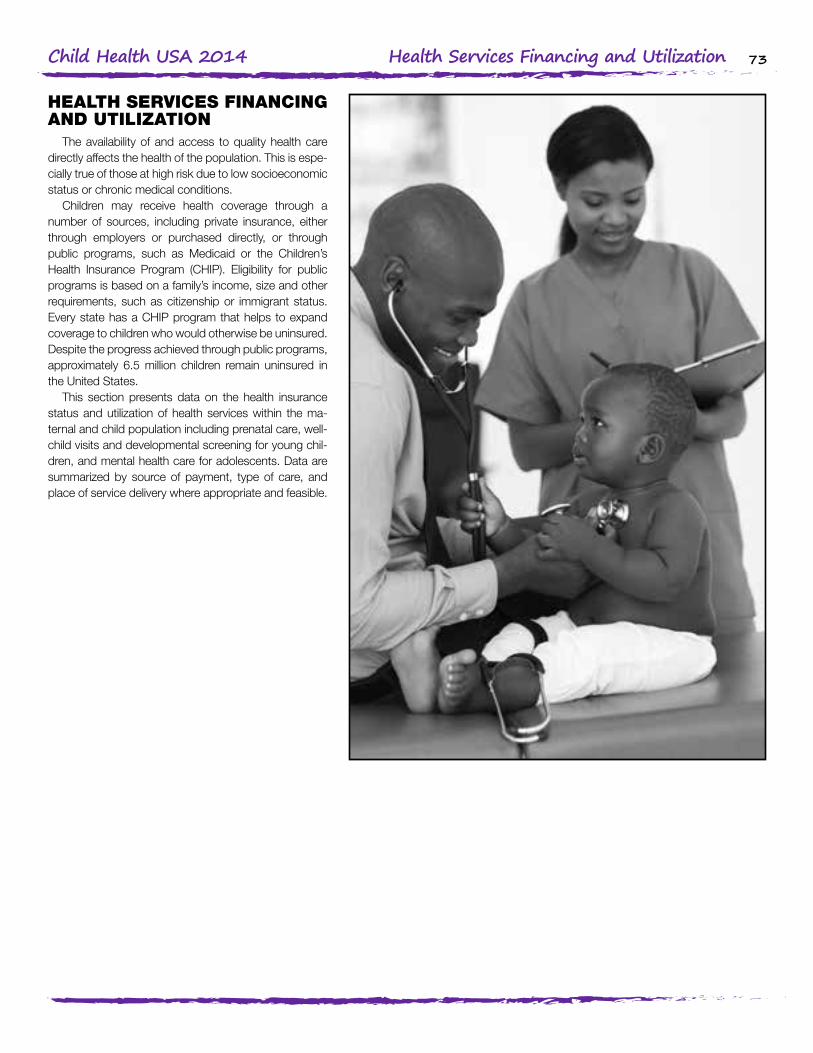
73Child Health USA 2014 Health Services Financing and Utilization
HEALTH SERVICES FINANCING AND UTILIZATION
The availability of and access to quality health care directly affects the health of the population. This is espe-cially true of those at high risk due to low socioeconomic status or chronic medical conditions.
Children may receive health coverage through a number of sources, including private insurance, either through employers or purchased directly, or through public programs, such as Medicaid or the Children’s Health Insurance Program (CHIP). Eligibility for public programs is based on a family’s income, size and other requirements, such as citizenship or immigrant status. Every state has a CHIP program that helps to expand coverage to children who would otherwise be uninsured. Despite the progress achieved through public programs, approximately 6.5 million children remain uninsured in the United States.
This section presents data on the health insurance status and utilization of health services within the ma-ternal and child population including prenatal care, well-child visits and developmental screening for young chil-dren, and mental health care for adolescents. Data are summarized by source of payment, type of care, and place of service delivery where appropriate and feasible.

74Child Health USA 2014 Health Services Financing and Utilization
HEALTH INSURANCEHealth insurance is critical for ensuring the health and well-being
of children in the United States. Without health insurance coverage, children are less likely to receive medical care and more likely to have poor health status.1 In 2013, more than 4.8 million children under age 18 did not have health insurance. This represents 6.6 percent of all children in the United States. More than half of children (53.2 percent) were covered by private insurance, and 37.7 percent were covered by public insurance (e.g., Medicaid or other state-sponsored health plans including Children’s Health Insurance Program [CHIP]).
Children’s health insurance status varies by several factors, includ-ing race, ethnicity, and income. In 2013, nearly 70 percent of non-His-panic White and non-Hispanic Asian children and more than half of non-Hispanic children of multiple races had private coverage (figure 1). In comparison, less than half of non-Hispanic Native Hawaiian/Pacific Islander (40.3 percent), non-Hispanic Black (33.6 percent), Hispanic (28.2 percent), and non-Hispanic American Indian/Alaska Native (36.3 percent) children had private coverage. Children with the highest per-
centage of public insurance were non-Hispanic Blacks (58.8 percent), Hispanics (58.2 percent), non-Hispanic Native Hawaiians/other Pacific Islanders (52.8 percent), and non-Hispanic American Indians/Alaska Natives (49.2 percent). The highest proportions of uninsured children were among non-Hispanic American Indians/Alaska Natives (11.9 percent) and Hispanics (11.8 percent).
In 2013, households with incomes below 100 percent of poverty had the highest percentage of children with public health insurance (82.3 percent) and the lowest percentage of children with private health insurance (8.4 percent). The highest percent of children who were uninsured in 2013 were children living in households with in-comes of 100–199 percent of poverty (11.1 percent), followed by chil-dren from households with incomes below 100 percent of poverty (8.2 percent). Children in households with incomes of 200 percent or more of poverty were more likely to have private coverage (81.7 percent) and less likely to have public coverage (11.1 percent) or to be uninsured (4.2 percent), as compared to those in households with lower incomes.
16 32 48 64 80
Non-HispanicMultiple Race
Non-HispanicNative Hawaiian/
Pacific Islander
Non-HispanicAsian
Non-HispanicAmerican Indian/
Alaska Native
Hispanic
Non-HispanicBlack
Non-HispanicWhite
Figure 1. Health Insurance Coverage* Among Children Under Age 18,by Race/Ethnicity, 2013
*Private coverage includes children with any private insurance; Public includes children who do not have privatecoverage, but who have Medicaid or other state-sponsored health plans, including CHIP; A child was considered uninsured if he or she did not have any private health insurance, Medicare, Medicaid, Children'sHealth Insurance Program (CHIP), state-sponsored or other government-sponsored health plan, or military plan.A child was also defined as uninsured if he or she had only Indian Health Service coverage or had only a privateplan that paid for one type of service such as accidents or dental care. Estimates do not sum to 100 becausechildren who are covered by military plans, Medicare, or other government-sponsored health plans are notshown. †Estimates are considered unreliable. Data followed by a dagger have a relative standard error (RSE)greater than 30% and less than or equal to 50% and should be used with caution. Data not shown have an RSEgreater than 50%.
58.2
49.2
66.1
51.6
23.7
58.8
33.6
68.8
28.2
Percent of Children
4.7
5.1
11.8
36.3†
25.6
11.9†
40.3†
5.9
52.8†
†
38.5
5.6
Private Insurance
Public Insurance
Uninsured
Source: Centers for Disease Control and Prevention, National Center for Health Statistics. National HealthInterview Survey. Analyses conducted by the National Center for Health Statistics.
75Child Health USA 2014 Health Services Financing and Utilization
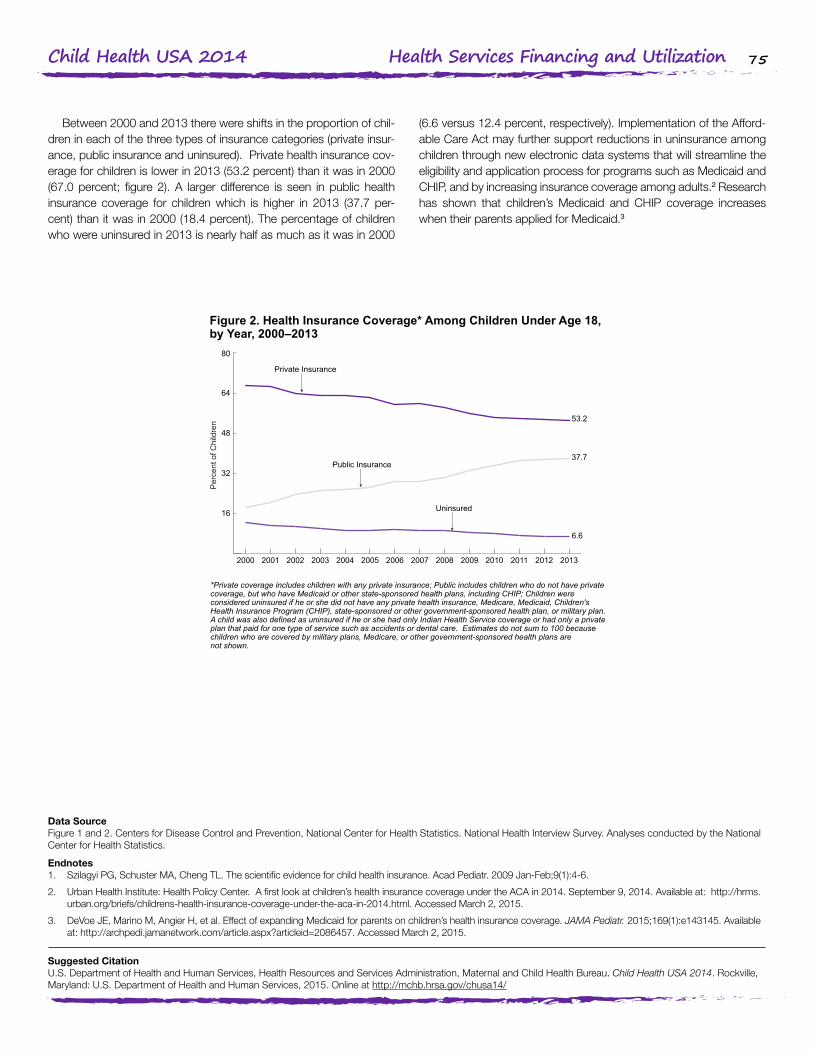
Between 2000 and 2013 there were shifts in the proportion of chil-dren in each of the three types of insurance categories (private insur-ance, public insurance and uninsured). Private health insurance cov-erage for children is lower in 2013 (53.2 percent) than it was in 2000 (67.0 percent; figure 2). A larger difference is seen in public health insurance coverage for children which is higher in 2013 (37.7 per-cent) than it was in 2000 (18.4 percent). The percentage of children who were uninsured in 2013 is nearly half as much as it was in 2000
(6.6 versus 12.4 percent, respectively). Implementation of the Afford-able Care Act may further support reductions in uninsurance among children through new electronic data systems that will streamline the eligibility and application process for programs such as Medicaid and CHIP, and by increasing insurance coverage among adults.2 Research has shown that children’s Medicaid and CHIP coverage increases when their parents applied for Medicaid.3
Data SourceFigure 1 and 2. Centers for Disease Control and Prevention, National Center for Health Statistics. National Health Interview Survey. Analyses conducted by the National Center for Health Statistics.
Endnotes1. Szilagyi PG, Schuster MA, Cheng TL. The scientific evidence for child health insurance. Acad Pediatr. 2009 Jan-Feb;9(1):4-6.
2. Urban Health Institute: Health Policy Center. A first look at children’s health insurance coverage under the ACA in 2014. September 9, 2014. Available at: http://hrms.urban.org/briefs/childrens-health-insurance-coverage-under-the-aca-in-2014.html. Accessed March 2, 2015.
3. DeVoe JE, Marino M, Angier H, et al. Effect of expanding Medicaid for parents on children’s health insurance coverage. JAMA Pediatr. 2015;169(1):e143145. Available at: http://archpedi.jamanetwork.com/article.aspx?articleid=2086457. Accessed March 2, 2015.
Figure 2. Health Insurance Coverage* Among Children Under Age 18,by Year, 2000–2013
*Private coverage includes children with any private insurance; Public includes children who do not have privatecoverage, but who have Medicaid or other state-sponsored health plans, including CHIP; Children wereconsidered uninsured if he or she did not have any private health insurance, Medicare, Medicaid, Children'sHealth Insurance Program (CHIP), state-sponsored or other government-sponsored health plan, or military plan.A child was also defined as uninsured if he or she had only Indian Health Service coverage or had only a privateplan that paid for one type of service such as accidents or dental care. Estimates do not sum to 100 becausechildren who are covered by military plans, Medicare, or other government-sponsored health plans arenot shown.
Source: Centers for Disease Control and Prevention, National Center for Health Statistics. National HealthInterview Survey. Analyses conducted by the National Center for Health Statistics.
53.2
37.7
6.6
16
32
48
64
80
20132012201120102009200820072006200520042003200220012000
Public Insurance
Uninsured
Private Insurance
Per
cent
of C
hild
ren
Suggested CitationU.S. Department of Health and Human Services, Health Resources and Services Administration, Maternal and Child Health Bureau. Child Health USA 2014. Rockville, Maryland: U.S. Department of Health and Human Services, 2015. Online at http://mchb.hrsa.gov/chusa14/
76Child Health USA 2014 Health Services Financing and Utilization
PRENATAL CAREEarly and adequate prenatal care helps to promote healthy preg-
nancies through screening and management of a woman’s risk factors and health conditions as well as education and counseling on healthy behaviors during and after pregnancy, including nutrition, physical ac-tivity, and breastfeeding.1 Women should schedule a prenatal visit as soon as they know or suspect that they are pregnant, ideally within the first trimester of pregnancy (12 weeks).2 Monthly visits are recom-mended thereafter that increase to biweekly visits at 28 weeks and weekly visits after 36 weeks.1,3 More frequent care may be necessary for women with certain conditions and risk factors.1
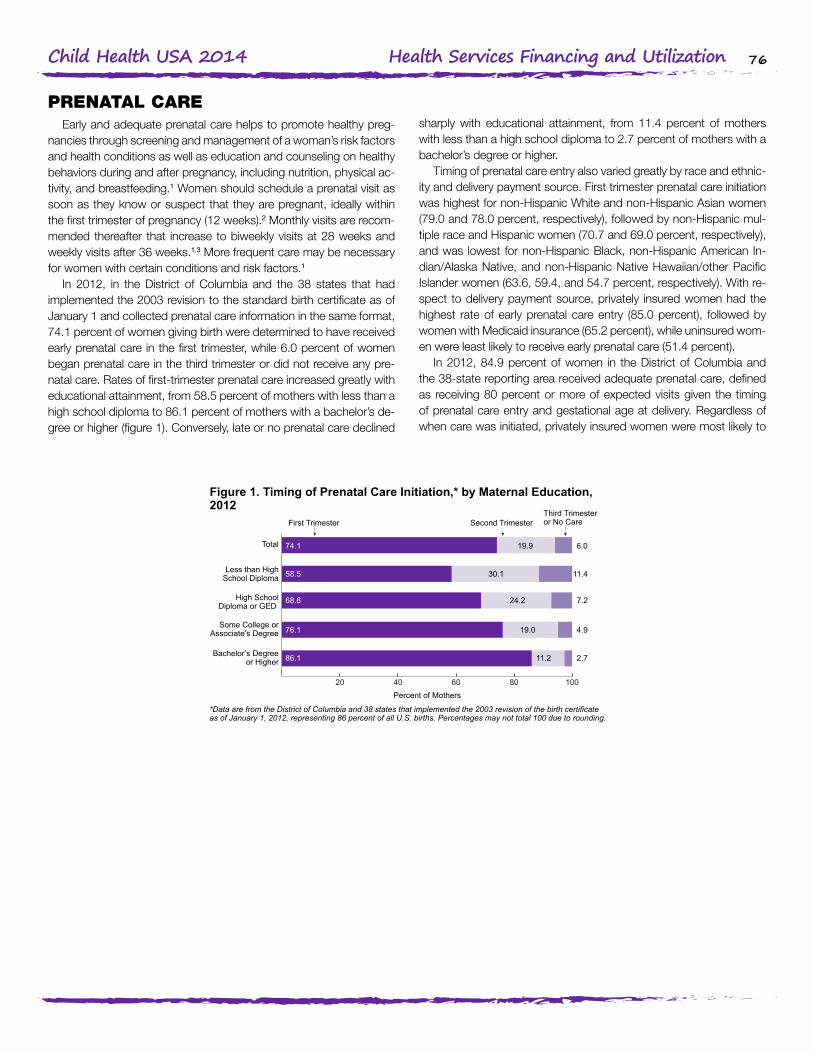
In 2012, in the District of Columbia and the 38 states that had implemented the 2003 revision to the standard birth certificate as of January 1 and collected prenatal care information in the same format, 74.1 percent of women giving birth were determined to have received early prenatal care in the first trimester, while 6.0 percent of women began prenatal care in the third trimester or did not receive any pre-natal care. Rates of first-trimester prenatal care increased greatly with educational attainment, from 58.5 percent of mothers with less than a high school diploma to 86.1 percent of mothers with a bachelor’s de-gree or higher (figure 1). Conversely, late or no prenatal care declined
sharply with educational attainment, from 11.4 percent of mothers with less than a high school diploma to 2.7 percent of mothers with a bachelor’s degree or higher.
Timing of prenatal care entry also varied greatly by race and ethnic-ity and delivery payment source. First trimester prenatal care initiation was highest for non-Hispanic White and non-Hispanic Asian women (79.0 and 78.0 percent, respectively), followed by non-Hispanic mul-tiple race and Hispanic women (70.7 and 69.0 percent, respectively), and was lowest for non-Hispanic Black, non-Hispanic American In-dian/Alaska Native, and non-Hispanic Native Hawaiian/other Pacific Islander women (63.6, 59.4, and 54.7 percent, respectively). With re-spect to delivery payment source, privately insured women had the highest rate of early prenatal care entry (85.0 percent), followed by women with Medicaid insurance (65.2 percent), while uninsured wom-en were least likely to receive early prenatal care (51.4 percent).
In 2012, 84.9 percent of women in the District of Columbia and the 38-state reporting area received adequate prenatal care, defined as receiving 80 percent or more of expected visits given the timing of prenatal care entry and gestational age at delivery. Regardless of when care was initiated, privately insured women were most likely to
Figure 1. Timing of Prenatal Care Initiation,* by Maternal Education,2012
*Data are from the District of Columbia and 38 states that implemented the 2003 revision of the birth certificateas of January 1, 2012, representing 86 percent of all U.S. births. Percentages may not total 100 due to rounding.
20 40 60 80 100
Bachelor’s Degreeor Higher
Some College orAssociate’s Degree
High SchoolDiploma or GED
Less than HighSchool Diploma
Total
First Trimester Second TrimesterThird Trimesteror No Care
Percent of Mothers
68.6
4.9
2.7
76.1
86.1
74.1 6.019.9
58.5
24.2
19.0
11.2
30.1 11.4
7.2
Source: U.S. Department of Health and Human Services, Centers for Disease Control and Prevention, NationalCenter for Health Statistics. 2012 Natality File. Analysis conducted by the U.S. Department of Health and HumanServices, Health Resources and Services Administration, Maternal and Child Health Bureau.
77Child Health USA 2014 Health Services Financing and Utilization
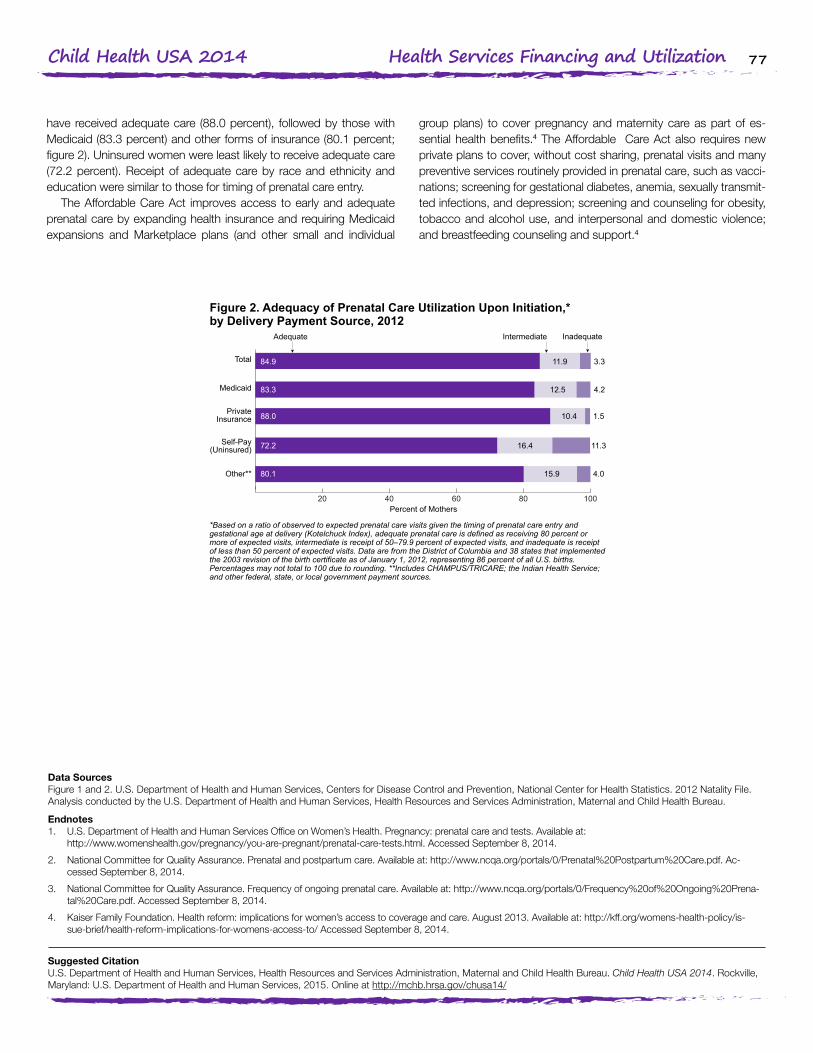
have received adequate care (88.0 percent), followed by those with Medicaid (83.3 percent) and other forms of insurance (80.1 percent; figure 2). Uninsured women were least likely to receive adequate care (72.2 percent). Receipt of adequate care by race and ethnicity and education were similar to those for timing of prenatal care entry.
The Affordable Care Act improves access to early and adequate prenatal care by expanding health insurance and requiring Medicaid expansions and Marketplace plans (and other small and individual
group plans) to cover pregnancy and maternity care as part of es-sential health benefits.4 The Affordable Care Act also requires new private plans to cover, without cost sharing, prenatal visits and many preventive services routinely provided in prenatal care, such as vacci-nations; screening for gestational diabetes, anemia, sexually transmit-ted infections, and depression; screening and counseling for obesity, tobacco and alcohol use, and interpersonal and domestic violence; and breastfeeding counseling and support.4
Data SourcesFigure 1 and 2. U.S. Department of Health and Human Services, Centers for Disease Control and Prevention, National Center for Health Statistics. 2012 Natality File. Analysis conducted by the U.S. Department of Health and Human Services, Health Resources and Services Administration, Maternal and Child Health Bureau.
Endnotes1. U.S. Department of Health and Human Services Office on Women’s Health. Pregnancy: prenatal care and tests. Available at:
http://www.womenshealth.gov/pregnancy/you-are-pregnant/prenatal-care-tests.html. Accessed September 8, 2014.
2. National Committee for Quality Assurance. Prenatal and postpartum care. Available at: http://www.ncqa.org/portals/0/Prenatal%20Postpartum%20Care.pdf. Ac-cessed September 8, 2014.
3. National Committee for Quality Assurance. Frequency of ongoing prenatal care. Available at: http://www.ncqa.org/portals/0/Frequency%20of%20Ongoing%20Prena-tal%20Care.pdf. Accessed September 8, 2014.
4. Kaiser Family Foundation. Health reform: implications for women’s access to coverage and care. August 2013. Available at: http://kff.org/womens-health-policy/is-sue-brief/health-reform-implications-for-womens-access-to/ Accessed September 8, 2014.
Figure 2. Adequacy of Prenatal Care Utilization Upon Initiation,*by Delivery Payment Source, 2012
Source: U.S. Department of Health and Human Services, Centers for Disease Control and Prevention, NationalCenter for Health Statistics. 2012 Natality File. Analysis conducted by the U.S. Department of Health and HumanServices, Health Resources and Services Administration, Maternal and Child Health Bureau.
*Based on a ratio of observed to expected prenatal care visits given the timing of prenatal care entry andgestational age at delivery (Kotelchuck Index), adequate prenatal care is defined as receiving 80 percent ormore of expected visits, intermediate is receipt of 50–79.9 percent of expected visits, and inadequate is receiptof less than 50 percent of expected visits. Data are from the District of Columbia and 38 states that implementedthe 2003 revision of the birth certificate as of January 1, 2012, representing 86 percent of all U.S. births.Percentages may not total to 100 due to rounding. **Includes CHAMPUS/TRICARE; the Indian Health Service;and other federal, state, or local government payment sources.
20 40 60 80 100
Other**
Self-Pay(Uninsured)
PrivateInsurance
Medicaid
Total
Adequate Intermediate Inadequate
Percent of Mothers
88.0
11.3
4.0
72.2
80.1
84.9 3.311.9
83.3
10.4
16.4
15.9
12.5 4.2
1.5
Suggested CitationU.S. Department of Health and Human Services, Health Resources and Services Administration, Maternal and Child Health Bureau. Child Health USA 2014. Rockville, Maryland: U.S. Department of Health and Human Services, 2015. Online at http://mchb.hrsa.gov/chusa14/
78Child Health USA 2014 Health Services Financing and Utilization
IMMUNIZATIONS: EARLY CHILDHOODVaccination is one of the greatest public health achievements of the
20th century, resulting in dramatic declines in morbidity and mortality for many infectious diseases.1 Childhood vaccination in particular is considered among the most cost-effective preventive services avail-able, as it averts a potential lifetime lost to death and disability.2 Healthy People 2020 has set a target of 80 percent coverage for a full vaccine series to be received by young children aged 19–35 months: four dos-es of diphtheria, tetanus, and acellular pertussis vaccine (DTaP/DT/DTP); three doses of poliovirus vaccine; one dose of measles-contain-ing vaccine (MMR); three (or four, depending on vaccine type) doses of Haemophilus influenzae type b (Hib); three doses of the hepatitis B vaccine (HepB); one dose of the varicella (chicken pox) vaccine; and four doses of the pneumococcal conjugate vaccine (PCV).3
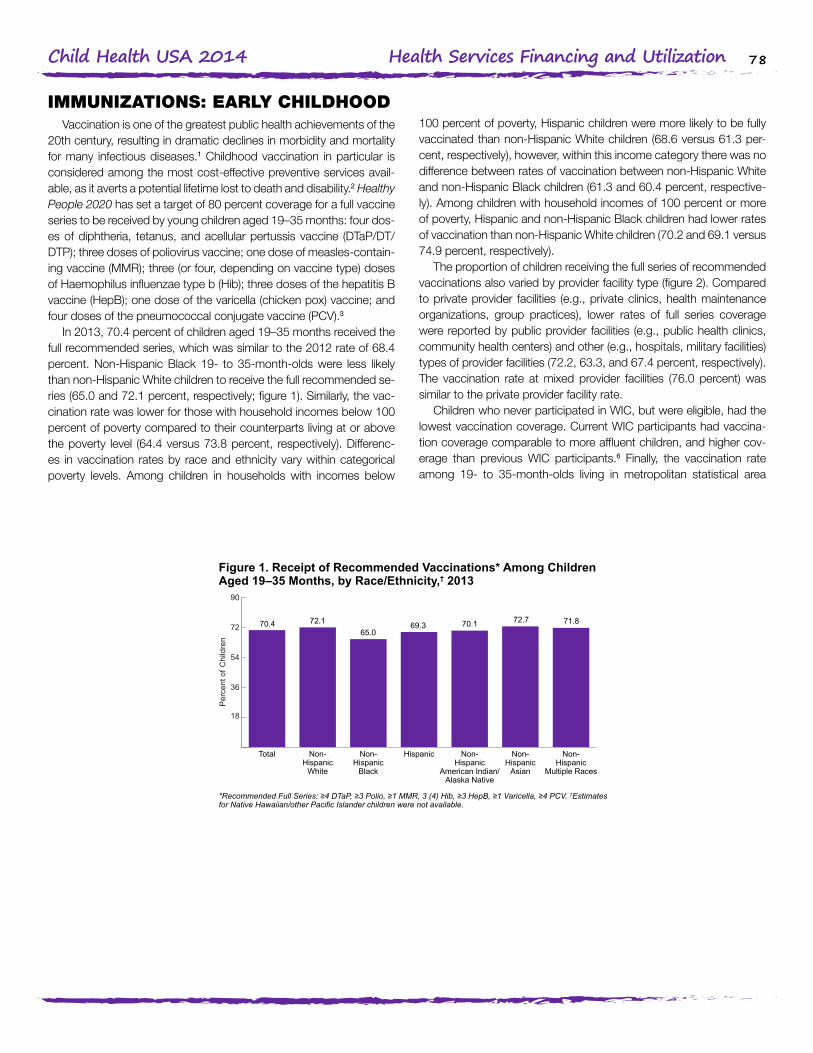
In 2013, 70.4 percent of children aged 19–35 months received the full recommended series, which was similar to the 2012 rate of 68.4 percent. Non-Hispanic Black 19- to 35-month-olds were less likely than non-Hispanic White children to receive the full recommended se-ries (65.0 and 72.1 percent, respectively; figure 1). Similarly, the vac-cination rate was lower for those with household incomes below 100 percent of poverty compared to their counterparts living at or above the poverty level (64.4 versus 73.8 percent, respectively). Differenc-es in vaccination rates by race and ethnicity vary within categorical poverty levels. Among children in households with incomes below
100 percent of poverty, Hispanic children were more likely to be fully vaccinated than non-Hispanic White children (68.6 versus 61.3 per-cent, respectively), however, within this income category there was no difference between rates of vaccination between non-Hispanic White and non-Hispanic Black children (61.3 and 60.4 percent, respective-ly). Among children with household incomes of 100 percent or more of poverty, Hispanic and non-Hispanic Black children had lower rates of vaccination than non-Hispanic White children (70.2 and 69.1 versus 74.9 percent, respectively).
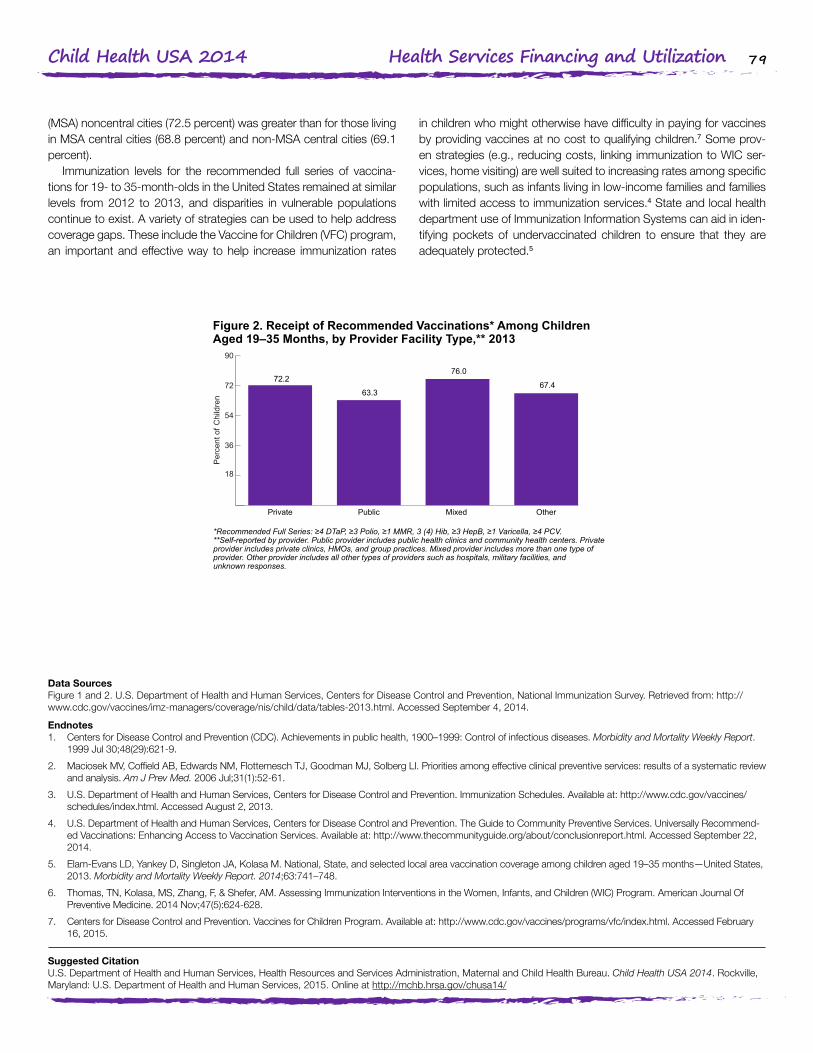
The proportion of children receiving the full series of recommended vaccinations also varied by provider facility type (figure 2). Compared to private provider facilities (e.g., private clinics, health maintenance organizations, group practices), lower rates of full series coverage were reported by public provider facilities (e.g., public health clinics, community health centers) and other (e.g., hospitals, military facilities) types of provider facilities (72.2, 63.3, and 67.4 percent, respectively). The vaccination rate at mixed provider facilities (76.0 percent) was similar to the private provider facility rate.
Children who never participated in WIC, but were eligible, had the lowest vaccination coverage. Current WIC participants had vaccina-tion coverage comparable to more affluent children, and higher cov-erage than previous WIC participants.6 Finally, the vaccination rate among 19- to 35-month-olds living in metropolitan statistical area
Figure 1. Receipt of Recommended Vaccinations* Among ChildrenAged 19–35 Months, by Race/Ethnicity,† 2013
Per
cent
of C
hild
ren
*Recommended Full Series: ≥4 DTaP, ≥3 Polio, ≥1 MMR, 3 (4) Hib, ≥3 HepB, ≥1 Varicella, ≥4 PCV. †Estimatesfor Native Hawaiian/other Pacific Islander children were not available.
18
36
54
72
90
Non-Hispanic
Multiple Races
Non-Hispanic
Asian
Non-Hispanic
American Indian/Alaska Native
HispanicNon-Hispanic
Black
Non-Hispanic
White
Total
70.169.365.0
72.772.170.4 71.8
Source: U.S. Department of Health and Human Services, Centers for Disease Control and Prevention, NationalImmunization Survey. Retrieved from:http://www.cdc.gov/vaccines/imz-managers/coverage/nis/child/data/tables-2013.html Accessed September 4, 2014.
79Child Health USA 2014 Health Services Financing and Utilization
(MSA) noncentral cities (72.5 percent) was greater than for those living in MSA central cities (68.8 percent) and non-MSA central cities (69.1 percent).
Immunization levels for the recommended full series of vaccina-tions for 19- to 35-month-olds in the United States remained at similar levels from 2012 to 2013, and disparities in vulnerable populations continue to exist. A variety of strategies can be used to help address coverage gaps. These include the Vaccine for Children (VFC) program, an important and effective way to help increase immunization rates
in children who might otherwise have difficulty in paying for vaccines by providing vaccines at no cost to qualifying children.7 Some prov-en strategies (e.g., reducing costs, linking immunization to WIC ser-vices, home visiting) are well suited to increasing rates among specific populations, such as infants living in low-income families and families with limited access to immunization services.4 State and local health department use of Immunization Information Systems can aid in iden-tifying pockets of undervaccinated children to ensure that they are adequately protected.5
Data SourcesFigure 1 and 2. U.S. Department of Health and Human Services, Centers for Disease Control and Prevention, National Immunization Survey. Retrieved from: http://www.cdc.gov/vaccines/imz-managers/coverage/nis/child/data/tables-2013.html. Accessed September 4, 2014.
Endnotes1. Centers for Disease Control and Prevention (CDC). Achievements in public health, 1900–1999: Control of infectious diseases. Morbidity and Mortality Weekly Report.
1999 Jul 30;48(29):621-9.
2. Maciosek MV, Coffield AB, Edwards NM, Flottemesch TJ, Goodman MJ, Solberg LI. Priorities among effective clinical preventive services: results of a systematic review and analysis. Am J Prev Med. 2006 Jul;31(1):52-61.
3. U.S. Department of Health and Human Services, Centers for Disease Control and Prevention. Immunization Schedules. Available at: http://www.cdc.gov/vaccines/schedules/index.html. Accessed August 2, 2013.
4. U.S. Department of Health and Human Services, Centers for Disease Control and Prevention. The Guide to Community Preventive Services. Universally Recommend-ed Vaccinations: Enhancing Access to Vaccination Services. Available at: http://www.thecommunityguide.org/about/conclusionreport.html. Accessed September 22, 2014.
5. Elam-Evans LD, Yankey D, Singleton JA, Kolasa M. National, State, and selected local area vaccination coverage among children aged 19–35 months—United States, 2013. Morbidity and Mortality Weekly Report. 2014;63:741–748.
6. Thomas, TN, Kolasa, MS, Zhang, F, & Shefer, AM. Assessing Immunization Interventions in the Women, Infants, and Children (WIC) Program. American Journal Of Preventive Medicine. 2014 Nov;47(5):624-628.
7. Centers for Disease Control and Prevention. Vaccines for Children Program. Available at: http://www.cdc.gov/vaccines/programs/vfc/index.html. Accessed February 16, 2015.
Figure 2. Receipt of Recommended Vaccinations* Among ChildrenAged 19–35 Months, by Provider Facility Type,** 2013
Per
cent
of C
hild
ren
Source: U.S. Department of Health and Human Services, Centers for Disease Control and Prevention, NationalImmunization Survey. Retrieved from:http://www.cdc.gov/vaccines/imz-managers/coverage/nis/child/data/tables-2013.html Accessed September 4, 2014.
*Recommended Full Series: ≥4 DTaP, ≥3 Polio, ≥1 MMR, 3 (4) Hib, ≥3 HepB, ≥1 Varicella, ≥4 PCV.**Self-reported by provider. Public provider includes public health clinics and community health centers. Privateprovider includes private clinics, HMOs, and group practices. Mixed provider includes more than one type ofprovider. Other provider includes all other types of providers such as hospitals, military facilities, andunknown responses.
18
36
54
72
90
OtherMixed PublicPrivate
76.0
63.3
72.267.4
Suggested CitationU.S. Department of Health and Human Services, Health Resources and Services Administration, Maternal and Child Health Bureau. Child Health USA 2014. Rockville, Maryland: U.S. Department of Health and Human Services, 2015. Online at http://mchb.hrsa.gov/chusa14/

80Child Health USA 2014 Health Services Financing and Utilization
IMMUNIZATIONS: INFLUENZAInfluenza is a contagious respiratory illness that can have mild to
severe effects. Older people, young children, pregnant women, and people with certain health conditions are at higher risk for serious flu complications, possibly resulting in hospitalization or death. To avoid potentially serious complications, the Advisory Committee on Immu-nization Practices (ACIP) recommends seasonal flu vaccination for everyone 6 months of age and older.1 In 2014, ACIP voted to rec-ommend a preference for using the nasal spray flu vaccine instead of the flu shot in healthy children 2–8 years of age when it is available.5 The Healthy People 2020 target vaccination rate for children aged 6 months through 17 years is 70 percent.2
The overall proportion of children aged 6 months to 17 years who were vaccinated during the 2013–2014 flu season was 58.9 percent, which represented a 2.3 percentage point increase in coverage over the previous year. Vaccination rates held steady at around 75 percent during this timeframe, however, for children aged 6 to 23 months, representing a successful achievement of the Healthy People 2020 goal for that age group. In contrast, children aged 2–17 years did not meet the Healthy People 2020 goal. The proportion of children vaccinated for seasonal influenza decreased with age, falling to 46.4 percent among children aged 13–17 years (figure 1).
During the 2013–2014 flu season, the proportion of children aged 6 months to 17 years who received influenza vaccination varied by race and ethnicity, ranging from 55.2 percent of non-Hispanic White children to 70.6 percent of non-Hispanic Asian children (figure 2). The proportion of children vaccinated was higher among all races and eth-
nicities compared to non-Hispanic White children, with the exception of non-Hispanic Black children (57.2 percent). In the 2013–2014 flu season, non-Hispanic American Indian/Alaska Native, Hispanic, and non-Hispanic White children showed increases in vaccination rates compared to the previous flu season.
Children in families with household incomes above 100 percent of poverty but below $75,000 had the lowest rate of vaccination (54.0 percent) in the 2013–2014 flu season. Children in families with in-comes less than 100 percent of poverty or above $75,000 had similar rates of vaccination (62.8 and 60.8 percent, respectively).
The 2013–2014 vaccination rates among children living in nonmet-ropolitan statistical areas (MSA) were lower (52.6 percent) than those in MSAs (62.6 and 58.9 percent for central city and non-central city, respectively). Children living in MSAs showed an increase in vaccina-tion rates over the previous flu season, while children in non-MSAs did not.
Flu vaccination is the most effective strategy against the flu and serious flu-related complications. Multifaceted strategies are required to increase vaccination rates: (1) use of evidence-based practices (e.g., reducing client costs for vaccination; provision of immunizations at schools and Women, Infants, and Children programs; home vis-its; client reminder/recall; standing orders; provider reminders),3 (2) nontraditional settings for vaccination (e.g., pharmacy, workplace, school venues),4 and (3) utilizing immunization information systems at the point of clinical care and to guide clinical/public health vaccination decisions.4
Figure 1. Seasonal Flu Vaccinations Among Children Aged6 Months–17 Years, by Selected Age Group, 2012–2014
Percent of Children
68.1
61.0
46.4
42.5
58.9
56.6
10 20 30 40 50 60 70 80 90 100
13–17 years
5–12 years
2–4 years
6–23 months
Total 2013–2014
2012–2013
Source: U.S. Department of Health and Human Services, Centers for Disease Control and Prevention, NationalImmunization Survey - Flu. Retrieved from: http://www.cdc.gov/flu/fluvaxview/coverage-1314estimates.htmAccessed September 18, 2014.
74.3
76.9
65.8
58.6

81Child Health USA 2014 Health Services Financing and Utilization
Data SourcesFigure 1 and 2. U.S. Department of Health and Human Services, Centers for Disease Control and Prevention, National Immunization Survey - Flu. Retrieved from: http://www.cdc.gov/flu/fluvaxview/coverage-1314estimates.htm Accessed September 18, 2014.
Endnotes1. Centers for Disease Control and Prevention. Prevention and control of influenza with vaccines: recommendations of the Advisory Committee on Immunization
Practices, 2010. MMWR. August 6, 2010;59(RR08):1–62. Available at: http://www.cdc.gov/mmwr/preview/mmwrhtml/rr5908a1.htm?s_cid=rr5908a1_w. Accessed September 23, 2013.
2. U.S. Department of Health and Human Services. Healthy People 2020: Immunization and Infectious Diseases. Available at: http://www.healthypeople.gov/2020/topics-objectives2020/default. Accessed August 20, 2013.
3. The Community Guide. Increasing Appropriate Vaccination. Available at: http://www.thecommunityguide.org/vaccines/universally/index.html. Accessed August 12, 2013.
4. Murphy PA, Frazee SG, Cantlin JP, Cohen E, Rosan JR, Harshburger DE. Pharmacy provision of influenza vaccinations in medically underserved communities. Journal of the American Pharmaceutical Association. 2012;52(1):67–70.
5. Centers for Disease Control and Prevention. Advisory Committee on Immunization Practices (ACIP) recommends a preference for using the nasal spray flu vaccine. Available at: http://www.cdc.gov/media/releases/2014/s0625-acip.html. Accessed February 16, 2015.
Figure 2. Seasonal Flu Vaccinations Among Children Aged6 Months–17 Years, by Race/Ethnicity, 2012–2014
Per
cent
of C
hild
ren
†Includes Native Hawaiian or other Pacific Islanders, and children of multiple and other races.
70.6
59.258.557.260.9
55.2 56.7
66.0 65.5 65.8
53.8 52.5
2013-20142012–2013
10
20
30
40
50
60
70
80
90
100
Non-HispanicOther or
Multiple Race†
Non-Hispanic
Asian
Non-Hispanic
American Indian/Alaska Native
HispanicNon-Hispanic
Black
Non-Hispanic
White
Source: U.S. Department of Health and Human Services, Centers for Disease Control and Prevention, NationalImmunization Survey - Flu. Retrieved from: http://www.cdc.gov/flu/fluvaxview/coverage-1314estimates.htmAccessed September 18, 2014.
Suggested CitationU.S. Department of Health and Human Services, Health Resources and Services Administration, Maternal and Child Health Bureau. Child Health USA 2014. Rockville, Maryland: U.S. Department of Health and Human Services, 2015. Online at http://mchb.hrsa.gov/chusa14/
82Child Health USA 2014 Health Services Financing and Utilization
IMMUNIZATIONS: ADOLESCENTSThe U.S. immunization program, with its strong emphasis on infant
and early childhood immunizations, has been a remarkable success. However, past-year preventive care doctor visits decline from infancy and early childhood to middle childhood and adolescence,1 providing fewer opportunities for older children and teens to receive immuni-zations. The Healthy People 2020 (HP2020) targets for vaccination coverage among adolescents aged 13–15 years are 80 percent cov-erage for one dose of tetanus toxoid, reduced diphtheria toxoid, and acellular pertussis (Tdap) vaccine; one dose of meningococcal con-jugate (MenACWY) vaccine; and for females, three doses of human papilloma virus (HPV) vaccine.2 Tdap and MenACWY vaccines protect against bacterial infections that can cause breathing problems, paraly-sis, brain damage, and death, while the HPV vaccine protects against several viral strains that can cause cervical and anal cancer and genital warts.3
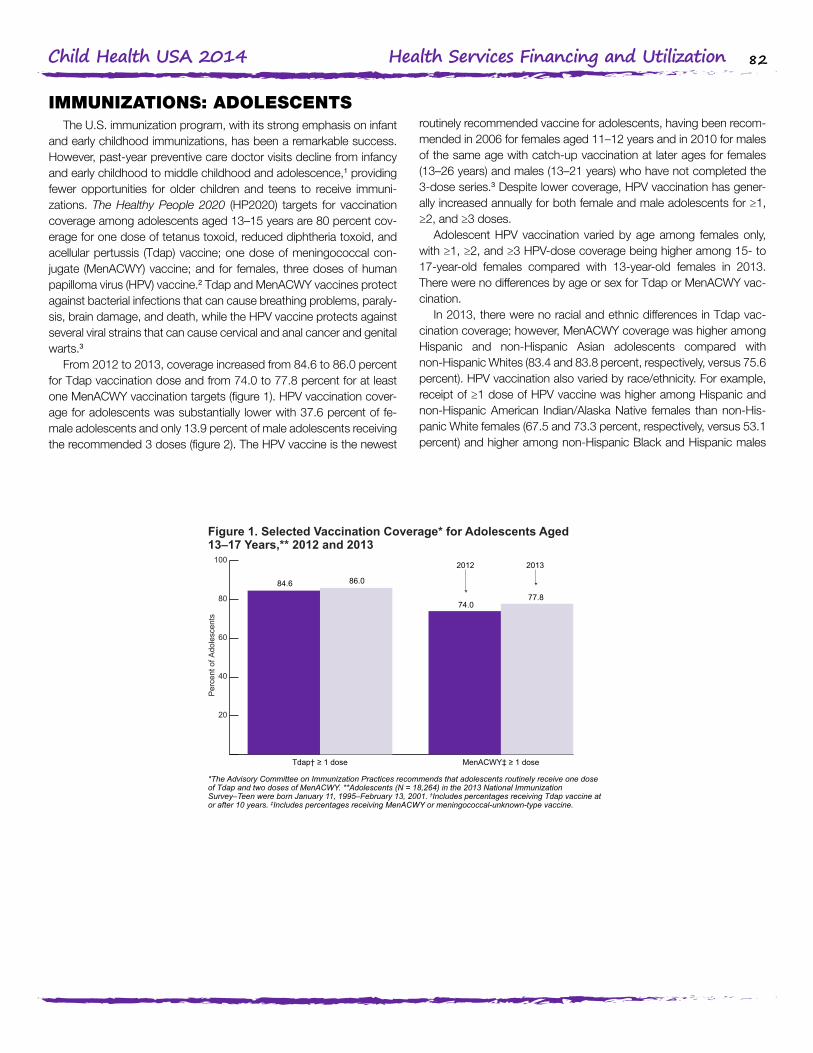
From 2012 to 2013, coverage increased from 84.6 to 86.0 percent for Tdap vaccination dose and from 74.0 to 77.8 percent for at least one MenACWY vaccination targets (figure 1). HPV vaccination cover-age for adolescents was substantially lower with 37.6 percent of fe-male adolescents and only 13.9 percent of male adolescents receiving the recommended 3 doses (figure 2). The HPV vaccine is the newest
routinely recommended vaccine for adolescents, having been recom-mended in 2006 for females aged 11–12 years and in 2010 for males of the same age with catch-up vaccination at later ages for females (13–26 years) and males (13–21 years) who have not completed the 3-dose series.3 Despite lower coverage, HPV vaccination has gener-ally increased annually for both female and male adolescents for ≥1, ≥2, and ≥3 doses.
Adolescent HPV vaccination varied by age among females only, with ≥1, ≥2, and ≥3 HPV-dose coverage being higher among 15- to 17-year-old females compared with 13-year-old females in 2013. There were no differences by age or sex for Tdap or MenACWY vac-cination.
In 2013, there were no racial and ethnic differences in Tdap vac-cination coverage; however, MenACWY coverage was higher among Hispanic and non-Hispanic Asian adolescents compared with non-Hispanic Whites (83.4 and 83.8 percent, respectively, versus 75.6 percent). HPV vaccination also varied by race/ethnicity. For example, receipt of ≥1 dose of HPV vaccine was higher among Hispanic and non-Hispanic American Indian/Alaska Native females than non-His-panic White females (67.5 and 73.3 percent, respectively, versus 53.1 percent) and higher among non-Hispanic Black and Hispanic males
Figure 1. Selected Vaccination Coverage* for Adolescents Aged13–17 Years,** 2012 and 2013
Per
cent
of A
dole
scen
ts
*The Advisory Committee on Immunization Practices recommends that adolescents routinely receive one doseof Tdap and two doses of MenACWY. **Adolescents (N = 18,264) in the 2013 National ImmunizationSurvey–Teen were born January 11, 1995–February 13, 2001. †Includes percentages receiving Tdap vaccine ator after 10 years. ‡Includes percentages receiving MenACWY or meningococcal-unknown-type vaccine.
Source: U.S. Department of Health and Human Services, Centers for Disease Control and Prevention, NationalImmunization Survey - Teen. Retrieved from:http://www.cdc.gov/vaccines/imz-managers/coverage/nis/teen/index.html Accessed September 18, 2014.
77.874.0
84.680.0
86.0
2012 2013
20
40
60
80
100
MenACWY‡ ≥ 1 doseTdap† ≥ 1 dose

83Child Health USA 2014 Health Services Financing and Utilization
Figure 2. HPV Vaccination Coverage* for Adolescents Aged 13–17Years, by Sex and Doses Received, 2007–2013
Per
cent
of A
dole
scen
ts
*The Advisory Committee on Immunization Practices recommends that adolescents routinely receive threedoses of human papilloma virus vaccine.
57.3
47.7
37.634.6
23.5
13.912
24
36
48
60
2013201220112010200920082007
Source: U.S. Department of Health and Human Services, Centers for Disease Control and Prevention, NationalImmunization Survey - Teen. Retrieved from:http://www.cdc.gov/vaccines/imz-managers/coverage/nis/teen/index.html Accessed September 18, 2014.
versus non-Hispanic White males (42.2 and 49.6 percent, respective-ly, versus 26.7 percent).
High Tdap coverage levels among adolescents aged 13–17 years indicate that similar coverage levels are attainable for other vaccines recommended for adolescents. Improved adherence of clinicians and parents to the Advisory Committee on Immunization Practices (ACIP) recommendation to administer all age-appropriate vaccines during a single visit could substantially increase lagging vaccination coverage
levels for HPV vaccination.4 Use of patient reminder and recall sys-tems, immunization information systems, coverage assessment and feedback to clinicians, clinician reminders, standing orders, and other interventions can also help make use of every health care visit to en-sure that adolescents are fully protected from vaccine-preventable in-fections and cancers, especially when such interventions are coupled with clinicians’ vaccination recommendations.5
Data SourcesFigure 1 and 2. U.S. Department of Health and Human Services, Centers for Disease Control and Prevention, National Immunization Survey - Teen. Retrieved from: http://www.cdc.gov/vaccines/imz-managers/coverage/nis/teen/index.html Accessed September 18, 2014.
Endnotes1. U.S. Department of Health and Human Services, Health Resources and Services Administration, Maternal and Child Health Bureau; U.S. Department of Health and
Human Services, Centers for Disease Control and Prevention, National Center for Health Statistics. National Survey of Children’s Health 2011–2012. Available at: http://www.childhealthdata.org/. Accessed September 2, 2014.
2. U.S. Department of Health and Human Services. Healthy People 2020. Available at: http://www.healthypeople.gov. Accessed September 2, 2014.
3. Centers for Disease Control and Prevention. Vaccines Recommended for Preteens and Teens. Retrieved from: http://www.cdc.gov/vaccines/who/teens/vaccines/index.html Accessed on September 4, 2014.
4. U.S. Department of Health and Human Services, Centers for Disease Control and Prevention, National Center for Immunization and Respiratory Diseases. ACIP Rec-ommendations. Available at: http://www.cdc.gov/vaccines/acip/. Accessed September 2, 2014.
5. Community Preventive Services Task Force. Increasing Appropriate Vaccination. Atlanta, GA: Community Preventive Services Task Force; 2014. Available at: http://www.thecommunityguide.org/vaccines/index.html. Accessed September 2, 2014.
Suggested CitationU.S. Department of Health and Human Services, Health Resources and Services Administration, Maternal and Child Health Bureau. Child Health USA 2014. Rockville, Maryland: U.S. Department of Health and Human Services, 2015. Online at http://mchb.hrsa.gov/chusa14/
84Child Health USA 2014 Health Services Financing and Utilization
WELL-CHILD VISITSIn 2012, 79.5 percent of children under 18 years of age were re-
ported by their parents to have had a preventive or “well-child” medical visit in the past year, when they were not sick or injured. The American Academy of Pediatrics recommends that children have eight preven-tive health care visits in their first year, three in their second year, and at least one per year from age 3 through adolescence.1 Well-child visits offer an opportunity not only to monitor children’s health and provide immunizations but also to assess a child’s behavior and development, discuss nutrition, and answer parents’ questions.
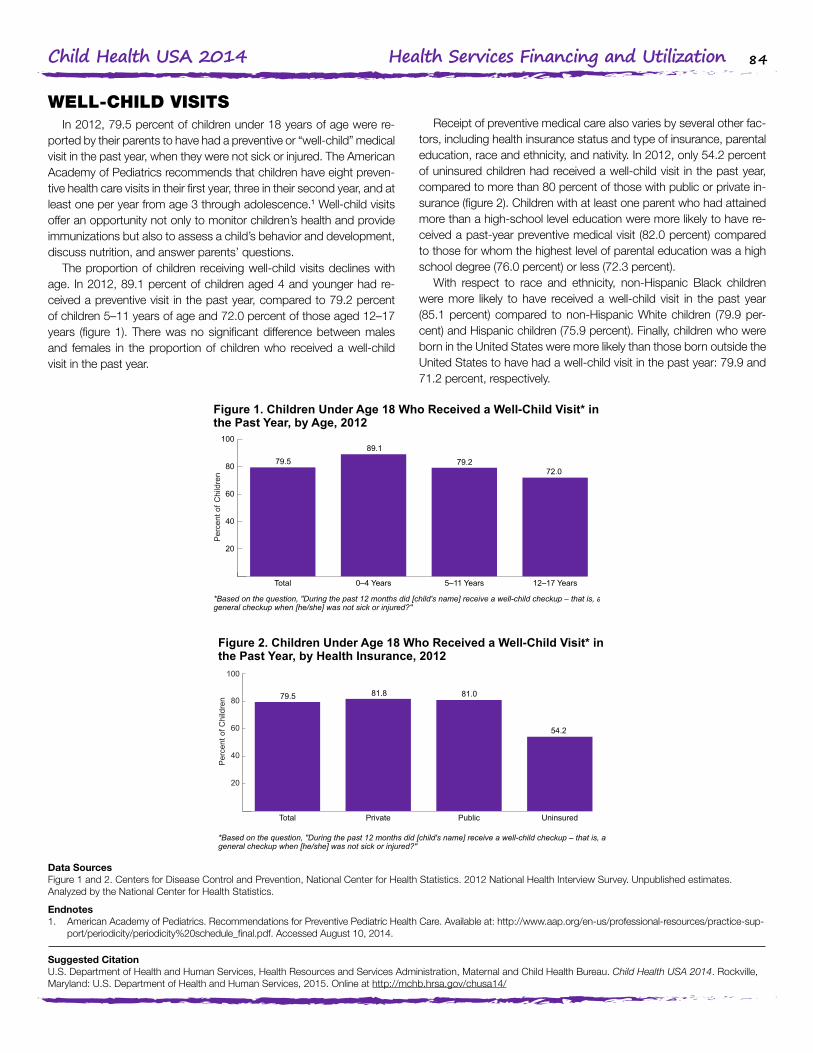
The proportion of children receiving well-child visits declines with age. In 2012, 89.1 percent of children aged 4 and younger had re-ceived a preventive visit in the past year, compared to 79.2 percent of children 5–11 years of age and 72.0 percent of those aged 12–17 years (figure 1). There was no significant difference between males and females in the proportion of children who received a well-child visit in the past year.
Receipt of preventive medical care also varies by several other fac-tors, including health insurance status and type of insurance, parental education, race and ethnicity, and nativity. In 2012, only 54.2 percent of uninsured children had received a well-child visit in the past year, compared to more than 80 percent of those with public or private in-surance (figure 2). Children with at least one parent who had attained more than a high-school level education were more likely to have re-ceived a past-year preventive medical visit (82.0 percent) compared to those for whom the highest level of parental education was a high school degree (76.0 percent) or less (72.3 percent).
With respect to race and ethnicity, non-Hispanic Black children were more likely to have received a well-child visit in the past year (85.1 percent) compared to non-Hispanic White children (79.9 per-cent) and Hispanic children (75.9 percent). Finally, children who were born in the United States were more likely than those born outside the United States to have had a well-child visit in the past year: 79.9 and 71.2 percent, respectively.
Data SourcesFigure 1 and 2. Centers for Disease Control and Prevention, National Center for Health Statistics. 2012 National Health Interview Survey. Unpublished estimates. Analyzed by the National Center for Health Statistics.
Endnotes1. American Academy of Pediatrics. Recommendations for Preventive Pediatric Health Care. Available at: http://www.aap.org/en-us/professional-resources/practice-sup-
port/periodicity/periodicity%20schedule_final.pdf. Accessed August 10, 2014.
Figure 1. Children Under Age 18 Who Received a Well-Child Visit* inthe Past Year, by Age, 2012
Per
cent
of C
hild
ren
*Based on the question, "During the past 12 months did [child's name] receive a well-child checkup – that is, ageneral checkup when [he/she] was not sick or injured?"
Source: Centers for Disease Control and Prevention, National Center for Health Statistics. 2012 National HealthInterview Survey. Unpublished estimates. Analyzed by the National Center for Health Statistics.
79.5 79.272.0
89.1
20
40
60
80
100
12–17 Years5–11 Years0–4 YearsTotal
Figure 2. Children Under Age 18 Who Received a Well-Child Visit* inthe Past Year, by Health Insurance, 2012
Per
cent
of C
hild
ren
Source: Centers for Disease Control and Prevention, National Center for Health Statistics. 2012 National HealthInterview Survey. Unpublished estimates. Analyzed by the National Center for Health Statistics.
79.5 81.0
54.2
81.8
20
40
60
80
100
UninsuredPublicPrivateTotal
*Based on the question, "During the past 12 months did [child's name] receive a well-child checkup – that is, ageneral checkup when [he/she] was not sick or injured?"
Suggested CitationU.S. Department of Health and Human Services, Health Resources and Services Administration, Maternal and Child Health Bureau. Child Health USA 2014. Rockville, Maryland: U.S. Department of Health and Human Services, 2015. Online at http://mchb.hrsa.gov/chusa14/
85Child Health USA 2014 Health Services Financing and Utilization
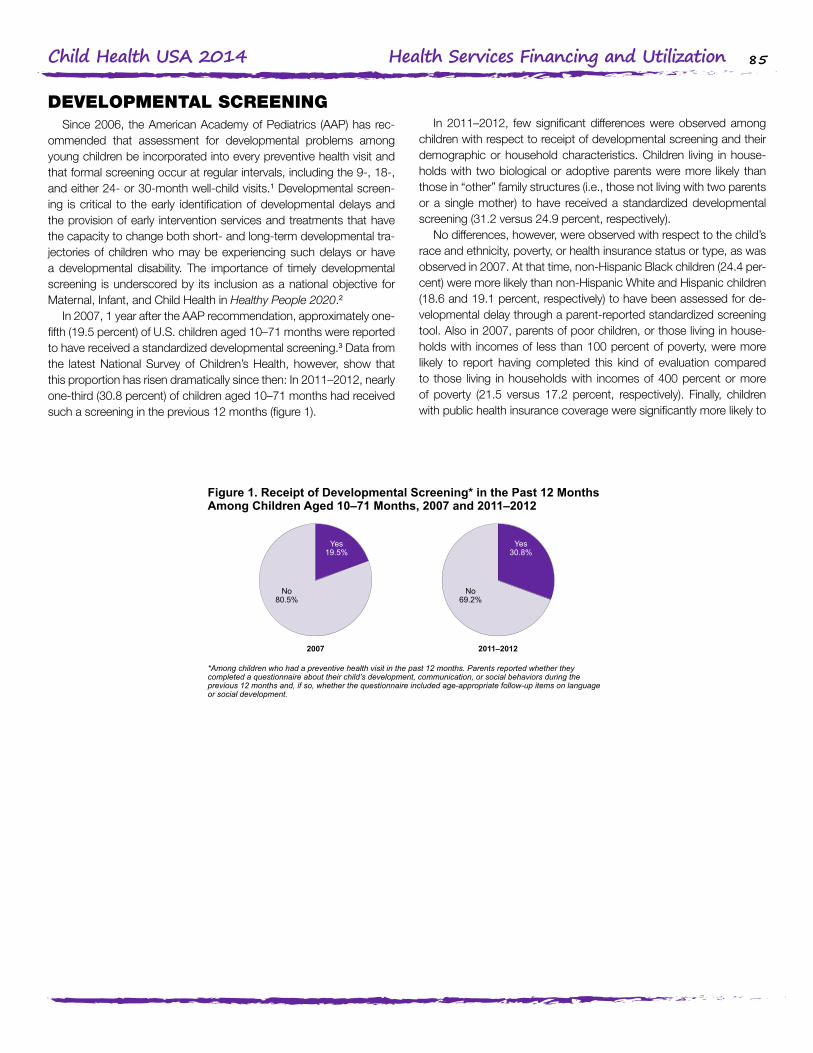
DEVELOPMENTAL SCREENINGSince 2006, the American Academy of Pediatrics (AAP) has rec-
ommended that assessment for developmental problems among young children be incorporated into every preventive health visit and that formal screening occur at regular intervals, including the 9-, 18-, and either 24- or 30-month well-child visits.1 Developmental screen-ing is critical to the early identification of developmental delays and the provision of early intervention services and treatments that have the capacity to change both short- and long-term developmental tra-jectories of children who may be experiencing such delays or have a developmental disability. The importance of timely developmental screening is underscored by its inclusion as a national objective for Maternal, Infant, and Child Health in Healthy People 2020.2
In 2007, 1 year after the AAP recommendation, approximately one-fifth (19.5 percent) of U.S. children aged 10–71 months were reported to have received a standardized developmental screening.3 Data from the latest National Survey of Children’s Health, however, show that this proportion has risen dramatically since then: In 2011–2012, nearly one-third (30.8 percent) of children aged 10–71 months had received such a screening in the previous 12 months (figure 1).
In 2011–2012, few significant differences were observed among children with respect to receipt of developmental screening and their demographic or household characteristics. Children living in house-holds with two biological or adoptive parents were more likely than those in “other” family structures (i.e., those not living with two parents or a single mother) to have received a standardized developmental screening (31.2 versus 24.9 percent, respectively).
No differences, however, were observed with respect to the child’s race and ethnicity, poverty, or health insurance status or type, as was observed in 2007. At that time, non-Hispanic Black children (24.4 per-cent) were more likely than non-Hispanic White and Hispanic children (18.6 and 19.1 percent, respectively) to have been assessed for de-velopmental delay through a parent-reported standardized screening tool. Also in 2007, parents of poor children, or those living in house-holds with incomes of less than 100 percent of poverty, were more likely to report having completed this kind of evaluation compared to those living in households with incomes of 400 percent or more of poverty (21.5 versus 17.2 percent, respectively). Finally, children with public health insurance coverage were significantly more likely to
Figure 1. Receipt of Developmental Screening* in the Past 12 MonthsAmong Children Aged 10–71 Months, 2007 and 2011–2012
Source: U.S. Department of Health and Human Services, Health Resources and Services Administration,Maternal and Child Health Bureau; and U.S. Department of Health and Human Services, Centers for DiseaseControl and Prevention, National Center for Health Statistics, National Survey of Children’s Health. Analyzed bythe Health Resources and Services Administration’s Maternal and Child Health Bureau.
*Among children who had a preventive health visit in the past 12 months. Parents reported whether theycompleted a questionnaire about their child’s development, communication, or social behaviors during theprevious 12 months and, if so, whether the questionnaire included age-appropriate follow-up items on languageor social development.
2011–20122007
Yes19.5%
Yes30.8%
No80.5%
No69.2%

86Child Health USA 2014 Health Services Financing and Utilization
have been screened for developmental delay in 2007 (23.7 percent) than either those with private coverage (17.8 percent) or no coverage (14.8 percent); no significant difference in the rate of screening was observed at that time between those with private coverage and those without any coverage at the time of the survey (figure 2).
The overall increase in the rate of developmental screening and the reduction in some disparities in the receipt of this type of eval-uation suggests that efforts such as those by the AAP and Healthy People may be raising awareness of the importance of developmental
screening. Additional analyses of data from the 2007 National Survey of Children’s Health indicates that health care providers may also be using informal means to inquire about parents’ and caregivers’ con-cerns regarding their children’s development. Such approaches, while potentially important to parent-provider relationships, should not be viewed as a substitute for screening using a standardized tool.4 Much work remains to be done, with less than one-third of children receiving this important preventive service in 2011–2012.
Data Sources Figure 1 and 2. U.S. Department of Health and Human Services, Health Resources and Services Administration, Maternal and Child Health Bureau; and U.S. Depart-ment of Health and Human Services, Centers for Disease Control and Prevention, National Center for Health Statistics, National Survey of Children’s Health. Analyzed by the Health Resources and Services Administration’s Maternal and Child Health Bureau.
Endnotes1. American Academy of Pediatrics, Council on Children With Disabilities, Section on Developmental and Behavioral Pediatrics, Bright Futures Steering Committee and
Medical Home Initiatives for Children With Special Needs. Identifying infants and young children with developmental disorders in the medical home: an algorithm for developmental surveillance and screening. Pediatrics. 2006;118(1):405–420. Correction in Pediatrics. 2006;118(4):1808–1809.
2. U.S. Department of Health and Human Services. Health People 2020 Maternal, Infant, and Child Health Objective 20.1: Increase the proportion of children (aged 10–35 months) who have been screened for an Autism Spectrum Disorder (ASD) and other developmental delays. Available at: http://www.healthypeople.gov/2020/topics-objectives/topic/maternal-infant-and-child-health/objectives?topicId=26. Accessed September 12, 2014.
3. Bethell C, Reuland C, Schor E, Abrahms M, Halfon N. Rates of parent-centered developmental screening: disparities and links to services access. Pediatrics. July 2011;128(1):146–155.
4. Rice CE, Naarden Braun KV, Kogan MD, et al. Screening for developmental delays among young children—National Survey of Children’s Health, United States, 2007. MMWR Surveillance Summaries: Morbidity and Mortality Weekly Report. September 12, 2014;63:27–35.
Figure 2. Receipt of Developmental Screening* in the Past 12 MonthsAmong Children Aged 10–71 Months, by Health Insurance, 2007 and2011–12
8
16
24
32
40
UninsuredPublicPrivate
Per
cent
of C
hild
ren
24.5
14.8
30.7
17.8
23.7
31.5
2007 2011–2012
*Among children who had a preventive health visit in the past 12 months. Parents reported whether theycompleted a questionnaire about their child’s development, communication, or social behaviors during theprevious 12 months and, if so, whether the questionnaire included age-appropriate follow-up items on languageor social development.
Source: U.S. Department of Health and Human Services, Health Resources and Services Administration,Maternal and Child Health Bureau; and U.S. Department of Health and Human Services, Centers for DiseaseControl and Prevention, National Center for Health Statistics, National Survey of Children’s Health. Analyzed bythe Health Resources and Services Administration’s Maternal and Child Health Bureau.
Suggested CitationU.S. Department of Health and Human Services, Health Resources and Services Administration, Maternal and Child Health Bureau. Child Health USA 2014. Rockville, Maryland: U.S. Department of Health and Human Services, 2015. Online at http://mchb.hrsa.gov/chusa14/
87Child Health USA 2014 Health Services Financing and Utilization
MENTAL HEALTH TREATMENTMental disorders are the most common cause of disability and are
responsible for 25 percent of all years of life lost to disability and pre-mature mortality.1 Besides disability, untreated mental disorders may lead to unemployment, substance abuse, homelessness, incarcera-tion, and suicide, and cost the U.S. economy $100 billion a year. Early implementation of treatment accelerates recovery and reduces the impacts of mental disorders. Treatment can reduce symptoms and improve the quality of life.2
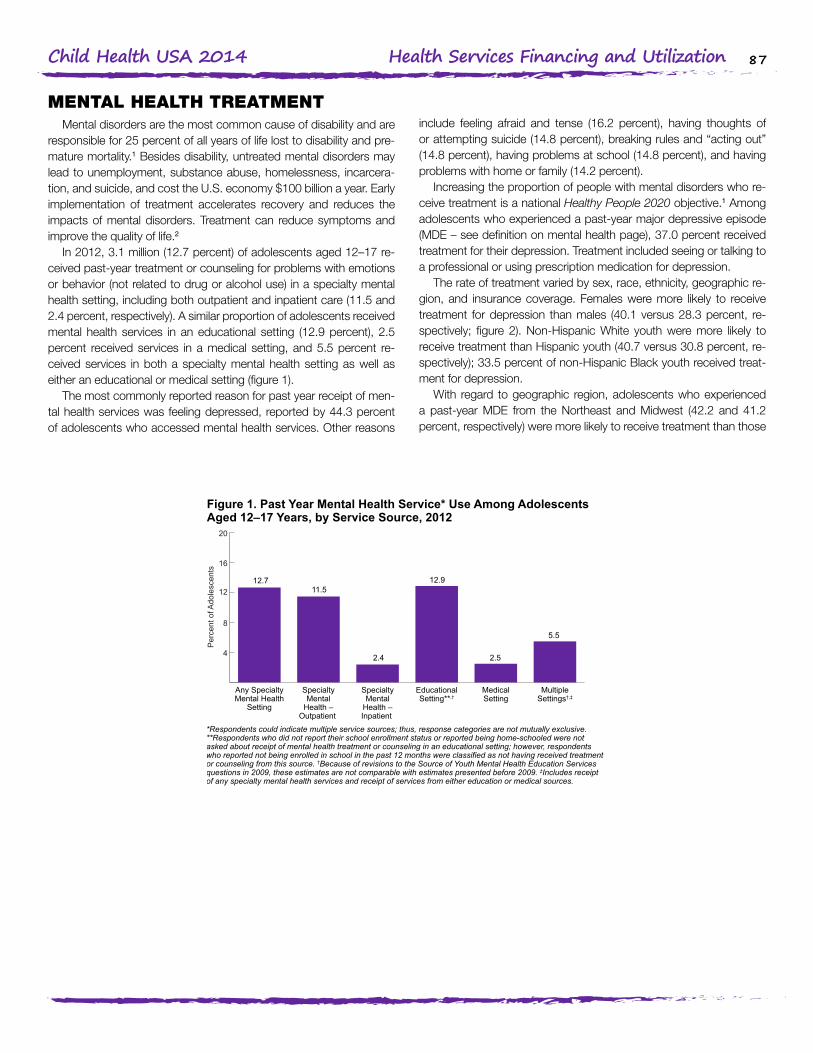
In 2012, 3.1 million (12.7 percent) of adolescents aged 12–17 re-ceived past-year treatment or counseling for problems with emotions or behavior (not related to drug or alcohol use) in a specialty mental health setting, including both outpatient and inpatient care (11.5 and 2.4 percent, respectively). A similar proportion of adolescents received mental health services in an educational setting (12.9 percent), 2.5 percent received services in a medical setting, and 5.5 percent re-ceived services in both a specialty mental health setting as well as either an educational or medical setting (figure 1).
The most commonly reported reason for past year receipt of men-tal health services was feeling depressed, reported by 44.3 percent of adolescents who accessed mental health services. Other reasons
include feeling afraid and tense (16.2 percent), having thoughts of or attempting suicide (14.8 percent), breaking rules and “acting out” (14.8 percent), having problems at school (14.8 percent), and having problems with home or family (14.2 percent).
Increasing the proportion of people with mental disorders who re-ceive treatment is a national Healthy People 2020 objective.1 Among adolescents who experienced a past-year major depressive episode (MDE – see definition on mental health page), 37.0 percent received treatment for their depression. Treatment included seeing or talking to a professional or using prescription medication for depression.
The rate of treatment varied by sex, race, ethnicity, geographic re-gion, and insurance coverage. Females were more likely to receive treatment for depression than males (40.1 versus 28.3 percent, re-spectively; figure 2). Non-Hispanic White youth were more likely to receive treatment than Hispanic youth (40.7 versus 30.8 percent, re-spectively); 33.5 percent of non-Hispanic Black youth received treat-ment for depression.
With regard to geographic region, adolescents who experienced a past-year MDE from the Northeast and Midwest (42.2 and 41.2 percent, respectively) were more likely to receive treatment than those
Figure 1. Past Year Mental Health Service* Use Among AdolescentsAged 12–17 Years, by Service Source, 2012
Per
cent
of A
dole
scen
ts
*Respondents could indicate multiple service sources; thus, response categories are not mutually exclusive.**Respondents who did not report their school enrollment status or reported being home-schooled were notasked about receipt of mental health treatment or counseling in an educational setting; however, respondentswho reported not being enrolled in school in the past 12 months were classified as not having received treatmentor counseling from this source. †Because of revisions to the Source of Youth Mental Health Education Servicesquestions in 2009, these estimates are not comparable with estimates presented before 2009. ‡Includes receiptof any specialty mental health services and receipt of services from either education or medical sources.
Source: Substance Abuse and Mental Health Services Administration. Results from the 2012 National Survey onDrug Use and Health: detailed tables, NSDUH Series H-46, HHS Publication No. (SMA) 13-4795. Rockville, MD:Substance Abuse and Mental Health Services Administration; 2013. Available at:http://www.samhsa.gov/data/nsduh/2012summnatfinddettables/dettabs/nsduh-dettabstoc2012.htm.Accessed April 18, 2014.
4
8
12
16
20
MultipleSettings†,‡
MedicalSetting
EducationalSetting**,†
SpecialtyMental
Health –Inpatient
SpecialtyMental
Health –Outpatient
Any SpecialtyMental Health
Setting
11.512.9
5.5
2.4
12.7
2.5

88Child Health USA 2014 Health Services Financing and Utilization
Figure 2. Receipt of Past Year Treatment* for Depression AmongAdolescents Aged 12–17 Years with Major Depressive Disorder(MDE)**, by Sex, 2012
Per
cent
of A
dole
scen
ts
*Treatment is defined as seeing or talking to a professional or using prescription medication for depression in thepast year. Respondents with unknown treatment data were excluded. **An MDE is defined as a period of at least2 weeks when a person experienced a depressed mood or loss of pleasure in daily activities and had a majorityof specific depression symptoms.
Source: Substance Abuse and Mental Health Services Administration. Results from the 2012 National Survey onDrug Use and Health: detailed tables, NSDUH Series H-46, HHS Publication No. (SMA) 13-4795. Rockville, MD:Substance Abuse and Mental Health Services Administration; 2013. Available at:http://www.samhsa.gov/data/nsduh/2012summnatfinddettables/dettabs/nsduh-dettabstoc2012.htm.Accessed April 18, 2014.
40.1
28.3
37.0
10
20
30
40
50
Females MalesTotal
from the South and West (34.1 and 34.9 percent, respectively). Ado-lescents with no insurance coverage (23.0 percent) were less likely to receive treatment for their depression compared to adolescents with Medicaid/Children’s Health Insurance Program or private coverage (36.9 and 38.1 percent, respectively).
Some barriers to treatment for mental disorders include discrimina-tion and prejudice and accessibility. Discrimination and prejudice may cause individuals to avoid talking about their illness with friends and
family and inhibit receipt of care.3 Individuals may fear that symptoms will not be taken seriously, especially those of adolescents that may be mistaken for puberty instead of a mental disorder.4 The Mental Health Parity Act under the Affordable Care Act requires health insurance to cover mental and physical health equally.5 The expansion of cover-age includes preventive services, such as behavioral assessments for children, free of charge and insurance companies no longer being al-lowed to deny coverage or charge more for mental disorders.6
Data SourcesFigure 1 and 2. Substance Abuse and Mental Health Services Administration. Results from the 2012 National Survey on Drug Use and Health: detailed tables, NSDUH Series H-46, HHS Publication No. (SMA) 13-4795. Rockville, MD: Substance Abuse and Mental Health Services Administration; 2013. Available at: http://www.samh-sa.gov/data/nsduh/2012summnatfinddettables/dettabs/nsduh-dettabstoc2012.htm. Accessed April 18, 2014.
Endnotes1. U.S. Department of Health and Human Services. Healthy People 2020 topics & objectives: mental health and mental disorders. Available at: http://healthypeople.
gov/2020/topicsobjectives2020/objectiveslist.aspx?topicId=28. Accessed April 22, 2014.
2. National Alliance on Mental Illness. What is mental illness: mental illness facts. Available at: http://www.nami.org/template.cfm?section=about_mental_illness. Ac-cessed April 22, 2014.
3. U.S. Department of Health and Human Services, Office of Adolescent Health. Adolescent health topics: mental health. Available at: http://www.hhs.gov/ash/oah/ado-lescent-health-topics/mental-health/home.html. Accessed April 22, 2014.
4. National Institutes of Health, National Institute of Mental Health. Depression. Available at: http://www.nimh.nih.gov/health/topics/depression/index.shtml. Accessed April 22, 2014.
5. American Psychological Association. Mental Health Parity and Addiction Equity Act. Available at: http://www.apa.org/helpcenter/parity-law.aspx. Accessed April 22, 2014.
6. U.S. Department of Health and Human Services. MentalHealth.gov. Available at: http://www.mentalhealth.gov/get-help/health-insurance/. Accessed April 22, 2014.
Suggested CitationU.S. Department of Health and Human Services, Health Resources and Services Administration, Maternal and Child Health Bureau. Child Health USA 2014. Rockville, Maryland: U.S. Department of Health and Human Services, 2015. Online at http://mchb.hrsa.gov/chusa14/

89Child Health USA 2014 Health Services Financing and Utilization
DENTAL CARETooth decay (dental caries) is a bacterial infection of the tooth and
is estimated to be the most common chronic infectious disease in children in the United States.1,2 The Centers for Disease Control and Prevention estimates that more than one-quarter of children aged 2–5 years and half of youth aged 12–15 years are affected by tooth decay.3 Untreated tooth decay causes pain and infection, which may affect a child’s ability to eat, speak, play, and learn. Tooth decay is preventable with proper dental care, including cleaning, brushing, and flossing, sealant application, and fluoride treatment. The American Academy of Pediatric Dentistry recommends that children have their first dental visit shortly after the eruption of their first tooth and no later than their first birthday, with two dental checkups per year thereafter.2
Approximately 65 percent of children aged 2–17 years received dental care in the past 6 months in 2012, as determined from pa-rental report. Receipt of dental care at recommended intervals varied by age, race and ethnicity, poverty status, and insurance status and type. Children aged 5–11 years and 12–17 years were more likely to have received dental care in the past 6 months than those aged 2–4 years (70.3 and 68.0 percent compared to 45.3 percent, respective-
ly). With respect to race and ethnicity, non-Hispanic American Indian/Alaska Native children were most likely to have had a dental visit in the past 6 months (78.0 percent) compared to 61–68 percent of children from other racial and ethnic groups. Children living in households with incomes of less than 100 percent and 100–199 percent of poverty were less likely than children living in households with incomes of 200 percent or more of poverty to have received dental care in the past 6 months (56.9 and 59.1 percent, respectively, versus 70.1 percent; figure 1). Uninsured children were about half as likely to have received a dental visit in the past 6 months (34.9 percent) as those with public or private insurance (62.5 and 70.2 percent, respectively).
In 2012, parents of 5.5 percent or 4 million children reported that their child did not receive needed dental care due to cost. The rates of unmet dental need due to cost increased with age and were lowest among children aged 2–4 years (2.8 percent), but rose substantially for those aged 5–11 years and 12–17 years (4.9 and 7.6 percent, respectively). Similar to receipt of dental care, children living in house-holds with incomes of less than 100 percent and 100–199 percent of poverty were approximately twice as likely to have unmet needs as
Figure 1. Time Since Last Dental Visit* Among Children Aged 2–17Years, by Poverty Status,** 2012
Percent of Children
Less Than6 Months
Between6 Monthsand 1 Year
Between1 and2 Years
Between2 and5 Years
MoreThan5 Years
*All estimates are age adjusted and may not total 100 due to rounding. **The U.S. Census Bureau weightedaverage poverty threshold for a family of four was $23,492 in 2012.
Source: Bloom B, Jones LI, Freeman G. Summary health statistics for U.S. children: National Health InterviewSurvey, 2012. National Center for Health Statistics. Vital Health Statistics. 2013;10(258).
20 40 60 80 100
200%or More
of Poverty
100–199%of Poverty
Less Than100%
of Poverty
Total 9.1
10.0
10.5
8.4
2.1
3.1
2.5
1.6
6.3
10.0
8.2
4.3
17.5
20.0
19.7
15.5
64.9
56.9
59.1
70.1

90Child Health USA 2014 Health Services Financing and Utilization
Figure 2. Unmet Dental Need* in the Past Year Among Children Aged2–17 Years, by Type of Health Insurance,** 2012
Per
cent
of C
hild
ren
5.53.8
5.4
21.1
*Based on parent report that services were needed but not affordable; all estimates are age adjusted. **Refers togeneral health insurance and not single service coverage, such as dental insurance. Private coverage includespersons with any private insurance, either alone or in combination with public coverage; Public includes thosecovered only by government programs such as Medicaid, Medicare, military plans, and state-sponsoredhealth plans.
Source: Bloom B, Jones LI, Freeman G. Summary health statistics for U.S. children: National Health InterviewSurvey, 2012. National Center for Health Statistics. Vital Health Statistics. 2013;10(258).
5
10
15
20
25
UninsuredPublicPrivateTotal
children living in households with higher incomes (7.2 and 8.4 percent compared to 3.8 percent, respectively). The proportion of children with unmet needs was much higher among those who were uninsured (21.1 percent) compared to those with either public (5.4 percent) or private (3.8 percent) health insurance (figure 2).
Limited access to oral health care and dental insurance coverage contribute to poor oral health.4 The Early Periodic Screening, Diagno-sis, and Treatment (EPSDT) Program and Federally Qualified Health Centers (FQHCs) work to address such barriers. The EPSDT Program is the section of Medicaid that addresses child health, requiring dental services including appropriate screening, diagnostic, and treatment.5
Additionally, the Affordable Care Act will expand coverage and include child oral health care as a required health benefit.6 Healthy People 2020 oral health objectives aim to “increase the proportion of [FQHCs] that have an oral health care program” and “increase the proportion of patients who receive oral health services at [FQHCs] each year.”7 All FQHCs must provide preventive services, regardless of the ability to pay. Community programs such as school based sealant programs and community water fluoridation are another way to deliver effective preventive interventions to children who may lack access to dental care.8
Data SourcesFigure 1 and 2. Bloom B, Jones LI, Freeman G. Summary health statistics for U.S. children: National Health Interview Survey, 2012. National Center for Health Statistics. Vital Health Statistics. 2013;10(258).
Endnotes1. Centers for Disease Control and Prevention, Division of Oral Health. Children’s oral health. Available at: http://www.cdc.gov/oralhealth/children_adults/child.htm.
Accessed April 29, 2014.
2. American Academy of Pediatric Dentistry. Health care providers brochures: the pediatric dentist. Available at: http://www.aapd.org/publications/brochures/. Accessed April 29, 2014.
3. Centers for Disease Control and Prevention, Division of Oral Health. Oral health: preventing cavities, gum disease, tooth loss, and oral cancers at a glance 2011. Avail-able at: http://www.cdc.gov/chronicdisease/resources/publications/aag/doh.htm. Accessed April 29, 2014.
4. Institute of Medicine. Advancing oral health in America. Report brief. 2011. Available at: http://www.iom.edu/reports/2011/advancing-oral-health-in-america.aspx. Accessed May 2, 2014.
5. U.S. Department of Health and Human Services, Health Resources and Services Administration, Maternal and Child Health Bureau. EPSDT overview. Available at: http://mchb.hrsa.gov/epsdt/overview.html. Accessed May 2, 2014.
6. Henry J. Kaiser Family Foundation, Kaiser Commission on Medicaid and the Uninsured. Children and oral health: accessing needs, coverage, and access. Available at: http://kaiserfamilyfoundation.files.wordpress.com/2013/01/7681-04.pdf. Accessed May 6, 2014.
7. U.S. Department of Health and Human Services. Healthy People 2020 topics & objectives: oral health. Available at: http://healthypeople.gov/2020/topicsobjec-tives2020/overview.aspx?topicid=32. Accessed April 29, 2014.
8. Jones E, Shi L, Hayashi AS, Sharma R, Daly C, Metzger QN. Access to oral health care: the role of Federally Qualified Health Centers in addressing disparities and expanding access. American Journal of Public Health. 2013;103(3):488–493.
Suggested CitationU.S. Department of Health and Human Services, Health Resources and Services Administration, Maternal and Child Health Bureau. Child Health USA 2014. Rockville, Maryland: U.S. Department of Health and Human Services, 2015. Online at http://mchb.hrsa.gov/chusa14/

91Child Health USA 2014 Health Services Financing and Utilization
USUAL SOURCE OF CAREAn indicator of access to health care is having a usual source of
care.1 A usual source of care is “a place where [children go] when sick, such as a physician’s office or health center but not an emergency department.”2 A Healthy People 2020 objective for access to health services is to “increase the proportion of children and youth aged 17 years and under who have a specific source of ongoing care.”3 People with a usual source of care are more likely to receive preventive health services, have better health outcomes, and have fewer disparities and costs than those without a usual source of care.1,3,4
A majority of children under 18 years of age (96.2 percent) had a usual source of care in 2012. Having a usual source of care varied by age, poverty status, and insurance type. The proportion of children who had a usual source of care decreased with age: 97.9 percent of children aged 0–4 years, 96.6 percent of those aged 5–11 years, and 94.4 percent of children aged 12–17 years. The percentage of children with a usual source of care was greater for those living in households with incomes of 200 percent or more of poverty (97.3 per-
cent) than for children living in households with incomes less than 100 percent and 100–199 percent of poverty (94.8 and 95.2 percent, re-spectively). Uninsured children were less likely to have a usual source of care, compared to children with public or private health insurance (73.2 versus 97.5 and 98.2 percent, respectively; figure 1).
Among children with a usual source of care in 2012, 74.2 percent of children used a doctor’s office; 23.9 percent used a clinic; and 1.9 percent used the hospital and other places, including emergency rooms and hospital outpatient departments. Usual source of care location varied by race and ethnicity, poverty status, and insurance type. American Indian/Alaska Native and Hispanic children (46.9 and 38.4, respectively) were more likely to use clinics as a usual source of care than multiple-race, non-Hispanic Black, and Asian children (24.4, 24.4, and 22.4 percent, respectively). Non-Hispanic White children (17.2 percent) were the least likely to use clinics as a usual source of care.
Figure 1. Usual Source of Care* Among Children Under Age 18, byHealth Insurance Type, 2012
Percent of Children*Has a place where the child is usually taken when sick or in need of health advice. All estimates are ageadjusted and may not total 100 due to rounding.
Source: Bloom B, Jones Li, Freeman G. Summary health statistics for U.S. children: National Health InterviewSurvey, 2012. National Center for Health Statistics. Vital Health Statistics. 2013;10(258). Available at:http://www.cdc.gov/nchs/data/series/sr_10/sr10_258.pdf. Accessed May 2, 2014.
Usual Source of Care No Usual Source of Care
20 40 60 80 100
Uninsured
Public
Private
Total 96.2
98.2
97.5
73.2
3.8
1.8
2.5
26.8
92Child Health USA 2014 Health Services Financing and Utilization
Figure 2. Location of Usual Source of Care* Among Children UnderAge 18, by Poverty Status,** 2012
20
40
60
80
100
200% or Moreof Poverty
100–199%of Poverty
Less Than100% of Poverty
Total
Per
cent
of C
hild
ren
36.9
2.7 2.4
30.5
60.3
1.9
74.2
23.9
1.2
83.1
15.6
67.2
Doctor’s Office Clinic
Hospital or Other Place†
Source: Bloom B, Jones Li, Freeman G. Summary health statistics for U.S. children: National Health InterviewSurvey, 2012. National Center for Health Statistics. Vital Health Statistics. 2013;10(258). Available at:http://www.cdc.gov/nchs/data/series/sr_10/sr10_258.pdf. Accessed May 2, 2014.
*Has a place where the child is usually taken when sick or in need of health advice. All estimates are ageadjusted and may not total 100 due to rounding. **The U.S. Census Bureau weighted average poverty thresholdfor a family of four was $23,492 in 2012. †Includes “emergency room,” “hospital outpatient department,”“some other place,” and “not using one place most often.”
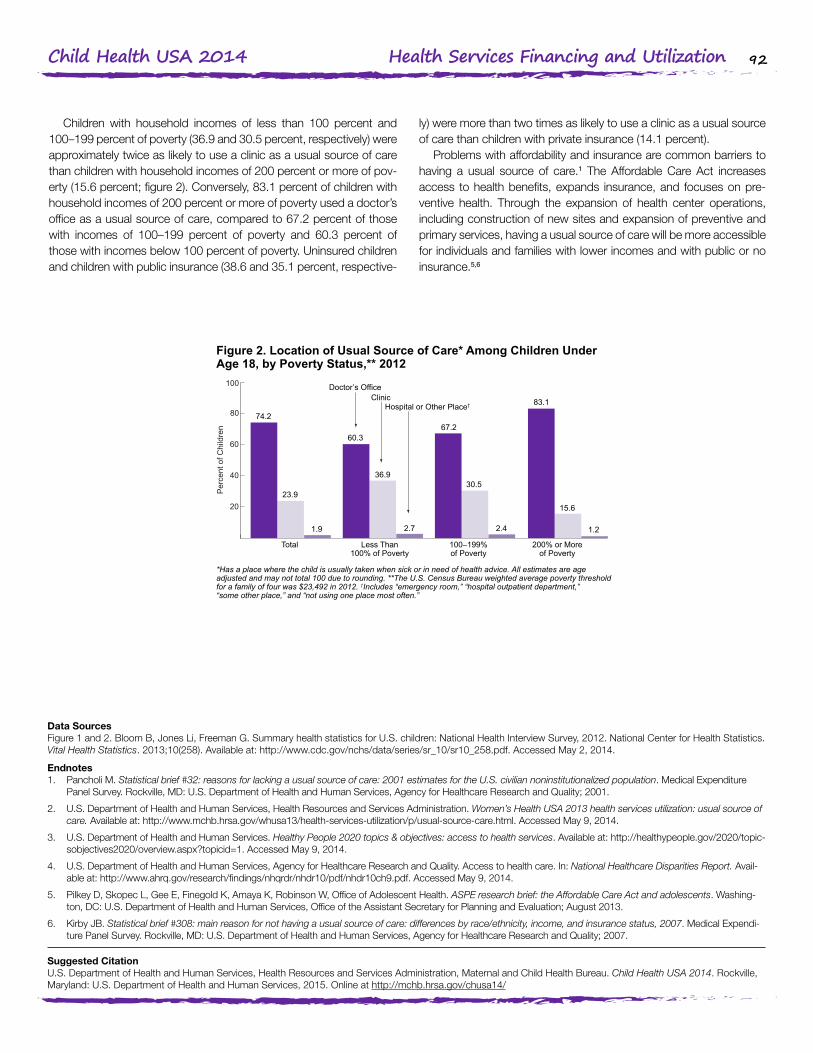
Children with household incomes of less than 100 percent and 100–199 percent of poverty (36.9 and 30.5 percent, respectively) were approximately twice as likely to use a clinic as a usual source of care than children with household incomes of 200 percent or more of pov-erty (15.6 percent; figure 2). Conversely, 83.1 percent of children with household incomes of 200 percent or more of poverty used a doctor’s office as a usual source of care, compared to 67.2 percent of those with incomes of 100–199 percent of poverty and 60.3 percent of those with incomes below 100 percent of poverty. Uninsured children and children with public insurance (38.6 and 35.1 percent, respective-
ly) were more than two times as likely to use a clinic as a usual source of care than children with private insurance (14.1 percent).
Problems with affordability and insurance are common barriers to having a usual source of care.1 The Affordable Care Act increases access to health benefits, expands insurance, and focuses on pre-ventive health. Through the expansion of health center operations, including construction of new sites and expansion of preventive and primary services, having a usual source of care will be more accessible for individuals and families with lower incomes and with public or no insurance.5,6
Data SourcesFigure 1 and 2. Bloom B, Jones Li, Freeman G. Summary health statistics for U.S. children: National Health Interview Survey, 2012. National Center for Health Statistics. Vital Health Statistics. 2013;10(258). Available at: http://www.cdc.gov/nchs/data/series/sr_10/sr10_258.pdf. Accessed May 2, 2014.
Endnotes1. Pancholi M. Statistical brief #32: reasons for lacking a usual source of care: 2001 estimates for the U.S. civilian noninstitutionalized population. Medical Expenditure
Panel Survey. Rockville, MD: U.S. Department of Health and Human Services, Agency for Healthcare Research and Quality; 2001.
2. U.S. Department of Health and Human Services, Health Resources and Services Administration. Women’s Health USA 2013 health services utilization: usual source of care. Available at: http://www.mchb.hrsa.gov/whusa13/health-services-utilization/p/usual-source-care.html. Accessed May 9, 2014.
3. U.S. Department of Health and Human Services. Healthy People 2020 topics & objectives: access to health services. Available at: http://healthypeople.gov/2020/topic-sobjectives2020/overview.aspx?topicid=1. Accessed May 9, 2014.
4. U.S. Department of Health and Human Services, Agency for Healthcare Research and Quality. Access to health care. In: National Healthcare Disparities Report. Avail-able at: http://www.ahrq.gov/research/findings/nhqrdr/nhdr10/pdf/nhdr10ch9.pdf. Accessed May 9, 2014.
5. Pilkey D, Skopec L, Gee E, Finegold K, Amaya K, Robinson W, Office of Adolescent Health. ASPE research brief: the Affordable Care Act and adolescents. Washing-ton, DC: U.S. Department of Health and Human Services, Office of the Assistant Secretary for Planning and Evaluation; August 2013.
6. Kirby JB. Statistical brief #308: main reason for not having a usual source of care: differences by race/ethnicity, income, and insurance status, 2007. Medical Expendi-ture Panel Survey. Rockville, MD: U.S. Department of Health and Human Services, Agency for Healthcare Research and Quality; 2007.
Suggested CitationU.S. Department of Health and Human Services, Health Resources and Services Administration, Maternal and Child Health Bureau. Child Health USA 2014. Rockville, Maryland: U.S. Department of Health and Human Services, 2015. Online at http://mchb.hrsa.gov/chusa14/
93Child Health USA 2014 Health Services Financing and Utilization
MEDICAL HOMEThe National Center for Medical Home Implementation defines a
medical home as “an approach to providing comprehensive prima-ry care” rather than a physical space or service.1 According to the American Academy of Pediatrics, primary care should be accessible, continuous, comprehensive, family centered, coordinated, compas-sionate, and culturally effective. The Maternal and Child Health Bureau has operationalized this concept for children using five criteria: (1) hav-ing a personal doctor or nurse, (2) having a usual source for sick and well care, (3) receipt of family-centered care, (4) no problems getting needed referrals, and (5) receipt of effective care coordination when needed.2 Individuals with a medical home may experience “improved health outcomes, reduced emergency room visits, and better com-munication [with pediatric health providers].”3
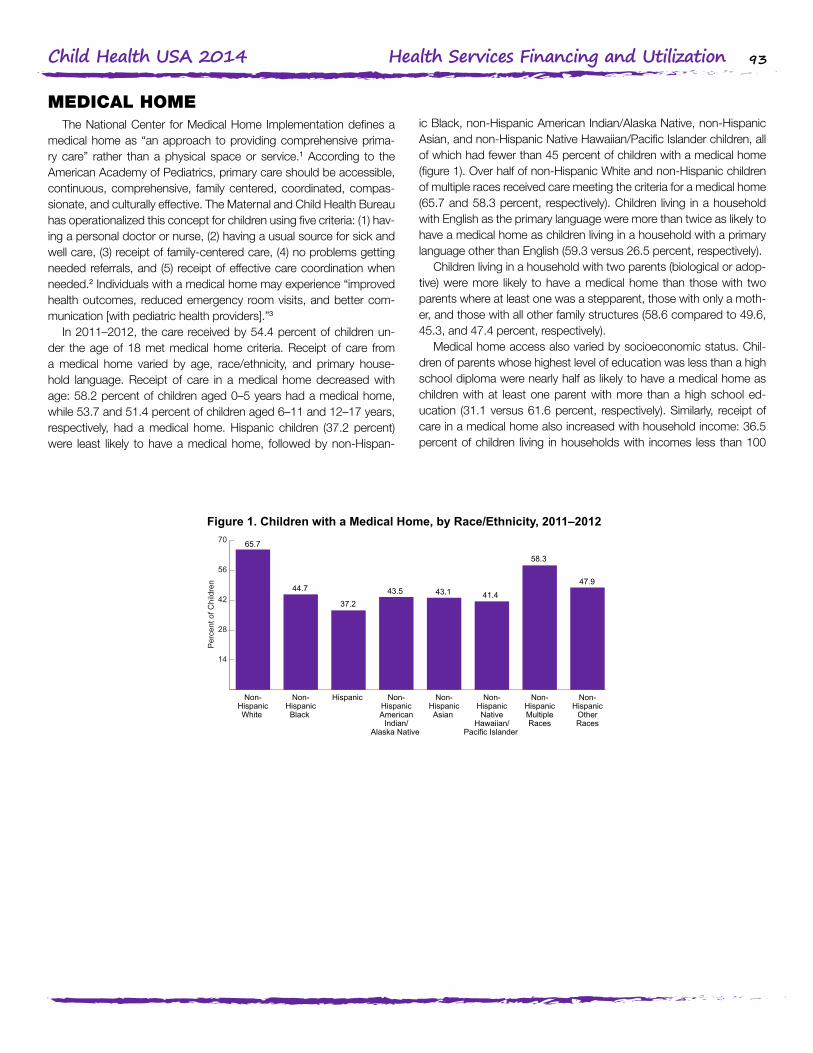
In 2011–2012, the care received by 54.4 percent of children un-der the age of 18 met medical home criteria. Receipt of care from a medical home varied by age, race/ethnicity, and primary house-hold language. Receipt of care in a medical home decreased with age: 58.2 percent of children aged 0–5 years had a medical home, while 53.7 and 51.4 percent of children aged 6–11 and 12–17 years, respectively, had a medical home. Hispanic children (37.2 percent) were least likely to have a medical home, followed by non-Hispan-
ic Black, non-Hispanic American Indian/Alaska Native, non-Hispanic Asian, and non-Hispanic Native Hawaiian/Pacific Islander children, all of which had fewer than 45 percent of children with a medical home (figure 1). Over half of non-Hispanic White and non-Hispanic children of multiple races received care meeting the criteria for a medical home (65.7 and 58.3 percent, respectively). Children living in a household with English as the primary language were more than twice as likely to have a medical home as children living in a household with a primary language other than English (59.3 versus 26.5 percent, respectively).
Children living in a household with two parents (biological or adop-tive) were more likely to have a medical home than those with two parents where at least one was a stepparent, those with only a moth-er, and those with all other family structures (58.6 compared to 49.6, 45.3, and 47.4 percent, respectively).
Medical home access also varied by socioeconomic status. Chil-dren of parents whose highest level of education was less than a high school diploma were nearly half as likely to have a medical home as children with at least one parent with more than a high school ed-ucation (31.1 versus 61.6 percent, respectively). Similarly, receipt of care in a medical home also increased with household income: 36.5 percent of children living in households with incomes less than 100
Figure 1. Children with a Medical Home, by Race/Ethnicity, 2011–2012
Per
cent
of C
hild
ren
14
28
42
56
70
Non-Hispanic
OtherRaces
Non-HispanicMultipleRaces
Non-HispanicNative
Hawaiian/Pacific Islander
Non-HispanicAsian
Non-HispanicAmerican
Indian/Alaska Native
Hispanic Non-HispanicBlack
Non-HispanicWhite
44.7 43.5 41.437.2
65.7
58.3
47.943.1
Source: Health Resources and Services Administration, Maternal and Child Health Bureau and Centers forDisease Control and Prevention, National Center for Health Statistics, National Survey of Children’s Health.Analyzed by the Health Resources and Services Administration’s Maternal and Child Health Bureau.

94Child Health USA 2014 Health Services Financing and Utilization
Figure 2. Children with a Medical Home, by Health Insurance Statusand Type, 2011–2012
Per
cent
of C
hild
ren
Source: Health Resources and Services Administration, Maternal and Child Health Bureau and Centers forDisease Control and Prevention, National Center for Health Statistics, National Survey of Children’s Health.Analyzed by the Health Resources and Services Administration’s Maternal and Child Health Bureau.
27.8
43.9
64.0
14
28
42
56
70
UninsuredPublicInsurance
PrivateInsurance
percent of poverty had a medical home compared to 67.8 percent of children living in households with incomes of 400 percent or more of poverty. Uninsured children were less likely to receive care from a medical home than children with public and private insurance (27.8 versus 43.9 and 64.0 percent, respectively; figure 2).
Barriers to having a medical home include personnel constraints, clinical practice patterns, and economic or social forces.2 As an in-
creasing number of community health centers seek recognition as patient-centered medical homes, the National Association of Com-munity Health Centers predicts that an additional 20 million Americans will have medical homes. Primary care practices are also increasingly seeking accreditation as medical homes. The Affordable Care Act au-thorized funding to establish community-based health teams to sup-port these practices.4,5
Data SourcesFigure 1 and 2. Health Resources and Services Administration, Maternal and Child Health Bureau and Centers for Disease Control and Prevention, National Center for Health Statistics, National Survey of Children’s Health. Analyzed by the Health Resources and Services Administration’s Maternal and Child Health Bureau.
Endnotes1. American Academy of Pediatrics, National Center for Medical Home Implementation. What is a family-centered medical home?. Available at: http://www.medicalho-
meinfo.org/. Accessed May 20, 2014.
2. Medical Home Initiatives for Children With Special Needs Project Advisory Committee. The medical home. Pediatrics. 2002;110(1):184–186.
3. U.S. Department of Health and Human Services, Health Resources and Services Administration, Maternal and Child Health Bureau. Implementation of the Medical Home Program. Available at: http://www.mchb.hrsa.gov/programs/medicalhome/index.html. Accessed May 20, 2014.
4. Association of Maternal and Child Health Programs. Health reform: what’s in it to promote the medical home?. Available at: http://www.amchp.org/policy-advocacy/health-reform/documents/medical-homes-aca-fact-sheet.pdf. Accessed May 20, 2014.
5. National Conference of State Legislature. The medical home model of care. Available at: http://www.ncsl.org/research/health/the-medical-home-model-of-care.aspx. Accessed May 20, 2014.
Suggested CitationU.S. Department of Health and Human Services, Health Resources and Services Administration, Maternal and Child Health Bureau. Child Health USA 2014. Rockville, Maryland: U.S. Department of Health and Human Services, 2015. Online at http://mchb.hrsa.gov/chusa14/
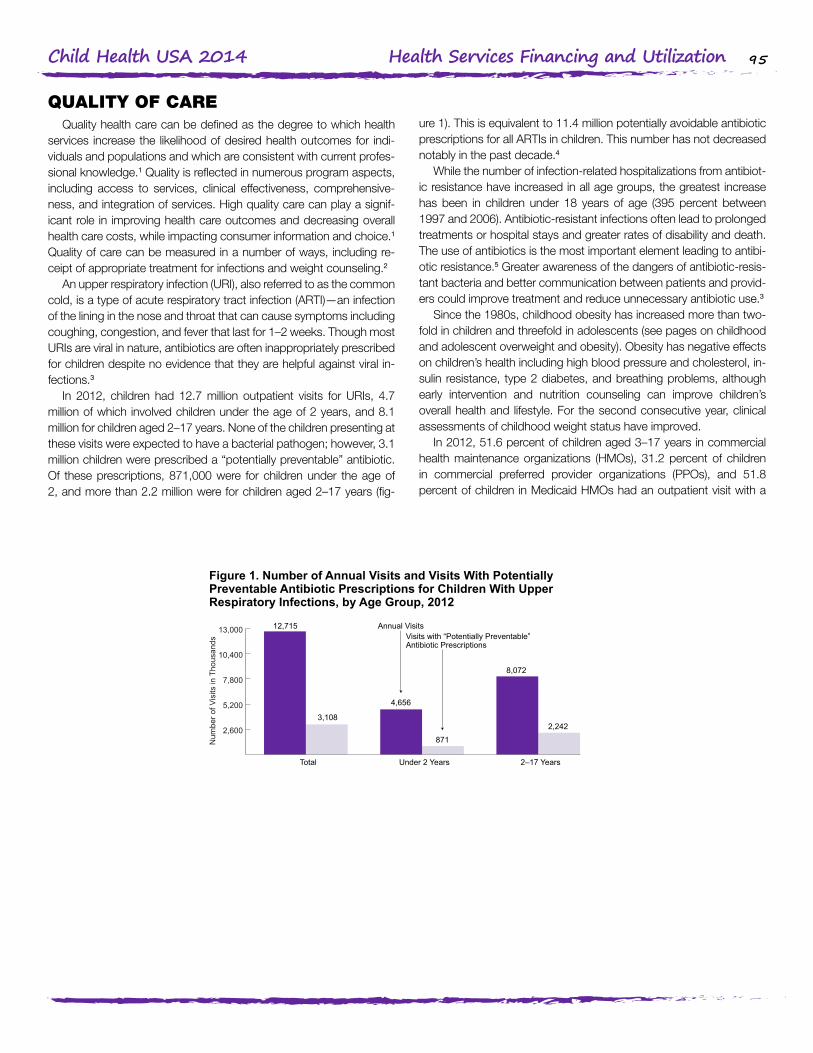
95Child Health USA 2014 Health Services Financing and Utilization
QUALITY OF CAREQuality health care can be defined as the degree to which health
services increase the likelihood of desired health outcomes for indi-viduals and populations and which are consistent with current profes-sional knowledge.1 Quality is reflected in numerous program aspects, including access to services, clinical effectiveness, comprehensive-ness, and integration of services. High quality care can play a signif-icant role in improving health care outcomes and decreasing overall health care costs, while impacting consumer information and choice.1 Quality of care can be measured in a number of ways, including re-ceipt of appropriate treatment for infections and weight counseling.2
An upper respiratory infection (URI), also referred to as the common cold, is a type of acute respiratory tract infection (ARTI)—an infection of the lining in the nose and throat that can cause symptoms including coughing, congestion, and fever that last for 1–2 weeks. Though most URIs are viral in nature, antibiotics are often inappropriately prescribed for children despite no evidence that they are helpful against viral in-fections.3
In 2012, children had 12.7 million outpatient visits for URIs, 4.7 million of which involved children under the age of 2 years, and 8.1 million for children aged 2–17 years. None of the children presenting at these visits were expected to have a bacterial pathogen; however, 3.1 million children were prescribed a “potentially preventable” antibiotic. Of these prescriptions, 871,000 were for children under the age of 2, and more than 2.2 million were for children aged 2–17 years (fig-
ure 1). This is equivalent to 11.4 million potentially avoidable antibiotic prescriptions for all ARTIs in children. This number has not decreased notably in the past decade.4
While the number of infection-related hospitalizations from antibiot-ic resistance have increased in all age groups, the greatest increase has been in children under 18 years of age (395 percent between 1997 and 2006). Antibiotic-resistant infections often lead to prolonged treatments or hospital stays and greater rates of disability and death. The use of antibiotics is the most important element leading to antibi-otic resistance.5 Greater awareness of the dangers of antibiotic-resis-tant bacteria and better communication between patients and provid-ers could improve treatment and reduce unnecessary antibiotic use.3
Since the 1980s, childhood obesity has increased more than two-fold in children and threefold in adolescents (see pages on childhood and adolescent overweight and obesity). Obesity has negative effects on children’s health including high blood pressure and cholesterol, in-sulin resistance, type 2 diabetes, and breathing problems, although early intervention and nutrition counseling can improve children’s overall health and lifestyle. For the second consecutive year, clinical assessments of childhood weight status have improved.
In 2012, 51.6 percent of children aged 3–17 years in commercial health maintenance organizations (HMOs), 31.2 percent of children in commercial preferred provider organizations (PPOs), and 51.8 percent of children in Medicaid HMOs had an outpatient visit with a
Figure 1. Number of Annual Visits and Visits With PotentiallyPreventable Antibiotic Prescriptions for Children With UpperRespiratory Infections, by Age Group, 2012
Source: Kronman MP, Zhou C, Mangione-Smith R. Bacterial prevalence and antimicrobial prescribing trends foracute respiratory tract infections. Pediatrics. September 15, 2014;134(4):e956–e965.
Num
ber o
f Vis
its in
Tho
usan
ds
2,600
5,200
7,800
10,400
13,000
2–17 YearsUnder 2 YearsTotal
Annual VisitsVisits with “Potentially Preventable”Antibiotic Prescriptions
12,715
871
8,072
2,2423,108
4,656
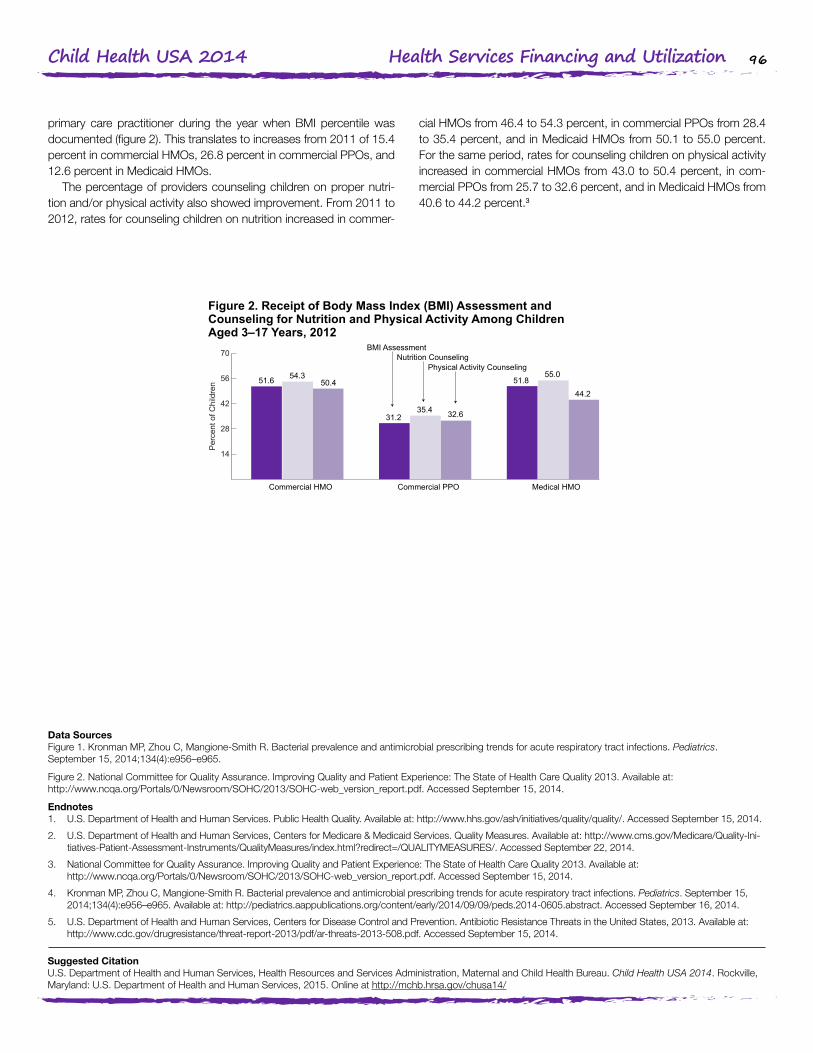
96Child Health USA 2014 Health Services Financing and Utilization
primary care practitioner during the year when BMI percentile was documented (figure 2). This translates to increases from 2011 of 15.4 percent in commercial HMOs, 26.8 percent in commercial PPOs, and 12.6 percent in Medicaid HMOs.
The percentage of providers counseling children on proper nutri-tion and/or physical activity also showed improvement. From 2011 to 2012, rates for counseling children on nutrition increased in commer-
cial HMOs from 46.4 to 54.3 percent, in commercial PPOs from 28.4 to 35.4 percent, and in Medicaid HMOs from 50.1 to 55.0 percent. For the same period, rates for counseling children on physical activity increased in commercial HMOs from 43.0 to 50.4 percent, in com-mercial PPOs from 25.7 to 32.6 percent, and in Medicaid HMOs from 40.6 to 44.2 percent.3
Figure 2. Receipt of Body Mass Index (BMI) Assessment andCounseling for Nutrition and Physical Activity Among ChildrenAged 3–17 Years, 2012
Source: National Committee for Quality Assurance. Improving Quality and Patient Experience: The State ofHealth Care Quality 2013. Available at:http://www.ncqa.org/Portals/0/Newsroom/SOHC/2013/SOHC-web_version_report.pdf.Accessed September 15, 2014.
Per
cent
of C
hild
ren
14
28
42
56
70
Medical HMOCommercial PPOCommercial HMO
BMI AssessmentNutrition Counseling
Physical Activity Counseling
51.6
31.235.4 32.6
51.8
44.2
55.054.350.4
Data SourcesFigure 1. Kronman MP, Zhou C, Mangione-Smith R. Bacterial prevalence and antimicrobial prescribing trends for acute respiratory tract infections. Pediatrics. September 15, 2014;134(4):e956–e965.
Figure 2. National Committee for Quality Assurance. Improving Quality and Patient Experience: The State of Health Care Quality 2013. Available at: http://www.ncqa.org/Portals/0/Newsroom/SOHC/2013/SOHC-web_version_report.pdf. Accessed September 15, 2014.
Endnotes1. U.S. Department of Health and Human Services. Public Health Quality. Available at: http://www.hhs.gov/ash/initiatives/quality/quality/. Accessed September 15, 2014.
2. U.S. Department of Health and Human Services, Centers for Medicare & Medicaid Services. Quality Measures. Available at: http://www.cms.gov/Medicare/Quality-Ini-tiatives-Patient-Assessment-Instruments/QualityMeasures/index.html?redirect=/QUALITYMEASURES/. Accessed September 22, 2014.
3. National Committee for Quality Assurance. Improving Quality and Patient Experience: The State of Health Care Quality 2013. Available at: http://www.ncqa.org/Portals/0/Newsroom/SOHC/2013/SOHC-web_version_report.pdf. Accessed September 15, 2014.
4. Kronman MP, Zhou C, Mangione-Smith R. Bacterial prevalence and antimicrobial prescribing trends for acute respiratory tract infections. Pediatrics. September 15, 2014;134(4):e956–e965. Available at: http://pediatrics.aappublications.org/content/early/2014/09/09/peds.2014-0605.abstract. Accessed September 16, 2014.
5. U.S. Department of Health and Human Services, Centers for Disease Control and Prevention. Antibiotic Resistance Threats in the United States, 2013. Available at: http://www.cdc.gov/drugresistance/threat-report-2013/pdf/ar-threats-2013-508.pdf. Accessed September 15, 2014.
Suggested CitationU.S. Department of Health and Human Services, Health Resources and Services Administration, Maternal and Child Health Bureau. Child Health USA 2014. Rockville, Maryland: U.S. Department of Health and Human Services, 2015. Online at http://mchb.hrsa.gov/chusa14/