health technology assessment (hta) of a national … of screening for atrial... · director of...
TRANSCRIPT

1
Health technology assessment (HTA)
of a national screening programme for
atrial fibrillation in primary care
06 August 2015

HTA of a national screening programme for atrial fibrillation in primary care
Health Information and Quality Authority
i
HTA of a national screening programme for atrial fibrillation in primary care
Health Information and Quality Authority
ii
About the Health Information and Quality Authority
The Health Information and Quality Authority (HIQA) is the independent Authority
established to drive continuous improvement in Ireland’s health and personal social
care services, monitor the safety and quality of these services and promote person-
centred care for the benefit of the public.
The Authority’s mandate to date extends across the quality and safety of the public,
private (within its social care function) and voluntary sectors. Reporting to the
Minister for Health and the Minister for Children and Youth Affairs, the Health
Information and Quality Authority has statutory responsibility for:
Setting Standards for Health and Social Services – Developing person-
centred standards, based on evidence and best international practice, for those
health and social care services in Ireland that by law are required to be regulated
by the Authority.
Supporting Improvement – Supporting health and social care services to
implement standards by providing education in quality improvement tools and
methodologies.
Social Services Inspectorate – Registering and inspecting residential centres
for dependent people and inspecting children detention schools, foster care
services and child protection services.
Monitoring Healthcare Quality and Safety – Monitoring the quality and
safety of health and personal social care services and investigating as necessary
serious concerns about the health and welfare of people who use these services.
Health Technology Assessment – Ensuring the best outcome for people who
use our health services and best use of resources by evaluating the clinical and
cost-effectiveness of drugs, equipment, diagnostic techniques and health
promotion activities.
Health Information – Advising on the efficient and secure collection and
sharing of health information, evaluating information resources and publishing
information about the delivery and performance of Ireland’s health and social
care services.

HTA of a national screening programme for atrial fibrillation in primary care
Health Information and Quality Authority
iii
Foreword
Atrial fibrillation (AF), the most common arrhythmia seen in general practice, is a
major cause of morbidity and mortality in Ireland. Not only is it associated with a
fivefold increase in the risk of stroke, but these strokes are more likely to be fatal
compared with non-AF strokes, and a greater proportion of survivors are left with
significant functional impairment. The overall burden of AF is increasing as our
population ages, making it ever more important that the arrhythmia is detected and
managed effectively to improve outcomes for patients and ensure the sustainability
of health services in Ireland. Screening for atrial fibrillation has been advocated as a
central component of efforts to reduce the burden of disease, by identifying those
who are unaware they have the condition but remain at increased risk of stroke.
However there is a high degree of uncertainty surrounding the impact of screening
on stroke outcomes and on the overall cost-effectiveness of different types of
screening programmes.
In this health technology assessment (HTA), we examine the long term implications
of opportunistic screening in primary care, using the best available evidence on the
effectiveness of screening and subsequent treatment, and the costs associated with
detection, treatment and long-term care. Our analysis benefits from the considerable
amount of research carried out previously on AF and stroke in Ireland, particularly
the work conducted by the Health Service Executive (HSE) National Clinical
Programme for Stroke, the North Dublin Stroke Study, the Cost of Stroke in Ireland
study, the Irish National Audit of Stroke Care (INASC) and The Irish Longitudinal
Study on Ageing (TILDA).
Work on the assessment was undertaken by an Evaluation Team from the HTA
Directorate of the Authority. A multidisciplinary Expert Advisory Group was convened
to advise the Authority during the conduct of this assessment.
The Authority would like to thank its Evaluation Team, the members of the Expert
Advisory Group and all who contributed to the preparation of this report.
Dr Máirín Ryan
Director of Health Technology Assessment & Acting Deputy Chief Executive Officer
Health Information and Quality Authority
HTA of a national screening programme for atrial fibrillation in primary care
Health Information and Quality Authority
iv
Table of Contents
Foreword ...................................................................................................... iii
Acknowledgements ..................................................................................... vii
List of Abbreviations .................................................................................... ix
Advice to the Health Service Executive ........................................................ x
Executive Summary ................................................................................... xiii
1. Background ................................................................................................ xiii
2. Objectives .................................................................................................. xiii
3. Methods ..................................................................................................... xiii
4. Results ....................................................................................................... xiv
5. Conclusion .................................................................................................. xvi
1 Introduction ............................................................................................... 1
1.1 Terms of Reference ..................................................................................... 1
1.2 Overall approach ......................................................................................... 1
2 Description of the technology .................................................................... 3
3 Review of effectiveness and safety of screening ...................................... 5
3.1 Summary of included studies ....................................................................... 5
3.1.1 The SAFE study ..................................................................................... 5
3.1.2 The STROKESTOP study ........................................................................ 6
3.1.3 The DOFA-AP study ............................................................................... 7
3.2 Summary of findings ................................................................................... 8
3.3 Key points................................................................................................... 9
4 Review of cost-effectiveness of screening .............................................. 11
4.1 Summary of included studies ..................................................................... 11
4.1.1 Annual pulse palpation and ECG in primary care ................................... 12
4.2.2 AF screening using iPhone ECG in pharmacies ...................................... 13
4.2.3 AF screening in flu vaccination clinics ................................................... 14
4.2.4 AF screening using intermittent ECG recording ...................................... 14
4.2 Summary of findings ................................................................................. 14
4.3 Key points................................................................................................. 15
5 Clinical and epidemiological data ............................................................ 17
5.1 Incidence of atrial fibrillation ...................................................................... 17

HTA of a national screening programme for atrial fibrillation in primary care
Health Information and Quality Authority
v
5.2 Incidence of stroke .................................................................................... 18
5.2.1 Incidence of ischaemic stroke in patients without AF ............................. 20
5.2.2 Incidence of haemorrhagic stroke in patients without AF ....................... 20
5.2.3 Probability of an ischaemic stroke being fatal in the absence of AF ......... 21
5.2.4 Probability of a haemorrhagic stroke being fatal in the absence of AF ..... 21
5.2.5 Relative risk of a ischaemic stoke in patients with AF ............................. 22
5.2.6 Relative risk of a fatal ischaemic stroke in patients with AF .................... 23
5.2.7 Functional outcomes in survivors of AF and non-AF ischaemic strokes .... 24
5.3 Deaths from other causes .......................................................................... 24
5.4 Effectiveness of treatment ......................................................................... 25
5.4.1 Effect of treatment on stroke risk ......................................................... 25
5.4.2 Effect of treatment on stroke severity ................................................... 28
5.4.3 Other effects of treatment ................................................................... 31
5.5 Effectiveness of screening .......................................................................... 32
5.5.1 GP attendance rates ............................................................................ 34
5.5.2 Uptake of opportunistic screening ........................................................ 34
5.5.3 AF detection rates ............................................................................... 34
5.6 Long-term stroke survival .......................................................................... 36
5.6.1 Ischaemic stroke ................................................................................. 37
5.6.2 Haemorrhagic stroke ........................................................................... 39
5.7 Limitations of the clinical and epidemiological data ...................................... 40
6 Utility data ............................................................................................... 42
6.1 Baseline quality of life by age ..................................................................... 42
6.2 Quality of life with atrial fibrillation ............................................................. 42
6.3 Quality of life decrease associated with treatment ....................................... 43
6.4 Quality of life after a stroke ....................................................................... 44
6.5 Quality of life decrements for complications and adverse events .................. 44
6.6 Limitations of the utility data ...................................................................... 45
7 Cost data .................................................................................................. 46
7.1 Cost of screening ...................................................................................... 46
7.1.1 Pulse palpation and ECG ...................................................................... 48
7.2 Cost of AF treatment ................................................................................. 49

HTA of a national screening programme for atrial fibrillation in primary care
Health Information and Quality Authority
vi
7.2.1 Antithrombotic medication ................................................................... 49
7.2.2 Rhythm and rate control medication ..................................................... 49
7.3 Cost of stroke and adverse events .............................................................. 50
7.3.1 Cost of in-patient treatment for stroke.................................................. 50
7.3.2 Cost of in-patient and community rehabilitation care ............................. 51
7.3.3 Cost of in-patient treatment for systemic embolism and GI bleeds ......... 52
7.3.4 Annual cost of care by severity of stroke .............................................. 52
7.3.5 Productivity costs ................................................................................ 57
7.4 Limitations of the cost data ........................................................................ 59
8 Economic analysis .................................................................................... 61
8.1 Methods ................................................................................................... 61
8.1.1 Type of economic evaluation ............................................................... 61
8.1.2 Target population and setting .............................................................. 61
8.1.3 Technology and comparators ............................................................... 61
8.1.4 Perspective, time horizon and discounting ............................................ 61
8.1.5 Model structure ................................................................................... 62
8.1.6 Sensitivity and scenario analysis ........................................................... 62
8.1.7 Budget impact analysis ........................................................................ 62
8.2 Cost-effectiveness results .......................................................................... 64
8.2.1 Payer perspective results ..................................................................... 64
8.2.2 Sensitivity and scenario analysis ........................................................... 66
8.2.3 Societal perspective results .................................................................. 79
8.4 Value of information analysis ..................................................................... 80
8.5 Budget impact results ................................................................................ 81
8.6 Impact of screening on specialist referrals .................................................. 83
8.7 Discussion ................................................................................................ 84
8.8 Key points................................................................................................. 86
9 Discussion and conclusion ....................................................................... 88
10 References ............................................................................................. 91

HTA of a national screening programme for atrial fibrillation in primary care
Health Information and Quality Authority
vii
Acknowledgements
The Authority would like to thank all of the individuals and organisations who
provided their time, advice and information in support of this assessment.
The membership of the Expert Advisory Group was as follows:
Ms Carmel Brennan Project Manager, Health Service Executive (HSE) National
Clinical Programme for Stroke
Dr Angie Brown Medical Director, Irish Heart Foundation
Dr Joe Clarke Clinical Lead, HSE National Clinical Programme for Primary
Care
Dr Pat Durcan General Practitioner, Irish College of General Practitioners
(ICGP)
Prof Joe Harbison Consultant Stroke Physician and Joint Clinical Lead for the
HSE National Clinical Programme for Stroke
Dr Patricia Harrington Head of Assessment, Health Information and Quality
Authority
Mr Neil Johnson Chief Executive, Croí, West of Ireland Cardiac Foundation
Prof Peter Kelly Consultant Neurologist and Joint Clinical Lead for the HSE
National Clinical Programme for Stroke
Dr Laura McCullagh Chief II Pharmacist, National Centre for
Pharmacoeconomics (NCPE)
Ms Kathy McSharry Practice Nursing/Primary Care Lead, HSE National Clinical
Programme for Stroke
Mr Patrick Moran Senior HTA Analyst, Health Information and Quality
Authority
Prof Charles Normand Edward Kennedy Chair in Health Policy and Management,
Trinity College Dublin
Dr Máirín Ryan (Chair) Director of HTA, Health Information and Quality Authority
Prof Susan Smith Associate Professor of General Practice, Royal College of
Surgeons in Ireland

HTA of a national screening programme for atrial fibrillation in primary care
Health Information and Quality Authority
viii
Dr Breda Smyth Public Health Specialist, HSE National Clinical Programme
for Stroke
Dr Conor Teljeur Senior Statistician, Health Information and Quality
Authority
We would also like to thank Prof Kathleen Bennett, Associate Professor in
Pharmacoepidemiology/Biostatistician, Trinity Centre for Health Sciences, St James's
Hospital, for her contribution to the analysis.
Members of the Evaluation Team:
Members of the Authority’s Evaluation Team included: Patrick Moran, Dr Conor
Teljeur, Dr Patricia Harrington and Dr Máirín Ryan.
Conflicts of Interest
None reported.
HTA of a national screening programme for atrial fibrillation in primary care
Health Information and Quality Authority
ix
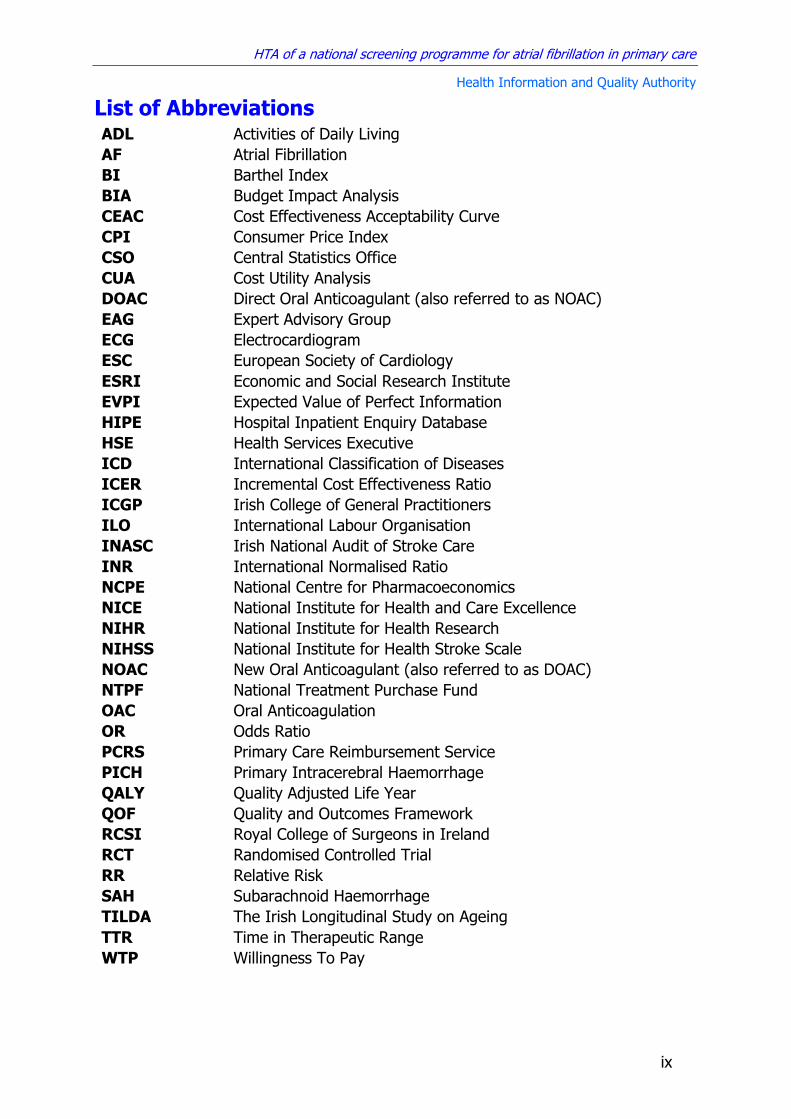
List of Abbreviations ADL Activities of Daily Living
AF Atrial Fibrillation
BI Barthel Index
BIA Budget Impact Analysis
CEAC Cost Effectiveness Acceptability Curve
CPI Consumer Price Index
CSO Central Statistics Office
CUA Cost Utility Analysis
DOAC Direct Oral Anticoagulant (also referred to as NOAC)
EAG Expert Advisory Group
ECG Electrocardiogram
ESC European Society of Cardiology
ESRI Economic and Social Research Institute
EVPI Expected Value of Perfect Information
HIPE Hospital Inpatient Enquiry Database
HSE Health Services Executive
ICD International Classification of Diseases
ICER Incremental Cost Effectiveness Ratio
ICGP Irish College of General Practitioners
ILO International Labour Organisation
INASC Irish National Audit of Stroke Care
INR International Normalised Ratio
NCPE National Centre for Pharmacoeconomics
NICE National Institute for Health and Care Excellence
NIHR National Institute for Health Research
NIHSS National Institute for Health Stroke Scale
NOAC New Oral Anticoagulant (also referred to as DOAC)
NTPF National Treatment Purchase Fund
OAC Oral Anticoagulation
OR Odds Ratio
PCRS Primary Care Reimbursement Service
PICH Primary Intracerebral Haemorrhage
QALY Quality Adjusted Life Year
QOF Quality and Outcomes Framework
RCSI Royal College of Surgeons in Ireland
RCT Randomised Controlled Trial
RR Relative Risk
SAH Subarachnoid Haemorrhage
TILDA The Irish Longitudinal Study on Ageing
TTR Time in Therapeutic Range
WTP Willingness To Pay

HTA of a national screening programme for atrial fibrillation in primary care
Health Information and Quality Authority
x
Advice to the Health Service Executive This health technology assessment (HTA) examined the clinical and cost-
effectiveness of opportunistic screening for atrial fibrillation (AF) by pulse palpation
followed by electrocardiogram (ECG) confirmation of an irregular pulse in the Irish
primary care setting. The resource implications and budget impact of a national AF
screening programme were also estimated.
The key findings, which precede and inform the Authority’s advice, are as follows:
There is good evidence from one randomised controlled trial (RCT) to show
that while opportunistic and systematic screening produce comparable
increases in AF detection compared with routine care, opportunistic screening
does so at significantly less cost. An additional RCT of opportunistic screening
for over 65s in primary care is currently in progress, the results of which could
alter the conclusions drawn based on the existing evidence.
No published studies were identified that have examined the impact of AF
screening on stroke outcomes or mortality, so there is a lack of evidence on
whether the additional AF cases identified through screening have the same
stroke risk, and therefore the same potential to benefit from treatment, as
those who present in routine care. However, international guidelines for the
management of AF recommend that both symptomatic and asymptomatic AF
should receive the same treatment.
Two previous studies were identified that reported the cost-effectiveness of
AF screening using pulse palpation followed by ECG confirmation in a primary
care setting. Both studies concluded that screening by pulse palpation was
likely to be cost-effective compared with routine care. However, the
applicability of these results in an Irish setting is low.
The primary analysis in this HTA compared the cost-effectiveness of a national
AF screening programme involving annual opportunistic pulse palpation for
men and women aged 65 years and over in primary care with routine practice
(no screening). The choice of comparator was informed by the
recommendations contained in the National Cardiovascular Policy 2010-2019
and the pilot AF screening project conducted by the HSE National Clinical
Programme for Stroke and is consistent with the best available evidence on
the effectiveness of screening.
There are approximately 8000 strokes each year in Ireland, with about a third
of these being associated with underlying atrial fibrillation.
There is a high level of uncertainty regarding a number of key parameters
needed to estimate the cost-effectiveness of AF screening in Ireland.
Conservative estimates of the effectiveness of screening on AF detection were
used and a sensitivity analysis was conducted to estimate the impact of
uncertainty in this and other parameters.

HTA of a national screening programme for atrial fibrillation in primary care
Health Information and Quality Authority
xi
Based on the results of the primary analysis, a strategy of annual
opportunistic screening in people aged 65 years and over would result in
approximately 1,944 additional AF cases being detected and 157 fewer
strokes occurring in the screened cohort compared with current practice.
Over the course of the first five years of the programme it is anticipated that
screening will have been associated with a 1.9% decrease in the incidence of
first ever stroke in those aged 65 to 90 years.
Screening is associated with an incremental cost-effectiveness ratio of
€20,271 per quality-adjusted life year (QALY), giving it an 83% probability of
being cost-effective at a willingness-to-pay threshold of €45,000/QALY.
The cost-effectiveness results are sensitive to changes in the start age of
screening, the frequency of screening, and the baseline risk of ischaemic
stroke and systemic embolism in those who would not have been diagnosed
with AF through routine practice in the absence of screening.
Changes in the proportion of AF patients who are prescribed warfarin, direct
oral anticoagulants and antiplatelet therapy are unlikely to have a major
impact on the cost-effectiveness of screening.
Budget impact analysis, which did not include a separate fee for pulse
palpation, showed that the total incremental cost of opportunistic AF
screening to the HSE over five years is approximately €3.7 million. This
includes the additional costs associated with screening ECGs and AF drug
therapy in diagnosed cases, as well as cost savings as a result of a gradual
decrease in stroke incidence over the five year time horizon.
It is estimated that screening could result in approximately 2,800 additional
referrals for an outpatient cardiology appointment in the first year after
implementation, and approximately 550 additional referrals every year
thereafter.
There are a number of issues with regard to the implementation of a
screening programme that fall outside the scope of this report that could
potentially affect decision making. These include the identification of
appropriate methods for flagging patient’s notes in GP practices to ensure that
screening is offered to everyone in the target population and ensuring that GP
practices have access to ECG equipment with interpretative software.
Consideration may also need to be given to the development of referral
guidelines for GPs in advance of the introduction of screening, in view of the
potential implications that a national programme has for the number of
specialist referrals and requests for additional investigations.

HTA of a national screening programme for atrial fibrillation in primary care
Health Information and Quality Authority
xii
Arising from the above findings, the Authority’s advice to the Health
Service Executive is as follows:
Annual opportunistic screening of men and women aged 65 years and older by pulse
palpation followed by ECG confirmation of an irregular pulse in the Irish primary care
setting is likely to be cost-effective using conventional willingness-to-pay thresholds,
assuming that those detected through screening have a comparable stroke risk
profile as those detected by routine practice. Increasing the start age of screening or
the screening interval may improve the cost-effectiveness of a prospective screening
programme.

HTA of a national screening programme for atrial fibrillation in primary care
Health Information and Quality Authority
xiii
Executive Summary
1. Background
Atrial fibrillation (AF) is the most common arrhythmia seen in general practice and is
associated with a five-fold increase in the risk of stroke. Strokes related to atrial
fibrillation are also more severe, with twice the death rate of non-AF related strokes
and greater functional deficits for those who do survive. Irish data suggest that
almost 40% of individuals with atrial fibrillation are unaware that they have an
irregular heart rhythm. The National Cardiovascular Health Policy 2010 - 2019
recommended that a screening programme for atrial fibrillation should be established
for people aged 65 and over, following formal evaluation to ensure an effective
means of implementation. The HSE National Clinical Programme for Stroke recently
conducted a pilot project in the west of Ireland, to assess the feasibility of a national
screening programme.
Following discussions with the HSE National Clinical Programme for Stroke, the
Authority undertook a health technology assessment (HTA) of screening for atrial
fibrillation in primary care.
2. Objectives
The terms of reference for the HTA were:
to review the international clinical evidence on the effectiveness and safety of
screening for atrial fibrillation,
to review the available literature on the cost-effectiveness of screening
programmes for atrial fibrillation,
to estimate the clinical benefits, cost-effectiveness, resource implications and
budget impact of a national screening programme for atrial fibrillation in
Ireland,
based on this assessment, to advise on the cost-effectiveness of an Irish
screening programme for atrial fibrillation.
3. Methods
This research was carried in accordance with HIQA guidelines for the conduct of
health technology assessments. In summary:
The Terms of Reference of the HTA were agreed between the Authority and
the HSE National Clinical Programme for Stroke.
An Expert Advisory Group (EAG) was convened, with representation from
health policy decision makers, clinicians, patient advocates, professional
HTA of a national screening programme for atrial fibrillation in primary care
Health Information and Quality Authority
xiv
bodies and experts in health services research and economic evaluation. An
evaluation team was appointed comprising internal Authority staff.
A systematic review was carried out to summarise the available evidence on
the clinical and cost-effectiveness of screening for atrial fibrillation.
An original economic evaluation was performed to estimate the cost-
effectiveness and budget impact of a prospective national AF screening
programme in Ireland, with costs measured in Euro and benefits measured in
quality-adjusted life years (QALYs).
Clinical outcomes examined in the analysis included AF detection rates,
incidence of ischaemic and haemorrhagic stroke, incidence of systemic
embolism and gastrointestinal bleeding.
The major costs examined in the analysis included the opportunity cost of
pulse palpation, the cost of ECGs in primary care, medication costs and the
cost of acute treatment and long term care associated with stroke.
The primary analysis compared the cost-effectiveness of a national AF
screening programme involving annual opportunistic pulse palpation for men
and women aged 65 years and over in primary care with routine practice (no
screening). The choice of comparator was informed by the recommendations
contained in the National Cardiovascular Policy 2010-2019 and the pilot AF
screening project conducted by the HSE National Clinical Programme for
Stroke and was consistent with the best available evidence on the
effectiveness of screening.
The primary analysis was carried out from the perspective of the publicly
funded health and social care system in Ireland. The time horizon over which
the costs and benefits of screening was calculated was 25 years and both
costs and benefits were discounted at 5%.
A Markov model was used to simulate costs and clinical outcomes in a
hypothetical cohort of men and women with and without screening over the
course of study time horizon, using a cycle length of one year.
A budget impact analysis (BIA) was performed from the perspective of the
public health system, which reports the incremental costs associated with
screening over a five-year time horizon.
The results of the analysis were also used to estimate the impact of screening
on the number of specialist referrals.
4. Results
There is good quality evidence from one randomised controlled trial showing that
both systematic screening by ECG and opportunistic screening by pulse palpation
produce comparable increases in AF detection rates. However, opportunistic
screening does so at significantly less cost. The sensitivity of pulse palpation with
HTA of a national screening programme for atrial fibrillation in primary care
Health Information and Quality Authority
xv
confirmatory ECG is estimated to be 80%. No major safety issues associated with
screening were identified. An additional randomised controlled trial (RCT) of
opportunistic screening for over 65s in primary care is currently in progress, the
results of which could alter the conclusions drawn based on the existing evidence.
Two studies were identified that examined the cost-effectiveness of AF screening in
primary care. While both of these concluded that screening was cost-effective, the
applicability of the results in an Irish context is low.
Based on the results of this HTA, annual AF screening in Ireland is expected to result
in the detection of 1,944 additional AF cases and prevent 157 strokes within a cohort
of men and women screened from age 65 to 90 years. By the end of the fifth year of
screening it is estimated that the intervention will have been associated with an
overall decrease of approximately 1.9% in the incidence of first ever stroke in the
screening population. From the perspective of the HSE, the incremental cost-
effectiveness ratio (ICER) for AF screening in over 65s compared with routine care is
€20,271/QALY, with an 83% probability of being cost-effective at a willingness to
pay threshold of €45,000/QALY. The overall five year incremental budget impact of
screening for the HSE is estimated to be €3.7M. It is estimated that screening could
result in approximately 2,800 additional referrals for an outpatient cardiology
appointment in the first year after implementation, and approximately 550 additional
referrals every year thereafter.
The analysis found that if the relative risk of stroke and systemic embolism is more
than 14% lower in screen-detected patients compared with symptomatic patients,
then screening would not be considered cost-effective using a willingness-to-pay
threshold of €45,000/QALY. There is a lack of definitive evidence on whether AF
cases that are detected through screening have the same risk of stroke as
symptomatic cases. Although international guidelines for the management of AF
recommend that both be treated the same, some studies have suggested that the
risk of stroke in asymptomatic, device-detected AF could be up to 50% lower than
that of symptomatic AF. However, the relevance of results from a very narrowly
defined subgroup (those with device detected rapid atrial rate) is unclear, since
those diagnosed through screening will include a mix of truly asymptomatic, as well
as mildly symptomatic cases. Having reviewed the available evidence, the view
within the Expert Advisory Group was that screen detected AF would not be
expected to be associated with a reduced risk of stroke and systemic embolism
compared with AF diagnosed through routine care. This would appear to be
supported by a recent analysis of data from nine European countries in the EORP-AF
Pilot General Registry, which found that asymptomatic AF had a higher one-year
mortality than symptomatic AF. In this analysis it was assumed that the risk of stroke
and systemic embolism in those detected through screening is the same as in those
who present with symptoms.

HTA of a national screening programme for atrial fibrillation in primary care
Health Information and Quality Authority
xvi
Sensitivity and scenario analyses were carried out to examine the impact of
uncertainty regarding the model parameter estimates. This showed that lowering the
start age of screening would tend to make any prospective screening programme
less cost-effective, with a start age of 50 being associated with an ICER of
€50,578/QALY compared with no screening. Conversely, increasing the screening
interval beyond once a year would tend to make screening more cost-effective. If
extended screening intervals of greater than one year are considered feasible in the
context of an opportunistic screening programme, then screening once every three
years becomes the optimal strategy at a willingness to pay threshold of
€45,000/QALY. However, these results need to be interpreted with caution, as all the
available evidence on the effectiveness of screening comes from studies carried out
in people aged 65 years and over, and no studies have as yet compared the results
of using different screening intervals. The results of the economic analysis were
insensitive to changes in the incidence rate of AF and changes to the rate of warfarin
and direct oral anticoagualant (DOAC) usage.
There are a number of issues with regard to the implementation of a screening
programme that fall outside the scope of this report that could potentially affect
decision making. These include the identification of appropriate methods for flagging
patient’s notes in GP practices to ensure that screening is offered to everyone in the
target population and ensuring that GP practices have access to ECG equipment with
interpretative software. Consideration may also need to be given to the development
of referral guidelines for GPs in advance of the introduction of screening, in view of
the potential implications that a national programme has for the number of specialist
referrals and requests for additional investigations. The costs of screening in primary
care were calculated based on current General Medical Services (GMS) remuneration
rates, which may change in the future as a result of planned contract re-negotiations
or potential changes to the funding model as part of the shift in policy towards
effective chronic disease management in primary care. However, the results of a
sensitivity analysis show that unless the fees and allowances payable under the GMS
capitation agreement increase dramatically, then the conclusions of this report are
unlikely to change.
5. Conclusion
Annual opportunistic screening of men and women aged 65 years and older by pulse
palpation followed by ECG confirmation of an irregular pulse in the Irish primary care
setting is likely to be cost-effective using conventional willingness-to-pay thresholds,
assuming that those detected through screening have a comparable stroke risk
profile as those detected by routine practice. Increasing the start age of screening or
the screening interval may improve the cost-effectiveness of a prospective screening
programme.
HTA of a national screening programme for atrial fibrillation in primary care
Health Information and Quality Authority
1
1 Introduction
1.1 Terms of Reference
The Terms of Reference agreed between HIQA and the HSE National Clinical
Programme for Stroke were:
to review the international clinical evidence on the effectiveness and safety of
screening for atrial fibrillation,
to review the available literature on the cost-effectiveness of screening
programmes for atrial fibrillation,
to estimate the clinical benefits, cost-effectiveness, resource implications and
budget impact of a national screening programme for atrial fibrillation in Ireland,
based on this assessment, to advise on the cost-effectiveness of an Irish
screening programme for atrial fibrillation.
1.2 Overall approach
The Authority convened an Expert Advisory Group (EAG) comprising representation
from relevant stakeholders. The role of the EAG was to inform and guide the
process, provide expert advice and information, and to provide access to data where
appropriate. A full list of the membership of the EAG is available in the
acknowledgements section of this report. The Terms of Reference of the EAG were
to:
Contribute to the provision of high quality and considered advice by the
Authority to the Health Service Executive.
Contribute fully to the work, debate and decision-making processes of the group
by providing expert guidance, as appropriate.
Be prepared to provide expert advice on relevant issues outside of group
meetings, as requested.
Provide advice to the Authority regarding the scope of the analysis.
Support the Evaluation Team led by the Authority during the assessment
process by providing expert opinion and access to pertinent data, as
appropriate.
Review the project plan outline and advise on priorities, as required.
Review the draft report from the Evaluation Team and recommend
amendments, as appropriate.
Contribute to the Authority’s development of its approach to HTA by
participating in an evaluation of the process on the conclusion of the
assessment.
HTA of a national screening programme for atrial fibrillation in primary care
Health Information and Quality Authority
2
The Authority appointed an Evaluation Team comprising internal staff from the HTA
directorate to carry out the assessment.
The Terms of Reference of the HTA were endorsed by the EAG at the initial meeting
of the group.
A systematic review of the evidence on the clinical and cost effectiveness of
screening for atrial fibrillation was carried out, along with an analysis of the
applicability of the results in an Irish context. Following this review it was considered
appropriate to conduct an original economic evaluation of a prospective national AF
screening programme that combined the best available Irish data on the
epidemiology of AF and stroke with published literature on the effectiveness of AF
screening and subsequent management of the arrhythmia. Where possible Irish data
sources were also used to inform estimates of the cost and utility weights associated
with the clinical outcomes included in the analysis.
All parameter estimates used in the analysis were reviewed by the Expert Advisory
Group and interim findings from the assessment were discussed at a meeting of the
group. A final draft report was reviewed by the Expert Advisory Group prior to being
submitted for approval by the Board of the Authority. Following its approval, the
report was submitted as advice to the Minister for Health and the HSE.
HTA of a national screening programme for atrial fibrillation in primary care
Health Information and Quality Authority
3
2 Description of the technology
Atrial fibrillation (AF) is the most common cardiac arrhythmia encountered in general
practice. It is characterised by a rapid and irregular contraction of the upper
chambers of the heart, which diminishes its ability to pump blood efficiently. In some
cases AF can be asymptomatic, while in others the person may experience
palpitations, chest pain and shortness of breath. Different types of AF can be
classified by the frequency of occurrence of the arrhythmia or by the underlying
cause. The 3-P system distinguishes between paroxysmal (two or more episodes that
terminate within seven days), persistent (one episode that lasts more than seven
days) and permanent AF (episode lasts more than a year and cannot be terminated
by cardioversion).(1) Aetiological classification distinguishes between AF cases where
there is no clinical or echocardiographic (ECG) evidence of structural heart disease
(lone AF), or by the presence or absence of heart valve problems such as rheumatic
mitral valve disease (valvular or non-valvular AF). The overall population prevalence
of AF is around 2%, rising sharply with age. The median age of AF patients is 75
years and 70% are between 65 and 85 years old.(2-4) Estimates of AF prevalence in
those aged over 80 vary from around 8% to greater than 15%.(5) Men are 1.5 times
more likely than women to develop the condition, but because women have a longer
life expectancy, the overall number of men and women with AF in older populations
is approximately equal.(6;7)
As well as reducing quality of life, non-valvular AF is associated with a fivefold
increase in the risk of stroke.(2) This is due to uncoordinated atrial activity disrupting
blood flow through the heart, which increases the propensity for thrombus
formation, particularly in the left atrial appendage. These clots may be pumped out
of the heart and cause an ischaemic stroke by blocking an artery supplying blood to
the brain. Compared with non-AF strokes, AF strokes are more likely to be fatal, and
result in longer hospital stays, poorer functional outcomes and a lower chance of
being discharged home afterwards for those who survive.(8) It is estimated that there
are approximately 8000 strokes annually in Ireland, with about a third of these being
associated with underlying atrial fibrillation.(9;10)
Recommended management of AF is outlined in the (draft) AF care pathway
developed by the HSE National Clinical Programme for Stroke.(11) Diagnosis of the
arrhythmia is made by ECG in patients with suspected AF or those with an irregular
pulse. However, pulse palpation of patients who present without symptoms
indicative of AF is not routinely carried out in primary care. Once diagnosed, patients
may undergo further testing to rule out structural heart disease or other problems.
Most patients receive pharmacological treatment to decrease the risk of stroke in AF,
with treatment decisions being guided by the CHA2DS2-VASc score for AF stroke risk.
The two main types of anti-thrombotic treatment are antiplatelet therapy and oral
anticoagulation, which have been shown to reduce the risk of stroke by
HTA of a national screening programme for atrial fibrillation in primary care
Health Information and Quality Authority
4
approximately 20% to 60%.(12) Risks associated with these medications include an
increase in the likelihood of haemorrhagic stroke or major extracranial bleeding. A
minority of patients undergo invasive procedures to treat AF, including ablative
surgery to modify electrical conductivity in the atrium itself, and left atrial appendage
occlusion devices to seal off the area principally associated with thrombus formation.
It is estimated that over 30% of people with AF have no obvious symptoms, but are
nonetheless at increased risk of stroke and systemic embolism.(13;14) In the absence
of screening, asymptomatic AF is diagnosed incidentally through routine physical
examinations or after complications such as stroke or heart failure have occurred.
The North Dublin Stroke Study found that 45% of strokes had underlying AF which
was undiagnosed prior to the stroke.(15) AF would therefore appear to meet many of
the Wilson-Junger criteria for a successful screening programme.(16) The natural
history of the disease is well documented and includes a significant proportion of
latent cases, a suitable test is available and effective treatments can be administered
to those diagnosed, which substantially reduce the risk of serious injury or death
from stroke. However there remains a great deal of uncertainty regarding the final
criterion of whether the costs of case finding (including diagnosis and treatment of
patients diagnosed) are economically balanced in relation to possible expenditures
on medical care as a whole. Our aim is to address this issue in an Irish context, by
estimating the cost-effectiveness of an opportunistic AF screening programme in
primary care, which was recommended in the 2010 National Cardiovascular Health
Policy and is currently being considered by the HSE National Clinical Programme for
Stroke.(17)

HTA of a national screening programme for atrial fibrillation in primary care
Health Information and Quality Authority
5
3 Review of effectiveness and safety of screening
A systematic review of the evidence on the effectiveness of AF screening was carried
out to inform the economic analysis and identify any potential safety implications
associated with the intervention. Full details of the search strategy, inclusion criteria,
quality appraisal and results were previously published in the Cochrane Library.(18)
This section provides a summary of the most relevant findings from the 2013 review
and an update of the literature search (June 2012 to June 2015).
Two randomised controlled trials of AF screening were identified. One was a three-
arm cluster randomised controlled trial (RCT) that compared systematic screening
(by ECG) and opportunistic screening (by pulse palpation followed by ECG
confirmation) with routine care for individuals aged 65 and over in the UK general
practice (SAFE study).(19) The other was an RCT of screening people aged 75 and 76
in Sweden using intermittent ECG recording over a two week period (STROKESTOP
study) compared with standard of care (no screening).(20) One ongoing study
examining the effectiveness of opportunistic AF screening of over 65s in primary care
in Spain (DOFA-AP study) was also identified.(21)
3.1 Summary of included studies
3.1.1 The SAFE study
The Screening for Atrial Fibrillation in the Elderly (SAFE) study recruited a total of 50
general practices in the UK and used stratified randomisation by practice size and
level of deprivation (Townsend score) to allocate them to either control or
intervention groups.(19) All enrolled practices had to have computerised record
keeping facilities in order to participate. Educational materials highlighting the
importance of AF detection and available treatment options were provided to
intervention practices and staff were encouraged to consider opportunistic pulse
taking during routine consultation. Ten thousand patients aged 65 years or older
were randomly selected from the intervention practices and allocated evenly to
either systematic or opportunistic screening. In the systematic screening arm
patients received a letter inviting them to attend an electrocardiogram (ECG)
screening clinic. In the opportunistic arm, patients’ records were flagged to prompt
the general practitioner (GP) to check the pulse whenever that patient next attended
the practice for any reason. Five thousand patients aged 65 years or older were
randomly selected from among the control practices to act as a routine care
comparator. Staff in the control practices received no training.
The risk of bias in the SAFE study is low. Blinding of participants was not possible
given the nature of the intervention, but the clinicians who read the ECGs were
blinded as to which group the tracing came from. The primary outcome of the study

HTA of a national screening programme for atrial fibrillation in primary care
Health Information and Quality Authority
6
was the detection of new cases of AF. The long term impact of the intervention on
stroke outcomes in screened versus unscreened populations was not examined.
The study found that both systematic and opportunistic screening increased
detection of new cases of AF compared with routine care. The effect size in both
arms was comparable (odds ratio of being diagnosed with AF in the intervention
group compared with the control group was 1.57), but systematic screening was
associated with substantially higher costs. The incremental cost per additional case
detected by opportunistic screening was GBP £337, compared with GBP £1,514 for
systematic screening. All cost estimates were based on UK data from 2001 to 2003.
The absolute effect of screening on AF detection rates in the overall population was
relatively modest (<1%). It is also noted that a greater proportion of the 75 newly
identified cases in the opportunistic arm were diagnosed outside of the screening
programme (44/75, 59%) than within it (31/75, 41%). Forest plots for both
opportunistic and systematic screening versus routine care are shown in Figure 3.1.
No major safety concerns associated with screening were reported and a patient
survey completed at the end of the trial indicated that the screening process was
acceptable to patients.
Figure 3.1 Forest plots of opportunistic and systematic screening versus routine care (SAFE)
3.1.2 The STROKESTOP study
The STROKESTOP study randomly assigned people aged 75 and 76 years from two
separate regions within Sweden to treatment and control groups.(20) People without
a history of AF in the treatment group were sent a letter inviting them to participate
in an AF screening programme. Those who accepted the invitation were given
handheld one-lead ECG recorders to use over the course of a two-week-period.
Patients were instructed to take ECG recordings twice daily or when they
experienced palpitations by placing their thumbs on the device, which then
HTA of a national screening programme for atrial fibrillation in primary care
Health Information and Quality Authority
7
automatically transmitted a 30-second ECG tracing to a centralised database. In the
case of inconclusive tracings, participants were offered additional ECG recordings at
the discretion of the investigating cardiologist.
The study ran from March 2012 to June 2014 and invited a total of 14,387 people.
The overall response rate was 54% (n=7,173). New diagnoses of AF were made in
218 patients (3.0%, 95% CI 2.7 to 3.5) in the screened group. Of the 666 patients
with a prior diagnosis of AF, 517 (77.6%) were using oral anticoagulation (OAC),
meaning 149 patients (2.1%) of the total screened population (7,173) had
diagnosed AF but were not anticoagulated. Therefore 5.1% of patients screened
benefitted from the intervention by being offered OAC. Among newly identified
cases, 93% accepted starting OAC, while the corresponding figure for those with
previously diagnosed AF was 47%. However, the authors failed to report the rate of
AF diagnosis in the control arm, so it is not possible to estimate the effect of
screening on AF detection in this study. No major safety concerns associated with
screening were reported.
The uptake rate of screening was relatively low (54%) so there is a risk of self-
selection bias if there were inherent differences between the group that accepted
screening and those that did not. The results are reported using the denominator of
those who accepted the invitation and were screened, and included those with a
prior diagnosis of AF, (7,173) rather than doing an intention-to-treat analysis using
the overall invited population (14,387). In contrast, the SAFE study calculated the
detection rate as a percentage of the total invited population without a history of AF.
STROKESTOP investigators intend to follow study participants for five years to
examine the impact of screening on the incidence of ischaemic stroke. They will also
use registry data at five years to measure the detection rate of AF in the control
group. Therefore currently there are no data on the relative effectiveness of this type
of screening on AF detection or long term stroke outcomes.
3.1.3 The DOFA-AP study
A protocol for an randomised controlled trial (RCT) currently in progress in Spain was
published in 2012.(21) The authors planned to conduct a cluster randomised trial
comparing opportunistic screening of over 65s in primary care with routine care. The
investigators intended to recruit almost 13,000 participants over the course of 12
months and use the same screening test as the SAFE trial (pulse palpation followed
by ECG confirmation). The estimated completion date for this study was March 2015.
Contact with the principal investigator for this study revealed that a manuscript
reporting the results of the trial is currently in preparation. Initial indications are that
the authors will report that screening was not effective, with a greater number of
irregular pulses having been detected in the control arm than the treatment arm.(22)
The finding that opportunistic screening would decrease the number of irregular

HTA of a national screening programme for atrial fibrillation in primary care
Health Information and Quality Authority
8
pulses detected is counterintuitive. Of particular interest will be further details on
what exactly constituted routine care in the Spanish primary care centres involved in
the trial. The results of this study are not expected to be available until late 2015 or
early 2016. Given the methodological quality of the UK SAFE trial and the high level
of applicability in terms of the patient population, the screening intervention and the
study setting, the risk that the results of the DOFA-AP trial will seriously alter the
parameter estimates used in the decision analysis model is considered low.
3.2 Summary of findings
No published studies were identified that examined the impact of AF screening on
stroke outcomes or mortality. Two RCTs examined the impact of screening on
detection of AF, but one of these failed to report the AF detection rate in the control
arm. These studies used different screening tests in different populations, so the
results cannot be combined. Based on the UK trial both opportunistic and systematic
screening are equally effective at improving AF detection, but systematic screening is
associated with much higher costs. The magnitude of the effect of screening on
observed annual AF incidence within the overall population aged 65 years and older
is relatively small, with annual increases of less than 1%. Screening older age groups
with intermittent ECG recordings as opposed to once-off ECG or pulse palpation
during GP consultations may increase the rate of detection in those screened.
However, given the relatively low uptake rates reported in the Swedish RCT, the
overall impact of screening on observed AF incidence is likely to be less than 3%. As
well as detecting latent AF, screening may also improve anticoagulation rates among
those with an existing diagnosis. The Swedish study reported a 1% increase in
anticoagulation rates within the screened group.
Challenges in evaluating the impact of AF screening include the difficulty in
estimating the effect of routine care and handling differences in the background
prevalence of AF between control and treatment groups. In the SAFE trial the
baseline incidence of AF was higher in the control arm than in both treatment arms
(7.9% versus 6.9%). This could be due to real differences in AF risk between
groups, in which case randomisation failed, or as a result of better detection in the
GP practices in the control group. The study authors concluded that it was probably
the latter, but this then raises questions about whether higher detection rates in the
treatment group were partly due to there being a higher proportion of undiagnosed
AF to begin with. The interaction of the relative effects of routine care and screening
is also difficult to assess. In the UK trial a significant proportion of new cases
continued to be diagnosed outside of the screening programme in both the
systematic and opportunistic arms of the trial.
The results of the Spanish RCT of opportunistic screening of over 65s are awaited.
This will provide valuable evidence on the transferability of the UK results outside of
HTA of a national screening programme for atrial fibrillation in primary care
Health Information and Quality Authority
9
the UK primary care setting and hopefully give greater certainty about the impact of
screening on AF detection. However it is not anticipated that this study will report
the impact of screening on stroke outcomes or mortality.
The UK National Screening Committee reviewed its recommendations with regard to
AF screening in 2014.(23) They concluded that although screening is likely to increase
AF detection it should not be offered given current deficiencies in the management
of existing AF patients and uncertainty about the clinical benefits of early diagnosis.
Data from the UK indicates poor compliance with currently recommended anti-
thrombotic treatments. Approximately half of those who should be on
anticoagulation are not, while a third of those for whom anticoagulation is not
indicated (because their risk of stroke is low) are receiving it.(24;25) They also found a
lack of evidence showing that undiagnosed AF carries the same risk of stroke as
diagnosed AF, citing some studies that have suggested that the relative risk of stroke
in asymptomatic device-detected AF may be 33% to 50% lower than the risk of
stroke for those with symptomatic AF.(23) However, the CHA2DS2-VASc score for AF
stroke risk does not differentiate between asymptomatic and symptomatic individuals
when calculating stroke risk. Also in the event of screening, not all screen-detected
people will be completely asymptomatic, just as not all AF patients currently detected
are symptomatic, so the evidence from pacemaker studies may not be directly
applicable.
In summary, there is good evidence to show that screening improves detection rates
of AF compared with routine care. No major safety concerns were identified and
both opportunistic and systematic screening were reported to be acceptable to
patients. An additional RCT of opportunistic screening for over 65s in primary care is
currently in progress, the results of which could alter the conclusions drawn based
on the existing evidence. A major limitation of the available evidence is the lack of
data on the stroke risk profile of asymptomatic AF and the impact of screening on
long term stroke outcomes and mortality.
3.3 Key points
There is good evidence from one randomised controlled trial to show that
screening improves detection rates of AF compared with routine care.
No published studies were identified that have examined the impact of AF
screening on stroke outcomes or mortality so there is a lack of evidence on
whether the additional AF cases identified through screening have the same
stroke risk, and therefore the same potential to benefit from treatment, as
those who present in routine care.
Opportunistic and systematic screening in primary care are associated with
increases in AF detection of about 1% annually compared with routine care.

HTA of a national screening programme for atrial fibrillation in primary care
Health Information and Quality Authority
10
Prolonged intermittent screening may increase AF detection rates compared
with a screening test carried out at a single point in time.
No safety concerns associated with screening were identified and both
opportunistic and systematic screening were reported to be acceptable to
patients.
An additional RCT of opportunistic screening for over 65s in primary care is
currently in progress, the results of which could alter the conclusions drawn
based on the existing evidence.

HTA of a national screening programme for atrial fibrillation in primary care
Health Information and Quality Authority
11
4 Review of cost-effectiveness of screening
A search for economic evaluations of screening for atrial fibrillation (AF) conducted in
Medline, Embase and NHS EED identified five studies that compared any type of
screening programme in the general population to usual care. Figure 4.1 shows the
search strategy used and a flowchart of the results.
Figure 4.1 Search strategy and results
Search Strategy: Atrial fibrillation[MESH] AND screening[MESH]
Economic search filter: Royle and Waugh
Date of search:05/06/2015
Results:Medline : 16Embase : 39NHS EED: 20
Included Studies5
Excluded studies
70
4.1 Summary of included studies
Five studies were identified, two from the UK, and one each from Japan, Australia
and Sweden. The included studies were all published between 2004 and 2015, and
examined the cost-effectiveness of both organised and opportunistic screening.
Table 4.1 provides a summary of identified studies, each of which are described in
more detail below.

HTA of a national screening programme for atrial fibrillation in primary care
Health Information and Quality Authority
12
Table 4.1 Summary of cost-effectiveness studies
Study Setting Perspective Study (Costs)
Screening Findings*
Maeda 2004(26)
Primary care Japan
Societal Cost-utility analysis (2001 USD)
Pulse palpation and ECG
Screening by pulse palpation and screening by ECG are both cost-effective (ICERs <€17,000/QALY)
Hobbs 2005(19)
Primary care UK
Health service
Cost-utility analysis (2003 STG)
Pulse palpation and ECG
Screening by opportunistic pulse palpation has a 60% chance of being cost-effective). Systematic ECG screening is not cost-effective.
Lowres 2014(27)
Community pharmacies Australia
Health service
Cost-utility analysis (2012 AUD)
ECG ECG screening using a mobile phone attachment is cost effective (€3,311/QALY)
Rhys 2013(28)
Flu vaccination clinics UK
Health service
Cost-effectiveness analysis (2011 STG)
Pulse palpation
Cost per new case of AF diagnosed was €292
Aronsson 2015(29)
Primary care Sweden
Societal Cost-utility analysis (2014 EUR)
ECG Prolonged, intermittent ECG recording was cost-effective (ICER €5,097/QALY)
* All results have been converted to 2014 Irish € using the relevant consumer price index and
purchasing power parity
4.1.1 Annual pulse palpation and ECG in primary care
Maeda et al. examined the cost-effectiveness of community-based annual ECG or
pulse palpation AF screening programmes compared with no screening for over 65s
in Japan.(26) This was a cost-utility analysis with costs in (2001) US dollars and
benefits in QALYs. They used a Markov model that differentiated between non-
disabling, disabling and repeated disabling ischaemic and haemorrhagic strokes over
a 25 year time horizon with costs and benefits discounted at 3%. In this analysis it
was assumed that ECG and pulse palpation have sensitivities of 100% and 97%,
HTA of a national screening programme for atrial fibrillation in primary care
Health Information and Quality Authority
13
respectively, that the screening programme would achieve uptake rates of 100% and
that all detected AF cases would be anticoagulated. The study included direct costs
associated with screening and treatment (apart from the capital costs of ECG
equipment), as well as the cost of the patient’s time, calculated using Japanese
average salary data. Results for screening in men and women were reported
separately. The incremental cost-effectiveness ratio (ICER) for annual pulse
palpation in males was $7,637 and $9,968 in females. The ICER for annual ECG in
males was $7,830 and $10,220 in females. The authors concluded that screening
was cost-effective and that both screening tests were comparable in terms of the
benefits and costs.
An economic analysis was carried out as part of the Screening for Atrial Fibrillation in
the Elderly (SAFE) trial of opportunistic and systematic AF screening of over 65s in a
UK primary care setting.(19) This was conducted from the perspective of the National
Health Service in the UK, but also included the opportunity cost of patient’s time.
Data on the sensitivity of pulse palpation (87%) and ECG (12-lead GP read ECG
80%) were taken directly from the trial. Long term outcomes were estimated from
the literature, using an assumption that screen detected cases carry the same risk of
stroke and systemic embolism as those detected through routine practice. Discrete
event simulation was used to model a cohort of people from age 65 to death,
differentiating between non-disabling and disabling ischaemic stroke. Costs and
benefits were discounted at 3.5% annually. Results showed that the incremental
benefit of opportunistic screening (in QALYs) was not significantly different from that
of no screening, but was either cost neutral or marginally less costly. This resulted in
a very flat cost-effectiveness acceptability curve (CEAC) indicating that opportunistic
screening had approximately a 60% chance of being cost-effective at any given
willingness to pay (WTP) threshold. Opportunistic screening was more cost-effective
than systematic screening, which was associated with a fivefold increase in the cost
of AF case detection (GBP£1,787 versus GBP£363, 2003).
4.2.2 AF screening using iPhone ECG in pharmacies
Lowres et al. reported the results of a cost-utility analysis of screening for AF in
community pharmacies using an ECG taken by a specially adapted iPhone and
interpreted using a software algorithm reported to have a sensitivity of 98%.(27) The
analysis was conducted from the perspective of the Australian health service, based
on a cohort of men and women aged 65 to 84 years. Cost data were taken from a
feasibility study using the iPhone ECG device carried out by the authors previously,
and data on the long term effectiveness of AF detection were taken from UK registry
data. Utility data were taken from previous studies estimating that each stroke
prevented by screening resulted in a gain of 5.09 QALYs. Only costs were
discounted, at a rate of 5% annually. It was assumed that the uptake rate of
screening would be 50% and that adherence to treatment would be 55%. Results of

HTA of a national screening programme for atrial fibrillation in primary care
Health Information and Quality Authority
14
this study found that screening was highly cost-effective, with an incremental cost of
€3,142 per additional QALY gained through screening.
4.2.3 AF screening in flu vaccination clinics
Rhys et al. reported the results of a study examining the clinical effectiveness and
costs associated with screening over 65s attending annual flu vaccination clinics in
the UK using pulse palpation and ECG confirmation of an irregular pulse.(28) A total of
573 patients were screened and two new cases of AF were identified. The study was
not a cost-effectiveness analysis, but did report the cost of identifying a new case
(GBP£234). The cost was based on estimated ECG costs in primary care of £34 that
included the cost of the time required for a nurse to perform an ECG (£12). Long
term costs and benefits were not reported. The authors concluded that although
acceptable to patients, screening at annual flu vaccination was ineffective.
4.2.4 AF screening using intermittent ECG recording
Aronsson et al. reported a cost-effectiveness analysis based on the STROKESTOP
trial of screening of 75 and 76 year olds in Sweden using intermittent ECG recordings
(see Section 3.2).(29) In this study, participants underwent an initial ECG screen and
if AF was not detected they were requested to provide two 30-second ECG traces per
day for two weeks from home, using a portable device that automatically transmitted
the recordings to a central database. Although no information on the AF detection
rate in the control group is currently available, data from the screened group
indicated that this type of screening increased the known AF prevalence by 3%.The
study also detected a further 2% who had a prior AF diagnosis but were not taking
anticoagulant medication. Estimates of the effect of treatment were taken from the
literature and cost data from 2014 were obtained from the Swedish healthcare
system. It was assumed that 93% of AF patients would be anticoagulated with
apixaban. QALY losses as a result of ischaemic and haemorrhagic stroke were
included as QALY decrements (0.15 and 0.30, respectively) rather than as a QALY
weighting based on baseline quality of life by age. A Markov model was used to
estimate the costs and benefits of screening in a cohort of 1,000 patients over their
entire lifetime. Results indicated that intermittent ECG screening of 75 year olds was
cost-effective, with a cost per additional QALY gained of €4,313, compared with no
screening.
4.2 Summary of findings
All cost-utility analyses identified in this review concluded that AF screening is cost-
effective compared with no screening. However there is a high degree of
heterogeneity in the type of screening programme, study population and methods
used to estimate the short and long term consequences of the intervention.
An appraisal of the available evidence was carried out per the International Society
For Pharmacoeconomics and Outcomes Research (ISPOR) guidelines for assessing
HTA of a national screening programme for atrial fibrillation in primary care
Health Information and Quality Authority
15
applicability, validity and transferability of findings.(30) The most applicable studies in
terms of screening programme and population were the Japanese and UK (SAFE)
studies, which were the only ones to examine pulse palpation in primary care for
over 65s.(19;26) These produced conflicting results, with the Japanese evaluation
finding that both annual pulse palpation and annual ECG cost approximately the
same, whereas the UK study found that the costs of systematic screening by
invitation to ECG were five times that of opportunistic pulse palpation. Both studies
found that screening was associated with marginal increases in the number of QALYs
gained. The Japanese study assumed that the sensitivity of pulse palpation and ECG
were higher than the estimates used in the UK trial. As the UK estimates were based
on RCT data they have greater validity. Both studies used fixed estimates of the risk
of stroke over the course of the study time horizon, rather than adjusting the risk
based on the age of the cohort. Neither of the studies examined the impact of
changes in the proportion of patients on antiplatelet versus anticoagulant therapy,
and both studies were carried out prior to the widespread use of direct oral
anticoagulants (DOACs, also referred to as new oral anticoagulants [NOACs]). They
also failed to examine the impact of screen-detected AF patients potentially having a
lower baseline risk of ischaemic stroke.
In summary, two of the five cost-effectiveness studies identified examined the type
of screening programme of interest to this health technology assessment (annual
opportunistic pulse palpation in those aged 65 years and over). While both ultimately
found that screening was cost-effective, there are limitations in regard to the validity
of some of the clinical and cost estimates used in the analyses. The applicability of
the results to the present situation in Ireland is low, given the differences in
healthcare costs and advances in the available treatments to reduce the risk of
stroke in AF since these studies were carried out. Therefore to estimate the cost-
effectiveness of a prospective national AF screening programme in Ireland it was
necessary to develop an original economic model to simulate the anticipated costs
and benefits associated with screening, using the best available Irish and
international data on the epidemiology of AF and AF-related stroke, the effectiveness
of treatment, the impact of AF and stroke on health related quality of life and the
costs associated with diagnosis, treatment and long term care.
4.3 Key points
Five previous studies reporting the cost-effectiveness of screening for AF in a
general population were identified.
Two studies examined annual opportunistic AF screening using pulse
palpation followed by ECG confirmation in a primary care setting (UK and
Japan).
Both studies found that screening was associated with moderate increases in

HTA of a national screening programme for atrial fibrillation in primary care
Health Information and Quality Authority
16
the number of QALYs gained, compared with routine care.
The Japanese evaluation found that both annual pulse palpation and annual
ECG cost approximately the same, whereas the UK study found that the costs
of systematic screening by invitation to ECG were five times that of
opportunistic pulse palpation.
Since the UK study was based on RCT data, the validity of the estimates of
the costs of screening and the sensitivity of the screening test is greater than
that of the Japanese study.
Both studies concluded that screening by pulse palpation was likely to be
cost-effective compared with routine care.
The applicability of these results to the present situation in Ireland is low,
given the differences in healthcare costs between different health systems
and the arrival of new AF treatments that were unavailable at the time these
studies were carried out.

HTA of a national screening programme for atrial fibrillation in primary care
Health Information and Quality Authority
17
5 Clinical and epidemiological data
Evaluation of the cost-effectiveness of screening requires estimation of the average
probability of an event occurring in members of the simulated cohort, such as
developing atrial fibrillation, having a stroke, dying, or being diagnosed with AF
through screening, as well as the impact of treatment on the risks of experiencing
these clinical outcomes. This section outlines how each of these parameter estimates
was derived.
5.1 Incidence of atrial fibrillation
Accurately measuring the incidence of atrial fibrillation by age is challenging due to
the characteristics of the disease, which can be minimally symptomatic or
intermittent. There is currently no AF register in Ireland that records the number of
people diagnosed by age group. The Irish Longitudinal Study on Ageing (TILDA)
study recorded prevalence data by asking all 8,175 participants whether or not they
had ever been diagnosed with AF and also by screening 4,890 participants using 3-
lead ECG. The results of this showed an overall prevalence estimate of 3% in over
50s (approx 150 individual cases in total).(31) This was of limited use in the analysis,
which requires data on the risk of developing AF by year of age (incidence data).
A number of international studies have estimated the incidence and prevalence of AF
in the general population. One of the most recent and highly populated studies was
carried out in Germany between 2006 and 2008, involving 8.3 million patients.(5) This
produced relatively high estimates of AF prevalence compared with previous studies.
Some of this difference is explained by the fact that the German study included any
type of AF diagnosis whereas other studies only included permanent AF. It has also
been suggested that AF prevalence has risen in many societies in the recent past
due to an increased focus on detection, which could contribute to some of the
difference between older and more recent studies.(32;33) The risk that AF prevalence
is overestimated in this study by including suspected (as opposed to definite) AF
cases is low, since inclusion required two outpatient AF diagnoses in two different
quarters or at least one inpatient AF diagnosis. Generally in these types of studies
the risk of underestimating AF prevalence is greater than the risk of overestimation,
since not every case of AF is diagnosed and many patients with AF may not visit a
doctor regularly.(34) Given the large numbers of participants, thorough case
ascertainment and the applicability of the setting (Western Europe), the German
study(5) on AF incidence by age is the best available data to use in this analysis.
When prevalence in the TILDA study is calculated for those aged 50 to 84 within the
group of people that were screened (N=4,849) by adding those that were screen-
detected to those that reported a previous diagnosis of AF, the prevalence of AF in
Ireland is consistent with the German study. The real prevalence of AF is likely to
exceed both these estimates, given the difficulty in detecting all prevalent cases.

HTA of a national screening programme for atrial fibrillation in primary care
Health Information and Quality Authority
18
Incidence by year from this study is modelled using a rational function of the form:
The study data and fitted model are shown in Figure 5.1.
Figure 5.1 AF Incidence
5.2 Incidence of stroke
The analysis required an estimate of the incidence of first-ever ischaemic stroke and
intracranial haemorrhage by age for those without AF, those with undiagnosed and
untreated AF and those with diagnosed and treated AF. Data on the percentage of
ischaemic and haemorrhagic strokes that result in death and severe, moderate or
mild disability within each of these three groupings was also required.
Irish data on the incidence of ischaemic (ICD I63), haemorrhagic (I60-I62) and
undefined (I64) stroke by year of age for those without a diagnosis of AF (ICD I48)
were obtained from the hospital in-patient enquiry (HIPE) system for the period
2010 to 2014. Population data required to calculate overall incidence rates were
obtained from the Central Statistics Office (CSO). To exclude, insofar as possible,
cases of recurrent stroke, only one episode was included per patient, and that
episode had to be an emergency, non-readmitted case. Undefined stroke cases (I64)
were divided between ischaemic and haemorrhagic strokes in the same ratio as the
incidence of definite ischaemic to haemorrhagic strokes, to avoid underestimating
overall incidence. HIPE data on overall stroke incidence for those with and without a
diagnosis of AF are shown in Figure 5.2, which shows incidence rates consistent with
those reported internationally.(35)
0
0.005
0.01
0.015
0.02
0.025
0.03
0.035
50 55 60 65 70 75 80 85
Inci
den
ce r
ate
Age
Study Data Modelled Incidence

HTA of a national screening programme for atrial fibrillation in primary care
Health Information and Quality Authority
19
The evaluation also required an estimate of the rate of ischaemic and haemorrhagic
stroke in those without a diagnosis of AF. In the analysis this baseline risk is then
adjusted if the person develops AF and is diagnosed, or if they develop AF and
remain undiagnosed. The evidence used to inform these parameters is discussed
below. Briefly, an AF diagnosis increases the risk of ischaemic stroke, but does not
alter the risk of haemorrhagic stroke, whereas antithrombotic treatment decreases
the risk of ischaemic stroke, but increases the risk of haemorrhagic stroke.
Figure 5.2 Overall incidence of stroke in AF and non-AF populations
Since HIPE only includes data on hospital admissions there is a risk that it will
underestimate the total number of strokes due to the exclusion of people who are
pronounced dead before being brought to hospital. Specific data on the number of
such cases is unavailable. The recently established National Stroke Register relies
solely on HIPE data and does not collect this information. To examine the potential
impact of this issue the latest five years of data from the CSO on total death
certificate mortality from ischaemic and haemorrhagic stroke (I60-I64, 2008 to 2012)
were compared with HIPE data on the total number of stroke deaths in hospital
during the same period (discharge code of 06 [Died with post mortem] or 07 [Died
no post mortem]). There was only a 2% difference between the two (Figure 5.3),
which indicates that using the HIPE data will not result in a major underestimate of
stroke incidence. This is consistent with the results of previous work carried out by
The Economic and Social Research Institute (ESRI) comparing HIPE data from Dublin
hospitals with that of the North Dublin Stroke Study, which found a difference of 3%
in first-ever or recurrent stroke incidence.(36)
0
0.01
0.02
0.03
0.04
0.05
50 55 60 65 70 75 80 85
Inci
den
ce r
ate
Age
Overall population (Ireland) AF population
Overall population (international data) Non-AF population
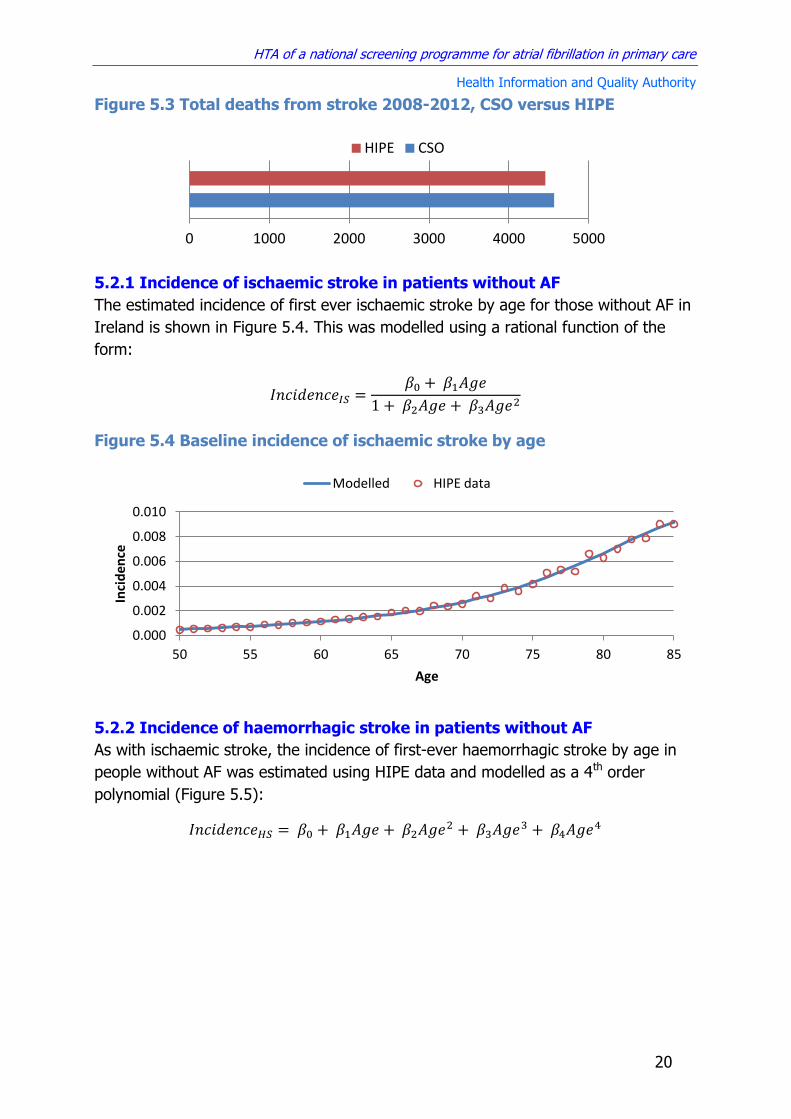
HTA of a national screening programme for atrial fibrillation in primary care
Health Information and Quality Authority
20
Figure 5.3 Total deaths from stroke 2008-2012, CSO versus HIPE
5.2.1 Incidence of ischaemic stroke in patients without AF
The estimated incidence of first ever ischaemic stroke by age for those without AF in
Ireland is shown in Figure 5.4. This was modelled using a rational function of the
form:
Figure 5.4 Baseline incidence of ischaemic stroke by age
5.2.2 Incidence of haemorrhagic stroke in patients without AF
As with ischaemic stroke, the incidence of first-ever haemorrhagic stroke by age in
people without AF was estimated using HIPE data and modelled as a 4th order
polynomial (Figure 5.5):
0 1000 2000 3000 4000 5000
HIPE CSO
0.000
0.002
0.004
0.006
0.008
0.010
50 55 60 65 70 75 80 85
Inci
de
nce
Age
Modelled HIPE data
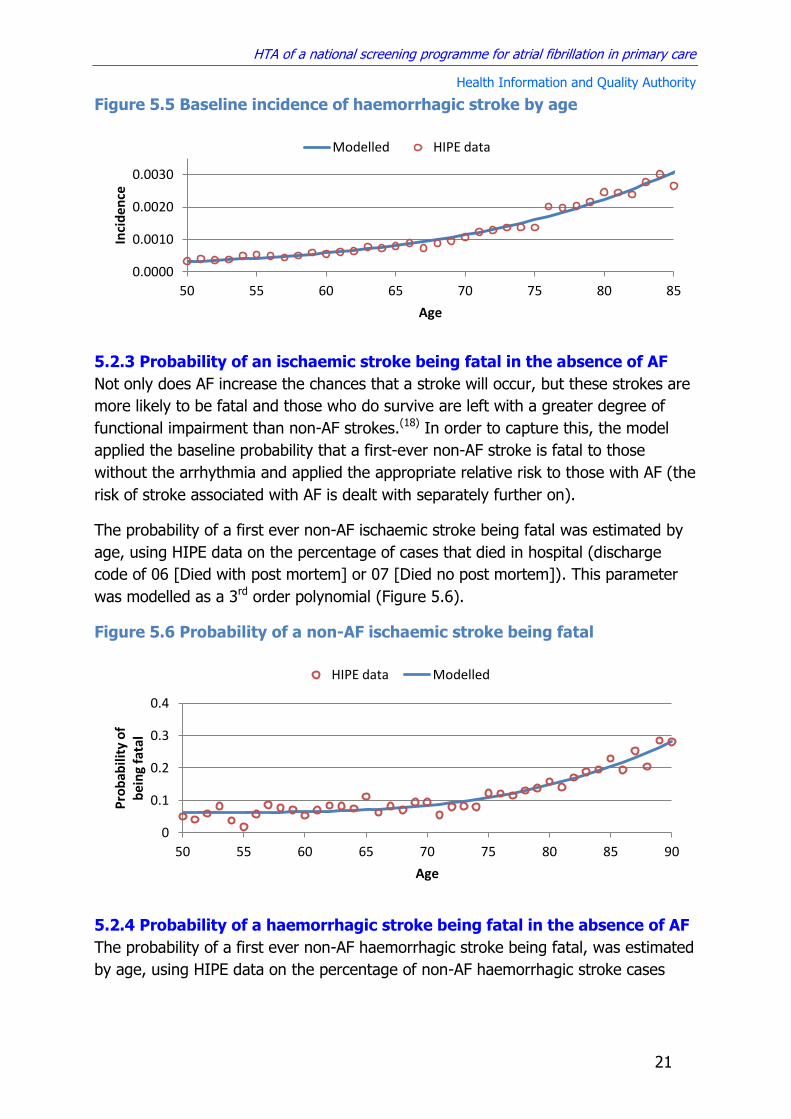
HTA of a national screening programme for atrial fibrillation in primary care
Health Information and Quality Authority
21
Figure 5.5 Baseline incidence of haemorrhagic stroke by age
5.2.3 Probability of an ischaemic stroke being fatal in the absence of AF
Not only does AF increase the chances that a stroke will occur, but these strokes are
more likely to be fatal and those who do survive are left with a greater degree of
functional impairment than non-AF strokes.(18) In order to capture this, the model
applied the baseline probability that a first-ever non-AF stroke is fatal to those
without the arrhythmia and applied the appropriate relative risk to those with AF (the
risk of stroke associated with AF is dealt with separately further on).
The probability of a first ever non-AF ischaemic stroke being fatal was estimated by
age, using HIPE data on the percentage of cases that died in hospital (discharge
code of 06 [Died with post mortem] or 07 [Died no post mortem]). This parameter
was modelled as a 3rd order polynomial (Figure 5.6).
Figure 5.6 Probability of a non-AF ischaemic stroke being fatal
5.2.4 Probability of a haemorrhagic stroke being fatal in the absence of AF
The probability of a first ever non-AF haemorrhagic stroke being fatal, was estimated
by age, using HIPE data on the percentage of non-AF haemorrhagic stroke cases
0.0000
0.0010
0.0020
0.0030
50 55 60 65 70 75 80 85
Inci
den
ce
Age
Modelled HIPE data
0
0.1
0.2
0.3
0.4
50 55 60 65 70 75 80 85 90
Pro
bab
ility
of
b
ein
g fa
tal
Age
HIPE data Modelled

HTA of a national screening programme for atrial fibrillation in primary care
Health Information and Quality Authority
22
that died in hospital (discharge code of 06 [Died with post mortem] or 07 [Died no
post mortem]). This parameter was modelled as a 3rd order polynomial (Figure 5.7).
Figure 5.7 Probability of a non-AF haemorrhagic stroke being fatal
5.2.5 Relative risk of a ischaemic stoke in patients with AF
AF increases the risk of stroke. Therefore, it was necessary to estimate the relative
risk of stroke by age, in those without AF (already covered above) and those with AF
who are not receiving treatment. The best evidence on the relative risk of stroke
associated with AF comes from the Framingham Heart Study, which examined a
cohort of 5,070 men and women free of cardiovascular disease (including atrial
fibrillation) at baseline every two years during a 34-year follow up period prior to the
widespread use of oral anticoagulation.(2) Results of this study found that the risk of
stroke is not uniform across all age groups. Relative risk of stroke associated with AF
by age group (adjusted for other stroke risk factors [hypertension, coronary heart
disease and cardiac failure]) is shown in Figure 5.8. This was modelled as a 5th order
polynomial. The study included both ischaemic and haemorrhagic strokes, whereas
ischaemic strokes are primarily of interest for this analysis. However they report that
“stroke events resulting from haemorrhage accounted for only 11.6% of the total,
and their exclusion would not appreciably influence the results of the analyses”.(2)
0
0.1
0.2
0.3
0.4
0.5
0.6
50 55 60 65 70 75 80 85 90
Pro
bab
ility
of
b
ein
g fa
tal
Age
HIPE Data Modelled

HTA of a national screening programme for atrial fibrillation in primary care
Health Information and Quality Authority
23
Figure 5.8 Relative risk of stroke in AF versus non-AF patients, adjusted
for other risk factors
Although there is some evidence to suggest that the risk of stroke varies by how
long someone has had AF, insufficient data are available to reliably model stroke risk
by time since onset of the arrhythmia. The relative risk used in the model was
calculated based on AF patients that were diagnosed at a range of different time
intervals. The limited available data suggest that the risk of stroke is as high, if not
higher, than average immediately after the onset of the arrhythmia, so it is
reasonable to apply the overall average risk within the population to all those with a
diagnosis of AF.(37)
As outlined in the clinical effectiveness section (Chapter 3) a major limitation of the
available evidence is the lack of data on whether those identified through screening
have the same stroke risk profile as those diagnosed in routine care. The analysis
examined the implications of screen-detected AF patients having a lower baseline
risk of stroke and systemic embolism in a scenario analysis where the relative risk of
stroke in undiagnosed versus diagnosed AF was varied between 0.50 and 1.(23)
5.2.6 Relative risk of a fatal ischaemic stroke in patients with AF
As well as stroke incidence, the Framingham study also examined differences in the
severity of AF versus non-AF stroke using the same cohort of 5,070 people in which
the link between AF and stroke was first established.(38) During the 40 years of
follow-up there were 501 first-ever ischemic strokes, 103 of which were in people
with a diagnosis of AF. Multivariate regression analysis of 30-day post-stroke
mortality controlling for age, smoking status and coronary heart disease gave an
odds ratio (OR) of 1.84 (95% CI 1.04 to 3.27). When this odds ratio is converted to
a relative risk using the formula,(39)
the relative risk of a fatal stroke with AF is 1.70 (95% CI 1.04 to 2.67).
0
1
2
3
4
5
50 55 60 65 70 75 80 85
Re
lati
ve R
isk
Age
Modelled Framingham data

HTA of a national screening programme for atrial fibrillation in primary care
Health Information and Quality Authority
24
5.2.7 Functional outcomes in survivors of AF and non-AF ischaemic strokes
The Framingham study also reported the proportion of the 150 survivors of first-ever
AF and non-AF ischaemic stroke who had mild, moderate and severe symptoms at
three, six and 12 months post-stroke.(38) Severity of symptoms was classified using a
modified Barthel Index (BI).(40) A score of 40 or less indicated severe dependence in
activities of daily living (ADL), a score of 85 or above indicated mild to no
dependence in ADL, and an intermediate score implied moderate dependence in
ADL. The economic model uses a Markov cycle length of one year, so functional
outcomes at 12 months are used, with an assumption that no further improvement
occurs after that time. Due to the high mortality associated with stroke the number
of survivors at 12 months in the study was small (10 out of 30 in the AF group and
55 out of 120 in the non-AF group), which introduces significant uncertainty in the
estimates. Point estimates for the long term functional outcome for AF and non-AF
stroke patients are provided in Table 5.1.
Table 5.1 Long term functional outcomes for AF and non-AF ischaemic stroke (proportion of stroke survivors in each functional category)
Non-AF AF
Mild or no dependency 0.64 0.40
Moderate dependency 0.25 0.30
Severe dependency 0.11 0.30
5.3 Deaths from other causes
The economic model simulates a cohort of individuals with and without screening in
order to estimate the incremental costs and benefits associated with the
intervention. The model is, by necessity, a vastly simplified representation of real life
that only includes the clinical outcomes that are directly affected by the intervention.
It was also necessary to take account of the fact that people within the cohort can
die as a result of causes other than stroke. To do this, partial all-cause mortality was
calculated, which is the overall pooled mortality rate from all causes other than
stroke and associated sequelae.
Data from the most recent available five-year period (2008-2012) on the number of
deaths from all causes other than stroke (I60-I69) by five-year age group was
obtained from the CSO, along with the corresponding population estimates over that
time period, to calculate the age-specific partial all-cause mortality rate. In the
analysis this outcome was modelled as a 6th order polynomial (see Figure 5.9).

HTA of a national screening programme for atrial fibrillation in primary care
Health Information and Quality Authority
25
Figure 5.9 Mortality rate from all causes other than stroke
5.4 Effectiveness of treatment
Having modelled the risk of stroke for those with and without AF, it was necessary to
estimate the decrease in the risk and severity of stroke associated with treatment, as
this is ultimately what determines the benefit associated with any change in case
detection as a result of screening.
5.4.1 Effect of treatment on stroke risk
There are multiple treatment options for decreasing the risk of stroke in people with
AF. Therefore the effect of treatment in the modelled cohort needs to be a
composite parameter reflecting the proportion of people receiving each type of
treatment and the relative effectiveness of each of these treatments in reducing the
risk of stroke. Data on the current standard of care were obtained from TILDA,
which recorded all medications prescribed for the 161 respondents who reported
having a diagnosis of AF. The percentage of AF patients receiving each type of
treatment based on this data is shown in Table 5.2, which also shows previous
estimates of the standard of care derived from the North Dublin Stroke Study (NDSS,
2006 data) and the Irish National Audit of Stroke Care (INASC, 2007 data).(41;42) The
more recent TILDA data (collected between 2009 and 2011) show a higher
proportion of AF patients receiving oral anticoagulation (OAC). However, the TILDA
data are based on a cohort of people with AF regardless of stroke status, whereas
the other two datasets are derived from cohorts of stroke patients who had a
previous diagnosis of AF, which one would expect to be less well managed given the
fact that a stroke had occurred. A letter circulated by the HSE Medicines
Management Programme reported a threefold increase in direct oral anticoagulant
(DOAC) prescribing rates between 2012 and 2014, with AF accounting for 80% of all
DOAC prescriptions.(43) Given the significant rise in the use of DOACs in Ireland since
the first TILDA survey was completed, the applicability of these data to the present
0.000
0.020
0.040
0.060
0.080
0.100
0.120
0.140
50 55 60 65 70 75 80 85 90
Par
tial
All
Cau
se
Mo
rtal
ity
Rat
e
Age
Modelled CSO data

HTA of a national screening programme for atrial fibrillation in primary care
Health Information and Quality Authority
26
day is questionable. The TILDA dataset has recently been linked to the Primary Care
Reimbursement Service (PCRS) database, which provides more recent treatment
information for those who were identified as having a history of AF. Data from a total
of 68 patients indicate that there has been an increase in both the use of DOACs and
the total proportion of AF patients receiving OAC (Table 5.2). However given the low
number of patients and the fact that the standard of care for people diagnosed
before the widespread use of DOACs may differ from that of newly diagnosed AF
cases, this is probably an underestimate of the total proportion of AF patients taking
DOACs. Unpublished data from the AF screening pilot carried out by the HSE Stroke
Programme in the first half of 2014 shows that a significantly higher proportion of
new AF cases were prescribed DOACs compared with the other data sources (Table
5.2.(44) The most recent PCRS data for overall DOAC use across all indications
(October 2014) indicates that DOACs accounted for 35% of all patients taking oral
anticoagulants (either DOACs or warfarin). UK data indicate that primary care
centres with a sustained focus on optimal treatment for AF achieve OAC rates of
around 60%.(45) This is consistent with the 2014 Irish data for warfarin and DOACs
combined (59% to 66%). The UK data also show that increases in OAC rates
correspond with decreases in the use of antiplatelet therapy, while the proportion of
patients receiving neither treatment remains relatively constant at around 10%.
Table 5.2 Estimated current standard of care for AF patients in Ireland
Population Data Source Warfarin DOACs Antiplatelet None
AF population
TILDA (2009-2011, n=161)
38% 5% 47% 10%
TILDA/PCRS (2014, n=68)
50% 9% 28% 13%
AF Screening Pilot (2014, n=51)
26% 40% 18% 16%
Stroke population
NDSS (2006) 28% - 55% 17%
INASC (2007) 26% - 52% 22%
Model estimate*
Combination of Irish and UK data
39% 21% 30% 10%
* UK primary care data from 2014 showing overall OAC rates of 60% and 2014 Irish PCRS data
indicating that 35% of OAC patients are prescribed DOACs
In the primary analysis the current standard of care was estimated using an
assumption that a total of 60% of newly diagnosed AF patients will receive OAC,
with 35% of these being prescribed DOACs. These were modelled using a Dirichlet
distribution to capture the uncertainty around these parameters. A sensitivity
analysis was performed to examine the effect of varying these assumptions and to
assess the potential impact of increasing rates of OAC and DOAC use.
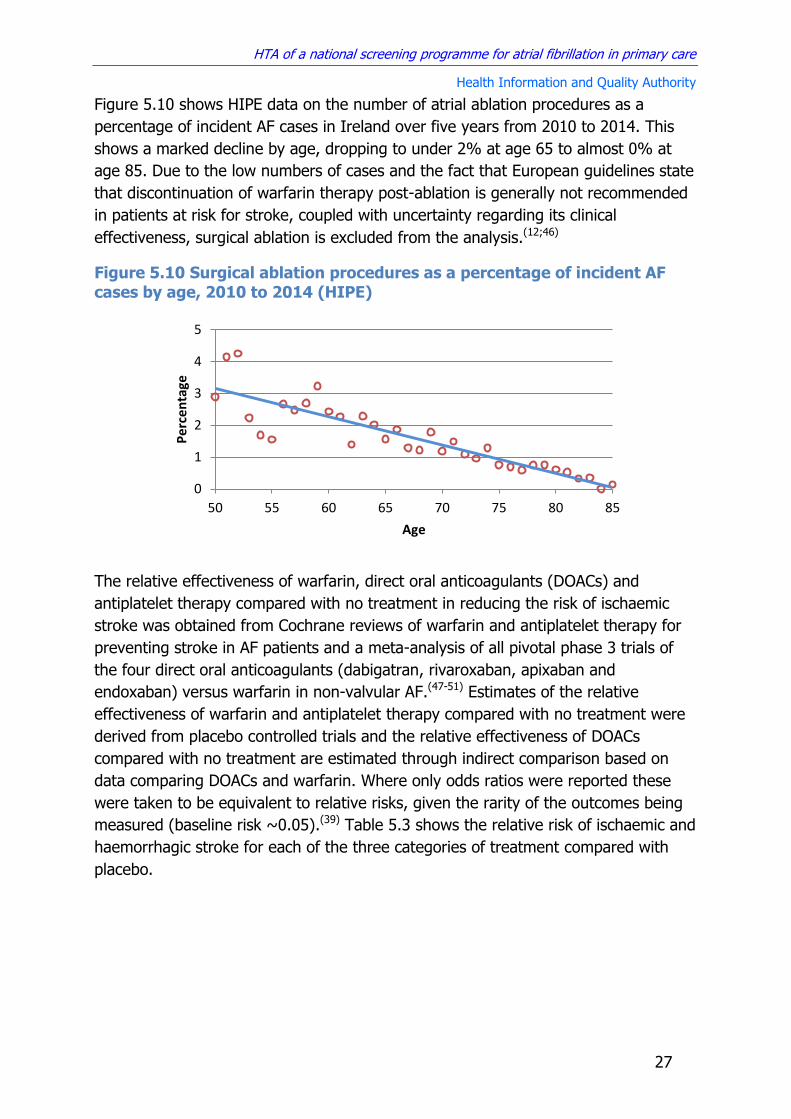
HTA of a national screening programme for atrial fibrillation in primary care
Health Information and Quality Authority
27
Figure 5.10 shows HIPE data on the number of atrial ablation procedures as a
percentage of incident AF cases in Ireland over five years from 2010 to 2014. This
shows a marked decline by age, dropping to under 2% at age 65 to almost 0% at
age 85. Due to the low numbers of cases and the fact that European guidelines state
that discontinuation of warfarin therapy post-ablation is generally not recommended
in patients at risk for stroke, coupled with uncertainty regarding its clinical
effectiveness, surgical ablation is excluded from the analysis.(12;46)
Figure 5.10 Surgical ablation procedures as a percentage of incident AF
cases by age, 2010 to 2014 (HIPE)
The relative effectiveness of warfarin, direct oral anticoagulants (DOACs) and
antiplatelet therapy compared with no treatment in reducing the risk of ischaemic
stroke was obtained from Cochrane reviews of warfarin and antiplatelet therapy for
preventing stroke in AF patients and a meta-analysis of all pivotal phase 3 trials of
the four direct oral anticoagulants (dabigatran, rivaroxaban, apixaban and
endoxaban) versus warfarin in non-valvular AF.(47-51) Estimates of the relative
effectiveness of warfarin and antiplatelet therapy compared with no treatment were
derived from placebo controlled trials and the relative effectiveness of DOACs
compared with no treatment are estimated through indirect comparison based on
data comparing DOACs and warfarin. Where only odds ratios were reported these
were taken to be equivalent to relative risks, given the rarity of the outcomes being
measured (baseline risk ~0.05).(39) Table 5.3 shows the relative risk of ischaemic and
haemorrhagic stroke for each of the three categories of treatment compared with
placebo.
0
1
2
3
4
5
50 55 60 65 70 75 80 85
Pe
rcen
tage
Age
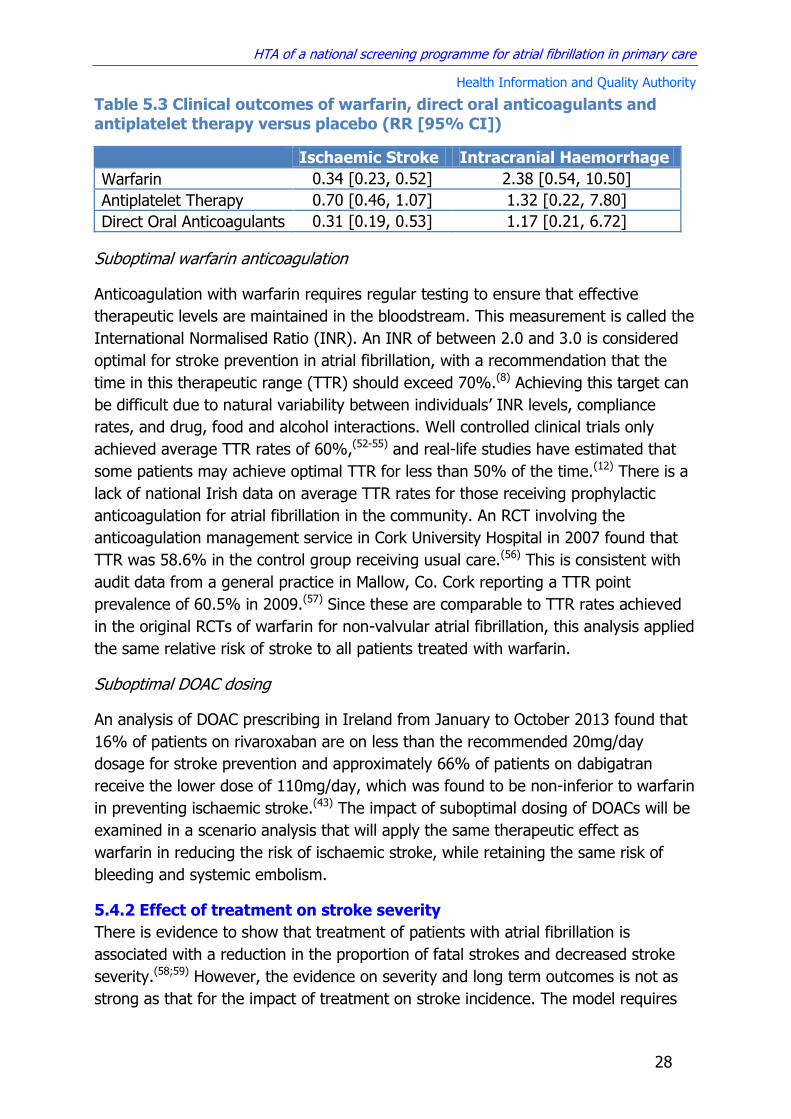
HTA of a national screening programme for atrial fibrillation in primary care
Health Information and Quality Authority
28
Table 5.3 Clinical outcomes of warfarin, direct oral anticoagulants and
antiplatelet therapy versus placebo (RR [95% CI])
Ischaemic Stroke Intracranial Haemorrhage
Warfarin 0.34 [0.23, 0.52] 2.38 [0.54, 10.50]
Antiplatelet Therapy 0.70 [0.46, 1.07] 1.32 [0.22, 7.80]
Direct Oral Anticoagulants 0.31 [0.19, 0.53] 1.17 [0.21, 6.72]
Suboptimal warfarin anticoagulation
Anticoagulation with warfarin requires regular testing to ensure that effective
therapeutic levels are maintained in the bloodstream. This measurement is called the
International Normalised Ratio (INR). An INR of between 2.0 and 3.0 is considered
optimal for stroke prevention in atrial fibrillation, with a recommendation that the
time in this therapeutic range (TTR) should exceed 70%.(8) Achieving this target can
be difficult due to natural variability between individuals’ INR levels, compliance
rates, and drug, food and alcohol interactions. Well controlled clinical trials only
achieved average TTR rates of 60%,(52-55) and real-life studies have estimated that
some patients may achieve optimal TTR for less than 50% of the time.(12) There is a
lack of national Irish data on average TTR rates for those receiving prophylactic
anticoagulation for atrial fibrillation in the community. An RCT involving the
anticoagulation management service in Cork University Hospital in 2007 found that
TTR was 58.6% in the control group receiving usual care.(56) This is consistent with
audit data from a general practice in Mallow, Co. Cork reporting a TTR point
prevalence of 60.5% in 2009.(57) Since these are comparable to TTR rates achieved
in the original RCTs of warfarin for non-valvular atrial fibrillation, this analysis applied
the same relative risk of stroke to all patients treated with warfarin.
Suboptimal DOAC dosing
An analysis of DOAC prescribing in Ireland from January to October 2013 found that
16% of patients on rivaroxaban are on less than the recommended 20mg/day
dosage for stroke prevention and approximately 66% of patients on dabigatran
receive the lower dose of 110mg/day, which was found to be non-inferior to warfarin
in preventing ischaemic stroke.(43) The impact of suboptimal dosing of DOACs will be
examined in a scenario analysis that will apply the same therapeutic effect as
warfarin in reducing the risk of ischaemic stroke, while retaining the same risk of
bleeding and systemic embolism.
5.4.2 Effect of treatment on stroke severity
There is evidence to show that treatment of patients with atrial fibrillation is
associated with a reduction in the proportion of fatal strokes and decreased stroke
severity.(58;59) However, the evidence on severity and long term outcomes is not as
strong as that for the impact of treatment on stroke incidence. The model requires

HTA of a national screening programme for atrial fibrillation in primary care
Health Information and Quality Authority
29
data on mortality at one year, as well as the proportion of survivors who are left with
mild, moderate or severe functional deficits. Two recent systematic reviews of stroke
severity in patients with atrial fibrillation who were receiving prior antithrombotic
therapy identified a total of 11 relevant studies.(60;61) Of these, five reported data on
the incidence of fatal stroke for those receiving no treatment, antiplatelet therapy, or
therapeutic (INR≥2) and subtherapeutic (INR<2) warfarin.(58;59;61-63) Figure 5.11
shows a meta-analysis of all studies reporting short term mortality (at 30 days or
prior to discharge) for patients with atrial fibrillation by type of prior treatment. Both
therapeutic and subtherapeutic levels of warfarin are associated with a statistically
significant decrease in the risk of fatal stroke, unlike antiplatelet therapy, which
showed no difference. In the model, the estimated TTR point prevalence in Ireland
of 60% was used to calculate a weighted relative risk of 0.67 (95% CI 0.54 to 0.86)
of a stroke causing death for those receiving warfarin treatment. The relative risk for
those receiving DOACs was assumed to be equivalent to therapeutic warfarin (RR
0.59 [95% CI 0.46 to 0.76])
As described earlier, long term functional outcomes from AF versus non-AF stroke
were taken from the Framingham Study, which used the modified Barthel Index to
measure the percentage of survivors with mild, moderate and severe impairment at
one year post-stoke. None of the studies examining the impact of prior treatment on
stroke severity report this outcome. The best available evidence comes from a 2003
US study that reported functional outcomes at discharge as measured using the
modified Rankin Scale (mRS), which classified strokes as severe (mRS=5), major
(mRS = 3,4) and minor (mRS=0,1,2).(58) Although this categorisation is slightly
different to the Framingham study, if it is assumed that the relative differences
between each category as a result of prior treatment are broadly consistent, and that
functional outcomes at discharge are directly correlated with long term outcomes
then this can be used to estimate the impact of prior treatment on stroke outcomes.
As before the impact of warfarin on stroke severity was calculated as a weighted
average using a TTR point prevalence of 60%, and in the absence of specific data on
DOACs, it was assumed they were equivalent to therapeutic warfarin (INR≥2).
Figure 5.12 shows the results for non-AF strokes, as well as AF strokes with each
type of prior treatment.
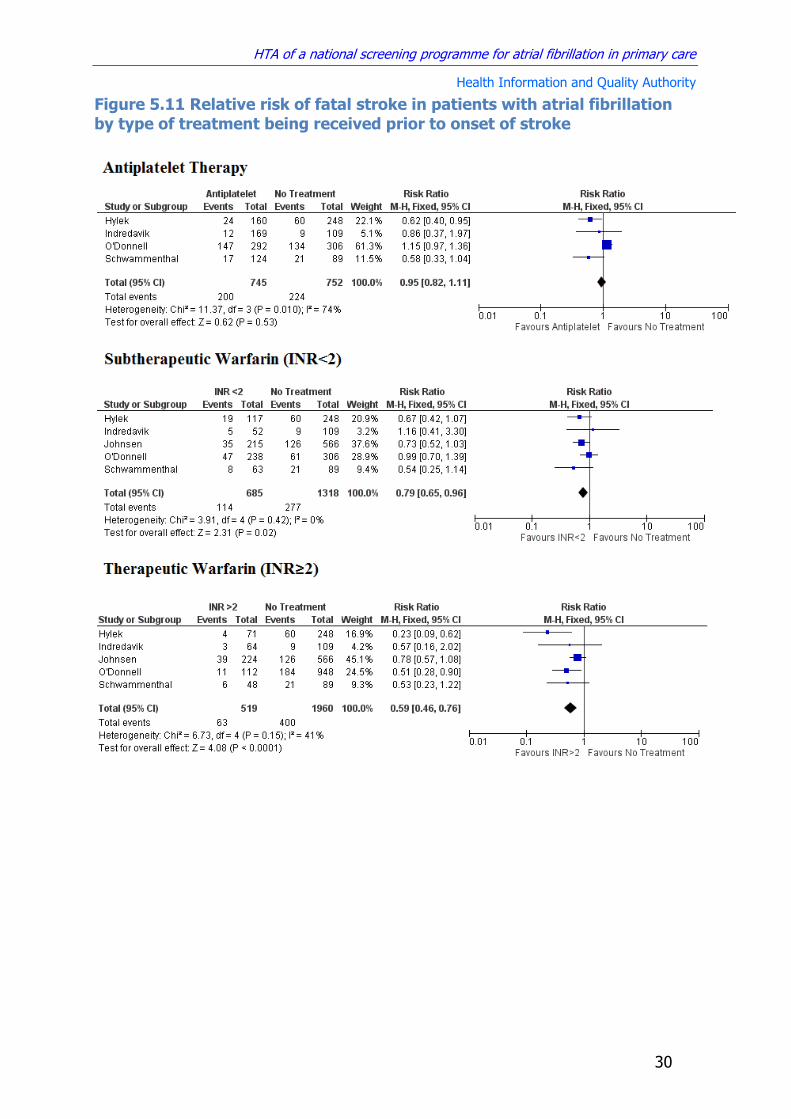
HTA of a national screening programme for atrial fibrillation in primary care
Health Information and Quality Authority
30
Figure 5.11 Relative risk of fatal stroke in patients with atrial fibrillation
by type of treatment being received prior to onset of stroke

HTA of a national screening programme for atrial fibrillation in primary care
Health Information and Quality Authority
31
Figure 5.12 Percentage of survivors with severe, moderate or mild
impairment post-stroke, by type of prior treatment
5.4.3 Other effects of treatment
As well as changing the risk of ischaemic stroke and intracranial haemorrhage,
antithrombotic treatment can also affect the risk of gastrointestinal bleeding and
systemic embolism. In order to include this in the model, it was necessary to
estimate the baseline risk of both these events in people with atrial fibrillation, as
well as the relative risk associated with the three type of treatment included in the
model (antiplatelet, warfarin, DOACs).
The average baseline risk of systemic (non-central nervous system [CNS]) embolism
and major extracranial bleeds in untreated AF patients without a history of stroke
was obtained from randomised trials that included a placebo control arm (see Table
5.4).(47;48) Confidence intervals were approximated using the formula:
30 24 19 15 11
30 28 32
31 26
40 48 49 54 64
AF - No Treatment
AF - Antiplatelet AF - Warfarin AF - DOAC No AF
Severe Moderate Mild

HTA of a national screening programme for atrial fibrillation in primary care
Health Information and Quality Authority
32
Table 5.4 Risk of systemic embolism and major extracranial bleed in
patients with atrial fibrillation not receiving antithrombotic therapy
RCT Systemic Embolism
Total Major Extracranial
Bleed Total
AFASAK1 2 315 0 315
LASAF 0 91 NR NR
SPAF1 4 527 8 527
BAATAF 0 201 8 201
CAFA 2 184 2 184
SPINAF 1 265 4 265
Total 9 1,583 22 1,492
Baseline Rate [95% CI]
0.006 [0.002, 0.009]
0.014 [0.009, 0.021]
The relative risk of systemic embolism and major bleeding associated with warfarin,
direct oral anticoagulants (DOACs) and antiplatelet therapy was obtained from
Cochrane reviews of warfarin and antiplatelet therapy for preventing stroke in AF
patients and a meta-analysis of all pivotal phase 3 trials of the four direct oral
anticoagulants (dabigatran, rivaroxaban, apixaban and endoxaban) versus warfarin
in non-valvular AF.(47-50) Where only odds ratios were reported these were taken to
be equivalent to relative risks, given the rarity of the outcomes being measured.(39)
Table 5.5 shows the relative risk of embolism and bleeds for each of the three
categories of treatment versus placebo.
Table 5.5 Relative risk of systemic embolism and major bleeding
associated with antithrombotic treatment in AF
Gastrointestinal Bleeding Systemic Embolism
Warfarin 1.07 [0.53, 2.12] 0.45 [0.13, 1.57]
Antiplatelet Therapy 1.14 [0.44, 2.98] 0.67 [0.19, 2.33]
Direct Oral Anticoagulants 1.34 [0.54, 3.29] 0.41 [0.11, 1.60]
As is evident from the wide confidence intervals around these relative risks, there is
a high degree of uncertainty in relation to the relative risk of gastrointestinal
bleeding and systemic embolism associated with the different antithrombotic
treatment options for atrial fibrillation. There is also a lack of reliable evidence on the
subsequent impact, if any, of these on mortality rates. These outcomes were
therefore incorporated into the analysis using estimates of their effect on health-
related quality of life and the duration of that effect. These estimates are provided in
Section 6.5.
5.5 Effectiveness of screening
Estimates of the effectiveness of screening at increasing the detection of new cases
of AF are taken from the Cochrane review of this topic, which was updated as part of

HTA of a national screening programme for atrial fibrillation in primary care
Health Information and Quality Authority
33
this project.(18) The results of this review are discussed in Chapter 3. The primary
source of information is the UK SAFE trial, which compared opportunistic screening
(by pulse palpation in GP practices followed by ECG if irregular) and systematic
screening (by ECG) to routine care.(19) They found that both types of screening
programme were equally as effective at detecting new AF cases compared with usual
care (OR 1.6), but that systematic screening costs substantially more. This study also
provided results for the sensitivity and specificity of pulse palpation and ECG in AF
detection, which varied depending on who carried the test and what type of ECG
was performed (Table 5.6).(19;64)
Table 5.6 Sensitivity and specificity of pulse palpation and ECG
Test Sensitivity Specificity
Pulse palpation
GP or Nurse 87.2 81.3
ECG
12-Lead
CDSS 83.3 99.1
GP 79.8 91.6
Nurse 77.1 85.1
GP & CDSS 91.9 91.1
Limb lead
GP 82.5 88.5
Nurse 72 83.4
Chest lead
GP 84.8 86.4
Nurse 68.7 82.8 CDSS – Clinical decision support system
Evaluating the effectiveness of opportunistic screening for atrial fibrillation presents a
number of unique challenges. The arrhythmia may be paroxysmal and therefore not
always present when the index test is performed. This complicates any analysis
based on the sensitivity and specificity of the test. There is also uncertainty relating
to uptake and GP attendance rates, which influences how often the average person
with undiagnosed AF will get tested. This may be especially important if there is an
association between healthcare utilisation and undiagnosed AF. Detection of the
arrhythmia requires that an undiagnosed person attends a GP, agrees to screening,
is in atrial fibrillation when the test is performed and that the arrhythmia is
successfully detected by the test. In terms of evaluating the impact of screening
versus no-screening, the uncertainty regarding the baseline detection rate of atrial
fibrillation in the absence of screening as a result of routine care must be considered.

HTA of a national screening programme for atrial fibrillation in primary care
Health Information and Quality Authority
34
5.5.1 GP attendance rates
GP attendance rates for those aged 50 to 85 were obtained from TILDA (2011) and
the Living in Ireland Survey (2004).(65;66) There was some discrepancy between the
two, with the earlier survey reporting higher frequency of attendance for those over
65 years (Figure 5.13). In the primary analysis, it was assumed that all those in the
screening cohort attend a GP consultation at least once a year.
Figure 5.13 Annual number of GP visits by age
5.5.2 Uptake of opportunistic screening
Data on uptake rates of opportunistic screening was obtained from the SAFE study.
This found that 69.2% of patients consented to having their pulse palpated and
65.9% of patients found to have an irregular pulse agreed to have an ECG. Patients
are considered to have accepted an offer of screening if they complete the two
stages of the screening test. This reduces the combined uptake rate to 45.6%.
However, of the people who declined an ECG, 45.5% already had a diagnosis of AF.
When these were excluded from both the numerator and denominator then the rate
of uptake of ECG is 79.0%, and the combined uptake rate is 54.7%.
Since pulse palpation by GPs is a recognised component of routine care it is likely
that acceptance rates among a prospective screening cohort in a real life setting
would be greater than that observed in an RCT, which required patients to provide
formal consent as trial participants. It was therefore assumed that all patients will
agree to have their pulse palpated and that all those with an irregular pulse will
agree to have an ECG. A sensitivity analysis was carried out to examine the impact
of significant numbers of patients either failing to attend at least one GP consultation
per year or declining to be screening, by varying the uptake rate between 50% and
100%.
5.5.3 AF detection rates
National UK data on AF prevalence is routinely collected in each commissioning
group as part of the NHS Quality Outcomes Framework (QOF). By comparing
0
2
4
6
8
10
50 55 60 65 70 75 80 85
Ave
rage
An
nu
al G
P V
isit
s
Age
Living in Ireland TILDA

HTA of a national screening programme for atrial fibrillation in primary care
Health Information and Quality Authority
35
observed to expected cases in all GP practices, clinical commissioning groups and for
the whole of the country, Public Health England recently estimated that overall
diagnosis rates for AF in the absence of screening were approximately 65%.(67) In
Ireland the TILDA study screened approximately 5,000 people from a nationally
representative sample of over 50s and found that approximately 60% of people with
AF were unaware that they had the arrhythmia.(31) This difference is assumed to be
as a result of the incentives in place to promote AF diagnosis in primary care in the
UK. In the model, it was assumed that approximately 60% of incident AF cases are
diagnosed by routine care, and the impact of uncertainty was examined using
sensitivity analysis. The primary estimate is consistent with recent data collected
from nine European countries in the EORP-AF Pilot registry, which reported that 40%
of AF patients were asymptomatic.(68)
In this analysis it was assumed that opportunistic screening involves pulse palpation
followed by an ECG read by a GP with the support of computer software, with a
diagnosis requiring a positive result in both. Therefore the overall sensitivity of this
two stage test is:
Using values from Table 5.6, this gives a sensitivity of 80.1%.
The average person will attend a GP consultation more than once a year. If they are
tested each time the overall sensitivity will increase, since a diagnosis is made if the
person tests positive either time:
For example, if a person was tested twice a year the sensitivity increases from 80%
to 96% and if tested every time they attend the probability of being detected
approaches 100% (average attendance rate in screening cohort is >4 per year).
However, the direct application of the sensitivity of the screening test in this way
risks significantly overestimating the proportion of AF patients who would be
detected with screening. The data are derived from a trial that involved once-off
pulse palpation during the course of one year, rather than repeat testing every time
the patient attended, or annual testing over the course of multiple years. Therefore
it is risky to assume that those who were not picked up in the first test have an 80%
probability of being picked up in each subsequent test. Rather it is likely that factors
such as whether asymptomatic AF is paroxysmal or persistent, or has atypical
electrocardiographic presentation, make undetected cases more likely to remain
undetected.
In this analysis it was assumed that people are opportunistically screened once a
year when they attend their GP and that the sensitivity of the test in detecting

HTA of a national screening programme for atrial fibrillation in primary care
Health Information and Quality Authority
36
incident cases is 80%. In the primary analysis the conservative assumption was
adopted that false negatives are not detected in subsequent screening tests. A
scenario analysis examined the impact of a screening test that has a consistent 80%
sensitivity in detecting both incidence and prevalent cases every year. The sensitivity
of the test itself was also varied to estimate the impact of uncertainty in the estimate
of the effectiveness of pulse palpation and GP-based ECG.
Limitations associated with the approach to estimating the impact of screening in
Ireland are that it may overestimate the increase in the detection of AF due to a lack
of data on the impact of paroxysmal AF on detection rates. This would tend to make
screening appear more effective. Results obtained using the proposed approach
show a greater increase in detection compared with directly transposing the absolute
difference in the percentage of new cases detected in the treatment and control
arms of the SAFE study. Using this method would mean applying a 10% increase in
observed prevalence in the screened cohort (absolute increase in AF cases was 22%
in screening arm compared with 10% in control arm), giving observed prevalences of
75% with screening (versus the model estimate of 80%). However, differences in
the baseline prevalence of AF in the different arms of the trial, along with the fact
that the majority of new AF cases in the treatment arm were detected outside of the
screening programme, make such direct transposition to the absolute results
problematic.
5.6 Long-term stroke survival
Screening is primarily designed to detect AF prior to the occurrence of stroke, since
investigating whether not the arrhythmia is present after a stroke is standard
practice for informing ongoing management of the patient. Therefore it is the
incidence and severity of first-ever stroke that should differ between screened and
unscreened populations, rather than the clinical outcomes after a stroke has
occurred. For this reason the analysis estimates the overall average life expectancy
and health-related quality of life after a stroke, by age and stroke severity. It does
not separately model stroke recurrence or survival post-stroke by AF status or by
type of treatment. There are some potential limitations of this approach. If screening
and subsequent treatment were extremely effective then overall average survival
would be improved because fewer patients with AF would have a stroke and given
the association between AF strokes and worse outcomes, there would be fewer
severe strokes. However given the challenges associated with detection and
treatment, which mean that not all AF cases are detected and not all future strokes
in detected cases are avoided through treatment, coupled with that fact that AF is
implicated in a minority (~30%) of all strokes, overall population averages for stroke
outcomes are unlikely to be significantly affected by screening. Another limitation is
that by failing to model differences in post-stroke outcomes by treatment, the
analysis will not be able to draw conclusions about the effectiveness and cost-

HTA of a national screening programme for atrial fibrillation in primary care
Health Information and Quality Authority
37
effectiveness of competing treatment alternatives for those who experience a stroke.
However this is beyond the scope of this project and the data required to carry out
such an analysis are not readily available.
5.6.1 Ischaemic stroke
Survival by severity of initial stroke was reported from the Oxford Vascular Study
between 2002 and 2012.(69) Strokes were classified using the NIH stroke scale as
minor (NIHSS≤3), moderate (NIHSS 4-10) or severe (NIHSS≥10). Survival to five
years is shown in Figure 5.14. Their results show an initial drop in survival due to
short term case fatality (at one month or hospital discharge), which was accounted
for separately in this HTA as the incidence of fatal stoke. Therefore in the analysis it
was necessary to adjust the UK data to estimate long-term survival by stroke
severity for those who have survived to hospital discharge (Figure 5.15). The results
show that for patients who survive the initial insult, survival is not linear. Rather, a
steeper reduction is observed in the first year compared with years’ two to five. The
increase in mortality in the first year increases with stroke severity, while the
mortality rate after year one is similar for all strokes.
Figure 5.14 Survival to five years by severity of ischaemic stroke
Figure 5.15 Survival to five years by severity of stroke for those who
survive the initial ischaemic stroke
1 Y
ear
1 m
on
th
0
0.2
0.4
0.6
0.8
1
0 1 2 3 4 5
Surv
ival
Years
Mild Moderate Severe
0
0.2
0.4
0.6
0.8
1
0 1 2 3 4 5
Surv
ival
Years
Mild Moderate Severe

HTA of a national screening programme for atrial fibrillation in primary care
Health Information and Quality Authority
38
Using this data the annual probability of death by severity of stroke (in the first and
subsequent years separately) was estimated as the slope of the survival curve (Table
5.7).
Table 5.7 Annual probability of death in year one and subsequent years by severity of ischaemic stroke
Year 1 Subsequent years
Mild 0.10 0.06
Moderate 0.23 0.06
Severe 0.40 0.06
Care has to be taken when estimating rates from survival curves, since it is incorrect
to say that the slope of the curve is equivalent to the annual mortality rate (which
will vary over time with decreasing population).(70) However in the Markov model, it
was necessary to estimate the annual probability of death in each of the stroke
states (mild, moderate, severe) if a person has survived the previous year, so the
denominator is always one, making the probability of death equal to the slope of the
survival curve for the corresponding time period.
The average age of patients in the Oxford Vascular Study was 75 years. To estimate
survival by age the relative risk of death in year one and subsequent years was
compared with the baseline mortality rate at that age without stroke (partial all
cause mortality, see Section 5.3 above). Figure 5.16 shows the annual probability of
death in each stroke state by age. As an example, the dashed line shows annual
mortality probabilities for a person who survives a severe stroke at age 75. They
would have a normal annual risk of death prior to the stroke, which would be
significantly elevated in the year following the (severe) stroke before decreasing
after the first year to a level in excess of non-stroke mortality risk.
Figure 5.16 Annual risk of death by age and severity of ischaemic stroke
0.0
0.1
0.2
0.3
0.4
0.5
50 55 60 65 70 75 80 85
ACM No Stroke ACM from 1 year post-stroke
ACM mild stroke yr 1 ACM moderate stroke yr 1
ACM severe stroke yr 1 Severe stroke at 75

HTA of a national screening programme for atrial fibrillation in primary care
Health Information and Quality Authority
39
5.6.2 Haemorrhagic stroke
Long term survival from haemorrhagic stroke was estimated in a similar manner to
ischaemic stroke. A 2014 systematic review(71) identified three studies that reported
haemorrhagic stroke survival at one and five years in the same study.(72-74) One of
these studies reported a combined outcome of death or stroke recurrence rather
than death alone.(74) Of the remaining two, one reported outcomes in the UK for
both first ever subarachnoid haemorrhage (SAH) and primary intracerebral
haemorrhage (PICH) and the other reported outcomes in Finland for PICH only.(72)
As shown in Figure 5.17, PICH results from both studies were similar and again a
high initial drop in survival corresponding with fatal events was observed, followed
by a relatively steep curve in year one when compared to subsequent years. The
annual probability of death was calculated as the slope of the survival curve using
the combined UK data on SAH and PICH (Figure 5.18 and Table 5.8).
Figure 5.17 Survival to five years for haemorrhagic stroke
Figure 5.18 Survival to five years for those who survive the initial
haemorrhagic stroke
1 m
on
th
1 y
ear
0
0.2
0.4
0.6
0.8
1
0 1 2 3 4 5
Surv
ival
Year
UK ALL UK SAH UK PICH Finland PICH
0
0.2
0.4
0.6
0.8
1
0 1 2 3 4 5
Surv
ival
Year

HTA of a national screening programme for atrial fibrillation in primary care
Health Information and Quality Authority
40
Table 5.8 Annual probability of death in year one and subsequent years by
severity of stroke
Year 1 Subsequent years
Haemorrhagic Stroke 0.14 0.04
The average age of participants in the UK study was 72 years. As before the relative
risk of death in year one and subsequent years compared with the baseline mortality
rate at that age without stroke (partial all cause mortality) was calculated. Figure
5.19 shows the annual probability of death for survivors of haemorrhagic stroke by
age, both in the first and subsequent years. The dashed line shows annual mortality
probabilities for a person who survives a haemorrhagic stroke at age 70.
Figure 5.19 Annual risk of death by age and severity for haemorrhagic
stroke
5.7 Limitations of the clinical and epidemiological data
There are certain limitations to the approach adopted for estimating long term
survival after stroke. While the outcomes for haemorrhagic stroke are taken
exclusively from studies examining SAH and PICH, a minority (17%) of participant in
the study used to estimate survival in ischaemic stroke had either SAH (5%), PICH
(7%) or a stroke of unknown aetiology (5%). However, as outcomes were not
reported separately the combined figure was used, which was assumed to be
indicative of ischaemic stroke since these made up the majority of cases (>83%).
There is also a risk that the relative risk of death calculated based on the mean age
of the study cohorts may not be consistent across all age groups. However, in the
absence of data on different age groups this is a better approach than directly
applying results of the study to all people in the cohort, since this would produce
counterintuitive results (chances of dying decreasing with advancing age) and there
is evidence that mortality risk increases substantially with age.(72) It was also
0.0
0.1
0.2
0.3
0.4
0.5
50 55 60 65 70 75 80 85
An
nu
al P
rob
abili
ty
Age
ACM No Stroke ACM ICH yr 1
ACM ICH from 1 year post-stroke ICH at 70 years

HTA of a national screening programme for atrial fibrillation in primary care
Health Information and Quality Authority
41
assumed that stroke severity at admission (measured by NIHSS) is correlated with
long term functional outcomes (measured by Barthel Index).(75-77) There may also be
differences in survival from iatrogenic stroke as a result of AF treatment compared
with that of the overall haemorrhagic stroke population, however the analysis models
all those who survive a haemorrhagic stroke as a single group, so average survival
rates are sufficient. There is also a risk that the treatment received by stroke
survivors in the studies differs substantially from the current standard of care in
Ireland, which would have implications for the applicability of the results. However
both studies were carried out in a community setting in the UK, which has a
comparable access to treatment, and results for ischaemic stroke are recent enough
to justify an assumption of a comparable mix of available treatments for those who
suffered a stroke (2002-2012). Finally, the analysis uses the best available Irish and
international data on the detection rate of AF in routine care to estimate the
proportion of cases diagnosed at any given time in the absence of screening. In the
absence of any data by age group, it was assumed that the rate of undiagnosed AF
is similar across all ages.

HTA of a national screening programme for atrial fibrillation in primary care
Health Information and Quality Authority
42
6 Utility data
The estimates of the impact of stroke on mortality enable calculation of the likely
effect of screening in terms of life years lost or gained. What it does not take
account for is any change in the quality of life for screened versus unscreened
patients as a result of changes in functional status post-stroke, or treatment related
adverse events, such as GI bleeds, that may not necessarily shorten life expectancy
but are associated with significant morbidity. This information is included in the
analysis using utility weights that measure the degree of impairment associated with
each health state included in the model compared with full health.
6.1 Baseline quality of life by age
Baseline data on mean utility weights for people without atrial fibrillation or stroke by
age were taken from a previously published analysis of data from the Health Survey
for England. This analysis estimated mean EQ-5D scores for the general population,
as well as for those with and without heart problems other than myocardial infarction
or hypertension.(78) In the absence of comparable Irish data it is assumed that both
populations are comparable. This parameter is modelled as a linear function (Figure
6.1).
Figure 6.1 Baseline utility weight estimates by age for those without atrial
fibrillation or stroke
6.2 Quality of life with atrial fibrillation
The model requires an estimate of the impact on quality of life for diagnosed and
undiagnosed AF patients who have not suffered a stroke. It is generally accepted
that AF is associated with a reduced quality of life due to symptoms such as
weakness, fatigue and palpitations, which can be managed to varying degrees with
rhythm or rate control medication.(79) There is also evidence to suggest that those
with undiagnosed AF experience a reduction in quality of life, despite the absence of
overt symptoms, or because moderate symptoms are misattributed.(14;80)
0
0.25
0.5
0.75
1
50 55 60 65 70 75 80 85
Mea
n E
Q-5
D
Age
Data Model

HTA of a national screening programme for atrial fibrillation in primary care
Health Information and Quality Authority
43
Previous studies have estimated a utility weight of 0.81 (95% CI 0.68, 0.91)
associated with diagnosed AF, which was derived using EQ-5D data from a nationally
representative sample of US AF patients without a history of stroke, adjusted for
age, sex and co-morbidities.(81;82) This is consistent with estimate used in the
economic evaluation of the UK SAFE trial.(19) Although TILDA collected data on
quality of life, the numbers of people who reported a diagnosis of AF were relatively
low and quality of life was measured using the CASP-19 tool, rather than the EQ-5D,
which is the tool that was used to estimate baseline utility weights for the general
population in the absence of AF.
Estimating the utility loss associated with undiagnosed AF is more problematic as
there is little evidence on the extent to which people in this cohort are genuinely
asymptomatic, or are experiencing general symptoms such as dyspnoea or
weakness, but lack a definite diagnosis. What evidence is available is derived from
studies that compare diagnosed AF patients who are either asymptomatic or
symptomatic.(14;68) A UK study comparing quality of life (measured using SF-36) in
symptomatic and asymptomatic AF patients (mean age 58 years), and healthy
controls found significantly lower scores in all domains for the symptomatic AF
group, and lower scores in one domain (general health) for the asymptomatic AF
group. Compared with healthy controls, the asymptomatic group had average quality
of life scores that were 6% lower than healthy controls, giving a utility weight of
0.94 (95% CI 0.86, 0.98).(83) Applying this to all undiagnosed AF patients may
underestimate the true utility loss, since it assumes that all undiagnosed patients are
asymptomatic. However any adjustment for this risks overestimating this parameter.
In the analysis the conservative estimate was used in the base case and the
implications of undiagnosed AF being associated with a greater utility loss was
examined in a sensitivity analysis.
Limitations regarding the use of utility data for AF include applicability issues about
using US data in an Irish population and uncertainty about the level of AF symptoms
in the undiagnosed cohort. There are also some recent studies that would appear to
challenge the idea that AF results in poorer quality of life in non-acutely ill older
patient cohorts, finding little or no reduction associated with the arrhythmia in this
population.(84;85) It was also assumed that the quality of life reduction associated
with undiagnosed AF does not decrease as a result of treatment after detection. This
will tend to underestimate the effectiveness of screening if treatment does have a
beneficial effect of the quality of life of previously undiagnosed AF patients. However
in the absence of data for this group a conservative approach was adopted.
6.3 Quality of life decrease associated with treatment
There is evidence to suggest that treatment for atrial fibrillation is associated with
minor reductions in quality of life, unrelated to stroke or complications, as a result of

HTA of a national screening programme for atrial fibrillation in primary care
Health Information and Quality Authority
44
the need for various degrees of ongoing monitoring, required changes in diet or
lifestyle and the potential for adverse side effects. Warfarin, which requires regular
blood tests to monitor INR levels, is associated with a greater degree of utility loss
than antiplatelet or DOAC use. Estimates of the utility loss associated with each type
of treatment are taken from published US survey data from patients with AF taking
warfarin and aspirin, and a US physician survey of quality of life for patients on
ximelagatran (Table 6.1).(86-88)
Table 6.1 Quality of life estimates for antithrombotic treatment
Treatment Utility Weight (95% CI)
Warfarin 0.987 (0.953, 1.00)
DOAC 0.994 (0.975, 1.00)
Aspirin 0.998 (0.994, 1.00)
6.4 Quality of life after a stroke
A meta-analysis of quality of life outcomes for stroke identified 20 studies that
reported outcomes for mild, moderate and severe stroke separately.(89) This found
that severity of stroke and the bounds of the scale used (death or worst possible
outcome to normal, excellent or perfect health) predicted quality of life weights, but
the elicitation method (time trade off, standard gamble, judgement) and type of
respondent (patients, communities) did not. Time trade off elicitation from
community members using a scale of death to perfect health produced pooled
quality-adjusted life year (QALY) weights of 0.52 for major stroke, 0.68 for moderate
stroke, and 0.87 for minor stroke. The same type of respondents, using the same
type of elicitation method but a scale of death to normal health produced
significantly lower pooled weights of 0.28, 0.45 and 0.64 for major, moderate and
minor stroke, respectively. A previous cost-effectiveness study used data from this
meta-analysis to group stroke severity by functional status post stroke according to
whether the person was independent (0.65), moderately dependent (0.46) or totally
dependent (0.30).(81) These estimates are most closely aligned with the Framingham
data on stroke severity used in the analysis, which used the modified Barthel Index
to classify stroke survivors as severely dependent, moderately dependent or with
mild to no dependence. The overall utility weight for haemorrhagic stroke was
calculated as the average utility weight across all survivors using the same weights
and functional outcomes as ischaemic stroke (average utility weight 0.57). A utility
weight of zero was applied to fatal strokes.
6.5 Quality of life decrements for complications and adverse
events
It is assumed that non-central nervous system (CNS) bleeding events and systemic
emboli result in a temporary reduction in quality of life. They are therefore included

HTA of a national screening programme for atrial fibrillation in primary care
Health Information and Quality Authority
45
in the model as utility decrements that are incurred in the year that they happen.
Previously published data estimated a utility decrement (calibrated to apply for one
month) of 0.092 for major bleeding and 0.022 for pulmonary embolism.(90) These
were applied to all major extra-cranial bleeding and systemic embolism events in the
model, with a sensitivity analysis to estimate the impact of uncertainty in relation to
these parameters on the overall cost-effectiveness results.
6.6 Limitations of the utility data
The main limitation in regard to utility data is the lack of published Irish data on
preferences for AF and stroke-related clinical outcomes. In the absence of Irish data,
international estimates from the US and the UK were used, which may differ from
the utility valuation that the Irish population would assign to the various health
states. There is also a high degree of heterogeneity in the published literature for
utility weights associated with mild, moderate and severe stroke. The estimates used
in the model were chosen based on how closely the reported health states aligned
with the categorisations employed in the clinical studies included in this analysis, and
are consistent with those used in cost-effectiveness analyses elsewhere.

HTA of a national screening programme for atrial fibrillation in primary care
Health Information and Quality Authority
46
7 Cost data
Relevant costs included in the analysis include the costs of AF case-finding and
treatment, as well as costs associated with the clinical outcomes that may be
impacted by AF screening. The primary analysis was carried out from the perspective
of the publicly funded health and social care system. The cost-effectiveness of
screening was also estimated using a societal perspective, as there are significant
costs associated with informal care and lost productivity associated with stroke that
are not be borne by the health service. Therefore it was necessary to distinguish
between costs that fall on the health service and those covered by private health
insurers or out of pocket payments. Historical and international costs were converted
to 2014 Euro using the relevant purchasing power parity and inflation rate.(91)
7.1 Cost of screening
Costs of screening include the incremental cost associated with pulse palpation
during routine GP consultations and the cost of ECGs carried out in primary care.
There may also be additional costs generated by the screening programme for
specialist referral or additional tests beyond those normally required for a diagnosis
of AF, or for further testing for incidental findings. However, as these costs are not
directly associated with the screening programme they are not included in the
primary analysis. The impact of including the cost of blood tests and an
echocardiogram for each AF case diagnosed through screening is examined in a
sensitivity analysis and the number of additional specialist referrals due to a
prospective Irish screening programme is estimated based on the available literature.
There are a number of approaches to costing opportunistic screening depending on
how a prospective programme would be funded. The economic analysis carried out
alongside the UK randomised controlled trial (RCT) of screening combined trial data
on the average length of time it took to palpate the pulse and perform an ECG with
labour costs by profession and the cost of ECG consumables to estimate average
costs.(19) However, there are differences in how GP practices are funded in Ireland
and the UK, which may influence how the costs of screening are calculated. In
Ireland, GPs are sole traders operating on a fee-per-service basis, who set their own
fees for private consultations and receive a contract price for patients who qualify for
a medical card or GP visit card. An alternative approach is cost screening using a fee
per service, with set costs being assigned to some or all of the services provided.
This could include a separate cost for pulse palpation and ECG, or simply assigning a
fee for each new case of AF detected. The incremental costs of pulse palpation alone
are likely to be minimal as it is a short procedure that does not require specialised
equipment. Advertised prices for a resting ECG in Ireland range from €30 to
€55.(92;93) Paying a fee per new AF diagnosis would represent a departure from
traditional methods of funding screening in primary care, which would have parallels

HTA of a national screening programme for atrial fibrillation in primary care
Health Information and Quality Authority
47
with the UK QOF system for incentivising and rewarding GP practice. This would be
difficult to reliably model, given the uncertainty about how any such fee would be
calculated and how the system would operate in the context of wider contractual
agreements for the delivery of primary care services in Ireland.
In this analysis pulse palpation was costed based on the opportunity cost of staff
time required to carry out this procedure for all patients in the screening cohort who
attend a GP consultation. Staff time was calculated using the schedule of fees and
allowances payable to doctors participating in the General Medical Services (GMS)
scheme and other community schemes provided through the Primary Care
Reimbursement Service (PCRS). The cost of an ECG for those with an irregular pulse
was taken as the set fee for this test under the GMS scheme and did not include the
capital costs of equipment, since it is assumed that all GP practices are equipped to
perform an ECG. The rationale for this is that the majority of people in an over 65s
screening cohort will have access to GP services paid for by the HSE, through either
a medical card or a GP visit card, so the PCRS fees represents the best estimate of
the marginal costs, as well as the opportunity cost of using that time for another
purpose. However, GP care is not publicly funded for those without a medical card,
apart from some tax relief on medical expenses, so a minority of people in the
screening cohort will be required to pay out of pocket expenses at a higher rate to
access a GP consultation. Also since screening is not part of the current GMS
contract, its inclusion could put upward pressure on the existing schedule of fees and
allowances. To assess the potential impact of this, a sensitivity analysis will be
carried out to examine the impact of varying the cost of screening in the analysis.
Nationally representative TILDA data (n=8175) on the number of people with either
a medical or GP card by age are shown in Figure 7.1.(65) Coverage increases sharply
once people reach 70, as this is the age at which people become eligible to apply for
an over 70s medical or GP visit card, subject to a means test. The total percentage
of people over 65 with access to free GP services is 81%. The opportunity cost of
pulse palpation was included in the cost-effectiveness analysis but not in the budget
impact analysis as the cost of staff time doesn’t represent an additional direct cost to
the HSE.
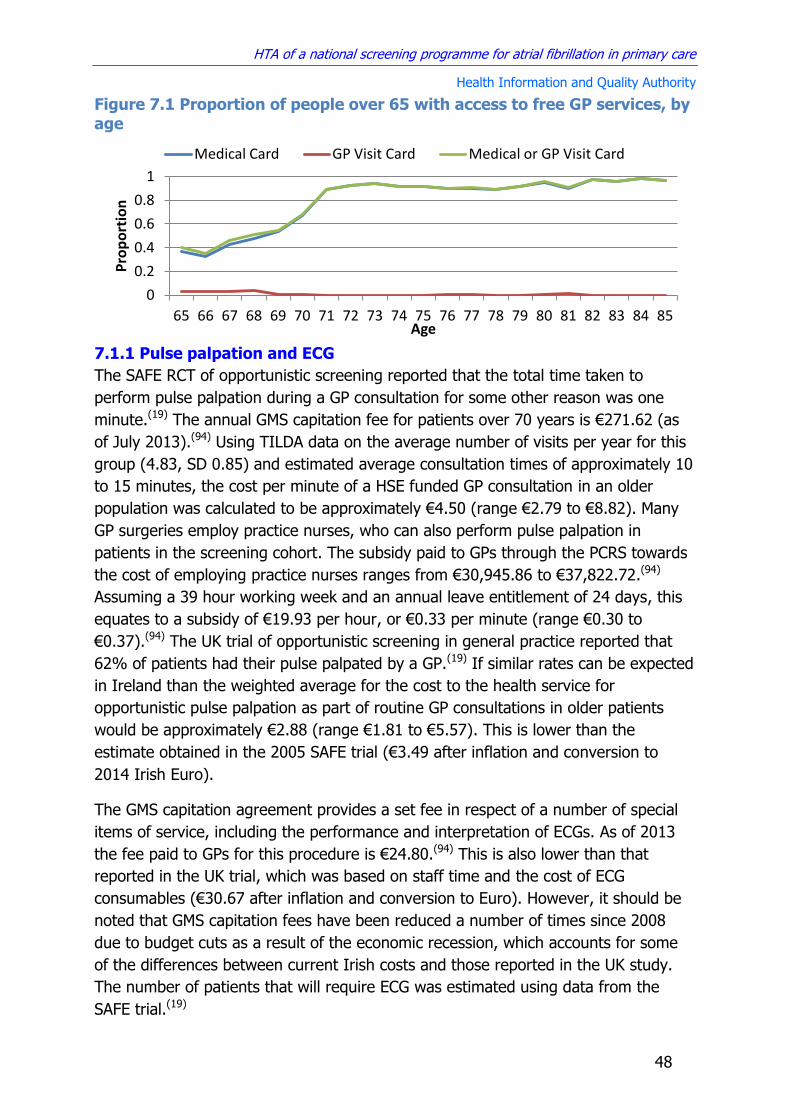
HTA of a national screening programme for atrial fibrillation in primary care
Health Information and Quality Authority
48
Figure 7.1 Proportion of people over 65 with access to free GP services, by age
7.1.1 Pulse palpation and ECG
The SAFE RCT of opportunistic screening reported that the total time taken to
perform pulse palpation during a GP consultation for some other reason was one
minute.(19) The annual GMS capitation fee for patients over 70 years is €271.62 (as
of July 2013).(94) Using TILDA data on the average number of visits per year for this
group (4.83, SD 0.85) and estimated average consultation times of approximately 10
to 15 minutes, the cost per minute of a HSE funded GP consultation in an older
population was calculated to be approximately €4.50 (range €2.79 to €8.82). Many
GP surgeries employ practice nurses, who can also perform pulse palpation in
patients in the screening cohort. The subsidy paid to GPs through the PCRS towards
the cost of employing practice nurses ranges from €30,945.86 to €37,822.72.(94)
Assuming a 39 hour working week and an annual leave entitlement of 24 days, this
equates to a subsidy of €19.93 per hour, or €0.33 per minute (range €0.30 to
€0.37).(94) The UK trial of opportunistic screening in general practice reported that
62% of patients had their pulse palpated by a GP.(19) If similar rates can be expected
in Ireland than the weighted average for the cost to the health service for
opportunistic pulse palpation as part of routine GP consultations in older patients
would be approximately €2.88 (range €1.81 to €5.57). This is lower than the
estimate obtained in the 2005 SAFE trial (€3.49 after inflation and conversion to
2014 Irish Euro).
The GMS capitation agreement provides a set fee in respect of a number of special
items of service, including the performance and interpretation of ECGs. As of 2013
the fee paid to GPs for this procedure is €24.80.(94) This is also lower than that
reported in the UK trial, which was based on staff time and the cost of ECG
consumables (€30.67 after inflation and conversion to Euro). However, it should be
noted that GMS capitation fees have been reduced a number of times since 2008
due to budget cuts as a result of the economic recession, which accounts for some
of the differences between current Irish costs and those reported in the UK study.
The number of patients that will require ECG was estimated using data from the
SAFE trial.(19)
0
0.2
0.4
0.6
0.8
1
65 66 67 68 69 70 71 72 73 74 75 76 77 78 79 80 81 82 83 84 85
Pro
po
rtio
n
Age
Medical Card GP Visit Card Medical or GP Visit Card
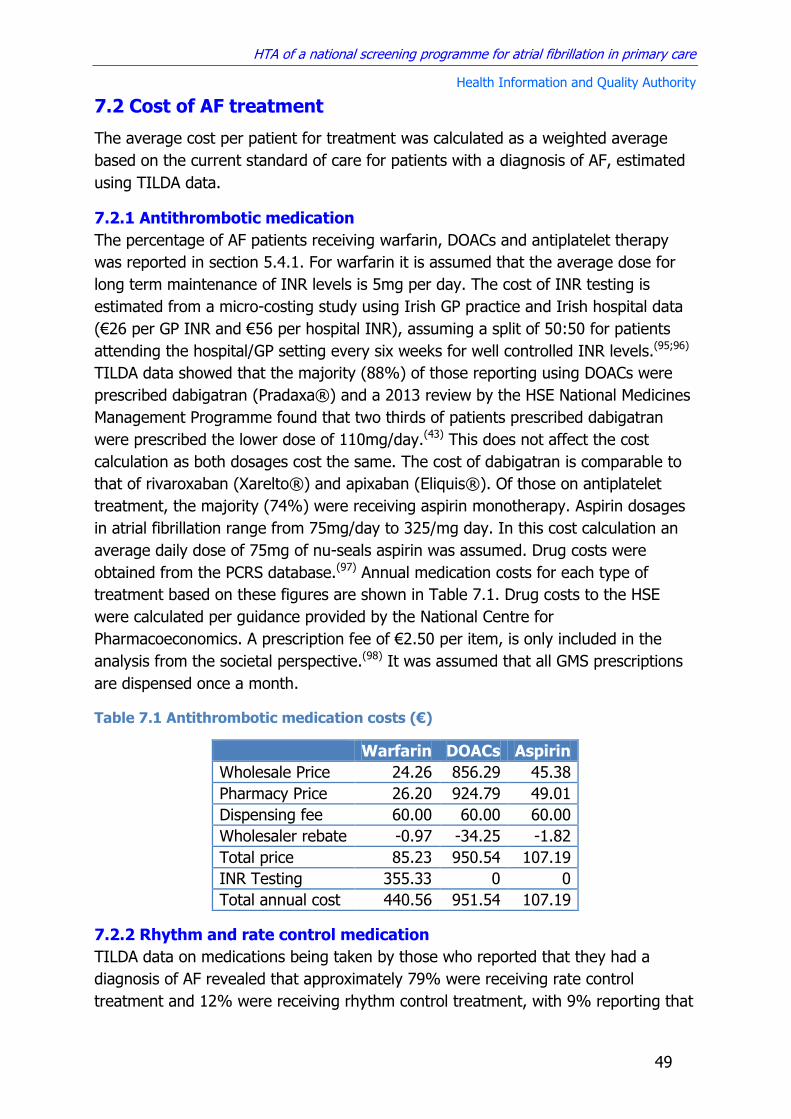
HTA of a national screening programme for atrial fibrillation in primary care
Health Information and Quality Authority
49
7.2 Cost of AF treatment
The average cost per patient for treatment was calculated as a weighted average
based on the current standard of care for patients with a diagnosis of AF, estimated
using TILDA data.
7.2.1 Antithrombotic medication
The percentage of AF patients receiving warfarin, DOACs and antiplatelet therapy
was reported in section 5.4.1. For warfarin it is assumed that the average dose for
long term maintenance of INR levels is 5mg per day. The cost of INR testing is
estimated from a micro-costing study using Irish GP practice and Irish hospital data
(€26 per GP INR and €56 per hospital INR), assuming a split of 50:50 for patients
attending the hospital/GP setting every six weeks for well controlled INR levels.(95;96)
TILDA data showed that the majority (88%) of those reporting using DOACs were
prescribed dabigatran (Pradaxa®) and a 2013 review by the HSE National Medicines
Management Programme found that two thirds of patients prescribed dabigatran
were prescribed the lower dose of 110mg/day.(43) This does not affect the cost
calculation as both dosages cost the same. The cost of dabigatran is comparable to
that of rivaroxaban (Xarelto®) and apixaban (Eliquis®). Of those on antiplatelet
treatment, the majority (74%) were receiving aspirin monotherapy. Aspirin dosages
in atrial fibrillation range from 75mg/day to 325/mg day. In this cost calculation an
average daily dose of 75mg of nu-seals aspirin was assumed. Drug costs were
obtained from the PCRS database.(97) Annual medication costs for each type of
treatment based on these figures are shown in Table 7.1. Drug costs to the HSE
were calculated per guidance provided by the National Centre for
Pharmacoeconomics. A prescription fee of €2.50 per item, is only included in the
analysis from the societal perspective.(98) It was assumed that all GMS prescriptions
are dispensed once a month.
Table 7.1 Antithrombotic medication costs (€)
Warfarin DOACs Aspirin
Wholesale Price 24.26 856.29 45.38
Pharmacy Price 26.20 924.79 49.01
Dispensing fee 60.00 60.00 60.00
Wholesaler rebate -0.97 -34.25 -1.82
Total price 85.23 950.54 107.19
INR Testing 355.33 0 0
Total annual cost 440.56 951.54 107.19
7.2.2 Rhythm and rate control medication
TILDA data on medications being taken by those who reported that they had a
diagnosis of AF revealed that approximately 79% were receiving rate control
treatment and 12% were receiving rhythm control treatment, with 9% reporting that
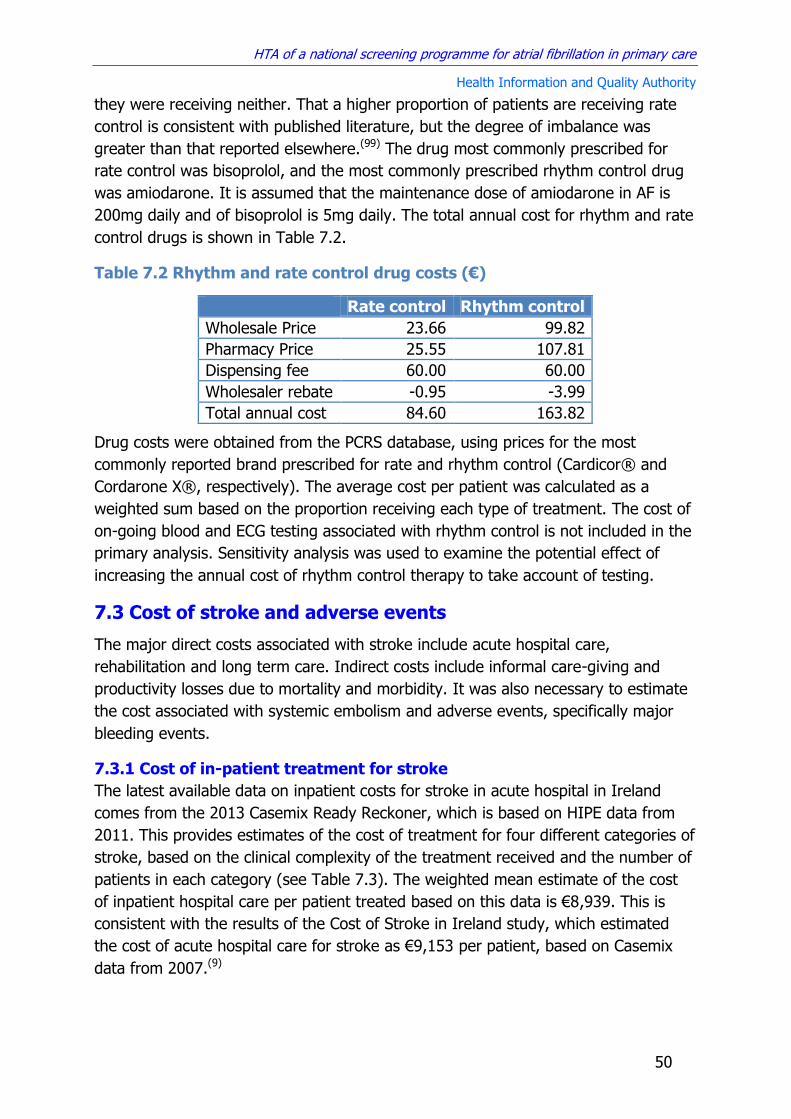
HTA of a national screening programme for atrial fibrillation in primary care
Health Information and Quality Authority
50
they were receiving neither. That a higher proportion of patients are receiving rate
control is consistent with published literature, but the degree of imbalance was
greater than that reported elsewhere.(99) The drug most commonly prescribed for
rate control was bisoprolol, and the most commonly prescribed rhythm control drug
was amiodarone. It is assumed that the maintenance dose of amiodarone in AF is
200mg daily and of bisoprolol is 5mg daily. The total annual cost for rhythm and rate
control drugs is shown in Table 7.2.
Table 7.2 Rhythm and rate control drug costs (€)
Rate control Rhythm control
Wholesale Price 23.66 99.82
Pharmacy Price 25.55 107.81
Dispensing fee 60.00 60.00
Wholesaler rebate -0.95 -3.99
Total annual cost 84.60 163.82
Drug costs were obtained from the PCRS database, using prices for the most
commonly reported brand prescribed for rate and rhythm control (Cardicor® and
Cordarone X®, respectively). The average cost per patient was calculated as a
weighted sum based on the proportion receiving each type of treatment. The cost of
on-going blood and ECG testing associated with rhythm control is not included in the
primary analysis. Sensitivity analysis was used to examine the potential effect of
increasing the annual cost of rhythm control therapy to take account of testing.
7.3 Cost of stroke and adverse events
The major direct costs associated with stroke include acute hospital care,
rehabilitation and long term care. Indirect costs include informal care-giving and
productivity losses due to mortality and morbidity. It was also necessary to estimate
the cost associated with systemic embolism and adverse events, specifically major
bleeding events.
7.3.1 Cost of in-patient treatment for stroke
The latest available data on inpatient costs for stroke in acute hospital in Ireland
comes from the 2013 Casemix Ready Reckoner, which is based on HIPE data from
2011. This provides estimates of the cost of treatment for four different categories of
stroke, based on the clinical complexity of the treatment received and the number of
patients in each category (see Table 7.3). The weighted mean estimate of the cost
of inpatient hospital care per patient treated based on this data is €8,939. This is
consistent with the results of the Cost of Stroke in Ireland study, which estimated
the cost of acute hospital care for stroke as €9,153 per patient, based on Casemix
data from 2007.(9)

HTA of a national screening programme for atrial fibrillation in primary care
Health Information and Quality Authority
51
Table 7.3 Casemix costs for stroke in Ireland in 2011
ADRG code
Description Number of patients
Cost per patient
B70A Stroke and other cerebrovascular disorders with catastrophic complication or comorbidity
949 €2,3643
B70B Stroke and other cerebrovascular disorders with severe complication or comorbidity
1513 €9,973
B70C Stroke and other cerebrovascular disorders without either catastrophic or severe complication or comorbidity
2644 €4,883
B70D Stroke and other cerebrovascular disorders with either death of transfer within 5 days
630 €1,325
This analysis requires estimates of the cost of acute hospital care by severity of
stroke. Two Asian studies examined the impact of acute stroke severity (NIHSS) on
inpatient hospital costs, comparing costs for those with mild, moderate and severe
stokes to the overall average cost.(100;101) While differences in the structure of health
systems limit the transferability of cost data between countries, it was assumed that
the relative impact of stroke severity on inpatient stroke costs should be consistent
across different settings. Table 7.4 shows the results of combining data from these
two studies on relative costs for mild, moderate and severe strokes compared with
the overall average cost and applying it to inpatient stroke costs in Ireland. The
average cost is applied to all fatal ischaemic stroke and all fatal and non-fatal
haemorrhagic strokes. Based on the Cost of Stroke in Ireland study, it was assumed
that 87% of acute hospital costs for stroke are borne by the public health system,
12% by private health insurers and 1% by out of pocket payments by patients.
Table 7.4 Inpatient treatment costs by severity of stroke
Severity Ratio Irish costs
All 1 €8,939
Mild 0.80 €7,164
Moderate 1.09 €9,736
Severe 1.67 €14,894
7.3.2 Cost of in-patient and community rehabilitation care
The Cost of Stroke in Ireland study examined annual costs of inpatient rehabilitation
for incident strokes in 2007, reporting an average cost per individual patient of
€2,090 (range €1,407 to €3,056).(9) When this is inflated to the present day using
the latest available data from the consumer price index (CPI) for health commodities
(2014), the current value is €2,412 (range €1,623 to €4,244).(102) It was assumed
that the current standard of care for stroke rehabilitation is comparable to that in
place in 2007. There is a lack of information on the cost of hospital rehabilitation by
severity of stroke. However, there is data to suggest that in-hospital rehabilitation
costs are directly correlated with stroke severity.(103) Therefore the analysis assumes

HTA of a national screening programme for atrial fibrillation in primary care
Health Information and Quality Authority
52
that the average is a weighted mean of the costs associated with mild, moderate and
severe strokes, where there is a direct, linear correlation between costs and the
severity of functional deficits on the Barthel scale. Using Irish National Audit of
Stroke Care estimates on the percentage of mild, moderate and severe strokes
included in the average figure, the cost of inpatient rehabilitation by stroke severity
was estimated (Table 7.5).(41) Per the Cost of Stroke in Ireland study, it was
assumed that 95% of acute hospital rehabilitation costs are borne by the public
health system, 4% by private health insurers and 1% by out of pocket payments by
patients.
The cost of community rehabilitation includes those associated with public health
nursing, speech and language therapy, dietetics, physiotherapy and occupational
therapy. The average cost per patient in the Cost of Stroke in Ireland study, inflated
to 2014, is estimated at €904 (range €889 to €920). Using the same assumption as
before (rehabilitation costs are directly correlated with severity of stroke), the cost of
mild, moderate and severe stroke was estimated separately (Table 7.5). It is
assumed that all costs associated with community rehabilitation apply in the first
year only and are covered by public funding.
Table 7.5 Inpatient and community rehabilitation costs by stroke severity
Stroke severity Cost of inpatient rehabilitation (range)
Cost of community rehabilitation (range)
Mild €1,117 (751 to 1,965) €419 (411 to 426)
Moderate €2,233 (1,503 to 3,929) €837 (823 to 852)
Severe €3,350 (2,254 to 5,894) €1,256 (1,235 to 1,278)
7.3.3 Cost of in-patient treatment for systemic embolism and GI bleeds
There is a lack of data on the cost of acute hospital treatment for systemic embolism
and gastrointestinal bleeding in AF patients in Ireland. The best available estimates
come from a technology appraisal carried out by the National Institute for Clinical
Excellence in 2012 examining the use of DOACs in a UK setting.(104;105) This
estimated a cost of £2,603 (range £2,082 to £3,124) for non-fatal systemic embolism
and £1,749 (range £1,399 to £2,099) for non-fatal GI bleeding. When these are
converted to 2014 Irish Euro the equivalent costs are €3,698 (€2,956 to €4,436) and
€2,483 (€1,988 to €2,982), respectively. It was assumed that the breakdown of
costs between the public health system, private health insurers and out of pocket
payments is the same as that for acute stroke care (87%, 12% and 1%,
respectively).
7.3.4 Annual cost of care by severity of stroke
Direct long term care costs associated with stroke include nursing home care,
ambulatory care, community rehabilitation, assistive technology and medications.

HTA of a national screening programme for atrial fibrillation in primary care
Health Information and Quality Authority
53
Indirect costs include productivity losses as a result of morbidity and mortality, as
well as the opportunity cost of informal care.(9)
Data on the proportion of stroke survivors with mild, moderate and severe functional
deficits who are discharged home or to residential care were obtained from the
INASC study (Figure 7.2).(41) These estimates were calculated based on the total
number of patients discharged to either of these destinations, excluding discharges
coded as ‘unknown’ or ‘other’. Costs associated with discharges to another hospital
for inpatient rehabilitation are included separately.
Figure 7.2 Discharge destination by stroke severity
The average cost per week for public and private institutions was calculated based
on 2015 data from the HSE, which show that the average cost of care in public
nursing homes is higher due to the increased proportion of patients with severe
dependency in these (60%) compared with private institutions (35%).(106) The
annual cost of nursing home care by stroke severity is calculated as a weighted sum
reflecting the fact that there are approximately twice as many patients with severe
stroke included in the calculation of the average cost of public nursing homes,
compared with private nursing homes. The cost of care for patients with moderate
and mild stroke is assumed to be the same (Table 7.6).
Table 7.6 Nursing home costs by severity of stroke
Nursing home Weekly cost (95% CI)
Annual cost (95% CI) €
Private €899 (614 to 1,185) €46,760 (31,928 to 61,620)
Public €1,245 (623 to 1,863) €64,759 (32,396 to 96,876)
0.32
0.65
0.95
0.68
0.35
0.05
0
0.1
0.2
0.3
0.4
0.5
0.6
0.7
0.8
0.9
1
severe moderate mild/none
Pro
po
rtio
n
Stroke severity (Barthel Index)
Discharged home Discharged to nursing home
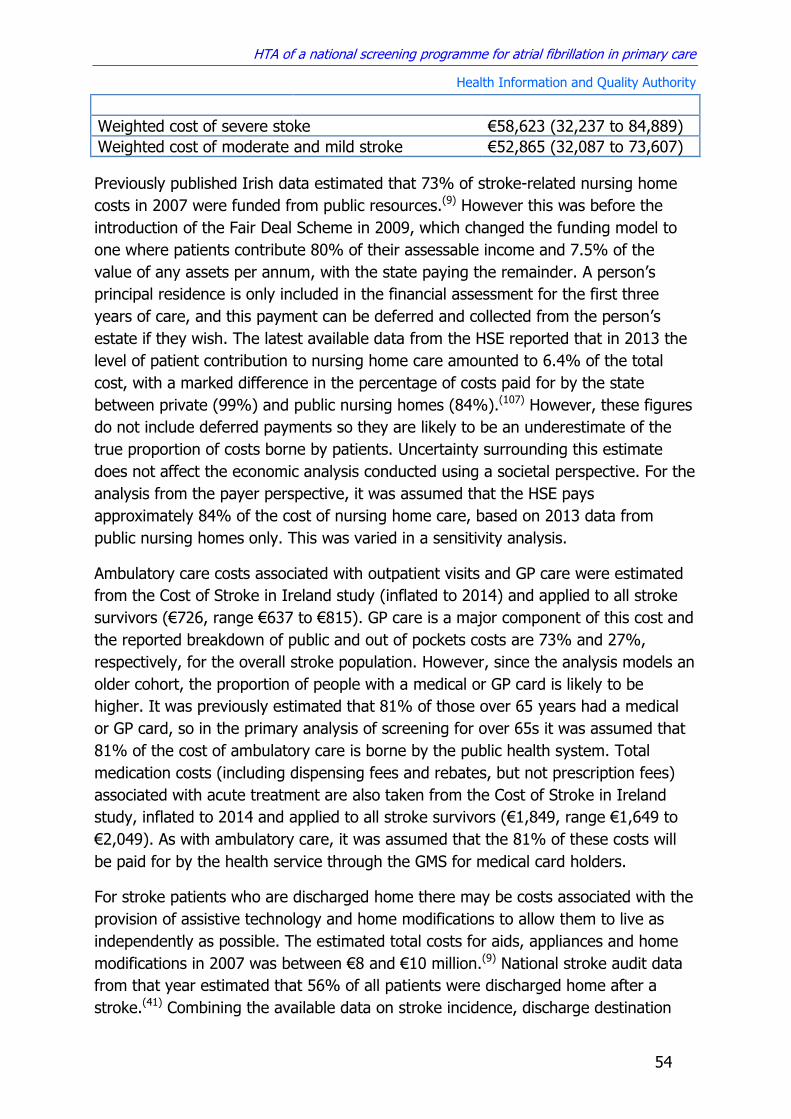
HTA of a national screening programme for atrial fibrillation in primary care
Health Information and Quality Authority
54
Weighted cost of severe stoke €58,623 (32,237 to 84,889)
Weighted cost of moderate and mild stroke €52,865 (32,087 to 73,607)
Previously published Irish data estimated that 73% of stroke-related nursing home
costs in 2007 were funded from public resources.(9) However this was before the
introduction of the Fair Deal Scheme in 2009, which changed the funding model to
one where patients contribute 80% of their assessable income and 7.5% of the
value of any assets per annum, with the state paying the remainder. A person’s
principal residence is only included in the financial assessment for the first three
years of care, and this payment can be deferred and collected from the person’s
estate if they wish. The latest available data from the HSE reported that in 2013 the
level of patient contribution to nursing home care amounted to 6.4% of the total
cost, with a marked difference in the percentage of costs paid for by the state
between private (99%) and public nursing homes (84%).(107) However, these figures
do not include deferred payments so they are likely to be an underestimate of the
true proportion of costs borne by patients. Uncertainty surrounding this estimate
does not affect the economic analysis conducted using a societal perspective. For the
analysis from the payer perspective, it was assumed that the HSE pays
approximately 84% of the cost of nursing home care, based on 2013 data from
public nursing homes only. This was varied in a sensitivity analysis.
Ambulatory care costs associated with outpatient visits and GP care were estimated
from the Cost of Stroke in Ireland study (inflated to 2014) and applied to all stroke
survivors (€726, range €637 to €815). GP care is a major component of this cost and
the reported breakdown of public and out of pockets costs are 73% and 27%,
respectively, for the overall stroke population. However, since the analysis models an
older cohort, the proportion of people with a medical or GP card is likely to be
higher. It was previously estimated that 81% of those over 65 years had a medical
or GP card, so in the primary analysis of screening for over 65s it was assumed that
81% of the cost of ambulatory care is borne by the public health system. Total
medication costs (including dispensing fees and rebates, but not prescription fees)
associated with acute treatment are also taken from the Cost of Stroke in Ireland
study, inflated to 2014 and applied to all stroke survivors (€1,849, range €1,649 to
€2,049). As with ambulatory care, it was assumed that the 81% of these costs will
be paid for by the health service through the GMS for medical card holders.
For stroke patients who are discharged home there may be costs associated with the
provision of assistive technology and home modifications to allow them to live as
independently as possible. The estimated total costs for aids, appliances and home
modifications in 2007 was between €8 and €10 million.(9) National stroke audit data
from that year estimated that 56% of all patients were discharged home after a
stroke.(41) Combining the available data on stroke incidence, discharge destination

HTA of a national screening programme for atrial fibrillation in primary care
Health Information and Quality Authority
55
and costs (inflated to 2014) the average cost for assistive technology and home
modification for patients discharged home was estimated to be €2,113 (range
€1,761 to €2,642). Assuming that costs for those discharged home are directly
correlated with stroke severity (per the Barthel scale) allowed estimation of the
average cost per patient discharged home with mild, moderate and severe functional
deficits, as well as the total average costs by stroke severity (Table 7.7).
Table 7.7 Assistive technology and home modification costs, by stroke
severity
Stroke severity
Average cost for patient discharged home
Overall average cost per patient
Mild €1,504 (1,254 - 1,881) €1,429 (1,191 - 1,787)
Moderate €3,610 (3,009 - 4,514) €2,346 (1,956 - 2,934)
Severe €5,114 (4,262 - 6,394) €1,636 (1,364 - 2,046)
The Cost of Stroke in Ireland study concluded that there was insufficient data
available to estimate the proportion of these costs that were funded through the
public health service. For the purposes of this analysis, it was assumed that 37% of
costs are paid for by the HSE on the basis that items that are provided through the
HSE aids and appliances funding account for 46% of the total cost and
approximately 81% of patients have a medical card, which allows the holder to
receive a prescribed aids and appliances free of charge.(108) The cost of aids and
appliances were applied as a once-off charge in year one.
As well as direct costs for treatment, stroke is also associated with indirect
productivity losses for those voluntarily providing informal care to stroke patients.
The cost of informal care was previously estimated in Ireland using the human
capital approach, which calculated the economic value of the time spent by
caregivers using 2007 data on labour costs for those in employment and the value of
leisure time (taken as one third the median hourly wage) for the unemployed.(9)
Using international estimates of between nine and 20 hours of care being provided
per week by informal caregivers, along with Irish data on average employment rates
in under 65s and labour costs (€21.76 per hour), the average annual cost of informal
care per stroke patient is estimated to be €10,938 (range €6,789 to €15,087).(9;109-
114) In the analysis it was assumed that informal care is provided to all patients who
are discharged home with moderate or severe dependency. The cost of informal care
is only included in the analysis undertaken using a societal perspective.
The parameter estimates described above are used to estimate the total annual
costs associated with haemorrhagic stroke and mild, moderate and severe ischaemic
stroke from both a payer and societal perspective (Tables 7.8 to 7.11).
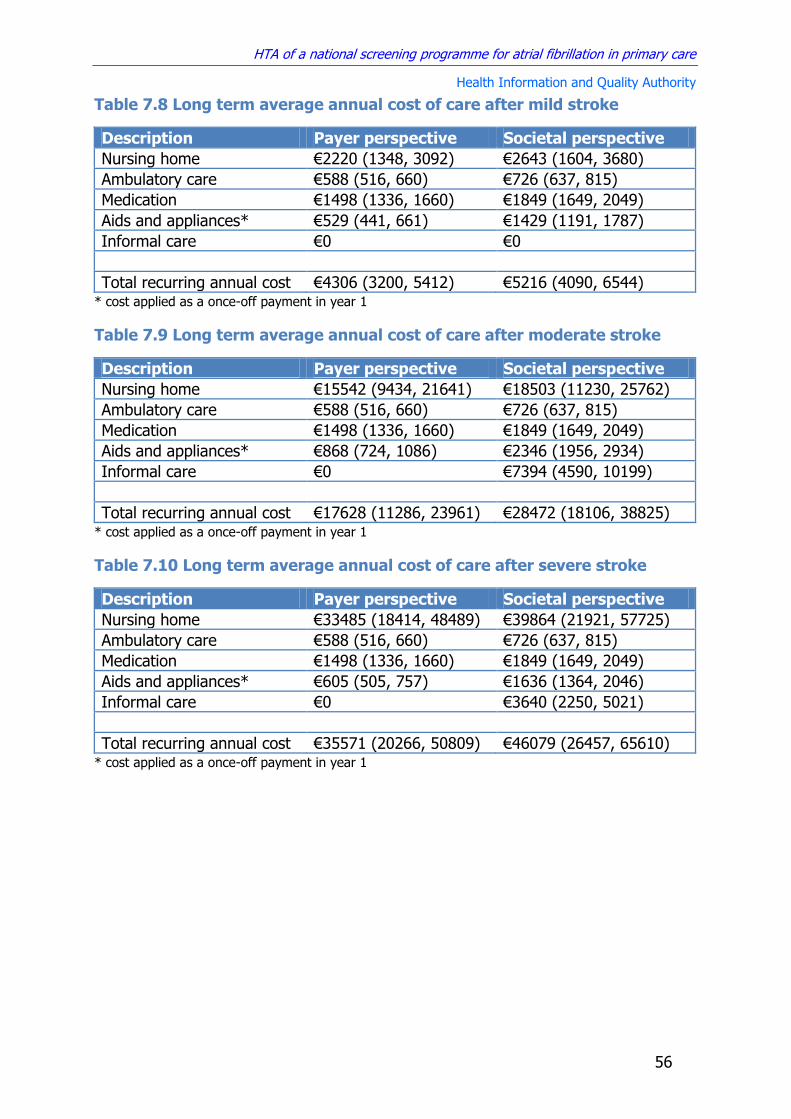
HTA of a national screening programme for atrial fibrillation in primary care
Health Information and Quality Authority
56
Table 7.8 Long term average annual cost of care after mild stroke
Description Payer perspective Societal perspective
Nursing home €2220 (1348, 3092) €2643 (1604, 3680)
Ambulatory care €588 (516, 660) €726 (637, 815)
Medication €1498 (1336, 1660) €1849 (1649, 2049)
Aids and appliances* €529 (441, 661) €1429 (1191, 1787)
Informal care €0 €0
Total recurring annual cost €4306 (3200, 5412) €5216 (4090, 6544) * cost applied as a once-off payment in year 1
Table 7.9 Long term average annual cost of care after moderate stroke
Description Payer perspective Societal perspective
Nursing home €15542 (9434, 21641) €18503 (11230, 25762)
Ambulatory care €588 (516, 660) €726 (637, 815)
Medication €1498 (1336, 1660) €1849 (1649, 2049)
Aids and appliances* €868 (724, 1086) €2346 (1956, 2934)
Informal care €0 €7394 (4590, 10199)
Total recurring annual cost €17628 (11286, 23961) €28472 (18106, 38825) * cost applied as a once-off payment in year 1
Table 7.10 Long term average annual cost of care after severe stroke
Description Payer perspective Societal perspective
Nursing home €33485 (18414, 48489) €39864 (21921, 57725)
Ambulatory care €588 (516, 660) €726 (637, 815)
Medication €1498 (1336, 1660) €1849 (1649, 2049)
Aids and appliances* €605 (505, 757) €1636 (1364, 2046)
Informal care €0 €3640 (2250, 5021)
Total recurring annual cost €35571 (20266, 50809) €46079 (26457, 65610) * cost applied as a once-off payment in year 1

HTA of a national screening programme for atrial fibrillation in primary care
Health Information and Quality Authority
57
Table 7.11 Long term average annual cost of care after haemorrhagic
stroke
Description Payer perspective Societal perspective
Nursing home €11005 (5633, 16376) €13101 (6706, 19495)
Ambulatory care €588 (516, 660) €726 (637, 815)
Medication €1498 (1336, 1660) €1849 (1649, 2049)
Aids and appliances* €580 (483, 725) €1567 (1306, 1960)
Informal care €0 €5063 (3143, 6984)
Total recurring annual cost €13091 (7485, 18696) €20739 (12135, 29343) * cost applied as a once-off payment in year one
7.3.5 Productivity costs
Productivity losses associated with stroke morbidity and mortality represent an
important cost from a societal perspective. Both national and international studies
have produced consistent estimates of the proportion of employed people who have
to give up working as a result of stroke (45% to 65%).(9;41;115-118) However, while
there is evidence to show that functional ability is one of the main predictors of
whether or not someone will return to work, there are conflicting estimates on the
precise proportion of patients who will return to work after mild, moderate or severe
stroke.(119-121) In this analysis the simplifying assumption was made that no patients
left with severe functional deficits or discharged to a nursing home return to work.
For those with mild or moderate deficits the results of a previously published study,
which found that 37% of patients with mild or moderate deficits who were employed
prior to first-ever stroke fail to return to employment afterwards, were applied.(115)
Lost productivity was calculated using the human capital approach using Irish data
from 2010 to 2014 on employment rates and average earnings by year of age within
the modelled cohort (inflated to 2014, see Figures 7.3 and 7.4).(122;123) Total
productivity loss by age at death to 85 years is calculated using discounting to
incorporate the time value of future earnings into the overall sum, which is itself
discounted to reflect the year in which the productivity loss is incurred. Cumulative
productivity losses by age at death or disability are shown in Figure 7.5.

HTA of a national screening programme for atrial fibrillation in primary care
Health Information and Quality Authority
58
Figure 7.3 Employment rate by age
Figure 7.4 Average annual earnings by age
Figure 7.5 Total discounted productivity loss by age
0
0.2
0.4
0.6
0.8
1
50 55 60 65 70 75 80 85
Emp
loym
ent
rate
Age
Average Lower bound Upper bound ILO data
0
10000
20000
30000
40000
50000
60000
45 50 55 60 65 70 75 80 85
Euro
Age
Annual earnings CSO data Lower bound Upper bound
0
50000
100000
150000
200000
250000
300000
350000
50 55 60 65 70 75 80 85
Euro
Age
Mean productivity loss (discounted) Lower bound Upper bound
HTA of a national screening programme for atrial fibrillation in primary care
Health Information and Quality Authority
59
7.4 Limitations of the cost data
There are a number of limitations associated with the estimation of the costs of
screening for AF and treating stroke. Opportunistic screening, where a two stage test
is designed to be carried out as part of a GP consultation when the patient is
attending for some other issue, is more challenging to cost compared with traditional
invitational programmes that offer screening at a dedicated centre. It was decided to
cost the time needed to perform pulse palpation and to use a set fee for an ECG
performed in primary care. It is possible that any future GP contract might regard
screening as part of routine care that does not attract a fee. However, even if this
were the case there would still be an opportunity cost associated with screening,
which would be the value of the alternative use of that time during a consultation.
Therefore the estimates outlined above are appropriate for the evaluation of the AF
screening programme currently being considered.
Potential limitations in regard to the cost of stroke treatment include the fact that the
most recent Casemix data on inpatient treatment costs is derived from 2011.
However CSO data on inflation within the health sector between 2011 and 2014 was
low (2.8%), so the impact of this should be minimal. Casemix provides the overall
average costs for patients treated (weighted by the presence or absence of
complications) rather than by severity of stroke. To estimate individual costs for
those with mild, moderate or severe stroke it was assumed that treatment costs are
directly correlated with acute severity. While the limited available evidence on this
issue supports this assumption, there is uncertainty about the relative cost
differences.
There was a lack of Irish data on the hospital costs for systemic embolism and GI
bleeds, so these costs were estimated using UK data (converted to 2014 Irish Euro).
While there are caveats associated with using international data, given the
similarities between Ireland and the UK in how hospitals are funded and access to
treatment, this was considered to be the best available option for capturing these
costs.
The analysis uses average costs for long term care for mild, moderate and severe
stroke, which combines data on those for whom AF was or was not a contributing
factor. This captures the cost implications of screening if the higher cost associated
with AF stroke are assumed to be as a result of increased AF stroke severity, which
increases the likelihood of death and significant long term functional impairment.
While it is generally accepted that the reason AF strokes cost more to treat is
because they are more severe, a recent Irish study found that AF was associated
with substantially greater two-year costs in those with mild-moderate stroke (no
difference was observed in severe stroke).(124;125) The authors’ did not discuss the
reasons for this cost difference within the mild/moderate severity category, and

HTA of a national screening programme for atrial fibrillation in primary care
Health Information and Quality Authority
60
acknowledge that confounding and lack of power may partially explain some of the
findings. The analysis models mild and moderate stroke costs separately. The work
carried out as part of the Irish National Audit of Stroke Care and the Cost of Stroke
in Ireland study, both of which were based on data from 2007, are used to inform
this analysis. All costs reported in these studies were inflated to 2014 and it was
assumed that the overall findings in relation to stroke care are applicable to present
day.
Estimates of the cost of informal care are associated with a high degree of
uncertainty and are based on evidence showing an average of between nine and 20
caregiver hours being provided per week. In the absence of data on the difference in
the mean number of hours provided for those with moderate and severe disability,
the overall average was applied to both, rather than assuming that the level of
informal care provided is directly correlated with the degree of dependency. Given
the number of hours per week involved, it is likely that informal care compliments,
rather than replaces, other support services. Uncertainty about the relationship
between the mix of formal and informal care prevented any assumptions about
relative costs of informal care in moderate and severe stroke.

HTA of a national screening programme for atrial fibrillation in primary care
Health Information and Quality Authority
61
8 Economic analysis
An economic evaluation was conducted using a decision analysis model to compare
the costs and benefits of a prospective national AF screening programme in Ireland
with the current standard of care, in order to inform decision making regarding the
introduction of AF screening in Ireland.
8.1 Methods
8.1.1 Type of economic evaluation
A cost-utility analysis was carried out where costs are measured in Euro and utility is
measured in quality-adjusted life years (QALYs).
8.1.2 Target population and setting
The target population in the primary analysis was men and women aged 65 or over
in Ireland. The setting was the Irish health system, where screening was carried out
within GP-led primary care services. Stroke treatment was set in the acute public
hospital sector and long term care was set in both public and private residential
nursing homes and in the community, depending on where patients are discharged
following a stroke.
8.1.3 Technology and comparators
The technology being assessed was annual opportunistic AF screening of all men and
women aged 65 or over by pulse palpation followed by ECG if an irregular pulse is
detected. ECGs were performed in primary care and read by a GP with the aid of
computerised interpretation algorithms. Screening takes place in GP practices when
a patient attends for an appointment for any reason. The primary comparator is
routine care, where testing for AF is generally only done when patients present with
signs or symptoms indicative of the arrhythmia. The choice of comparator was
informed by the recommendations contained in the National Cardiovascular Policy
2010-2019 and the pilot AF screening project conducted by the HSE National Clinical
Programme for Stroke and was consistent with the best available evidence on the
effectiveness of screening.
8.1.4 Perspective, time horizon and discounting
The primary analysis was carried out from the perspective of the publicly funded
health and social care system in Ireland. A secondary analysis was conducted using a
societal perspective that included costs that fall on patients and private health
insurers, as well as indirect costs associated with informal care and lost productivity.
The time horizon over which the costs and benefits of screening was calculated was
25 years and both costs and benefits were discounted at 5%.

HTA of a national screening programme for atrial fibrillation in primary care
Health Information and Quality Authority
62
8.1.5 Model structure
A Markov model was used to simulate costs and clinical outcomes in a hypothetical
cohort of men and women with and without screening over the course of 25 years,
using a cycle length of one year. The model estimated the number of people with
diagnosed and undiagnosed AF in each group, as well as the incidence and severity
of AF-related stroke in treated and untreated individuals. The first year of survival
post-stroke was included as a separate state due to the significantly higher mortality
rate in that compared with subsequent years. A diagram of the structure of the
model is shown in Figure 8.1
8.1.6 Sensitivity and scenario analysis
Stochastic analysis methods were used to capture the uncertainty and variability
associated with the input parameters, which were varied within plausible ranges
derived from published evidence and expert opinion. All estimates of the incremental
costs and benefits of screening were calculated using Monte Carlo simulation, using
10,000 iterations. Each iteration sampled parameter values from their defined
distribution, providing the mean estimate of the incremental costs and benefits,
along with the level of uncertainty associated with this estimate.
Deterministic univariate sensitivity analysis was performed to estimate the effect of
uncertainty regarding individual parameter estimates. In this analysis, the model is
run with each parameter in turn fixed at its upper and lower bounds while all other
parameters are held at their average value. Scenario analysis was carried out to
examine the potential impact of changes to some of the key parameters associated
with screening. These are described in the section outlining how each parameter was
estimated.
8.1.7 Budget impact analysis
A budget impact analysis was performed from the perspective of the public health
system only, which reports the incremental costs associated with screening over a
five-year time horizon. Given the level of uncertainty surrounding estimates of future
healthcare costs and budget allocations, the applicability of any analysis beyond this
time period is limited. Indirect costs are excluded from this analysis and VAT (value
added tax) is applied where relevant. No discounting is applied. The results of the
BIA show the total incremental cost associated with the intervention, including
treatment costs for stroke. It does not take into consideration any additional clinical
benefit produced as a result of screening.
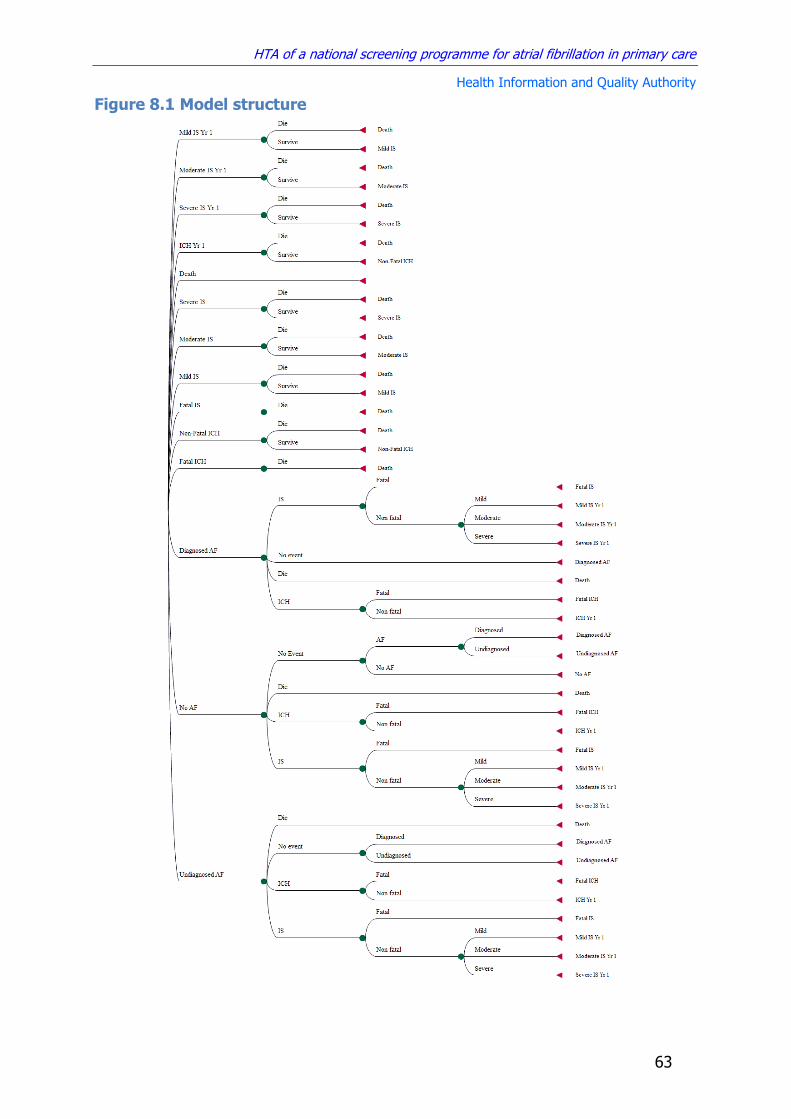
HTA of a national screening programme for atrial fibrillation in primary care
Health Information and Quality Authority
63
Figure 8.1 Model structure

HTA of a national screening programme for atrial fibrillation in primary care
Health Information and Quality Authority
64
8.2 Cost-effectiveness results
Convergence in the estimated cost-effectiveness of screening in the probabilistic
model was achieved after approximately 4,000 iterations (Figure 8.2). All results
presented here are based on the full 10,000 simulations comparing a strategy of
opportunistic screening in primary care with no screening (routine practice).
Figure 8.2 Convergence of ICER estimates in model
8.2.1 Payer perspective results
Table 8.1 provides a summary of the absolute effects of screening and routine care,
including the average undiscounted number of AF cases diagnosed, strokes avoided
and life years gained if screening was implemented within the current cohort of 65
year olds in Ireland (n=42,330). The model outputs indicate that one additional case
of AF is diagnosed for every 22 people opportunistically screened for 25 years from
the age of 65, and one stroke is avoided for every 270 people screened over the
same period.
Table 8.1 Absolute outcomes for screening and routine care based on the
current Irish population of men and women aged 65 years (N=42,330)
Outcome Cases Routine care Screening ICER (undiscounted)
AF cases detected
Total 5756 7700 €1,697 per additional AF case detected Incremental 1944
Ischaemic strokes
Total 4293 4108
€54,203 per stroke avoided
Incremental -185
Haemorrhagic strokes
Total 1285 1313
Incremental 28
The incremental cost-effectiveness ratio (ICER) for AF screening in over 65s
compared with routine care from the perspective of the HSE is €20,271/QALY (Table
8.2). The cost-effectiveness plane is shown in Figure 8.2.
15
20
25
30
0 2000 4000 6000 8000 10000
ICER
(€
/QA
LY)
Tho
usa
nd
s
Model iterations
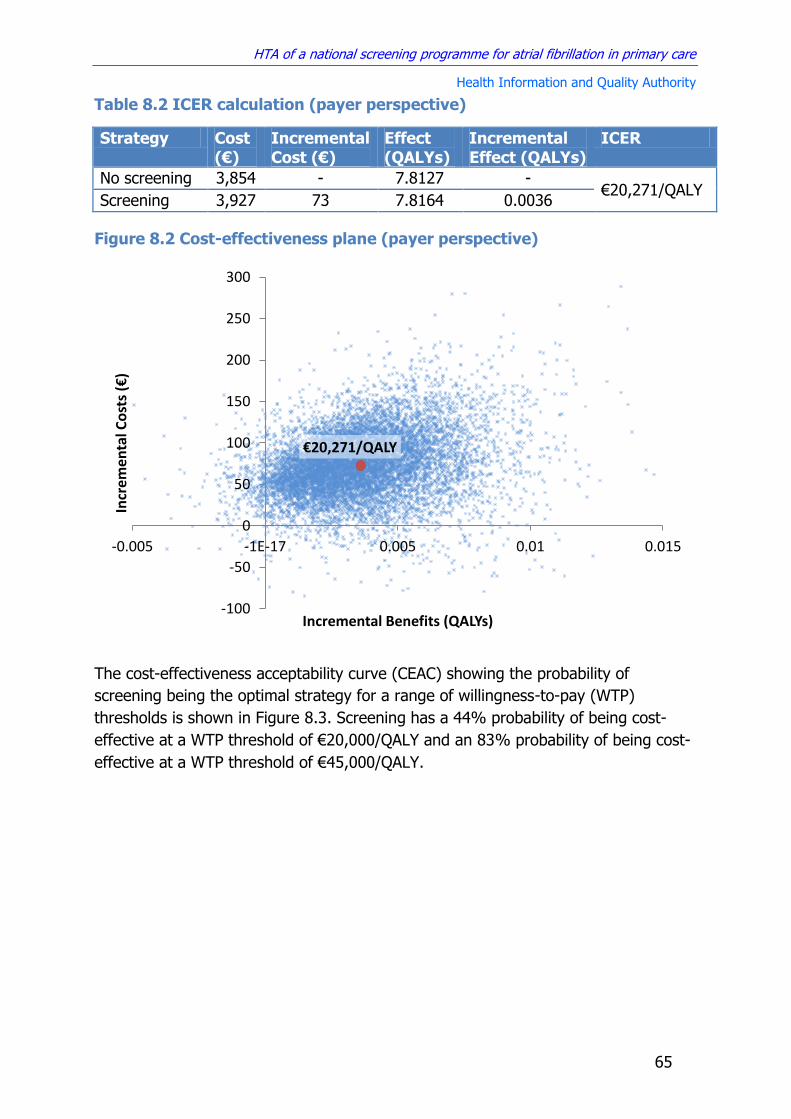
HTA of a national screening programme for atrial fibrillation in primary care
Health Information and Quality Authority
65
Table 8.2 ICER calculation (payer perspective)
Strategy Cost (€)
Incremental Cost (€)
Effect (QALYs)
Incremental Effect (QALYs)
ICER
No screening 3,854 - 7.8127 - €20,271/QALY
Screening 3,927 73 7.8164 0.0036
Figure 8.2 Cost-effectiveness plane (payer perspective)
The cost-effectiveness acceptability curve (CEAC) showing the probability of
screening being the optimal strategy for a range of willingness-to-pay (WTP)
thresholds is shown in Figure 8.3. Screening has a 44% probability of being cost-
effective at a WTP threshold of €20,000/QALY and an 83% probability of being cost-
effective at a WTP threshold of €45,000/QALY.
€20,271/QALY
-100
-50
0
50
100
150
200
250
300
-0.005 -1E-17 0.005 0.01 0.015
Incr
emen
tal C
ost
s (€
)
Incremental Benefits (QALYs)

HTA of a national screening programme for atrial fibrillation in primary care
Health Information and Quality Authority
66
Figure 8.3 Cost-effectiveness acceptability curve (CEAC, payer
perspective)
8.2.2 Sensitivity and scenario analysis
Given the uncertainty surrounding some of the key parameters in the model,
extensive sensitivity and scenario analysis was carried out to examine what the
impact of changes to these parameters would be on the overall cost-effectiveness
results.
8.2.2.1 Stroke risk profile of asymptomatic AF patients
Uncertainty surrounding the benefits of early detection in asymptomatic AF patients
was one of the main reasons why the UK National Screening Committee
recommended that AF screening should not be offered by the NHS. While the
CHA2DS2VASc tool for calculating the risk of stroke in atrial fibrillation does not
distinguish between asymptomatic and symptomatic individuals, some studies in
asymptomatic device-detected AF have suggested that the risk of stroke in
asymptomatic AF may be 33% to 50% less than in symptomatic individuals (see
Section 3.2). A sensitivity analysis was conducted to examine the effect of screening
if the risk of stroke and systemic embolism in the additional people that would be
detected by screening was less than in those detected through routine care (Figure
8.4).
€45,000/QALY €20,000/QALY
0
0.2
0.4
0.6
0.8
1
0 10000 20000 30000 40000 50000 60000
Pro
bab
ility
of
b
ein
g co
st-e
ffec
tive
Willingness to pay (€/QALY)
No screening Screening

HTA of a national screening programme for atrial fibrillation in primary care
Health Information and Quality Authority
67
Figure 8.4 Impact of reduced risk of stroke in asymptomatic AF on
effectiveness of screening and routine care
IS – Ischaemic Stroke, SE – Systemic Embolism, AF – Atrial Fibrillation, RR – Relative Risk, QALY – Quality
Adjusted Life Year
This suggests that if the relative risk of stroke and systematic embolism in screen-
detected patients is more than a third lower (RR<0.66) than that of AF patients
identified through routine practice then the harms of screening outweigh the
benefits. The impact on cost-effectiveness is shown in Figure 8.5, which shows that
if the relative risk of stroke and systemic embolism is more than 14% lower in
screen-detected patients compared with symptomatic patients, then screening would
be considered not cost-effective using a willingness-to-pay threshold of
€45,000/QALY.
Figure 8.5 Impact of reduced risk of stroke in asymptomatic AF on cost-
effectiveness of screening
IS – Ischaemic Stroke, SE – Systemic Embolism, AF – Atrial Fibrillation, RR – Relative Risk, QALY – Quality
Adjusted Life Year, ICER – Incremental Cost Effectiveness Ratio
RR 0.66
7.812
7.817
7.822
0.5 0.6 0.7 0.8 0.9 1
QA
LYs
Relative risk of IS and SE for undiagnosed AF
Screening No Screening
€45,000/QALY
€20,000/QALY
RR 0.86
0
20,000
40,000
60,000
80,000
100,000
120,000
0.75 0.8 0.85 0.9 0.95 1
ICER
(€
/QA
LY)
Relative risk of IS and SE in undiagnosed AF

HTA of a national screening programme for atrial fibrillation in primary care
Health Information and Quality Authority
68
8.2.2.2 Start ages for screening
The screening cohort in the primary analysis was men and women over 65 years.
Table 8.3 shows the expected impact of varying the start age of screening between
50 and 70 years. The time horizon over which all programmes were evaluated was
from the start of screening to age 90 years.
Table 8.3 ICERs for screening versus routine care at start ages between 50
and 70 years
Start Age ICER compared to routine care
50 Years €50,578/QALY
55 Years €38,004/QALY
60 Years €28,134/QALY
65 Years €20,271/QALY
70 Years €14,594/QALY
Sensitivity analysis comparing each start age to a comparator of routine care (as
opposed to each other) found that reducing the start age of screening would tend to
decrease the cost effectiveness of a prospective screening programme. This was
expected given the sharp increase in the incidence of AF with advancing age.
Increasing the start age is likely to improve the cost-effectiveness of the programme
further. However, caution needs to be exercised when interpreting these results, as
the impact of opportunistic screening on AF detection has only been studied in a
population of aged 65 years and over. Therefore any extension of the age range of
screening requires an assumption that the clinical effectiveness estimates apply
equally across all ages, which may not be the case. In addition, the ICER compared
to routine care at different starting ages does not provide information on the relative
cost-effectiveness of one screening strategy compared to the next best alternative.
8.2.2.3 Screening intervals
A scenario analysis was carried out to compare the annual screening programme
evaluated in the primary analysis to programmes with an extended screening interval
of between two and five years. In this scenario, incident AF cases in interval years
have the same probability of being diagnosed as they do under routine care,
whereas in screening years there is an increase in the detection of both incident
cases and undetected prevalent cases from the interval period (Figure 8.6).

HTA of a national screening programme for atrial fibrillation in primary care
Health Information and Quality Authority
69
Figure 8.6 Modelled probability of AF diagnosis by age for different
screening intervals
The cost-effectiveness plane comparing different screening intervals for a start age
of 65 years is shown in Figure 8.7. This reveals that when the screening interval is
lengthened, the rate of decrease in costs is greater than the rate of decrease in
benefits, resulting in a lower ICER compared with no screening. It also shows that
the ICER for annual screening compared with the next best option in the scenario
analysis (screening every second year) far exceeds conventional willingness to pay
thresholds used in Ireland. If extending the screening interval beyond one year is
considered a realistic option, then at a willingness-to-pay threshold of €45,000/QALY
the optimal screening strategy would be opportunistic screening every three years.
Figure 8.7 Scenario analysis comparing different screening intervals with a
start age of 65 years
0
0.02
0.04
0.06
0.08
0.1
0.12
65 70 75 80 85 90
Pro
bab
ility
of
bei
ng
d
iagn
ose
d w
ith
AF
Age
No Screening 1 Yr 2 Yrs 3 Yrs 4 Yrs 5 Yrs
5 Yrs, €9,471/QALY
4 Yrs, €22,797/QALY
3 Yrs, €35,134/QALY
2 Yrs, €61,362/QALY
1 Yr, €163,144/QALY
0
10
20
30
40
50
60
70
80
0 0.0005 0.001 0.0015 0.002 0.0025 0.003 0.0035 0.004
Co
sts
(€)
Benefit (QALYs)
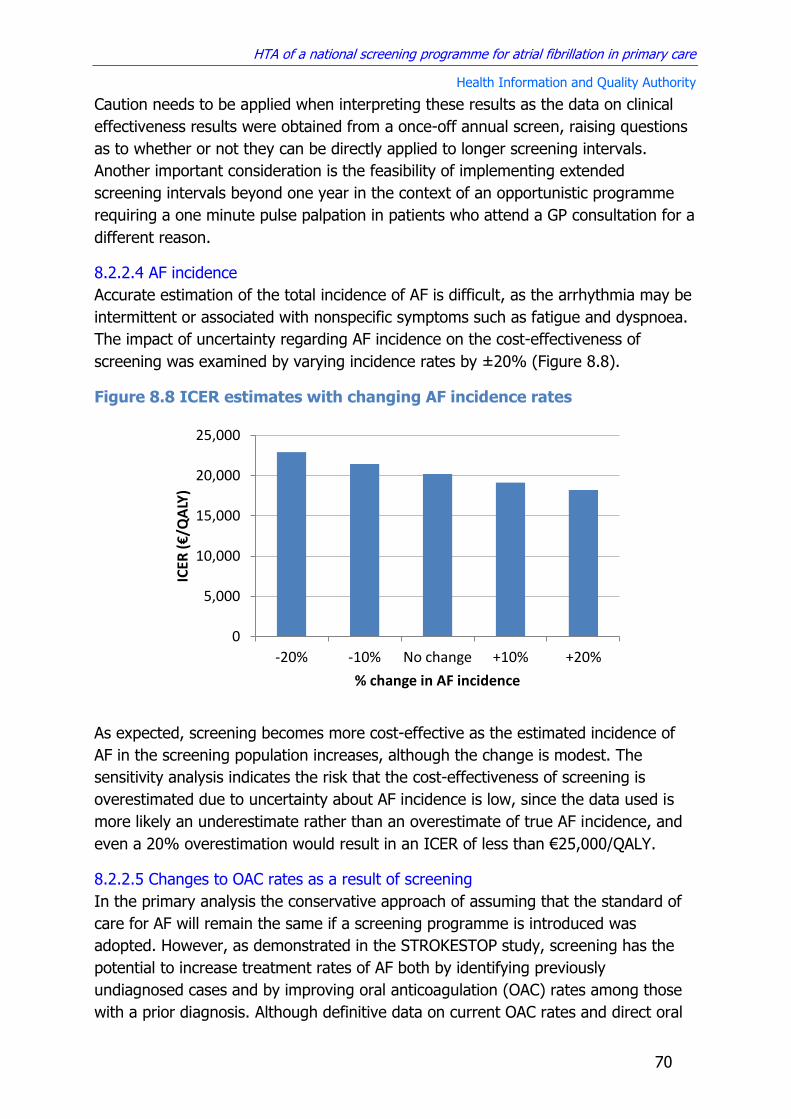
HTA of a national screening programme for atrial fibrillation in primary care
Health Information and Quality Authority
70
Caution needs to be applied when interpreting these results as the data on clinical
effectiveness results were obtained from a once-off annual screen, raising questions
as to whether or not they can be directly applied to longer screening intervals.
Another important consideration is the feasibility of implementing extended
screening intervals beyond one year in the context of an opportunistic programme
requiring a one minute pulse palpation in patients who attend a GP consultation for a
different reason.
8.2.2.4 AF incidence
Accurate estimation of the total incidence of AF is difficult, as the arrhythmia may be
intermittent or associated with nonspecific symptoms such as fatigue and dyspnoea.
The impact of uncertainty regarding AF incidence on the cost-effectiveness of
screening was examined by varying incidence rates by ±20% (Figure 8.8).
Figure 8.8 ICER estimates with changing AF incidence rates
As expected, screening becomes more cost-effective as the estimated incidence of
AF in the screening population increases, although the change is modest. The
sensitivity analysis indicates the risk that the cost-effectiveness of screening is
overestimated due to uncertainty about AF incidence is low, since the data used is
more likely an underestimate rather than an overestimate of true AF incidence, and
even a 20% overestimation would result in an ICER of less than €25,000/QALY.
8.2.2.5 Changes to OAC rates as a result of screening
In the primary analysis the conservative approach of assuming that the standard of
care for AF will remain the same if a screening programme is introduced was
adopted. However, as demonstrated in the STROKESTOP study, screening has the
potential to increase treatment rates of AF both by identifying previously
undiagnosed cases and by improving oral anticoagulation (OAC) rates among those
with a prior diagnosis. Although definitive data on current OAC rates and direct oral
0
5,000
10,000
15,000
20,000
25,000
-20% -10% No change +10% +20%
ICER
(€
/QA
LY)
% change in AF incidence

HTA of a national screening programme for atrial fibrillation in primary care
Health Information and Quality Authority
71
anticoagulant (DOAC) use in AF patients is lacking, it was estimated that
approximately 60% are anticoagulated and 35% of these are taking DOACs (see
section 5.4.1). Figure 8.9 and 8.10 show the impact of increasing OAC rates and
DOAC use as a result of screening on cost-effectiveness.
Figure 8.9 Impact of increasing OAC rates as a result of screening on cost-effectiveness
OAC – Oral Anticoagulant, DOAC – Direct Oral Anticoagulant, ICER – Incremental Cost Effectiveness Ratio
Figure 8.10 Impact of increasing DOAC use as a result of screening on
cost-effectiveness
OAC – Oral Anticoagulant, DOAC – Direct Oral Anticoagulant, ICER – Incremental Cost Effectiveness Ratio
Results show that the marginal increase in benefits from greater OAC and DOAC use
is matched by the marginal increase in costs, so there is no major change in the
incremental cost effectiveness ratio (ICER) estimate even with large increases in
DOAC use.
Recent analysis of DOAC use in Ireland suggests that a significant proportion of
patients are prescribed doses that are non-inferior to warfarin. To examine the
impact of suboptimal DOAC prescription a worst-case scenario was examined where
all those on DOACs had the same reduction in risk of ischaemic stroke and systemic
embolism as those on warfarin, while retaining the same risk of bleeding (and costs).
Results are shown in Table 8.4, which indicates that the impact on the overall cost-
0
5000
10000
15000
20000
25000
0.6 0.65 0.7 0.75 0.8
ICER
(€
/QA
LY)
Overall OAC rates (Warfarin and DOACs)
0
5000
10000
15000
20000
25000
0.35 0.45 0.55 0.65
ICER
(€
/QA
LY)
DOAC use as % of all OAC

HTA of a national screening programme for atrial fibrillation in primary care
Health Information and Quality Authority
72
effectiveness of screening versus routine care is minimal (approximately 3% increase
in ICER).
Table 8.4 Effect of suboptimal DOAC dosing on ICER for screening
Strategy Cost (€)
Incremental Cost (€)
Effect (QALY)
Incremental Effect (QALY)
ICER
No screening 3,855 - 7.80914 - €20,789/QALY
Screening 3,930 74 7.81272 0.00358
Recent UK guidelines for the management of AF recommend against offering aspirin
monotherapy solely for stroke prevention for people with atrial fibrillation.(126) The
most recent Irish and UK data suggests that aspirin is currently being used for this
purpose in up to a third of patients (section 5.4.1). As this is likely to reduce over
time in light of the UK guidelines, a sensitivity analysis was carried out to estimate
the cost-effectiveness of screening being introduced into an environment with very
high OAC rates, using the extreme case of 100% DOAC use. The results of this
scenario analysis (Table 8.5) show that this would not significantly affect the cost-
effectiveness results.
Table 8.5 Effect of introducing screening in the context of very high rates
of DOAC use
Strategy Cost (€)
Incremental Cost (€)
Effect (QALY)
Incremental Effect (QALY)
ICER
No screening 4,091 - 7.81706 - €21,795/QALY
Screening 4,234 143 7.82363 0.00657
8.2.2.6 Screening sensitivity and the effectiveness of routine practice
In the primary analysis it was conservatively assumed that incident cases that are
not detected the first time the person with AF is screened will remain undetected in
subsequent years. Results of a sensitivity analysis of the effect of a screening
programme where latent cases have the same probability of being detected each
year are shown in Table 8.6. Figure 8.11 shows the difference in the proportion of
AF cases diagnosed over time in this scenario compared with the primary analysis.
As anticipated it results in a higher rate of case-detection and an increase in the
cost-effectiveness of screening (lower ICER).
Table 8.6 ICER calculation for best case scenario for effectiveness of opportunistic screening
Strategy Cost(€)
Incremental Cost (€)
Effect (QALY)
Incremental Effect (QALY)
ICER
No screening 3,846 - 7.80987 - €12,809/QALY
Screening 3,940 94 7.81718 0.00731

HTA of a national screening programme for atrial fibrillation in primary care
Health Information and Quality Authority
73
Figure 8.11 Probability of being diagnosed with AF in primary analysis and best case scenario for effectiveness of opportunistic screening
In the absence of data on the effect of disease progression on detection rates of
latent AF this was not modelled separately. Rather, it was assumed that disease
progression is similar across comparators and does not contribute to significant
differences between groups.
Figure 8.12 shows the impact of varying the effectiveness of routine care and
opportunistic screening on the overall cost-effectiveness estimate. This shows that
given current estimates of the proportion of cases identified by routine care (62%),
opportunistic screening would be cost-effective at a willingness-to-pay of
€45,000/QALY as long as it increased the rate of AF detection to at least 70%.
Conversely, if the sensitivity of pulse palpation and ECG at detecting incident cases is
80%, then screening would be cost-effective as long as the rate of AF detection in
routine practice was less than 72%.
Figure 8.12 Univariate sensitivity analysis of the impact of the effectiveness of routine practice and opportunistic screening on cost-effectiveness
0
0.05
0.1
0.15
65 70 75 80 85 90 Pro
bab
ility
of
bei
ng
dia
gno
sed
wit
h A
F
Age
Total AF Routine Practice
Screening - Primary Analysis Screening - Best case scenario
Routine care Opportunistic
screening
45000 €/QALY
0
10000
20000
30000
40000
50000
60000
0 0.2 0.4 0.6 0.8 1
ICER
(€
/QA
LY)
Proportion of incident cases detected

HTA of a national screening programme for atrial fibrillation in primary care
Health Information and Quality Authority
74
8.2.2.7 Uptake of screening and the cost of pulse palpation
Uncertainty relating to the uptake of screening has implications for both the clinical
effectiveness and costs associated with screening. In the SAFE trial 69% of patients
had their pulse taken, and 81% of those without a previous diagnosis of AF who
were found to have an irregular pulse consented to having an ECG.(19) In this
analysis it was assumed that the overall uptake of opportunistic screening is likely to
be higher than that observed in a trial setting due to the absence of the requirement
for formal consent and the fact that pulse palpation is a well known and accepted
part of routine GP care. However, a worst case scenario could see significantly
decreased AF detection in opportunistic screening due to a low acceptance rate of
screening among patients. Costs of pulse palpation may also be higher than that
included in the primary analysis, due to a higher proportion of tests being carried out
by GPs rather than practice nurses, or due to underestimation of practice nurse costs
from failing to include GP contributions to nurse salaries in the calculation of the cost
of staff time. An Irish study of GP attendance rates reported that estimates derived
from practice data are likely to be higher than self reported estimates, the kind
collected by TILDA.(65;127) If the TILDA data is an underestimate then as well as
lending further support to the assumption that all those in the screening cohort
attend a GP consultation at least once a year, it may reduce the estimated
opportunity cost of pulse palpation, which is based on the GMS capitation fee.
To examine the impact of this uncertainty, a sensitivity analysis was conducted that
varied uptake between 50% and 100%, and varied the cost of pulse palpation
between €2.88 and €14.40 (Figures 8.13 and 8.14).
Figure 8.13 Impact of decreasing uptake of screening on cost-
effectiveness
€45,000/QALY
€20,000/QALY
0
5000
10000
15000
20000
25000
30000
35000
40000
45000
50000
0.5 0.6 0.7 0.8 0.9 1
ICER
(€
/QA
LY)
Uptake of screening

HTA of a national screening programme for atrial fibrillation in primary care
Health Information and Quality Authority
75
Figure 8.14 Impact of increasing cost of pulse palpation on cost-
effectiveness
Results of univariate sensitivity analysis showed that the overall results were
relatively insensitive to changes in the uptake of screening or the opportunity cost of
pulse palpation, with the ICER for screening remaining cost-effective at a
willingness-to-pay threshold of €45,000/QALY. A two-way sensitivity analysis
examining the impact of simultaneous changes in both these parameters is shown in
Figure 8.15. This shows that the intervention is likely to be cost-effective at a
willingness-to-pay threshold of €45,000/QALY unless the opportunity cost of pulse
palpation during a routine GP visit is greatly underestimated and uptake rates are
significantly overestimated.
€45,000/QALY
€20,000/QALY
0
10,000
20,000
30,000
40,000
50,000
60,000
2 4 6 8 10 12 14
ICER
(€
/QA
LY)
Cost of pulse palpation (€)

HTA of a national screening programme for atrial fibrillation in primary care
Health Information and Quality Authority
76
Figure 8.15 Two-way sensitivity analysis of screening uptake and cost of
pulse palpation (WTP = €45,000/QALY)
8.2.2.8 Inclusion of costs of additional testing as part of an AF diagnosis
The draft AF care pathway developed by the HSE specifies that blood tests and an
echocardiogram should be carried out in patients diagnosed with AF.(11) The costs of
additional tests for structural heart disease were not included in the primary analysis
because the benefits associated with diagnosing and treating these concomitant
conditions were not included. Including the incremental costs, but not the
incremental utility associated with these tests would bias the analysis in favour of
routine care. However, the potential impact of these additional costs was examined
in a sensitivity analysis. In the absence of HSE cost data for echocardiography and
blood testing prices were obtained from private health clinics. Prices for
echocardiography ranged from €81 to €250, and prices for blood testing ranged from
€20 to €30.(128-130) For the purposes of the sensitivity analysis a conservative (high)
estimate of a combined cost of €250 for additional testing for each new diagnosis of
AF was used. The results of the cost-effectiveness analysis that includes these costs
are presented in Table 8.7, which show that their inclusion increases the ICER by
approximately 16%.
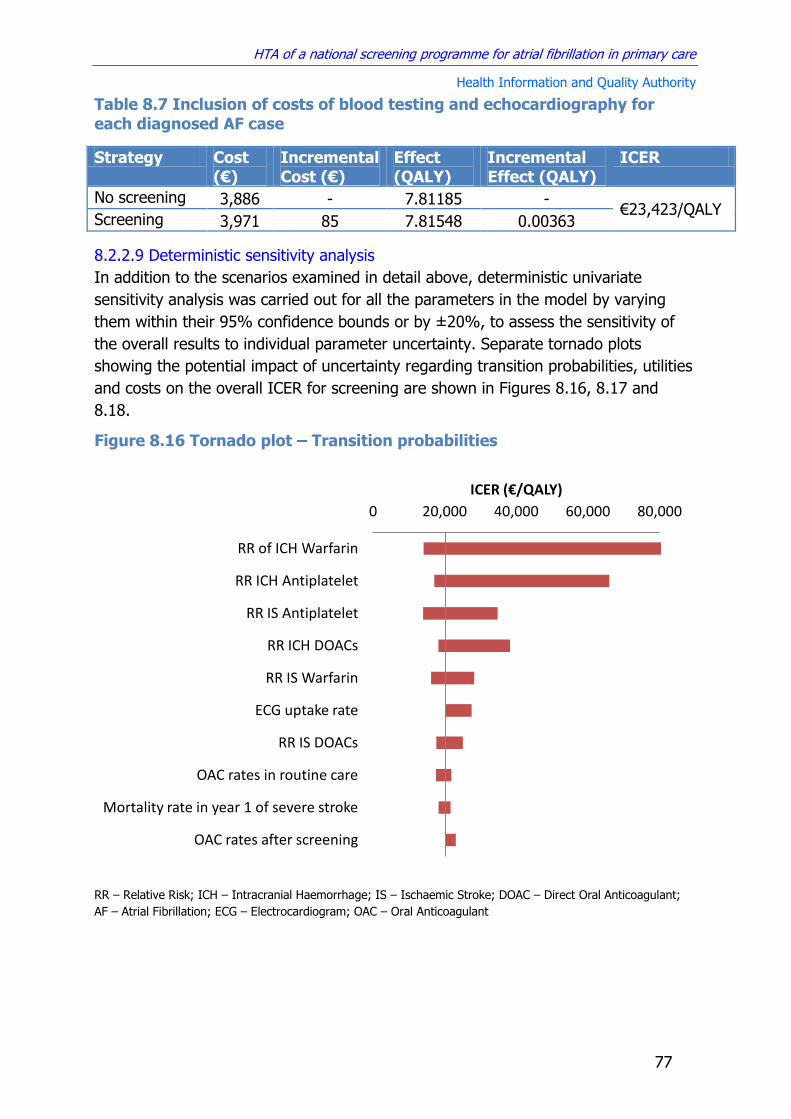
HTA of a national screening programme for atrial fibrillation in primary care
Health Information and Quality Authority
77
Table 8.7 Inclusion of costs of blood testing and echocardiography for
each diagnosed AF case
Strategy Cost (€)
Incremental Cost (€)
Effect (QALY)
Incremental Effect (QALY)
ICER
No screening 3,886 - 7.81185 - €23,423/QALY
Screening 3,971 85 7.81548 0.00363
8.2.2.9 Deterministic sensitivity analysis
In addition to the scenarios examined in detail above, deterministic univariate
sensitivity analysis was carried out for all the parameters in the model by varying
them within their 95% confidence bounds or by ±20%, to assess the sensitivity of
the overall results to individual parameter uncertainty. Separate tornado plots
showing the potential impact of uncertainty regarding transition probabilities, utilities
and costs on the overall ICER for screening are shown in Figures 8.16, 8.17 and
8.18.
Figure 8.16 Tornado plot – Transition probabilities
RR – Relative Risk; ICH – Intracranial Haemorrhage; IS – Ischaemic Stroke; DOAC – Direct Oral Anticoagulant;
AF – Atrial Fibrillation; ECG – Electrocardiogram; OAC – Oral Anticoagulant
0 20,000 40,000 60,000 80,000
RR of ICH Warfarin
RR ICH Antiplatelet
RR IS Antiplatelet
RR ICH DOACs
RR IS Warfarin
ECG uptake rate
RR IS DOACs
OAC rates in routine care
Mortality rate in year 1 of severe stroke
OAC rates after screening
ICER (€/QALY)

HTA of a national screening programme for atrial fibrillation in primary care
Health Information and Quality Authority
78
Figure 8.17 Tornado plot – Utilities
QALY – Quality Adjusted Life Year; DOAC – Direct Oral Anticoagulant; AF – Atrial Fibrillation; ICH – Intracranial
Haemorrhage; GI – Gastrointestinal
Figure 8.18 Tornado plot - Costs
DOAC – Direct Oral Anticoagulant; ECG – Electrocardiogram; ICH – Intracranial Haemorrhage;
16,000 26,000 36,000 46,000
QALY weight warfarin therapy
QALY weight DOAC treatment
QALY weight undiagnosed AF
QALY weight mild stroke
QALY weight antiplatelet therapy
QALY weight moderate stroke
QALY weight harmorrhagic stroke
QALY weight severe stroke
ICER (€/QALY)
15,000 20,000 25,000 30,000
Cost of 1 minute pulse palpation
Nursing home for severe stoke
Annual cost of DOACs
Annual cost of warfarin
Nursing home for moderate stoke
Cost of an ECG in primary care
Nursing home for haemorrhagic stoke
Annual cost of rate control drugs
Hospital care for severe stroke
Annual cost of antiplatelet therapy
Nursing home for mild stoke
Inpatient rehabilitation for severe stroke
Hospital care for a fatal stroke
ICER (€/QALY)
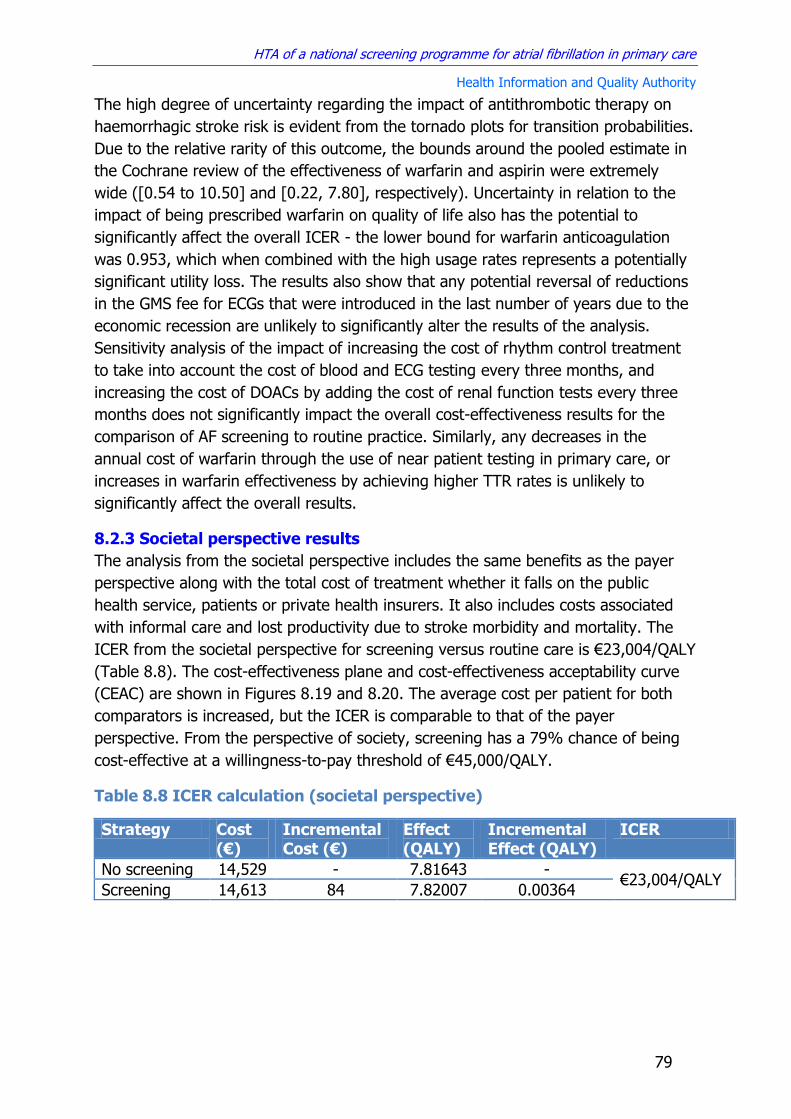
HTA of a national screening programme for atrial fibrillation in primary care
Health Information and Quality Authority
79
The high degree of uncertainty regarding the impact of antithrombotic therapy on
haemorrhagic stroke risk is evident from the tornado plots for transition probabilities.
Due to the relative rarity of this outcome, the bounds around the pooled estimate in
the Cochrane review of the effectiveness of warfarin and aspirin were extremely
wide ([0.54 to 10.50] and [0.22, 7.80], respectively). Uncertainty in relation to the
impact of being prescribed warfarin on quality of life also has the potential to
significantly affect the overall ICER - the lower bound for warfarin anticoagulation
was 0.953, which when combined with the high usage rates represents a potentially
significant utility loss. The results also show that any potential reversal of reductions
in the GMS fee for ECGs that were introduced in the last number of years due to the
economic recession are unlikely to significantly alter the results of the analysis.
Sensitivity analysis of the impact of increasing the cost of rhythm control treatment
to take into account the cost of blood and ECG testing every three months, and
increasing the cost of DOACs by adding the cost of renal function tests every three
months does not significantly impact the overall cost-effectiveness results for the
comparison of AF screening to routine practice. Similarly, any decreases in the
annual cost of warfarin through the use of near patient testing in primary care, or
increases in warfarin effectiveness by achieving higher TTR rates is unlikely to
significantly affect the overall results.
8.2.3 Societal perspective results
The analysis from the societal perspective includes the same benefits as the payer
perspective along with the total cost of treatment whether it falls on the public
health service, patients or private health insurers. It also includes costs associated
with informal care and lost productivity due to stroke morbidity and mortality. The
ICER from the societal perspective for screening versus routine care is €23,004/QALY
(Table 8.8). The cost-effectiveness plane and cost-effectiveness acceptability curve
(CEAC) are shown in Figures 8.19 and 8.20. The average cost per patient for both
comparators is increased, but the ICER is comparable to that of the payer
perspective. From the perspective of society, screening has a 79% chance of being
cost-effective at a willingness-to-pay threshold of €45,000/QALY.
Table 8.8 ICER calculation (societal perspective)
Strategy Cost (€)
Incremental Cost (€)
Effect (QALY)
Incremental Effect (QALY)
ICER
No screening 14,529 - 7.81643 - €23,004/QALY
Screening 14,613 84 7.82007 0.00364
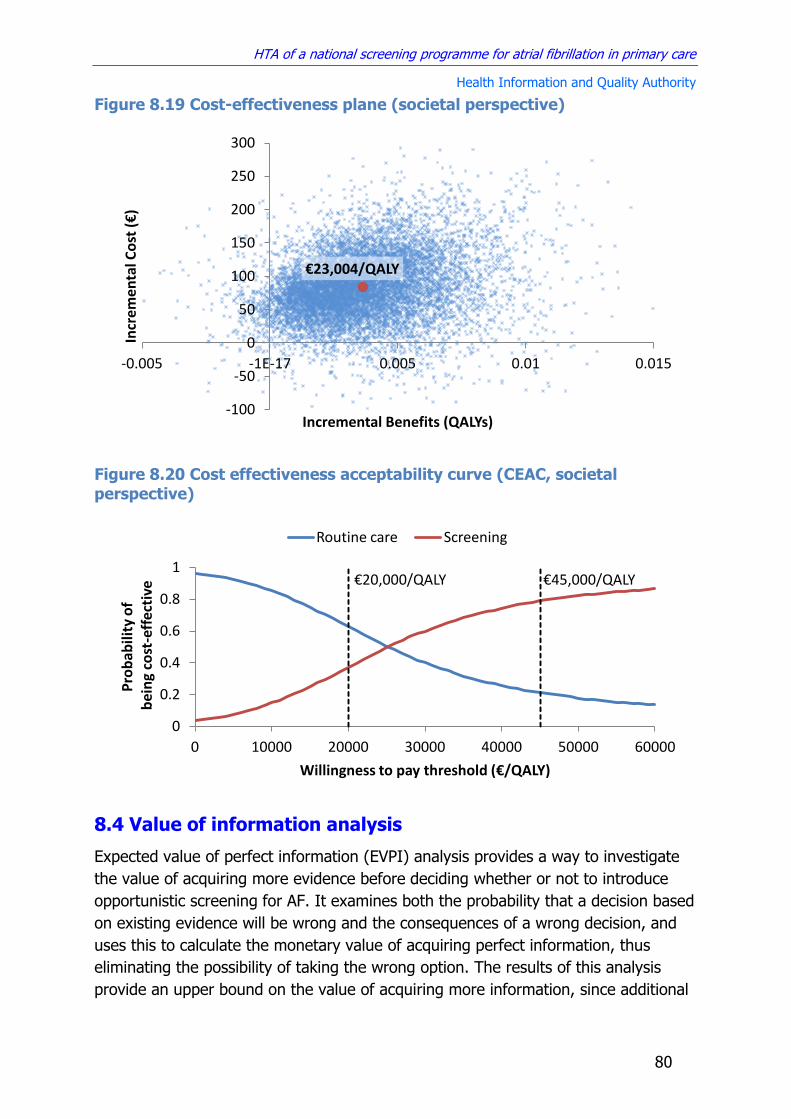
HTA of a national screening programme for atrial fibrillation in primary care
Health Information and Quality Authority
80
Figure 8.19 Cost-effectiveness plane (societal perspective)
Figure 8.20 Cost effectiveness acceptability curve (CEAC, societal
perspective)
8.4 Value of information analysis
Expected value of perfect information (EVPI) analysis provides a way to investigate
the value of acquiring more evidence before deciding whether or not to introduce
opportunistic screening for AF. It examines both the probability that a decision based
on existing evidence will be wrong and the consequences of a wrong decision, and
uses this to calculate the monetary value of acquiring perfect information, thus
eliminating the possibility of taking the wrong option. The results of this analysis
provide an upper bound on the value of acquiring more information, since additional
€23,004/QALY
-100
-50
0
50
100
150
200
250
300
-0.005 -1E-17 0.005 0.01 0.015
Incr
emen
tal C
ost
(€
)
Incremental Benefits (QALYs)
€20,000/QALY €45,000/QALY
0
0.2
0.4
0.6
0.8
1
0 10000 20000 30000 40000 50000 60000
Pro
bab
ility
of
bei
ng
cost
-eff
ecti
ve
Willingness to pay threshold (€/QALY)
Routine care Screening

HTA of a national screening programme for atrial fibrillation in primary care
Health Information and Quality Authority
81
research would generally only inform a small subset of parameters and is unlikely to
ever generate perfect information, so some level of uncertainty will remain.
EVPI analysis uses the data from the cost-effectiveness analysis to calculate the
expected value of perfect information each time the decision is made for a patient.
Therefore the overall EVPI is the combined EVPI for all patients who stand to benefit
from the additional information. The value of additional information is low when
there is little uncertainty about which option is the most cost-effective at a given
willingness-to-pay threshold, since more information is unlikely to change the result.
However, where there is a lot of uncertainty as to which comparator is the most
cost-effective, the value of additional information increases. The EVPI calculation for
opportunistic AF screening versus routine practice is shown in Figure 8.21. This
shows that the value of perfect information to inform decision making at a WTP
threshold of €45,000/QALY is approximately €280,000. This relatively low EVPI
estimate reflects the low level of uncertainty about the cost-effectiveness of
screening, which has an 83% chance of being cost-effective at this WTP threshold
(see Section 8.2.1).
Figure 8.21 Expected value of perfect information (EVPI) from the
perspective of the HSE
8.5 Budget impact results
A budget impact analysis (BIA) was conducted to calculate the total incremental
costs of screening from the perspective of the HSE over a five year time horizon. No
discounting was applied. VAT is applied where applicable in a BIA, however given the
fact that oral medications, nursing home care and medical aids and appliances
attract a VAT rate of zero, no additional tax costs were incurred. In this economic
analysis the opportunity cost of pulse palpation was calculated based on the cost of
staff time. As such it does not represent an additional direct cost to the HSE and is
not included in the BIA, so the cost of screening includes the direct cost of ECGs
€4
50
00
/QA
LY
€2
0,0
00
/QA
LY
0
100
200
300
400
500
600
700
800
900
10 20 30 40 50 60
EVP
I (€
) Th
ou
san
ds
Willingness to pay threshold (€/QALY) Thousands
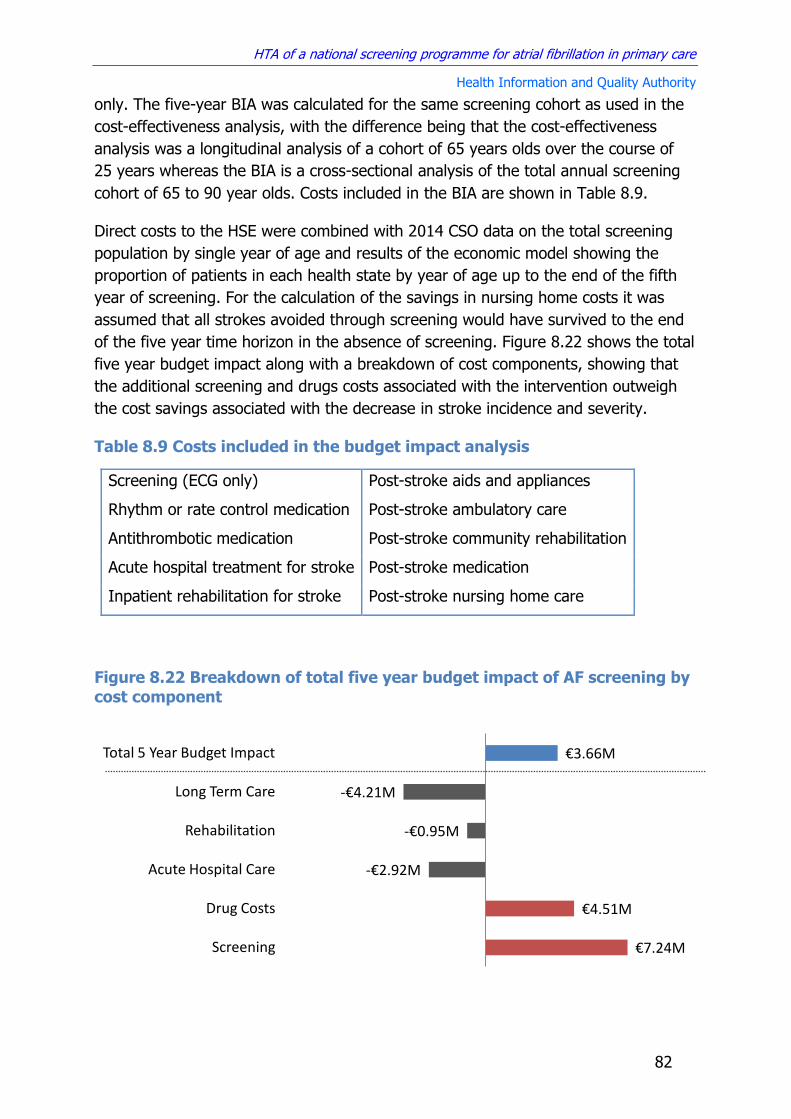
HTA of a national screening programme for atrial fibrillation in primary care
Health Information and Quality Authority
82
only. The five-year BIA was calculated for the same screening cohort as used in the
cost-effectiveness analysis, with the difference being that the cost-effectiveness
analysis was a longitudinal analysis of a cohort of 65 years olds over the course of
25 years whereas the BIA is a cross-sectional analysis of the total annual screening
cohort of 65 to 90 year olds. Costs included in the BIA are shown in Table 8.9.
Direct costs to the HSE were combined with 2014 CSO data on the total screening
population by single year of age and results of the economic model showing the
proportion of patients in each health state by year of age up to the end of the fifth
year of screening. For the calculation of the savings in nursing home costs it was
assumed that all strokes avoided through screening would have survived to the end
of the five year time horizon in the absence of screening. Figure 8.22 shows the total
five year budget impact along with a breakdown of cost components, showing that
the additional screening and drugs costs associated with the intervention outweigh
the cost savings associated with the decrease in stroke incidence and severity.
Table 8.9 Costs included in the budget impact analysis
Screening (ECG only) Post-stroke aids and appliances
Rhythm or rate control medication Post-stroke ambulatory care
Antithrombotic medication Post-stroke community rehabilitation
Acute hospital treatment for stroke Post-stroke medication
Inpatient rehabilitation for stroke Post-stroke nursing home care
Figure 8.22 Breakdown of total five year budget impact of AF screening by
cost component
€7.24M
€4.51M
-€2.92M
-€0.95M
-€4.21M
€3.66M
Screening
Drug Costs
Acute Hospital Care
Rehabilitation
Long Term Care
Total 5 Year Budget Impact

HTA of a national screening programme for atrial fibrillation in primary care
Health Information and Quality Authority
83
Results of the BIA show that the anticipated total incremental cost of opportunistic
AF screening to the HSE over five years is approximately €3.66 million. The majority
of the cost is made up of the cost of screening ECGs in primary care, which are
expected to cost over €1.45 million annually in the context of a national programme
where all screening ECGs are funded by the health service. The other major cost
driver is expenditure on medications for rhythm or rate control and antithrombotic
therapy for those diagnosed with AF. Incremental AF drug costs peak at
approximately €1.48M in the first year of screening, since more new cases are picked
up in the prevalent screen, before dropping to approximately €0.28M in incident
screening rounds, with the cumulative incremental cost over five years being
approximately €4.96M. The increased expenditure on AF screening and treatment is
mitigated by anticipated savings in the costs associated with stroke care. This
analysis assumes that no strokes are avoided in the first year of screening, but from
year two onwards the risk of stroke in those diagnosed with AF is reduced as a result
of antithrombotic therapy in AF patients identified through screening in previous
years. By the end of the fifth year of screening it is estimated that the intervention
will have been associated with an overall decrease of approximately 1.9% in the
incidence of first ever stroke in the screened cohort. When the five-year saving in
post-stroke medication costs are taken into account the total incremental cost of
drugs is €4.51M. Cumulative savings in the costs of acute care, medication,
rehabilitation and long-term care associated with this reduction in stroke over the
five year time horizon is estimated to be approximately €8.53M.
8.6 Impact of screening on specialist referrals
Opportunistic screening for AF in primary care is unlikely to require major
reorganisation of existing services or significantly impact existing patient care
pathways, since AF is already routinely detected and treated in primary care.
Increased diagnosis of AF is, however, likely to result in an increase in the number of
specialist referrals and further clinical investigations carried out.
The HSE National Clinical Programme for Stroke conducted a multi-site prospective
observational study on the feasibility of opportunistic AF screening of over 65’s in
general practice in Ireland, which included a total of 37 GP practices covering an
estimated population of approximately 25,000 people aged 65 years or over.(44) Over
the course of the six month study period, the pilot study screened 7,262 patients
and detected 55 new AF cases. The (6 month) rate of detection of new cases of AF
out of the entire screened population (omitting those with a prior diagnosis of AF)
was 0.008. The observed AF rate in the pilot study prior to screening was 10.1%.
This is almost twice the AF prevalence rate in over 65’s reported internationally.(131-
133) In this analysis using a nationally representative population of over 65’s with an
observed AF prevalence of 5.25%, where opportunistic screening detects
approximately 80% of AF cases, compared with the 62% of cases detected with
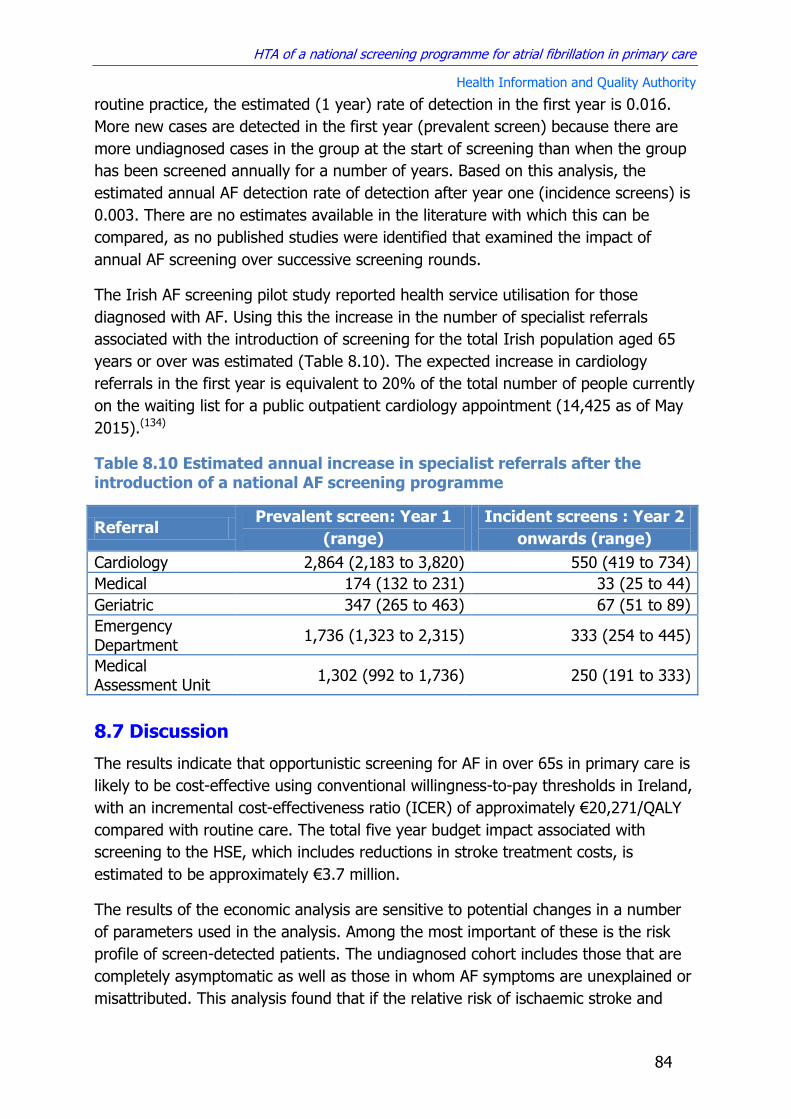
HTA of a national screening programme for atrial fibrillation in primary care
Health Information and Quality Authority
84
routine practice, the estimated (1 year) rate of detection in the first year is 0.016.
More new cases are detected in the first year (prevalent screen) because there are
more undiagnosed cases in the group at the start of screening than when the group
has been screened annually for a number of years. Based on this analysis, the
estimated annual AF detection rate of detection after year one (incidence screens) is
0.003. There are no estimates available in the literature with which this can be
compared, as no published studies were identified that examined the impact of
annual AF screening over successive screening rounds.
The Irish AF screening pilot study reported health service utilisation for those
diagnosed with AF. Using this the increase in the number of specialist referrals
associated with the introduction of screening for the total Irish population aged 65
years or over was estimated (Table 8.10). The expected increase in cardiology
referrals in the first year is equivalent to 20% of the total number of people currently
on the waiting list for a public outpatient cardiology appointment (14,425 as of May
2015).(134)
Table 8.10 Estimated annual increase in specialist referrals after the introduction of a national AF screening programme
Referral Prevalent screen: Year 1
(range)
Incident screens : Year 2
onwards (range)
Cardiology 2,864 (2,183 to 3,820) 550 (419 to 734)
Medical 174 (132 to 231) 33 (25 to 44)
Geriatric 347 (265 to 463) 67 (51 to 89)
Emergency Department
1,736 (1,323 to 2,315) 333 (254 to 445)
Medical Assessment Unit
1,302 (992 to 1,736) 250 (191 to 333)
8.7 Discussion
The results indicate that opportunistic screening for AF in over 65s in primary care is
likely to be cost-effective using conventional willingness-to-pay thresholds in Ireland,
with an incremental cost-effectiveness ratio (ICER) of approximately €20,271/QALY
compared with routine care. The total five year budget impact associated with
screening to the HSE, which includes reductions in stroke treatment costs, is
estimated to be approximately €3.7 million.
The results of the economic analysis are sensitive to potential changes in a number
of parameters used in the analysis. Among the most important of these is the risk
profile of screen-detected patients. The undiagnosed cohort includes those that are
completely asymptomatic as well as those in whom AF symptoms are unexplained or
misattributed. This analysis found that if the relative risk of ischaemic stroke and

HTA of a national screening programme for atrial fibrillation in primary care
Health Information and Quality Authority
85
systemic embolism in screen-detected patients is more than 14% lower than that of
cases detected in routine care, then screening would not be considered cost-
effective using conventional willingness-to-pay thresholds. No differentiation is made
between these groups for the purposes of calculating AF stroke risk per the
CHA2DS2-VASc score, but there are some studies in asymptomatic device-detected
AF that have suggested that the risk of ischaemic stroke could be up to 50% lower in
asymptomatic AF.(23) However, recent analysis of data from nine European countries
in the EORP-AF Pilot General Registry found that asymptomatic AF had a higher one-
year mortality than symptomatic AF.(68) Two studies are currently underway to
examine the balance of benefits and harms of OAC treatment in asymptomatic
AF.(135) The STROKESTOP study, which has already posted interim results for AF
detection (see section 3.1.2), will follow screen-detected AF patients in whom OAC
was used, to measure the impact of treatment on stroke rates.(20) The study is
expected to be completed in 2019. The ARTESiA trial is examining the benefits of
DOAC treatment for people with implantable device detected atrial high rate
episodes (AHREs).(136) The primary outcomes are stroke and major bleeding events
and results are also expected to be available in 2019. Of these two studies the
STROKESTOP trial is more suited to answering the question of interest in this
analysis, as it includes those who may have been experiencing mild, unrecognised
symptoms, rather than being limited to those who have completely asymptomatic
AF.
Decreasing the age at which screening starts reduces the cost-effectiveness of any
prospective programme. Starting screening at age 50 is unlikely to be cost-effective
at a willingness to pay threshold of €45,000/QALY, and ICERs for start ages between
55 to 70 years range from €38,000/QALY to €15,000/QALY compared to no
screening. The length of the screening interval also has a significant impact on cost-
effectiveness results. In a scenario analysis that varied the frequency of opportunistic
pulse palpation between once every year to once every five years for all over 65s,
screening once every three years was identified as the optimal strategy at a
willingness to pay threshold of €45,000/QALY. However, these results need to be
interpreted with caution, as all the available evidence on the effectiveness of
screening comes from studies carried out in people aged 65 years and over, and no
studies have as yet compared the results of using different screening intervals. Other
influential parameters include the rate of AF detection in routine care and the
sensitivity of the two stage screening test. The analysis found that screening is likely
to be cost-effective if it increases the rate of AF detection by at least 8%.
The cost-effectiveness estimates were not greatly altered by plausible changes in the
baseline incidence of AF or changes to the proportion of people who are prescribed
DOACs, warfarin or antiplatelet therapy. The results were also relatively insensitive
to changes in the opportunity cost of pulse palpation and the intervention remained

HTA of a national screening programme for atrial fibrillation in primary care
Health Information and Quality Authority
86
cost-effective when uptake rates were lowered to represent a worst case scenario for
opportunistic screening.
Among the limitations of this analysis is that while both Irish and UK data sources
indicate that the proportion of AF cases detected by routine care is approximately
60%, there is a lack of data on the effect of age on AF detection. In this analysis it
was assumed that the rate of undiagnosed AF was consistent across all ages. If it
were the case that incident AF had a higher probability of remaining undiagnosed in
younger or older age groups this may have implications for the optimal start age of
screening. Another limitation is the lack of studies involving multiple AF screening
rounds over a period of years, as all studies to date have evaluated once off
screening in a particular age group. A conservative approach was adopted in the
primary analysis, by assuming that prevalent cases that are undetected in the initial
screening round remain undetected in subsequent screening rounds. This is likely to
underestimate the clinical effectiveness of multiple rounds of screening. The opposite
approach of assuming that undiagnosed AF has an equal chance of being detected in
each round risks overestimating the impact of screening, since it is likely that factors
such as whether asymptomatic AF is paroxysmal or persistent, or has atypical
electrocardiographic presentation, make undetected cases more likely to remain
undetected. However as the results show, AF screening is likely to be cost effective
even using a conservative approach to estimating the impact of multiple screening
rounds.
8.8 Key points
A Markov model was developed to compare the costs and benefits of annual opportunistic AF screening in primary care for a cohort of men and women aged 65 years and older over a 25 year time horizon. The choice of comparator was informed by the recommendations contained in the National Cardiovascular Policy 2010-2019 and the pilot AF screening project conducted by the HSE National Clinical Programme for Stroke and is consistent with the best evidence on the effectiveness of screening.
There is a high level of uncertainty regarding a number of key parameters
needed to estimate the cost-effectiveness of AF screening in Ireland. In
this analysis conservative estimates of the effectiveness of screening on AF
detection were used and a sensitivity analysis was conducted to estimate
the impact of uncertainty in this and other parameters.
Based on the results of the primary analysis, a strategy of annual
opportunistic screening would result in 1,944 additional AF cases being
detected in the screened cohort compared with current practice.
Based on the estimated current standard of care for antithrombotic
therapy in patients with AF, this will result in approximately 157 fewer
strokes.

HTA of a national screening programme for atrial fibrillation in primary care
Health Information and Quality Authority
87
Screening is associated with an incremental cost-effectiveness ratio of
€20,271/QALY, giving it an 83% probability of being cost-effective at a
willingness-to-pay threshold of €45,000/QALY.
The cost-effectiveness results are sensitive to changes in the start age of
screening, the frequency of screening and the baseline risk of ischaemic
stroke and systemic embolism in those who would not have been
diagnosed with AF through routine practice in the absence of screening.
Changes in the proportion of AF patients who are prescribed warfarin,
direct oral anticoagulants and antiplatelet therapy are unlikely to have a
major impact on the cost-effectiveness of screening.
Budget impact analysis, which did not include a set fee for pulse palpation,
showed that the total incremental cost of opportunistic AF screening to the
HSE over five years is approximately €3.7 million. This includes the
additional costs associated with screening and pharmacological treatment
of AF patients, as well as reductions in the cost of stroke care over the five
year time horizon.
It is estimated that screening could result in approximately 2,864
additional referrals for an outpatient cardiology appointment in the first
year after implementation, and approximately 550 additional referrals
every year thereafter.
HTA of a national screening programme for atrial fibrillation in primary care
Health Information and Quality Authority
88
9 Discussion and conclusion
This analysis combined the best available data on the effect of antithrombotic
treatment on stroke outcomes with a conservative estimate of the increase in AF
detection associated with repeated annual pulse palpation, which assumed that
incident cases that are not detected by screening remain undetected in subsequent
screening rounds. Results of the economic analysis found that a national annual
opportunistic AF screening programme for adults aged 65 years and older in primary
care is likely to be cost-effective using a willingness-to-pay threshold of
€45,000/QALY. The total five year budget impact of screening for the HSE, which
includes saving as a result strokes avoided over the five year time horizon, is
estimated to be approximately €3.66M.
The results are sensitive to changes in the stroke risk profile of the additional AF
cases identified by screening. If the relative risk of ischaemic stroke and systemic
embolism in screen-detected AF patients was more than 14% lower than those
detected in routine practice, then screening would no longer be cost-effective at a
willingness-to-pay threshold of €45,000/QALY. In the absence of definitive evidence
of any difference in the risk profile of undiagnosed versus diagnosed AF, it is
generally assumed that the risk of stroke is similar for both.(68;137) Two studies are
currently in progress that will examine the benefits of oral anticoagulation in
asymptomatic or screen-detected AF patients.(136;138) However both of these are not
due to be completed until 2019.
The primary analysis compared the cost-effectiveness of a national AF screening
programme involving annual opportunistic pulse palpation for men and women aged
65 years and over in primary care with routine practice (no screening). The choice of
comparator was informed by the recommendations contained in the National
Cardiovascular Policy 2010-2019 and the pilot AF screening project conducted by the
HSE National Clinical Programme for Stroke and is consistent with the best available
evidence on the effectiveness of screening. A sensitivity analysis indicated that
lowering the start age decreases the cost-effectiveness of screening. Conversely,
increasing the start age to 70 years would have an ICER of approximately
€15,000/QALY compared with routine care. If it is assumed that increasing the
screening interval beyond once per year does not affect the performance of the
screening programme, then this would increase the cost-effectiveness of a
prospective programme with a three year screening interval being the optimal
strategy at a willingness to pay threshold of €45,000/QALY. However, these results
need to be interpreted with caution, as all the available evidence on the
effectiveness of screening comes from studies carried out in people aged 65 years
and over, and no studies have as yet compared the results of using different
screening intervals. Based on the available data screening is estimated to result in an
absolute increase of 18% in the rate of AF diagnosis in the screened cohort. A

HTA of a national screening programme for atrial fibrillation in primary care
Health Information and Quality Authority
89
sensitivity analysis that varied the estimates of the proportion of AF cases detected
by routine practice and screening found that the intervention is likely to remain cost-
effective as long as it increases the detection rates of AF by at least 8%. A budget
impact analysis from the perspective of the HSE estimated a total incremental cost of
screening over five years of approximately €3.7 million. The annual incremental cost
of AF drug therapy is higher in the first year of screening as a greater number of
people are detected in the first (prevalent) screen compared to subsequent
(incident) screens. Screening is expected to decrease spending on acute hospital
stroke care and long-term residential care for stroke survivors.
A review of previously published economic analyses identified two studies that
examined the cost-effectiveness of AF screening using pulse palpation in primary
care, both of which concluded that it was likely to be cost-effective compared with
routine practice. However, no country was identified as having a national AF
screening programme currently in place. In July 2014, the UK National Screening
Committee recommended against offering screening for all those aged 65 years and
over, due to a lack of evidence demonstrating that those identified as at risk of
stroke through screening would benefit from early diagnosis.(23) This decision is due
to be reviewed in 2017, by which time an NIHR funded HTA that is currently in
progress to examine the cost-effectiveness of screening in the UK is expected to
have been published.(139) More recently, the Swedish Dental and Pharmaceutical
Benefits Agency, whose remit is to determine which pharmaceutical and medical
devices shall be subsidised by the state, has concluded that the benefits of primary
preventive screening with thumb ECG (per the STROKESTOP trial) justifies the costs
of screening. They do, however, point out that there is currently no information
regarding when to initiate a national screening programme (i.e. at which cut-off age
the method becomes cost-effective) and that they intend to evaluate this in a
separate report in the future.
There are a number of issues with regard to the implementation of a screening
programme that fall outside the scope of this report, which could potentially affect
decision making. These include identification of appropriate methods for flagging
patient’s notes in GP practices to ensure that screening is offered to everyone in the
target population. The SAFE trial in the UK restricted participation to GP practices
that had computerised record keeping systems specifically for this purpose. This
analysis also assumes that all GP practices have access to ECG equipment with
interpretative software, which may not be the case for a minority of practices in
Ireland. Given the potential implications that a national screening programme has for
the number of specialist referrals and requests for additional investigations,
consideration may need to be given to the development of referral guidelines for GPs
in advance of its introduction.

HTA of a national screening programme for atrial fibrillation in primary care
Health Information and Quality Authority
90
In conclusion, although previous cost-effectiveness analyses have concluded that
screening would likely be cost-effective, there is considerable uncertainty associated
with key parameters that could have a significant impact on the findings. No other
country has as yet implemented a national AF screening programme. An economic
analysis comparing the costs and benefits of annual opportunistic screening of men
and women aged 65 years and older in primary care in Ireland found that the
intervention is likely to be cost-effective using conventional willingness-to-pay
thresholds, assuming that those detected through screening have a comparable
stroke risk profile as those detected through routine practice. Screening is also
associated with significant incremental costs of approximately €3.7 million over the
first five years.
HTA of a national screening programme for atrial fibrillation in primary care
Health Information and Quality Authority
91
10 References
(1) Levy S, Camm AJ, Saksena S, Aliot E, Breithardt G, Crijns H, et al.
International consensus on nomenclature and classification of atrial fibrillation. Europace. 2003; 5(2) pp.119-22.
(2) Wolf PA, Abbott RD, Kannel WB. Atrial fibrillation as an independent risk factor for stroke: the Framingham Study. Stroke. 1991; 22(8) pp.983-8.
(3) Feinberg WM, Blackshear JL, Laupacis A, Kronmal R, Hart RG. Prevalence, age distribution, and gender of patients with atrial fibrillation: Analysis and implications. Archives of Internal Medicine. 1995; 155(5) pp.469-73.
(4) Go AS, Hylek EM, Phillips KA. Prevalence of diagnosed atrial fibrillation in adults: National implications for rhythm management and stroke prevention: the anticoagulation and risk factors in atrial fibrillation (atria) study. JAMA. 2001; 285(18) pp.2370-5.
(5) Wilke T, Groth A, Mueller S, Pfannkuche M, Verheyen F, Linder R, et al. Incidence and prevalence of atrial fibrillation: an analysis based on 8.3 million patients. Europace. 2013; 15(4) pp.486-93.
(6) Benjamin EJ, Levy D, Vaziri SM, D'Agostino RB, Belanger AJ, Wolf PA. Independent risk factors for atrial fibrillation in a population-based cohort: The framingham heart study. JAMA. 1994; 271(11) pp.840-4.
(7) Kerr CR, Humphries K. Gender-Related Differences in Atrial Fibrillation*. Journal of the American College of Cardiology. 2005; 46(7) pp.1307-8.
(8) Lip GYH. Stroke and bleeding risk assessment in atrial fibrillation: when, how, and why? European Heart Journal. 2013; 34(14) pp.1041-9.
(9) Economic and Social Research Institute (ESRI), Royal College of Surgeons in Ireland (RCSI). Cost of Stroke in Ireland. Dublin, Ireland: Irish Heart Foundation; 2010.
(10) Kelly PJ, Crispino G, Sheehan O, Kelly L, Marnane M, Merwick A, et al. Incidence, Event Rates, and Early Outcome of Stroke in Dublin, Ireland: The North Dublin Population Stroke Study. Stroke. 2012; 43(8) pp.2042-7.
(11) HSE National Clinical Programme for Stroke. Appendix 19: Atrial Fibrillation Care Pathway (June 2012 Draft). 2012, [Online]. Available from: http://hse.ie/eng/about/Who/clinical/natclinprog/strokeprogramme/Policy_Documents/moc.pdf. Accessed on: 22 June 2015.
(12) Camm AJ, Kirchhof P, Lip GY, Schotten U, Savelieva I, Ernst S, et al. Guidelines for the management of atrial fibrillation: the Task Force for the Management of Atrial Fibrillation of the European Society of Cardiology (ESC). Europace. 2010; 12(10) pp.1360-420.
HTA of a national screening programme for atrial fibrillation in primary care
Health Information and Quality Authority
92
(13) Furberg CD, Psaty BM, Manolio TA, Gardin JM, Smith VE, Rautaharju PM. Prevalence of atrial fibrillation in elderly subjects (the Cardiovascular Health Study). Am J Cardiol. 1994; 74(3) pp.236-41.
(14) Savelieva I, Camm AJ. Clinical relevance of silent atrial fibrillation: Prevalence, prognosis, quality of life, and management. J Intervent Card Electrophysiol. 2000; 4(2) pp.369-82.
(15) Hannon N, Sheehan O, Kelly L, Marnane M, Merwick A, Moore A, et al. Stroke associated with atrial fibrillation--incidence and early outcomes in the north Dublin population stroke study. Cerebrovasc Dis. 2010; 29(1) pp.43-9.
(16) Wilson JMG, Jungner G. Principles and practice of screening for disease. Geneva: World Health Organization; 1968.
(17) Department of Health. Changing Cardiovascular Health: National Cardiovascular Health Policy 2010 – 2019. Dublin, Ireland: Department of Health (Ireland); 2010.
(18) Moran PS, Flattery MJ, Teljeur C, Ryan M, Smith SM. Effectiveness of systematic screening for the detection of atrial fibrillation. Cochrane Database Syst Rev. 2013; 4 p.CD009586.
(19) Hobbs FDR, Fitzmaurice DA, Mant J, Murray E, Jowett S, Bryan S, et al. A randomised controlled trial and cost-effectiveness study of systematic screening (targeted and total population screening) versus routine practice for the detection of atrial fibrillation in people aged 65 and over. The SAFE study. Health Technol Assess. 2005; 9(40) p.iii-71.
(20) Svennberg E, Engdahl J, Al-Khalili F, Friberg L, Frykman V, Rosenqvist M. Mass Screening for Untreated Atrial Fibrillation: The STROKESTOP Study. Circulation. 2015;
(21) Perula-de-Torres LA, Martinez-Adell MA, Gonzalez-Blanco V, Baena-Diez JM, Martin-Rioboo E, Parras-Rejano JM, et al. Opportunistic detection of atrial fibrillation in subjects aged 65 years or older in primare care: a randomised clinical trial of efficacy. DOFA-AP study protocol. BMC family practice. 2012;
(22) Personal communication. 9 June 2015.
(23) UK National Screening Committee. The UK NSC recommendation on Atrial Fibrillation screening in adults. 2014, [Online]. Available from: www.screening.nhs.uk/atrialfibrillation. Accessed on: 26 May 2015.
(24) Cowan C, Healicon R, Robson I, Long WR, Barrett J, Fay M, et al. The use of anticoagulants in the management of atrial fibrillation among general practices in England. Heart. 2013; 99(16) pp.1166-72.

HTA of a national screening programme for atrial fibrillation in primary care
Health Information and Quality Authority
93
(25) Holt TA, Hunter TD, Gunnarsson C, Khan N, Cload P, Lip GY. Risk of stroke and oral anticoagulant use in atrial fibrillation: a cross-sectional survey. Br J Gen Pract. 2012; 62(603) p.e710-e717.
(26) Maeda K, Shimbo T, Fukui T. Cost-effectiveness of a community-based screening programme for chronic atrial fibrillation in Japan. Journal of Medical Screening. 2004; 11(2) pp.97-102.
(27) Lowres N, Neubeck L, Salkeld G, Krass I, McLachlan AJ, Redfern J, et al. Feasibility and cost-effectiveness of stroke prevention through community screening for atrial fibrillation using iPhone ECG in pharmacies. The SEARCH-AF study. Thromb Haemost. 2014; 111(6) pp.1167-76.
(28) Rhys GC, Azhar MF, Foster A. Screening for atrial fibrillation in patients aged 65 years or over attending annual flu vaccination clinics at a single general practice. Qual Prim Care. 2013; 21(2) pp.131-40.
(29) Aronsson M, Svennberg E, Rosenqvist M+, Engdahl J, Al-Khalili F, Friberg L, et al. Cost-effectiveness of mass screening for untreated atrial fibrillation using intermittent ECG recording. Europace. 2015;
(30) Jaime CJ, Eddy DM, Kan H, Kaltz C, Patel B, Eldessouki R, et al. Questionnaire to assess relevance and credibility of modeling studies for informing health care decision making: an ISPOR-AMCP-NPC Good Practice Task Force report. Value Health. 2014; 17(2) pp.174-82.
(31) Frewen J, Finucane C, Cronin H, Rice C, Kearney PM, Harbison J, et al. Factors that influence awareness and treatment of atrial fibrillation in older adults. QJM. 2013; 106(5) pp.415-24.
(32) Heeringa J. Atrial fibrillation: is the prevalence rising? Europace. 2010; 12(4) pp.451-2.
(33) Schnabel RB, Yin X, Gona P, Larson MG, Beiser AS, McManus DD, et al. 50 year trends in atrial fibrillation prevalence, incidence, risk factors, and mortality in the Framingham Heart Study: a cohort study. The Lancet. 2015;(0)
(34) Chugh SS, Blackshear JL, Shen WK, Hammill SC, Gersh BJ. Epidemiology and natural history of atrial fibrillation: clinical implications. Journal of the American College of Cardiology. 2001; 37(2) pp.371-8.
(35) Chen RL, Balami JS, Esiri MM, Chen LK, Buchan AM. Ischemic stroke in the elderly: an overview of evidence. Nat Rev Neurol. 2010; 6(5) pp.256-65.
(36) Wren M, Kelly P. Deriving a Method to Estimate Incidence of Stroke in Ireland. Dublin: ESRI; Working Paper No. 469. 2013.
(37) Wolf PA, Kannel WB, McGee DL. Duration of atrial fibrillation and imminence of stroke: The Framingham Study. Stroke. 1983; 14(5) pp.664-7.

HTA of a national screening programme for atrial fibrillation in primary care
Health Information and Quality Authority
94
(38) Lin HJ, Wolf PA, Kelly-Hayes M, Beiser AS, Kase CS, Benjamin EJ, et al. Stroke Severity in Atrial Fibrillation: The Framingham Study. Stroke. 1996; 27(10) pp.1760-4.
(39) Grant RL. Converting an odds ratio to a range of plausible relative risks for better communication of research findings. BMJ. 2014; 348
(40) Granger CV, Dewis LS, Peters NC, Sherwood CC, Barrett JE. Stroke rehabilitation: analysis of repeated Barthel index measures. Arch Phys Med Rehabil. 1979; 60(1) pp.14-7.
(41) The National Audit of Stroke Care Research Team. Irish National Audit of Stroke Care (INASC). Dublin, Ireland: Irish Heart Foundation; 2008.
(42) Hannon N, Sheehan O, Kelly L, Marnane M, Merwick A, Moore A, et al. Stroke Associated with Atrial Fibrillation - Incidence and Early Outcomes in the North Dublin Population Stroke Study. Cerebrovasc Dis. 2009; 29(1) pp.43-9.
(43) Barry M. Re: Issues in relation to prescribing safety of New Oral AntiCoagulants (NOACs). 2014, [Online]. Available from: www.hse.ie/eng/about/Who/clinical/natclinprog/medicinemanagementprogramme/NOACs.pdf. Accessed on: 12 May 2015.
(44) Smyth B, Marsden P, Corcoran R, Walsh R, Brennan C, McSharry K, Clarke J, Kelly PJ, and Harbison J. Feasibility of opportunistic screening for atrial fibrillation in a rural area with low population density [Unpublished Draft]. 2015.
(45) Robson J, Dostal I, Mathur R, Sohanpal R, Hull S, Antoniou S, et al. Improving anticoagulation in atrial fibrillation: observational study in three primary care trusts. Br J Gen Pract. 2014; 64(622) p.e275-e281.
(46) Chen HS, Wen JM, Wu SN, Liu JP. Catheter ablation for paroxysmal and persistent atrial fibrillation. Cochrane Database of Systematic Reviews. 2012;
(47) Aguilar M, I, Hart R. Antiplatelet therapy for preventing stroke in patients with non-valvular atrial fibrillation and no previous history of stroke or transient ischemic attacks. Cochrane Database of Systematic Reviews. 2005;
(48) Aguilar M, I, Hart R. Oral anticoagulants for preventing stroke in patients with non-valvular atrial fibrillation and no previous history of stroke or transient ischemic attacks. Cochrane Database of Systematic Reviews. 2005;
(49) Aguilar M, I, Hart R, Pearce LA. Oral anticoagulants versus antiplatelet therapy for preventing stroke in patients with non-valvular atrial fibrillation and no history of stroke or transient ischemic attacks. Cochrane Database of Systematic Reviews. 2007;
(50) Ruff CT, Giugliano RP, Braunwald E, Hoffman EB, Deenadayalu N, Ezekowitz MD, et al. Comparison of the efficacy and safety of new oral anticoagulants

HTA of a national screening programme for atrial fibrillation in primary care
Health Information and Quality Authority
95
with warfarin in patients with atrial fibrillation: a meta-analysis of randomised trials. The Lancet. 2015; 383(9921) pp.955-62.
(51) Dogliotti A, Paolasso E, Giugliano RP. Current and new oral antithrombotics in
non-valvular atrial fibrillation: a network meta-analysis of 79Çà808 patients.
Heart. 2014; 100(5) pp.396-405.
(52) Connolly SJ, Laupacis A, Gent M, Roberts RS, Cairns JA, Joyner C. Canadian Atrial Fibrillation Anticoagulation (CAFA) Study. J Am Coll Cardiol. 1991; 18(2) pp.349-55.
(53) Gullov AL, Koefoed BG, Petersen P, Pedersen TS, Andersen ED, Godtfredsen J, et al. Fixed minidose warfarin and aspirin alone and in combination vs adjusted-dose warfarin for stroke prevention in atrial fibrillation: Second Copenhagen Atrial Fibrillation, Aspirin, and Anticoagulation Study. Arch Intern Med. 1998; 158(14) pp.1513-21.
(54) Pengo V, Zasso A, Barbero F, Banzato A, Nante G, Parissenti L, et al. Effectiveness of fixed minidose warfarin in the prevention of thromboembolism and vascular death in nonrheumatic atrial fibrillation. Am J Cardiol. 1998; 82(4) pp.433-7.
(55) Reynolds MW, Fahrbach K, Hauch O, Wygant G, Estok R, Cella C, et al. Warfarin anticoagulation and outcomes in patients with atrial fibrillation: a systematic review and metaanalysis. Chest. 2004; 126(6) pp.1938-45.
(56) RYAN F, BYRNE S, O'Shea S. Randomized controlled trial of supervised patient self-testing of warfarin therapy using an internet-based expert system. Journal of Thrombosis and Haemostasis. 2009; 7(8) pp.1284-90.
(57) Molony S. Warfarin treatment - Getting the balance right. Forum . 2010. ICGP.
(58) Hylek EM, Go AS, Chang Y, Jensvold NG, Henault LE, Selby JV, et al. Effect of Intensity of Oral Anticoagulation on Stroke Severity and Mortality in Atrial Fibrillation. New England Journal of Medicine. 2003; 349(11) pp.1019-26.
(59) O'Donnell M, Oczkowski W, Fang J, Kearon C, Silva J, Bradley C, et al. Preadmission antithrombotic treatment and stroke severity in patients with atrial fibrillation and acute ischaemic stroke: an observational study. Lancet Neurol. 2006; 5(9) pp.749-54.
(60) Hannon N, Arsava EM, Audebert HJ, Ay H, Crowe M, N+¡ Chr+¦in+¡n D, et al. Antithrombotic treatment at onset of stroke with atrial fibrillation, functional outcome, and fatality: a systematic review and meta-analysis. Int J Stroke. 2015; p.n/a.
(61) Ottosen TP, Svendsen ML, Hansen ML, Brandes A, Andersen G, Husted SE, et al. Preadmission oral anticoagulant therapy and clinical outcome in patients

HTA of a national screening programme for atrial fibrillation in primary care
Health Information and Quality Authority
96
hospitalised with acute stroke and atrial fibrillation. Dan Med J. 2014; 61(9) p.A4904.
(62) Indredavik B, Rohweder G, Lydersen S. Frequency and effect of optimal anticoagulation before onset of ischaemic stroke in patients with known atrial fibrillation. J Intern Med. 2005; 258(2) pp.133-44.
(63) Schwammenthal Y, Bornstein N, Schwammenthal E, Schwartz R, Goldbourt U, Tsabari R, et al. Relation of Effective Anticoagulation in Patients With Atrial Fibrillation to Stroke Severity and Survival (from the National Acute Stroke Israeli Survey [NASIS]). The American Journal of Cardiology. 2010; 105(3) pp.411-6.
(64) Mant J, Fitzmaurice DA, Hobbs FD, Jowett S, Murray ET, Holder R. Accuracy of diagnosing atrial fibrillation on electrocardiogram by primary care practitioners and interpretative diagnostic software: analysis of data from screening for atrial fibrillation in the elderly (SAFE) trial. BMJ (Clinical research ed ). 2007;
(65) Trinity College Dublin. The Irish Longitudinal Study on Ageing (TILDA). 2015, [Online]. Available from: http://tilda.tcd.ie/. Accessed on: 13 July 2015.
(66) ESRI. Living in Ireland Survey. 2015, [Online]. Available from: www.ucd.ie/issda/data/livinginirelandlii/. Accessed on: 13 July 2015.
(67) Evans T. Atrial fibrillation prevalence estimates. 2015, [Online]. Available from: http://www.yhpho.org.uk/default.aspx?RID=207429.
(68) Boriani G, Laroche C, Diemberger I, Fantecchi E, Popescu MI, Rasmussen LH, et al. Asymptomatic Atrial Fibrillation: Clinical Correlates, Management, and Outcomes in the EORP-AF Pilot General Registry. The American Journal of Medicine. 2015; 128(5) pp.509-18.
(69) Luengo-Fernandez R, Gray AM, Bull L, Welch S, Cuthbertson F, Rothwell PM. Quality of life after TIA and stroke: ten-year results of the Oxford Vascular Study. Neurology. 2013; 81(18) pp.1588-95.
(70) Singer RB. Pitfalls of inferring annual mortality from inspection of published survival curves. J Insur Med. 1994; 26(3) pp.333-8.
(71) Poon MT, Fonville AF, Al-Shahi SR. Long-term prognosis after intracerebral haemorrhage: systematic review and meta-analysis. J Neurol Neurosurg Psychiatry. 2014; 85(6) pp.660-7.
(72) Dennis MS, Burn JP, Sandercock PA, Bamford JM, Wade DT, Warlow CP. Long-term survival after first-ever stroke: the Oxfordshire Community Stroke Project. Stroke. 1993; 24(6) pp.796-800.

HTA of a national screening programme for atrial fibrillation in primary care
Health Information and Quality Authority
97
(73) Fogelholm R, Murros K, Rissanen A, Avikainen S. Long term survival after primary intracerebral haemorrhage: a retrospective population based study. J Neurol Neurosurg Psychiatry. 2005; 76(11) pp.1534-8.
(74) Hillen T, Coshall C, Tilling K, Rudd AG, McGovern R, Wolfe CDA. Cause of Stroke Recurrence Is Multifactorial: Patterns, Risk Factors, and Outcomes of Stroke Recurrence in the South London Stroke Register. Stroke. 2003; 34(6) pp.1457-63.
(75) Schlegel D, Kolb SJ, Luciano JM, Tovar JM, Cucchiara BL, Liebeskind DS, et al. Utility of the NIH Stroke Scale as a predictor of hospital disposition. Stroke. 2003; 34(1) pp.134-7.
(76) Ahmed R, Zuberi BF, Afsar S. Stroke scale score and early prediction of outcome after stroke. J Coll Physicians Surg Pak. 2004; 14(5) pp.267-9.
(77) Adams HP, Jr., Davis PH, Leira EC, Chang KC, Bendixen BH, Clarke WR, et al. Baseline NIH Stroke Scale score strongly predicts outcome after stroke: A report of the Trial of Org 10172 in Acute Stroke Treatment (TOAST). Neurology. 1999; 53(1) pp.126-31.
(78) Ara R, Brazier JE. Using Health State Utility Values from the General Population to Approximate Baselines in Decision Analytic Models when Condition-Specific Data are Not Available. Value in Health. 2011; 14(4) pp.539-45.
(79) Thrall G, Lane D, Carroll D, Lip GY. Quality of life in patients with atrial fibrillation: a systematic review. Am J Med. 2006; 119(5) pp.448-19.
(80) Chung EH, Pursell I, King DR, Mounsey JP, Schwartz JD, Kumar P, et al. Minimally symptomatic patients with atrial fibrillation are actually moderately symptomatic and have significant symptom reduction with rhythm control. Heart Rhythm. 2013; 10(5) p.S388.
(81) Sorensen SV, Kansal AR, Connolly S, Peng S, Linnehan J, Bradley-Kennedy C, et al. Cost-effectiveness of dabigatran etexilate for the prevention of stroke and systemic embolism in atrial fibrillation: a Canadian payer perspective. Thromb Haemost. 2011; 105(5) pp.908-19.
(82) Sullivan PW, Arant TW, Ellis SL, Ulrich H. The cost effectiveness of anticoagulation management services for patients with atrial fibrillation and at high risk of stroke in the US. Pharmacoeconomics. 2006; 24(10) pp.1021-33.
(83) Savelieva I, PAQUETTE M, Dorian P, LUDERITZ B, CAMM A. Quality of life in patients with silent atrial fibrillation. Heart. 2001; 85(2) pp.216-7.
(84) Radholm K, +ûstgren CJ, Alehagen U, Falk M, Wressle E, Marcusson J, et al. Atrial fibrillation (AF) and co-morbidity in elderly. A population based survey of 85 years old subjects. Archives of Gerontology and Geriatrics. 2011; 52(3) p.e170-e175.

HTA of a national screening programme for atrial fibrillation in primary care
Health Information and Quality Authority
98
(85) Roalfe AK, Bryant TL, Davies MH, Hackett TG, Saba S, Fletcher K, et al. A cross-sectional study of quality of life in an elderly population (75 years and over) with atrial fibrillation: secondary analysis of data from the Birmingham Atrial Fibrillation Treatment of the Aged study. Europace. 2012; 14(10) pp.1420-7.
(86) Freeman JV, Zhu RP, Owens DK, Garber AM, Hutton DW, Go AS, et al. Cost-Effectiveness of Dabigatran Compared With Warfarin for Stroke Prevention in Atrial Fibrillation. Annals of Internal Medicine. 2011; 154(1) pp.1-11.
(87) Gage BF, Cardinalli AB, Owens DK. The effect of stroke and stroke prophylaxis with aspirin or warfarin on quality of life. Archives of Internal Medicine. 1996; 156(16) pp.1829-36.
(88) O'Brien CL, Gage BF. Costs and effectiveness of ximelagatran for stroke prophylaxis in chronic atrial fibrillation. JAMA. 2005; 293(6) pp.699-706.
(89) Tengs TO, Lin TH. A meta-analysis of quality-of-life estimates for stroke. Pharmacoeconomics. 2003; 21(3) pp.191-200.
(90) CADTH. Antithrombotic Agents for the Prevention of Stroke and Systemic Embolism in Patients With Atrial Fibrillation. Ottawa, Ontario: Canadian Agency for Drugs and Technologies in Health; 2013.
(91) HIQA. Guidelines for the Economic Evaluation of Health Technologies in Ireland. Dublin, Ireland: Health Information and Quality Authority; 2014.
(92) Swiftbrook Medical Centre. 2015, [Online]. Available from: www.swiftbrookmedical.ie/surgery_consultation_fees. Accessed on: 12 May 2015.
(93) The Albany Clinic. 2015, [Online]. Available from: www.albanyclinic.ie/prices.html. Accessed on: 12 May 2015.
(94) Primary Care and reimbursement Service (PCRS). Circular no. 009/2013 - Reduction of payments to General Practitioners Regulations SI no 277 and 278. 2013, [Online]. Available from: www.hse.ie/eng/staff/PCRS/circulars/FEMPI%202013.pdf. Accessed on: 12 May 2015.
(95) NCPE. Personal communication. 2015.
(96) HSE National Clinical Programme for Stroke. Warfarin Clinic Survey. Dublin, Ireland: Health Services Executive (HSE); 2012.
(97) PCRS. PCRS Reimbursement Items. 2015, [Online]. Available from: www.sspcrs.ie/druglist/pub. Accessed on: 12 May 2015.
(98) National Centre for Pharmacoeconomics (NCPE). Guidelines for Inclusion of Drug Costs in Pharmacoeconomic Evaluations. 2015, [Online]. Available from:

HTA of a national screening programme for atrial fibrillation in primary care
Health Information and Quality Authority
99
http://www.ncpe.ie/wp-content/uploads/2012/02/Final-Guidelines-for-Inclusion-of-Drug-Costs-in-Pharmacoeconomic-Evaluation-v1.13-180314.pdf. Accessed on: 22 May 2015.
(99) Lip GYH, Laroche C+, Dan GA, Santini M, Kalarus Z, Rasmussen LH, et al. Real-World Antithrombotic Treatment in Atrial Fibrillation: The EORP-AF Pilot Survey. The American Journal of Medicine. 2014; 127(6) pp.519-29.
(100) Yoon SS, Chang H, Kwon YD. Itemized Hospital Charges for Acute Cerebral Infarction Patients Influenced by Severity in an Academic Medical Center in Korea. J Clin Neurol. 2012; 8(1) pp.58-64.
(101) Chang KC, Tseng MC. Costs of Acute Care of First-Ever Ischemic Stroke in Taiwan. Stroke. 2003; 34(11) p.e219-e221.
(102) Central Statistics Office (CSO). Consumer Price Index. 2015, [Online]. Available from: www.cso.ie. Accessed on: 15 May 2015.
(103) Cotte FE, Chaize G, Kachaner I, Gaudin AF, Vainchtock A, Durand-Zaleski I. Incidence and Cost of Stroke and Hemorrhage in Patients Diagnosed with Atrial Fibrillation in France. Journal of Stroke and Cerebrovascular Diseases. 2014; 23(2) p.e73-e83.
(104) National Institute for Health and Clinical Excellence (NICE). TA249: Dabigatran Etexilate for the Prevention of Stroke and Systemic Embolism in Atrial Fibrillation. London, England: National Institute for Health and Care Excellence; 2012.
(105) Zheng Y, Sorensen SV, Gonschior AK, Noack H, Heinrich-Nols J, Sunderland T, et al. Comparison of the Cost-effectiveness of New Oral Anticoagulants for the Prevention of Stroke and Systemic Embolism in Atrial Fibrillation in a UK Setting. Clinical Therapeutics. 2014; 36(12) pp.2015-28.
(106) Health Services Executive (HSE). Nursing Homes Support Scheme, a Fair Deal. 2015, [Online]. Available from: www.hse.ie/nhss/. Accessed on: 18 May 2015.
(107) Health Services Executive (HSE). Annual Report and Financial Statements 2013. Dublin, Ireland: HSE; 2014.
(108) Citizens Information Board. Community care services - Technical Aids. 2015, [Online]. Available from: www.citizensinformation.ie/en/health/care_in_your_community/community_care_services.html. Accessed on: 18 May 2015.
(109) Dewey HM, Thrift AG, Mihalopoulos C, Carter R, Macdonell RA, McNeil JJ, et al. Informal care for stroke survivors: results from the North East Melbourne Stroke Incidence Study (NEMESIS). Stroke. 2002; 33(4) pp.1028-33.

HTA of a national screening programme for atrial fibrillation in primary care
Health Information and Quality Authority
100
(110) Hickenbottom SL, Fendrick AM, Kutcher JS, Kabeto MU, Katz SJ, Langa KM. A national study of the quantity and cost of informal caregiving for the elderly with stroke. Neurology. 2002; 58(12) pp.1754-9.
(111) Patel A, Knapp M, Evans A, Perez I, Kalra L. Training care givers of stroke patients: economic evaluation. BMJ. 2004; 328(7448) p.1102.
(112) van Exel NJ, Brouwer WB, van den BB, Koopmanschap MA, van den Bos GA. What really matters: an inquiry into the relative importance of dimensions of informal caregiver burden. Clin Rehabil. 2004; 18(6) pp.683-93.
(113) Tooth L, McKenna K, Barnett A, Prescott C, Murphy S. Caregiver burden, time spent caring and health status in the first 12 months following stroke. Brain Inj. 2005; 19(12) pp.963-74.
(114) Hervas A, Cabases J, Forcen T. [Cost of informal care for stroke victims in a non-institutionalized general population]. Gac Sanit. 2007; 21(6) pp.444-51.
(115) O'Brien AN, Wolf TJ. Determining work outcomes in mild to moderate stroke survivors. Work. 2010; 36(4) pp.441-7.
(116) Horgan F, Walsh M, Galvin R, Loughnane C. Experiences and long-term needs reported by stroke survivors living in the community in Ireland. Dublin, Ireland: National Disability Authority (NDA); 2014.
(117) Saeki S, Ogata H, Okubo T, Takahashi K, Hoshuyama T. Factors influencing return to work after stroke in Japan. Stroke. 1993; 24(8) pp.1182-5.
(118) Saeki S, Ogata H, Okubo T, Takahashi K, Hoshuyama T. Return to work after stroke. A follow-up study. Stroke. 1995; 26(3) pp.399-401.
(119) Saeki S, Toyonaga T. Determinants of early return to work after first stroke in Japan. J Rehabil Med. 2010; 42(3) pp.254-8.
(120) Tanaka H, Toyonaga T, Hashimoto H. Functional and occupational characteristics predictive of a return to work within 18 months after stroke in Japan: implications for rehabilitation. Int Arch Occup Environ Health. 2014; 87(4) pp.445-53.
(121) Wozniak MA, Kittner SJ. Return to work after ischemic stroke: a methodological review. Neuroepidemiology. 2002; 21(4) pp.159-66.
(122) ILO. International Labour Organisation. 2015, [Online]. Available from: www.ilo.org. Accessed on: 18 May 2015.
(123) CSO. Central Statistics Office (Ireland). 2015, [Online]. Available from: www.cso.ie. Accessed on: 18 May 2015.
HTA of a national screening programme for atrial fibrillation in primary care
Health Information and Quality Authority
101
(124) Jorgensen HS, Nakayama H, Reith J, Raaschou HO, Olsen TS. Acute stroke with atrial fibrillation. The Copenhagen Stroke Study. Stroke. 1996; 27(10) pp.1765-9.
(125) Hannon N, Daly L, Murphy S, Smith S, Hayden D, Ni Chroinin D, et al. Acute Hospital, Community, and Indirect Costs of Stroke Associated With Atrial Fibrillation: Population-Based Study. Stroke. 2014; 45(12) pp.3670-4.
(126) National Institute for Health and Clinical Excellence (NICE). Atrial fibrillation: the management of atrial fibrillation. London, England: NICE; CG180. 2014.
(127) Behan W, Molony D, Beamer C, Cullen W. Are Irish adult general practice consultation rates as low as official records suggest? A cross sectional study at six general practices. Ir Med J. 2013; 106(10) pp.297-9.
(128) Blackrock Clinic. 2015, [Online]. Available from: www.blackrock-clinic.ie/emergency-department/what-does-it-cost/. Accessed on: 24 June 2015.
(129) Vista Primary Care. 2015, [Online]. Available from: www.vistaprimarycare.ie/echocardiogram.html. Accessed on: 24 June 2015.
(130) Clane General Hospital. 2015, [Online]. Available from: www.clanehospital.ie/services/open-access-cardiology.303.html. Accessed on: 24 June 2015.
(131) Rietbrock S, Heeley E, Plumb J, van ST. Chronic atrial fibrillation: Incidence, prevalence, and prediction of stroke using the Congestive heart failure, Hypertension, Age >75, Diabetes mellitus, and prior Stroke or transient ischemic attack (CHADS2) risk stratification scheme. Am Heart J. 2008; 156(1) pp.57-64.
(132) Miyasaka Y, Barnes ME, Gersh BJ, Cha SS, Bailey KR, Abhayaratna WP, et al. Secular trends in incidence of atrial fibrillation in Olmsted County, Minnesota, 1980 to 2000, and implications on the projections for future prevalence. Circulation. 2006; 114(2) pp.119-25.
(133) Sudlow M, Thomson R, Thwaites B, Rodgers H, Kenny RA. Prevalence of atrial fibrillation and eligibility for anticoagulants in the community. Lancet. 1998; 352(9135) pp.1167-71.
(134) National Treatment Purchase Fund (NTPF). National outpatient wait list numbers. 2015, [Online]. Available from: www.ntpf.ie/home/outpatient.htm. Accessed on: 8 June 2015.
(135) Keach JW, Bradley SM, Turakhia MP, Maddox TM. Early detection of occult atrial fibrillation and stroke prevention. Heart. 2015;
(136) Healey J. NCT01938248: Apixaban for the Reduction of Thrombo-Embolism in Patients With Device-Detected Sub-Clinical Atrial Fibrillation (ARTESiA). 2015,

HTA of a national screening programme for atrial fibrillation in primary care
Health Information and Quality Authority
102
[Online]. Available from: https://clinicaltrials.gov/ct2/show/NCT01938248. Accessed on: 29 June 2015.
(137) Quinn FR, Gladstone D. Screening for undiagnosed atrial fibrillation in the community. Curr Opin Cardiol. 2014; 29(1) pp.28-35.
(138) Friberg L, Engdahl J, Frykman V, Svennberg E, Levin LA, Rosenqvist M. Population screening of 75- and 76-year-old men and women for silent atrial fibrillation (STROKESTOP). Europace. 2013;
(139) National Institute for Health Research (NIHR). HTA - 14/141/01: Screening Strategies for Atrial Fibrillation: A Systematic Review and Cost-Effectiveness Analysis. 2015, [Online]. Available from: http://www.nets.nihr.ac.uk/projects/hta/1414101. Accessed on: 8 June 2015.

HTA of a national screening programme for atrial fibrillation in primary care
Health Information and Quality Authority
103
Published by the Health Information and Quality Authority. For further information please contact: Health Information and Quality Authority Dublin Regional Office George’s Court George’s Lane Smithfield Dublin 7 Phone: +353 (0) 1 814 7400 URL: www.hiqa.ie © Health Information and Quality Authority 2015