health workforce remuneration -...
TRANSCRIPT
AIASAmsterdam Institute for
Advanced labour Studies
University of AmsterdamAIAS
Health workforce remuneration Comparing wage levels, ranking and dispersion
of 16 occupational groups in 20 countries
Kea Tijdens and Daniel H. de Vries
Working Paper 11-111August 2011
Acknowledgement
This paper builds on research work done using the WageIndicator web-survey on work
and wages (www.wageindicator.org). A previous analysis has been presented at the In-
ternational Conference on Research in Human Resources for Health, Rio de Janeiro,
June 09- 11 2010 and at the 2ndILO conference on Regulating Decent Work, Geneva,
July 6-8 2011.
August 2011
© Kea G. Tijdens and Daniel H. de Vries, Amsterdam
Bibliographic InformationTijdens, K.G., Vries, D.H. de (2011). Health workforce remuneration: Comparing wage levels, rank-ing and dispersion of 16 occupational groups in 20 countries. Amsterdam, University of Amster-dam, AIAS Working Paper 11-111
Contact information:Kea Tijdens, [email protected] de Vries, [email protected]
Information may be quoted provided the source is stated accurately and clearly. Reproduction for own/internal use is permitted.
This paper can be downloaded from our website www.uva-aias.net under the section: Publications/Working papers.
Health workforce remuneration
Comparing wage levels, ranking and
dispersion of 16 occupational groups
in 20 countries
WP 11-111
Kea Tijdens
Amsterdam Institute for Advanced Labor Studies (AIAS)
University of Amsterdam
Daniel H. de Vries
Ph.D.
Department of Sociology & Anthropology
Center for Global Health and Inequality
University of Amsterdam

Page ● 4
Kea Tijdens and Daniel de Vries
Page ● 5
Health workforce remuneration
Table of contents
ABSTRACT .....................................................................................................................................7
1. BACKGROUND .........................................................................................................................9
2. METHODS.............................................................................................................................11
2.1. Data ................................................................................................................................................................11
2.2. Defi ning health sector occupations ............................................................................................................12
2.3. Selecting the countries ..................................................................................................................................13
2.4. Defi ning wages ...............................................................................................................................................14
3. RESULTS ...............................................................................................................................17
3.1. Wage rankings of occupations across countries .......................................................................................17
3.2. Wage dispersion within countries ................................................................................................................19
3.3. Wage levels across countries ........................................................................................................................20
4. DISCUSSION ..........................................................................................................................23
5. CONCLUSIONS .......................................................................................................................25
ABBREVIATIONS ............................................................................................................................27
REFERENCES .................................................................................................................................29
APPENDIX ...................................................................................................................................31
AIAS WORKING PAPERS ..............................................................................................................................................39
INFORMATION ABOUT AIAS ...........................................................................................................47

Page ● 6
Kea Tijdens and Daniel de Vries
Page ● 7
Health workforce remuneration
Abstract
This article focuses on remuneration in the Human Resources for Health (HRH), comparing wage
levels, ranking and dispersion of 16 HRH occupations in 20 countries (Argentina, Belarus, Belgium, Brazil,
Chile, Colombia, Czech Republic, Finland, Germany, India, Mexico, Netherlands, Poland, Russian Federa-
tion, South-Africa, Spain, Sweden, Ukraine, United Kingdom, United States). Research questions asked are
to what extent are the wage rankings, wage dispersion, and standardized wage levels are similar between
the 16 occupational groups in the HRH workforce across countries. The pooled data from the continu-
ous, worldwide, multilingual WageIndicator web-survey between 2008 and 2011Q1 have been analysed (N=
38,799). Hourly wages expressed in standardized USD, all controlled for PPP and then indexed to 2011
levels. The fi ndings show that the Medical Doctors have overall the highest median wages and they have
so in 11 of 20 countries, while the Personal Care Workers have overall lowest wages and they have so in 9
of 20 countries. Health Care Managers lower earnings than Medical Doctors, but in 5 of 20 countries they
have higher earnings (BLR, CZE, POL, RUS, UKR). The wage levels of Nursing & Midwifery Professionals
vary largely across countries. The correlation of the overall ranking to the national ranking is more than .7
in 7 of 20 countries. The wage dispersion is defi ned as the ratio of the highest to the lowest median earn-
ings in an occupation in a country. It is highest in Brazil (7.0), and lowest in Sweden, Germany, Poland, and
Argentina. When comparing wage levels in occupations across countries, the largest wage differences for the
Medical Doctors: the Ukraine doctor earns 19 times less compared to the US doctor. A correlation between
country-level earnings and wage differentials across countries reveals that the higher the median wages in
an occupation, the higher the wage difference across countries (r=.9). In conclusion, this article breaks new
ground by investigating for the fi rst time the wage levels, ranking and dispersion of occupational groups in
the HRH workforce across countries. Findings illustrate that the assumption of similarity in cross-country
wage ranking, wage dispersion, and purchasing power adjusted wage levels does not hold. These fi ndings
help to explain the complexity of migratory paths seen.
Keywords: health workforce composition; remuneration; wages; survey data; occupational groups;
ranking; dispersion

Page ● 8
Kea Tijdens and Daniel de Vries
Page ● 9
Health workforce remuneration
1. Background
Wages are commonly perceived as a key factor affecting job satisfaction, retention, and attrition or mi-
gration of health care professionals within and across countries (Ferrinho et al, 1998; Dovlo, 2002; Smigel-
skas and Padaiga, 2007; Nguyen et al, 2008). A major problem preventing progress on insight into the rela-
tive importance of wage information in health workforce strengthening is the lack of detailed information
about the wide range of health workers’ occupations (De Vries and Tijdens, 2010). Typically, international
databases employ high levels of occupational aggregation and are insuffi ciently standardized in their clas-
sifi cations to allow for cross-country comparability (Dräger et al, 2006). For example, while the October
Inquiry and the Occupational Wages (OWW) database of the International Labour Organisation (ILO) is
an important resource, for the health sector only seven occupations are included: general physician, dentist,
professional nurse, auxiliary nurse, physiotherapist, medical x-ray technician and ambulance driver. Another
major source, the Luxembourg Income and Employment Study, has surveyed 30 countries over the past
decades, yet lacks suffi cient specifi city as most labour force surveys do not provide further detail than a
2-digit coding of ILO’s International Standard Classifi cation of Occupations (ISCO). An investigation for a
number of European countries concludes that no cross-country comparable data is available for the occu-
pational groups in the HRH workforce, and that one has to rely on a few national studies with incomparable
wage data and incomparable occupational groups (Pillinger, 2010). At the country level, a small diversity of
HRH sources is available and includes population censuses and surveys, facility assessments, and routine
administrative records. However, most available data sources have shortcomings (Dal Poz et al, 2009; Mc-
Quide et al, 2009).
As a result of this absence of comparable wage data, few studies have investigated wage levels and wage
distribution across countries (Dräger et al, 2006; Vujicic, 2004). Preliminary analysis has suggested that sal-
ary differentials between source and destination countries are too high to curb migration (Vujicic, 2004). Us-
ing data on 42 countries from both the OECD Health Data 2005 and OWW database for a comparison of
wages of general physicians and professional nurses only, Dräger et al. found that there is an enormous gap
in wages for health workers between rich and poor countries (Dräger et al, 2006). Moreover, health work-
ers tend to be paid less than equivalent professionals – or at least teachers and engineers – in low-income
countries. Wages, they suggest, are great incentives for health workers to migrate, posing challenges for
the development of strategies to retain them in poor countries. At the same time, an increasingly complex
Page ● 10
Kea Tijdens and Daniel de Vries
remuneration landscape in destination countries is showing the development of different task profi les and
related certifi cations requirements—a proxy for relative wage ranking for distinct occupations across coun-
tries—across counties (Grimshaw and Carroll, 2008; Jaehrling, 2008)
This article introduces a non-probability dataset that can be used for comparing wage information
across countries —the WageIndicator web-survey— with the aim of contributing to an improved under-
standing of global wage differentials, thereby illustrating the usefulness of online data collection for cross-
country comparative research. The paper focuses on the validity of three wage cross-country wage as-
sumptions: the similarity of ranking of wage levels, the similarity of wage dispersion and the comparability
of cost-of-living adjusted (PPP) wage levels across 20 countries in 16 occupational groups in the Human
Resources for Health (HRH) workforce. Using detailed occupational wage information available from the
international, multilingual WageIndicator web-survey in these countries, the following three research questions
will be answered:
1) To what extent are the rankings between the 16 occupational groups in the HRH workforce similar
across countries, based on their median wage levels?
2) To what extent are countries similar with respect to the wage dispersion across the national HRH
occupations?
3) To what extent are the standardized wage levels within the same HRH occupations comparable
across countries?
Answers to these questions are important. Differences between the complexity of wage structures
between various countries are of potential key infl uence to workforce migratory patterns, while allowing
insight in possible strategies to increase country level job satisfaction and retention, and national settings of
health care provision, wage setting processes, and credentialism.
Page ● 11
Health workforce remuneration
2. Methods
2.1. Data
The data used in this paper stem from the WageIndicator web-survey (www.wageindicator.org). This is a
multi-country, continuous surveys, posted at the WageIndicator websites in an increasing number of countries.
In 2000, the WageIndicator project started as a paper-and pencil survey for establishing a website with salary
information for women’s occupations in the Netherlands, but quickly developed into an online, multilingual
data collection tool which on an ongoing basis pulls occupational information for hundreds of occupa-
tions through more than 60 national websites as of early 2011. A national website hosting the survey tool
consists of job related content, labour law and minimum wage information, an anonymous questionnaire
with a prize incentive, and a free and crowd-pulling Salary Check presenting average wages for occupations
based on data from the questionnaire. Additionally, the project includes search engine optimization, web-
marketing, publicity, and answering visitors’ email. Most countries have their own web-manager. Coalitions
with media groups and publishing houses with a strong Internet presence contribute to the large numbers
of visitors to the websites. The websites are consulted by employees, students, job seekers, individuals with
a job on the side, and alike for their job mobility decisions, annual performance talks, occupational choice
or other reasons. All web-visitors are asked to complete voluntarily the web-survey, in return to the free
information provided. Importantly, approximately 1.5% of the visitors start completing the questionnaire.
The web-survey is comparable across countries, it is in the national language(s) and it has questions about
wages, education, occupation, industry, socio-demographics, and alike (Tijdens et al, 2010). The survey has
a prize incentive and it takes approximately 10 minutes to complete part 1 and 10 minutes for part 2.
From a scientifi c perspective, concerns have been raised in relation to the quality and reliability of
web-survey data (Couper, 2000). The problem of sample bias arises when those not covered, not recruited,
and/or not surveyed are different from those who are covered, are recruited and have responded (Groves,
2004). To minimize such bias, researchers have traditionally attempted to create samples that provide a
reliable cross-section of a given population allowing the drawing of probability-based samples which pro-
duce representative results for the entire population. In the case of the WageIndicator web-survey, which is
a non-probability or volunteer survey, the most serious problem is related to the self-selection recruitment
method of respondents, and the related question of to what extent the results are representative for the
Page ● 12
Kea Tijdens and Daniel de Vries
general population. To deal with this problem, different weighting techniques have been proposed to adjust
a “biased” web sample to the population under consideration (Lee and Vaillant, 2009; Schonlau et al, 2009).
The effi ciency of different weights in adjusting biases has also been considered in the case of the WageIndi-
cator data (Steinmetz and Tijdens, 2009). Specifi cally, un-weighted and weighted results of these data from
the year 2006 for selected countries (Germany, the Netherlands, Spain, the US, Argentina and Brazil) have
been compared using representative reference surveys for the same year. Similar to fi ndings from previous
studies (Lee, 2006; Loosveldt and Sonck, 2006), the results showed that all web samples deviated from the
reference samples with regard to the common variables age, gender and education. However, the impact of
the applied weights seems to be very limited and does not make web-survey data more comparable to the
general population. This argument can also be supported by a detailed comparison of the WageIndicator data
to other so-called representative surveys (such as the Labor Force Survey or the World Values Survey) using
the distributions over 36 categories (2genders*2workinghours*3agegroups*3educationgroups). As shown in
their analysis (Steinmetz and Tijdens, 2009), for most of these categories it would be exaggerated to speak
of a fundamental selection bias in the case of the volunteer data set. It seems worthwhile to emphasize the
argument made by Couper and Miller (2008) that it is better not to treat survey quality as an absolute, but to
evaluate quality relative to other features of the research design and the stated goals of the survey.
2.2. Defi ning health sector occupations
The WageIndicatorweb-survey asks in detail about the occupation of the respondent, offering a search
tree with some 1,700 occupations, coded according to ILO’s recently updated occupational classifi cation
ISCO-08, adding further digits to its 433 four-digit occupational units (Tijdens, 2010). These 1,700 oc-
cupational titles have been translated into all languages of the web-survey. Based on this list, health sector
occupations were selected and subsequently clustered following the occupational classifi cations in the Com-
municable Disease Global Atlas for Human Resources for Health of the World Health Organisation (2009)
and ILO’s defi nition of health sector occupational units (International Labour Organisation, 2009), but
keeping a number of more detailed occupational categories to allow for additional insight in the usage of
the WageIndicator dataset.The initial list of occupations allows for a selection of 20 health sector occupational
groups. In this article we will refer to these occupations as the Human Resources for Health occupations,
abbreviated as HRH occupations. Excluded are occupations related to pharmaceutical production and job-
holders in sectors Health Care Administration & Operations occupations not working in the human health
Page ● 13
Health workforce remuneration
activities, residential care activities, and social work activities without accommodation (NACE2.0 codes
86, 87, and 88).The mapping of the selected occupations into the HRH occupations, including the related
ISCO-08 codes, can be found in Appendix 1.
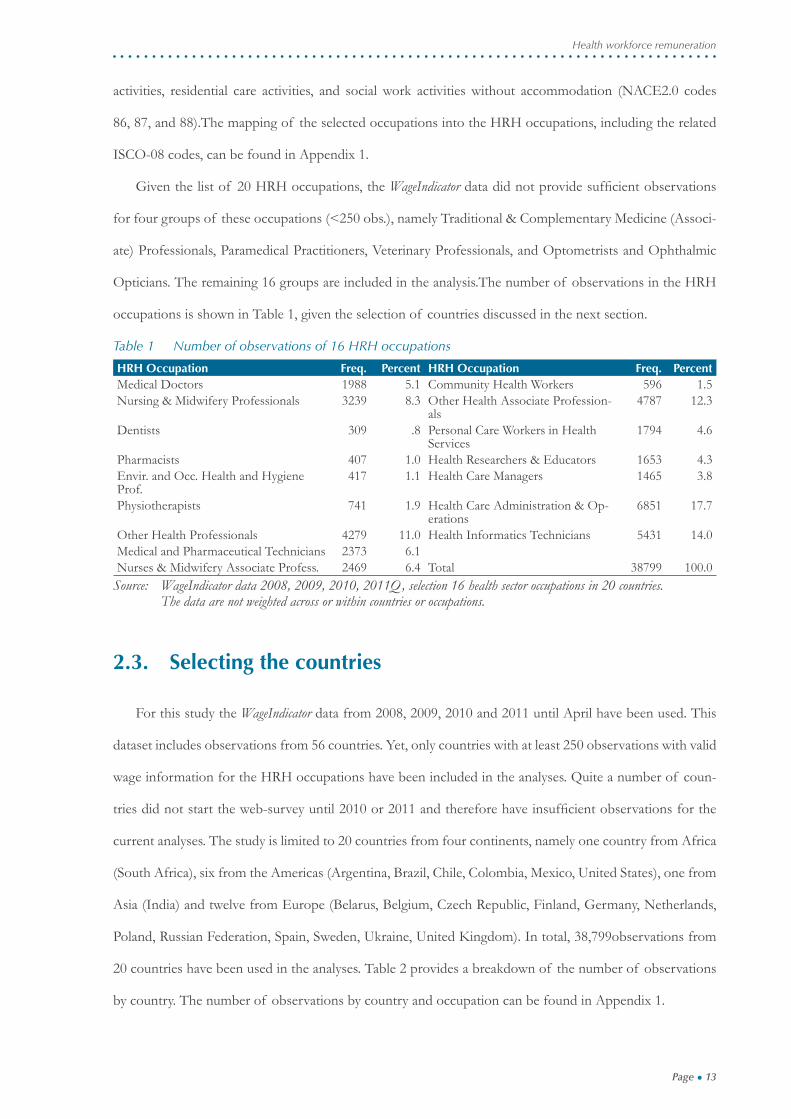
Given the list of 20 HRH occupations, the WageIndicator data did not provide suffi cient observations
for four groups of these occupations (<250 obs.), namely Traditional & Complementary Medicine (Associ-
ate) Professionals, Paramedical Practitioners, Veterinary Professionals, and Optometrists and Ophthalmic
Opticians. The remaining 16 groups are included in the analysis.The number of observations in the HRH
occupations is shown in Table 1, given the selection of countries discussed in the next section.
Table 1 Number of observations of 16 HRH occupations
HRH Occupation Freq. Percent HRH Occupation Freq. PercentMedical Doctors 1988 5.1 Community Health Workers 596 1.5Nursing & Midwifery Professionals 3239 8.3 Other Health Associate Profession-
als4787 12.3
Dentists 309 .8 Personal Care Workers in Health Services
1794 4.6
Pharmacists 407 1.0 Health Researchers & Educators 1653 4.3Envir. and Occ. Health and Hygiene Prof.
417 1.1 Health Care Managers 1465 3.8
Physiotherapists 741 1.9 Health Care Administration & Op-erations
6851 17.7
Other Health Professionals 4279 11.0 Health Informatics Technicians 5431 14.0Medical and Pharmaceutical Technicians 2373 6.1Nurses & Midwifery Associate Profess. 2469 6.4 Total 38799 100.0
Source: WageIndicator data 2008, 2009, 2010, 2011Q, selection 16 health sector occupations in 20 countries. The data are not weighted across or within countries or occupations.
2.3. Selecting the countries
For this study the WageIndicator data from 2008, 2009, 2010 and 2011 until April have been used. This
dataset includes observations from 56 countries. Yet, only countries with at least 250 observations with valid
wage information for the HRH occupations have been included in the analyses. Quite a number of coun-
tries did not start the web-survey until 2010 or 2011 and therefore have insuffi cient observations for the
current analyses. The study is limited to 20 countries from four continents, namely one country from Africa
(South Africa), six from the Americas (Argentina, Brazil, Chile, Colombia, Mexico, United States), one from
Asia (India) and twelve from Europe (Belarus, Belgium, Czech Republic, Finland, Germany, Netherlands,
Poland, Russian Federation, Spain, Sweden, Ukraine, United Kingdom). In total, 38,799observations from
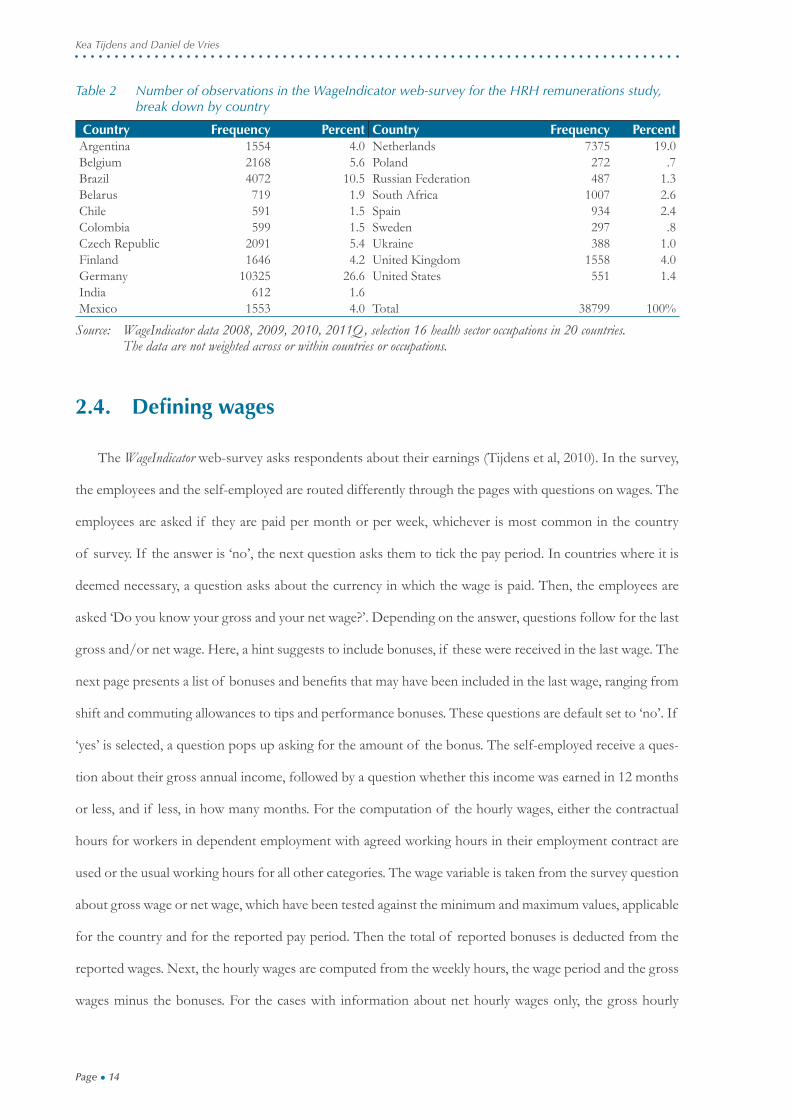
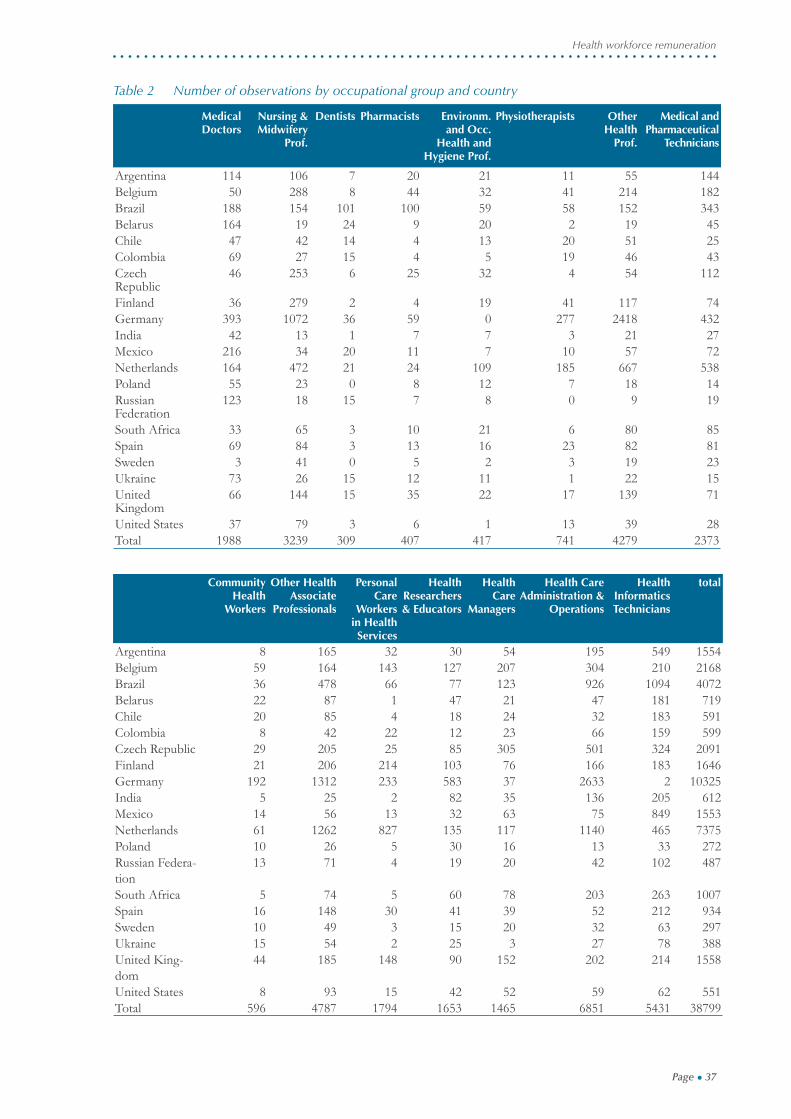
20 countries have been used in the analyses. Table 2 provides a breakdown of the number of observations
by country. The number of observations by country and occupation can be found in Appendix 1.
Page ● 14
Kea Tijdens and Daniel de Vries
Table 2 Number of observations in the WageIndicator web-survey for the HRH remunerations study, break down by country
Country Frequency Percent Country Frequency PercentArgentina 1554 4.0 Netherlands 7375 19.0Belgium 2168 5.6 Poland 272 .7Brazil 4072 10.5 Russian Federation 487 1.3Belarus 719 1.9 South Africa 1007 2.6Chile 591 1.5 Spain 934 2.4Colombia 599 1.5 Sweden 297 .8Czech Republic 2091 5.4 Ukraine 388 1.0Finland 1646 4.2 United Kingdom 1558 4.0Germany 10325 26.6 United States 551 1.4India 612 1.6Mexico 1553 4.0 Total 38799 100%
Source: WageIndicator data 2008, 2009, 2010, 2011Q, selection 16 health sector occupations in 20 countries. The data are not weighted across or within countries or occupations.
2.4. Defi ning wages
The WageIndicator web-survey asks respondents about their earnings (Tijdens et al, 2010). In the survey,
the employees and the self-employed are routed differently through the pages with questions on wages. The
employees are asked if they are paid per month or per week, whichever is most common in the country
of survey. If the answer is ‘no’, the next question asks them to tick the pay period. In countries where it is
deemed necessary, a question asks about the currency in which the wage is paid. Then, the employees are
asked ‘Do you know your gross and your net wage?’. Depending on the answer, questions follow for the last
gross and/or net wage. Here, a hint suggests to include bonuses, if these were received in the last wage. The
next page presents a list of bonuses and benefi ts that may have been included in the last wage, ranging from
shift and commuting allowances to tips and performance bonuses. These questions are default set to ‘no’. If
‘yes’ is selected, a question pops up asking for the amount of the bonus. The self-employed receive a ques-
tion about their gross annual income, followed by a question whether this income was earned in 12 months
or less, and if less, in how many months. For the computation of the hourly wages, either the contractual
hours for workers in dependent employment with agreed working hours in their employment contract are
used or the usual working hours for all other categories. The wage variable is taken from the survey question
about gross wage or net wage, which have been tested against the minimum and maximum values, applicable
for the country and for the reported pay period. Then the total of reported bonuses is deducted from the
reported wages. Next, the hourly wages are computed from the weekly hours, the wage period and the gross
wages minus the bonuses. For the cases with information about net hourly wages only, the gross hourly
Page ● 15
Health workforce remuneration
wages are computed based on the annual country average between gross and net wages.
We then converted the hourly wages into a standardized hourly wage in US dollars, using purchasing
power parities (PPP) from the World Bank Database with their projections for the years up to 2011. The
purchasing power parity theory uses the long-term equilibrium exchange rate of two currencies to equal-
ize their purchasing power for a given basket of goods. Using a PPP basis is arguably more useful when
comparing differences in living standards on the whole between nations because PPP takes into account the
relative cost of living and the infl ation rates of different countries, rather than just a nominal Gross Do-
mestic Product (GDP) comparison. In the data cleaning, the standardized hourly wages are tested for their
reliability. Indexed hourly wages lower than 1 standardized PPP US dollar or over 400 standardized PPP
US dollars are considered outliers. Odd values in the reported gross and/or net wages are set to missing.
Similarly, this is done if the sum of bonuses is larger than 2/3 of the reported gross wage, or if the reported
gross wages are larger than 100 times the reported net wage.
For this study, to compare the hourly wages over the survey years, the 2008 wages have been augmented
with the ratio of the national PPP-2011/PPP-2008, and similarly for 2009 and 2010. Thus all wages have
been indexed to the 2011 level. In case an HRH occupation in a country had less than 5 observations over
these years, the wages in this occupation were set to missing. In the remaining, the words standardized USD
wages will be used to refer to the PPP standardized wages in US dollars, indexed to the 2011 level.

Page ● 16
Kea Tijdens and Daniel de Vries
Page ● 17
Health workforce remuneration
3. Results
3.1. Wage rankings of occupations across countries
The fi rst research objective addressed to what extent the wage rankings for the 16 occupational groups
in the HRH workforce are similar across countries. For this purpose, the median wages of the 16 occupa-
tions in each of the 20 countries have been computed and ranked. Ranking runs from 1, indicating the
occupation with the lowest median wage in the country, to 16, indicating the occupation with the highest
median wage in the country. In a few countries, wage information for some occupations had insuffi cient
observations (<5), for example for the Dentists (insuffi cient in 7 countries), the Physiotherapists (in 6 coun-
tries), and the Personal Care Workers in Health Services (in 6 countries). In these countries, the ranking
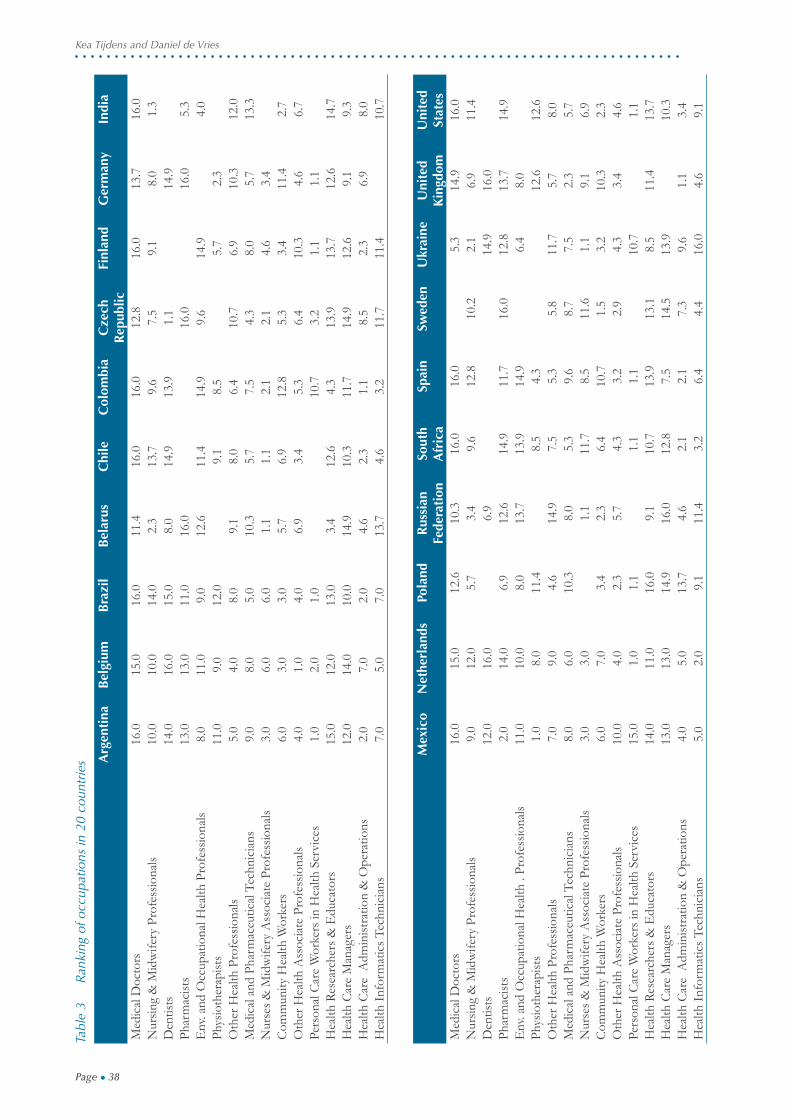
of these less than 16 occupations was scaled between 1 and 16. The ranking of 16 occupations in each of
the 20 countries can be found in Appendix 1. Based on the median standardized wages of each occupation
in each country, the 20-country mean standardized wages were calculated and subsequently ranked (Table
3, column 2 and 3). Note that this ranking does neither control for the relative sizes of the national HRH
workforces nor for the relative sizes of the HRH occupations within the country. Thus, the ranking is based
on occupations, not on jobholders in occupations. The results are shown in Table 3.
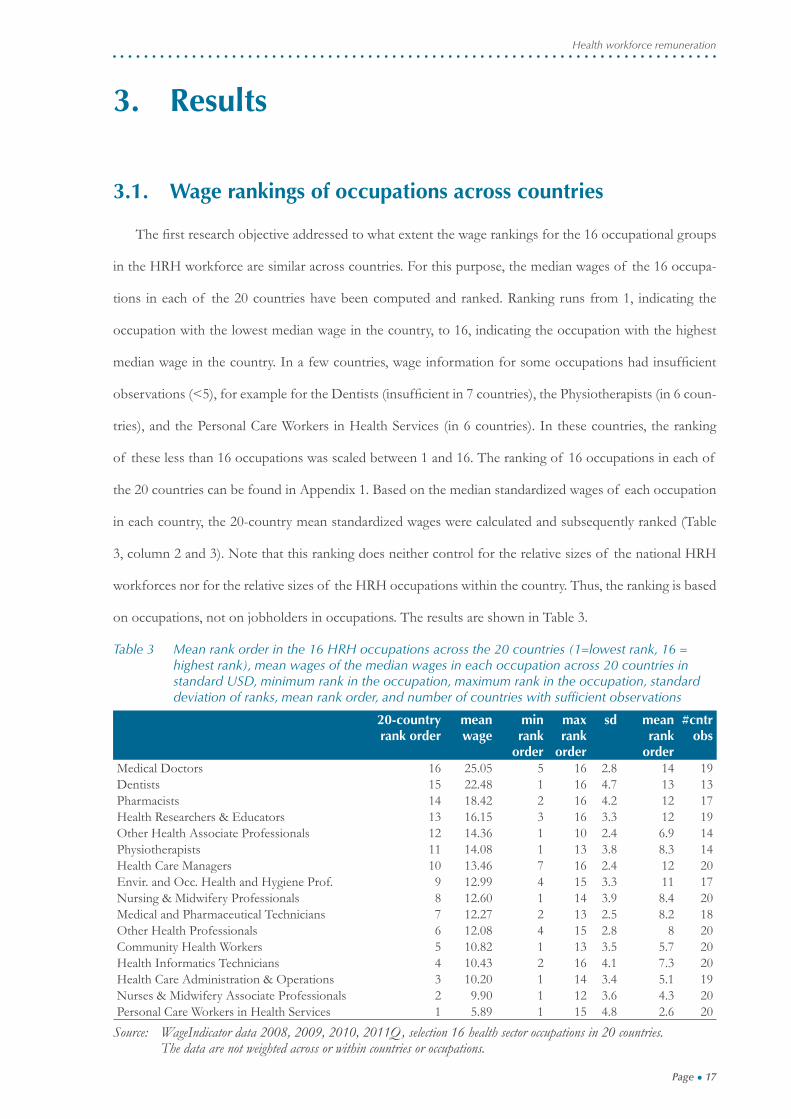
Table 3 Mean rank order in the 16 HRH occupations across the 20 countries (1=lowest rank, 16 = highest rank), mean wages of the median wages in each occupation across 20 countries in standard USD, minimum rank in the occupation, maximum rank in the occupation, standard deviation of ranks, mean rank order, and number of countries with suffi cient observations
20-country rank order
mean wage
min rank
order
max rank
order
sd mean rank
order
#cntr obs
Medical Doctors 16 25.05 5 16 2.8 14 19Dentists 15 22.48 1 16 4.7 13 13Pharmacists 14 18.42 2 16 4.2 12 17Health Researchers & Educators 13 16.15 3 16 3.3 12 19Other Health Associate Professionals 12 14.36 1 10 2.4 6.9 14Physiotherapists 11 14.08 1 13 3.8 8.3 14Health Care Managers 10 13.46 7 16 2.4 12 20Envir. and Occ. Health and Hygiene Prof. 9 12.99 4 15 3.3 11 17Nursing & Midwifery Professionals 8 12.60 1 14 3.9 8.4 20Medical and Pharmaceutical Technicians 7 12.27 2 13 2.5 8.2 18Other Health Professionals 6 12.08 4 15 2.8 8 20Community Health Workers 5 10.82 1 13 3.5 5.7 20Health Informatics Technicians 4 10.43 2 16 4.1 7.3 20Health Care Administration & Operations 3 10.20 1 14 3.4 5.1 19Nurses & Midwifery Associate Professionals 2 9.90 1 12 3.6 4.3 20Personal Care Workers in Health Services 1 5.89 1 15 4.8 2.6 20
Source: WageIndicator data 2008, 2009, 2010, 2011Q, selection 16 health sector occupations in 20 countries. The data are not weighted across or within countries or occupations.
Page ● 18
Kea Tijdens and Daniel de Vries
Table 3 shows, not surprisingly, that the occupational group Medical Doctors rank the highest number
16, indicating that this occupational group has the highest mean across the 20 countries of the country-
specifi c median standardized USD wages. It has the highest median wage in 11 of the 20 countries and the
one-highest in another three countries (see Appendix 1). The Medical Doctors group ranks relatively low in
the Ukraine. The Dentists group is ranked 15 across the 20 countries, but this occupation has the highest
median wage in three countries (Belgium, Netherlands, United Kingdom).
In contrast to the Medical Doctors group, the Personal Care Workers group is ranked 1, indicating that
in the 20 countries this group has the lowest wage ranking, when averaging the median wages in this oc-
cupation across the 20 countries. In 9 of the 20 countries this occupation indeed ranks lowest, and in the
other countries it is ranked among the lowest earning occupations, apart from the Czech Republic (rank 15),
Colombia and Ukraine (both rank 10).
In most countries, the Health Care Managers group has a relative high ranking, though in three countries
this occupation ranks in the middle, namely in Spain, Germany, and India. In almost all countries, the Health
Care Managers group has lower median earnings than the Medical Doctors group. In fi ve countries, they
have however higher earnings, namely in Belarus, Czech Republic, Poland, Russian Federation and Ukraine.
The Nursing & Midwifery Professionals group is ranked 9 out of 16, thus its ranking is in the higher
half of the earnings distribution. In four countries, this occupation is ranked at the bottom, namely in
Belarus, India, Russian Federation, and Ukraine. In contrast, this occupational group has relatively higher
rankings in Brazil, Chile, Netherlands, Spain, and United States. According to the ISCO occupational clas-
sifi cation, the Nurses & Midwifery Associate Professionals have a job-level below that of the Nursing &
Midwifery Professionals. Yet, in two countries the latter occupation has higher median earnings than the
former, namely in South Africa and United Kingdom. The distinction between the two occupational groups
is probably not understood the same way in these countries. This certainly calls for further investigations of
the work activities associated with these occupational groups.
Research objective 1 aimed to investigate to what extent the rankings of the median wage levels of the
16 occupational groups in the HRH workforce are similar across countries. For this purpose, the ranking in
each country has been correlated to the overall 20-country ranking, thereby indicating how much the coun-
try’s ranking fi ts into the overall ranking. The one-last column in Table 4 shows the results. It depicts that
the correlations are pretty high for most countries. In seven countries (Argentina, Belgium, Brazil, Chile,
Finland, Netherlands, United States) the correlation is more than .7. In another four countries it is between
Page ● 19
Health workforce remuneration
.5 and .7 (Germany, Spain, South Africa, United Kingdom). In seven countries it is between .3 and .5 (Be-
larus, Colombia, Czech Republic, Mexico, Poland, Russian Federation, and Sweden). Finally, two countries
exhibit a ranking that is extremely different from the overall 20-countryranking, namely India, and Ukraine.
In conclusion, for the majority of countries in this study, the ranking is pretty similar. These countries
are seemingly a group of higher income countries, somewhat contrasting with the medium or lower level
income countries showing a lower ranking of median wage level. Considering health workforce migratory
patterns from low to higher level countries, this is difference may be of further interest.
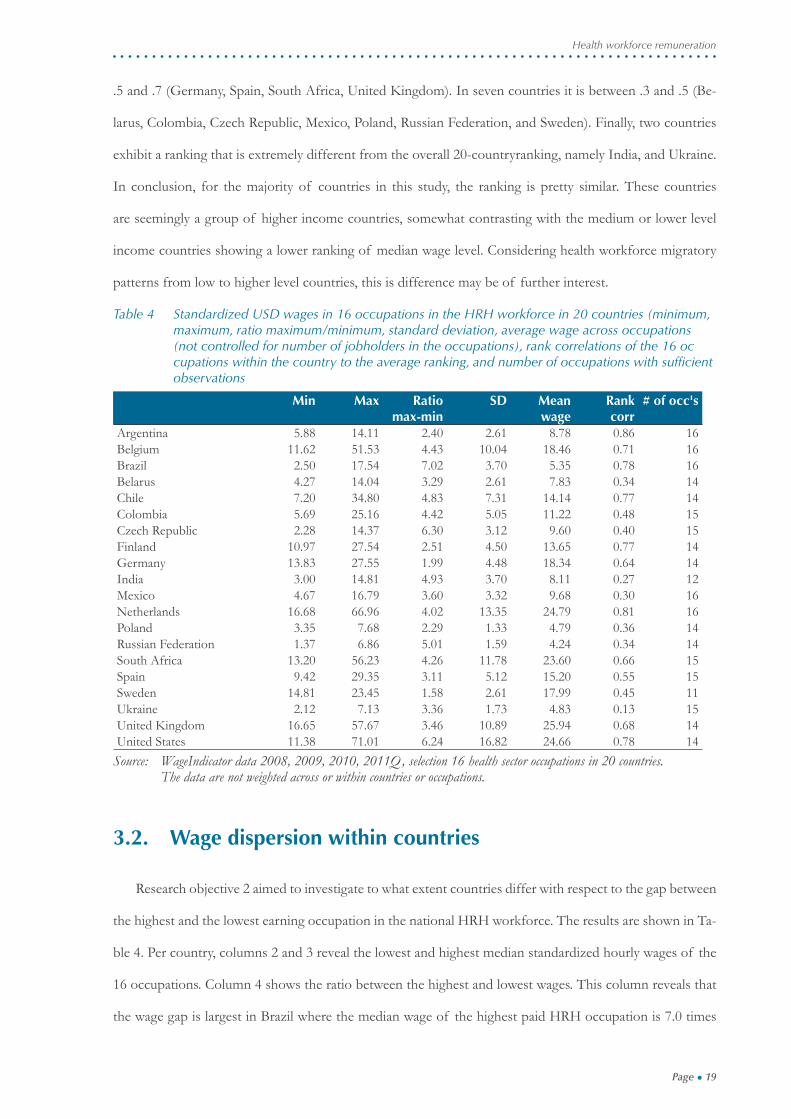
Table 4 Standardized USD wages in 16 occupations in the HRH workforce in 20 countries (minimum, maximum, ratio maximum/minimum, standard deviation, average wage across occupations (not controlled for number of jobholders in the occupations), rank correlations of the 16 oc cupations within the country to the average ranking, and number of occupations with suffi cient observations
Min Max Ratio max-min
SD Mean wage
Rank corr
# of occ's
Argentina 5.88 14.11 2.40 2.61 8.78 0.86 16Belgium 11.62 51.53 4.43 10.04 18.46 0.71 16Brazil 2.50 17.54 7.02 3.70 5.35 0.78 16Belarus 4.27 14.04 3.29 2.61 7.83 0.34 14Chile 7.20 34.80 4.83 7.31 14.14 0.77 14Colombia 5.69 25.16 4.42 5.05 11.22 0.48 15Czech Republic 2.28 14.37 6.30 3.12 9.60 0.40 15Finland 10.97 27.54 2.51 4.50 13.65 0.77 14Germany 13.83 27.55 1.99 4.48 18.34 0.64 14India 3.00 14.81 4.93 3.70 8.11 0.27 12Mexico 4.67 16.79 3.60 3.32 9.68 0.30 16Netherlands 16.68 66.96 4.02 13.35 24.79 0.81 16Poland 3.35 7.68 2.29 1.33 4.79 0.36 14Russian Federation 1.37 6.86 5.01 1.59 4.24 0.34 14South Africa 13.20 56.23 4.26 11.78 23.60 0.66 15Spain 9.42 29.35 3.11 5.12 15.20 0.55 15Sweden 14.81 23.45 1.58 2.61 17.99 0.45 11Ukraine 2.12 7.13 3.36 1.73 4.83 0.13 15United Kingdom 16.65 57.67 3.46 10.89 25.94 0.68 14United States 11.38 71.01 6.24 16.82 24.66 0.78 14
Source: WageIndicator data 2008, 2009, 2010, 2011Q, selection 16 health sector occupations in 20 countries. The data are not weighted across or within countries or occupations.
3.2. Wage dispersion within countries
Research objective 2 aimed to investigate to what extent countries differ with respect to the gap between
the highest and the lowest earning occupation in the national HRH workforce. The results are shown in Ta-
ble 4. Per country, columns 2 and 3 reveal the lowest and highest median standardized hourly wages of the
16 occupations. Column 4 shows the ratio between the highest and lowest wages. This column reveals that
the wage gap is largest in Brazil where the median wage of the highest paid HRH occupation is 7.0 times
Page ● 20
Kea Tijdens and Daniel de Vries
the median of the lowest paid HRH occupation, followed by Czech Republic, United States and Russian
Federation (ratios between 5.0 and 6.3). In contrast, Sweden, Germany, Poland, and Argentina are egalitar-
ian countries as far as the median wages in the HRH workforce is concerned (ratios between 1.6 and 2.5).
In another fi ve countries, the ratios are between 3.0 and 3.5 (Spain, Belarus, Ukraine, United Kingdom, and
Mexico). In the remaining six countries, the wage differentials are between 4.0 and 4.9 (Netherlands, South
Africa, Colombia, Belgium, Chile, and India). One can conclude tentatively that wage dispersion is higher
in the larger economies, such as Brazil, United States and Russia, compared to smaller economies, but that
in general a diverse pattern is seen.
3.3. Wage levels across countries
Research objective 3 aimed to investigate to what extent the PPP standardized wages within the same
HRH occupational groups are comparable across countries. Thus, within an occupational group, how do the
wage levels compare international?
Before turning to the overall picture, the median standardized wages for three occupations are shown,
namely for the groups of Medical Doctors, the Nursing & Midwifery Professionals and the Personal Care
Workers in Health Services (Graph 1). The largest wage differences for the group of Medical Doctors are
between the Ukraine on the one hand and the United States on the other hand. The Ukraine doctor earns 19
times less compared to the US doctor, using PPP standardized wages. The Nursing & Midwifery Profession-
als occupational group exhibits the same pattern, though the differences are smaller. The Ukraine nurses
and midwifes earn 9 times less compared to the US nurse, using PPP standardized wages. When it comes
to the care worker, the pattern is different. Here, the care worker in Brazil has the lowest earnings and they
earn 6 time less compared to the care worker in Mexico, having the highest earnings.
Page ● 21
Health workforce remuneration
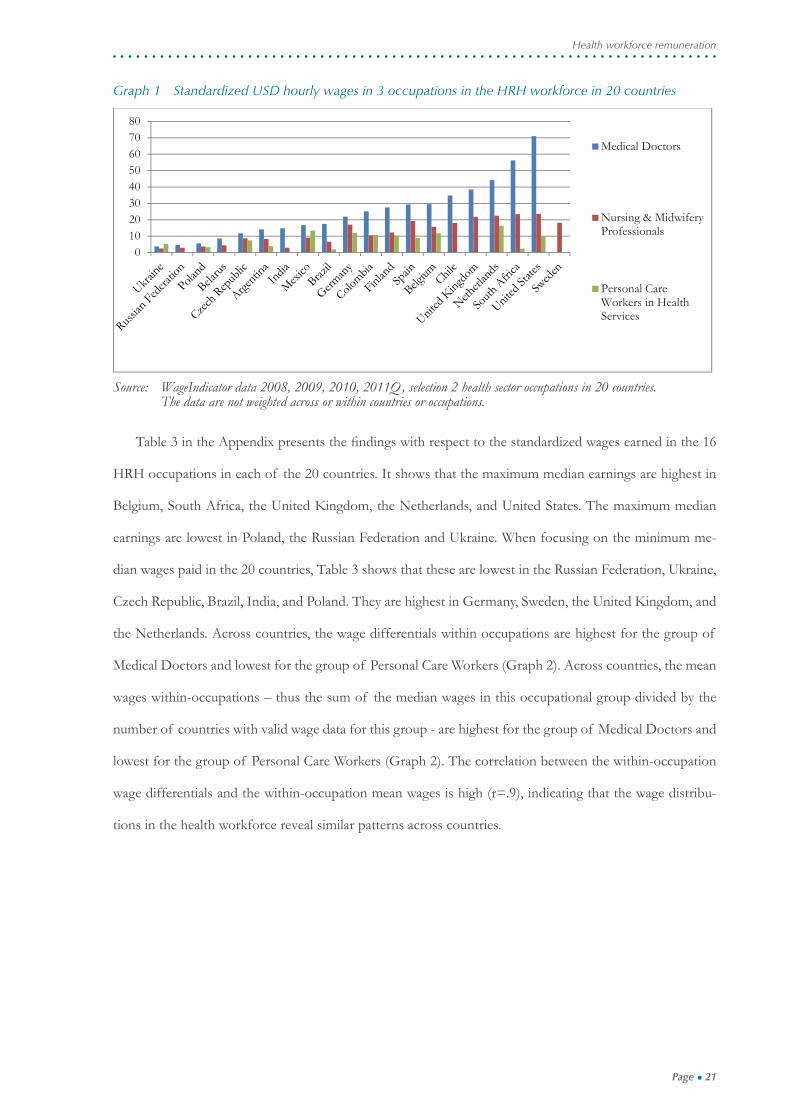
Graph 1 Standardized USD hourly wages in 3 occupations in the HRH workforce in 20 countries
01020304050607080
Medical Doctors
Nursing & MidwiferyProfessionals
Personal CareWorkers in HealthServices
Source: WageIndicator data 2008, 2009, 2010, 2011Q, selection 2 health sector occupations in 20 countries. The data are not weighted across or within countries or occupations.
Table 3 in the Appendix presents the fi ndings with respect to the standardized wages earned in the 16
HRH occupations in each of the 20 countries. It shows that the maximum median earnings are highest in
Belgium, South Africa, the United Kingdom, the Netherlands, and United States. The maximum median
earnings are lowest in Poland, the Russian Federation and Ukraine. When focusing on the minimum me-
dian wages paid in the 20 countries, Table 3 shows that these are lowest in the Russian Federation, Ukraine,
Czech Republic, Brazil, India, and Poland. They are highest in Germany, Sweden, the United Kingdom, and
the Netherlands. Across countries, the wage differentials within occupations are highest for the group of
Medical Doctors and lowest for the group of Personal Care Workers (Graph 2). Across countries, the mean
wages within-occupations – thus the sum of the median wages in this occupational group divided by the
number of countries with valid wage data for this group - are highest for the group of Medical Doctors and
lowest for the group of Personal Care Workers (Graph 2). The correlation between the within-occupation
wage differentials and the within-occupation mean wages is high (r=.9), indicating that the wage distribu-
tions in the health workforce reveal similar patterns across countries.
Page ● 22
Kea Tijdens and Daniel de Vries
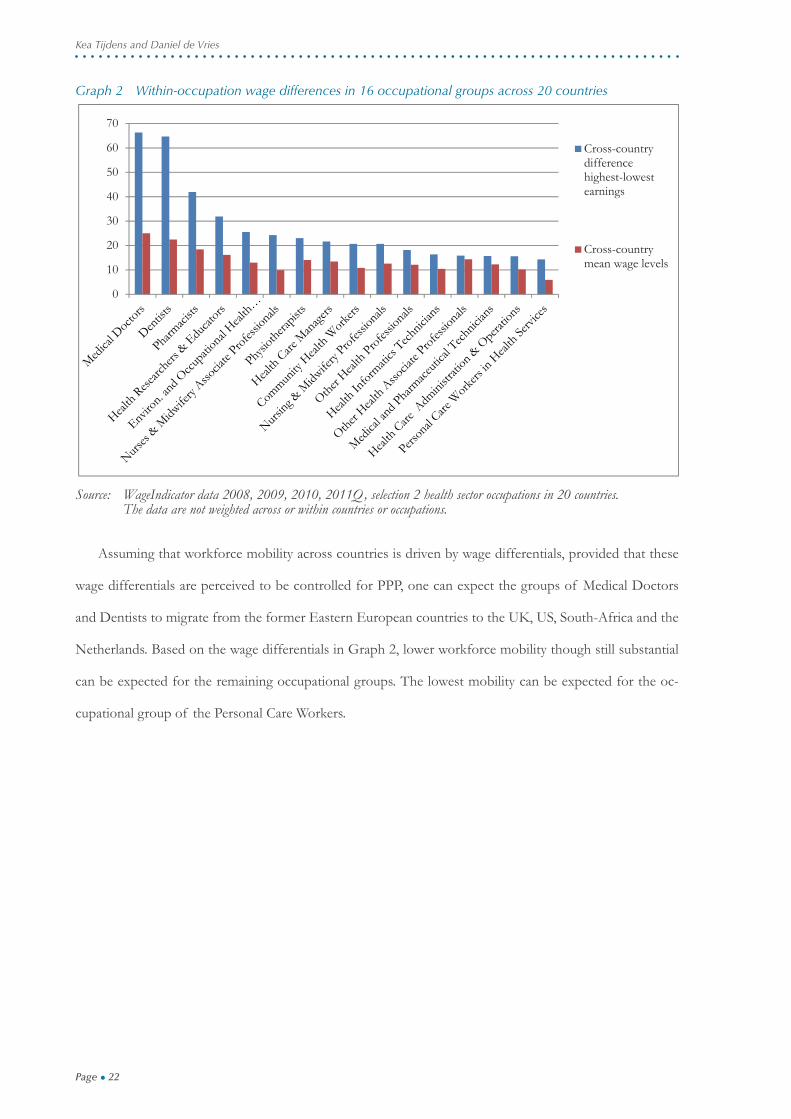
Graph 2 Within-occupation wage differences in 16 occupational groups across 20 countries
0
10
20
30
40
50
60
70
Cross-countrydifferencehighest-lowestearnings
Cross-countrymean wage levels
Source: WageIndicator data 2008, 2009, 2010, 2011Q, selection 2 health sector occupations in 20 countries. The data are not weighted across or within countries or occupations.
Assuming that workforce mobility across countries is driven by wage differentials, provided that these
wage differentials are perceived to be controlled for PPP, one can expect the groups of Medical Doctors
and Dentists to migrate from the former Eastern European countries to the UK, US, South-Africa and the
Netherlands. Based on the wage differentials in Graph 2, lower workforce mobility though still substantial
can be expected for the remaining occupational groups. The lowest mobility can be expected for the oc-
cupational group of the Personal Care Workers.
Page ● 23
Health workforce remuneration
4. Discussion
This study certainly has limitations. The fi rst one relates to the defi nition of wages. WageIndicator applies
a standard defi nition to all countries and occupations, as explained in section 3. However, wage structures
may vary across countries. It may include non-fi nancial remunerations such as housing or food, may include
fi nancial remunerations probably not reported as wage such as transportation cost reimbursement, may
include social benefi t or pension contributions, or may include in part cash rewards not reported. Thus,
whereas the web-survey has a standardized approach of calculating hourly wages, there may be variation
across countries which are not taken into account. Possibly this would explain the fi nding that median wages
for Associate Nurses and Midwives wages are higher than Nurses and Midwives in the United Kingdom
and South Africa.
A second limitation relates to the occupational titles. In this study, it is assumed that the same occupa-
tional titles to refer to the same job content across countries. Thus, the occupational group of Nursing &
Midwifery Professionals is assumed to have the same set of tasks across the world, otherwise the wages of
apples and pears would be compared. However, the job content of the HRH occupational groups is not
empirically tested on a worldwide scale. The WageIndicator web-survey does allow for a worldwide testing of
job content, but this would require a separate project for developing such testing.
A third limitation relates to the diploma credentials in the HRH occupations. In most countries for most
HRH occupations credentials are required. Depending on the supply and demand ratio in the local labor
market, these credentials will or will not be required for entry into the job. In most workplaces credentials
will lead to higher earnings. However, the current dataset does not allow controlling for credentials. Thus,
the dataset does not control for wages of accredited versus not-accredited jobholders in the same occupa-
tional group.
Finally, this study does not take into account the public or private provision of health care, which is as-
sumed to affect wage setting. It also does not take into account regional wage differentials in large countries.
Nevertheless these limitations, being the fi rst study on wages in a wide range of HRH occupations and a
wide range of countries in four continents, it certainly increases the understanding of wage levels and wage
dispersion in the HRH fi eld.

Page ● 24
Kea Tijdens and Daniel de Vries
Page ● 25
Health workforce remuneration
5. Conclusions
This paper breaks new ground by investigating for the fi rst time the wage levels and the wage distribu-
tion of 16 occupational groups in the Human Resources for Health (HRH) workforce for 20 countries.
Cross-country worldwide wage comparisons have not been undertaken for such a great detail in occupa-
tional breakdown. This data is needed for understanding cross-country mobility in the HRH workforce, for
understanding the national settings of health care provision, and for understanding wage setting processes
and credentialism within countries.
For the investigations, the data of the worldwide, continuous WageIndicator web-survey for 2008, 2009,
2010, and 2011 until April was pooled. The web-survey has detailed information about wages and about oc-
cupations, allowing for a break down into the 16 occupational groups in the HRH workforce in 20 countries.
For the analyses, the wages were fi rst controlled for purchasing power parity in the respective years, and then
these wages were set to the 2011 level. In total, the analyses included38,799 observations.
Research question 1 assumed that the ranking of median wages in the 16 occupational groups was simi-
lar across the 20 countries. The study reveals that in the majority of the countries the wage ranking is indeed
fairly similar across countries, particularly for higher income countries. In 7 of the 20 countries, the national
ranking correlates at least .7 with the overall 20-country ranking. The fi ndings show that the Medical Doc-
tors have overall the highest median wages and they have so in 11 of 20 countries, while the Personal Care
Workers have overall median lowest wages and they have so in 9 of 20 countries. Health Care Managers
lower earnings than Medical Doctors, but in 5 of 20 countries they have higher earnings (BLR, CZE, POL,
RUS, UKR). The wage levels of Nursing & Midwifery Professionals vary largely across countries.
Research question 2 assumed that the wage distribution among the 16 occupations was similar cross
countries. This assumption did not hold. The wage dispersion is defi ned as the ratio of the highest to the
lowest median earnings in an occupation in a country. It is highest in Brazil (7.0), whereas Sweden, Ger-
many, Poland, and Argentina are egalitarian countries as far as the median wages in the HRH workforce is
concerned.
Research question 3 assumed that the wage levels within the same occupational groups in the HRH
workforce were comparable across countries, using standardized PPP wages. The largest wage differences
are found for the Medical Doctors: the Ukraine doctor earns 19 times less compared to the US doctor.
Correlation between country-level earnings and wage differentials across countries, the data reveal that the
Page ● 26
Kea Tijdens and Daniel de Vries
higher the median wages in an occupation, the higher the wage difference across countries (r=.9).
In conclusion, the data of the WageIndicator web-survey allows for the mapping and comparison of
wage structures between countries, making visible a complex and diverse landscape of wage rankings, dis-
persions, and standardized wages. The fi ndings illustrate that the assumption of similarity in cross-country
wage ranking, wage dispersion, and purchasing power adjusted wage levels does not hold. These fi ndings
may help to explain the complexity of migratory paths observed.
Page ● 27
Health workforce remuneration
Abbreviations
HRH = Human Resources for Health
ILO = International Labour Organisation
ISCO = International Standard Classifi cation of Occupations
OWW= October Inquiry and the Occupational Wages
PPP = Purchasing Power Parity
WHO = World Health Organisation
USD = US dollars

Page ● 28
Kea Tijdens and Daniel de Vries
Page ● 29
Health workforce remuneration
References
Couper M, Miller P: Web-survey methods - Introduction. Public Opinion Quarterly 2008, 72: 831-835.
Couper M: Web-surveys: a review of issues and approaches. Public Opinion Quarterly 2000, 64: 464-481.
Dal Poz MR, Gupta N, Quain EE, Soucat ALB: Monitoring and evaluation of human resources for health: challenges and opportunities. In Handbook on Monitoring and Evaluation of Human Resources for Health. Ed-ited by Dal Poz MR, Gupta N, Quain EE, Soucat ALB. Geneva: World Health Organization; 2009: 3-12.
De Vries DH, Tijdens KG: Using the WageIndicator web-survey to monitor Human Resources for Health. Paper pre-sented at the International Conference on Research in Human Resources for Health, Rio de Janeiro, June 09 to 11; 2010.
Dovlo D: Retention and deployment of health workers and professionals in Africa. Report for the Consultative meeting on Improving Collaboration between Health Professions and Governments in Policy Formulation and Implementation of Health Sector. Addis Ababa, Ethiopia. January 28 – February 1, 2002.
Dräger S, Dal Poz MR, Evans DB: Health workers wages: an overview from selected countries. Background paper pre-pared for The world health report 2006 - working together for health. Geneva: World Health Organization; 2006.
Ferrinho P, Van Lerberghe W, Julien M, Fresta E, Gomes A, Dias F: How and why public sector doctors engage in private practice in Portuguese-speaking African countries. Health Policy and Planning 1998, 13: 332-338.
Grimshaw D, Carroll M: Improving the Position of Low-Wage Workers Through New Coordinating Insti-tutions: The Case of Public Hospitals. In Low-Wage Work in the United Kingdom. Edited by Lloyd C, Mason G, Mayhew K. New York: Russell Sage Foundation; 2008: 168-210.
Groves R: Survey Errors and Survey Costs. Wiley - Interscience: Haboken; 2004.
International LabourOrgnisation: Updating the International Standard Classifi cation of Occupations (ISCO) Draft ISCO-08 Group Defi nitions: Occupations in Health. Geneva, Switzerland: ILO, 2009 [http://www.ilo.org/public/english/bureau/stat/isco/docs/health.pdf]
Jaehrling K: The Polarization of Working Conditions: Cleaners and Nursing Assistants in Hospitals. In Low-Wage Work in Germany. Edited by Bosch G, Weinkopf C. New York: Russell Sage Foundation; 2008: 177-213.
Lee S, Vaillant R: Estimation for volunteer panel web-surveys using propensity score adjustment and cali-bration adjustment. Sociological Methods Research 2009, 37: 319-343.
Lee S: Propensity Score Adjustment as a weighting scheme for volunteer panel web-surveys. Journal of Of-fi cial Statistics 2006, 22: 329-349.
Loosveldt G, Sonck N: An evaluation of the weighting procedures for online access panel surveys. Survey Research Methods 2008, 2: 93-105.
McQuide P, Settle D, Abubaker W, Mustafa AG, Pierantoni CR, Turlington S, De Vries DH: Use of ad-ministrative data sources for health workforce analysis: multicountry experience in implementation of human resources information systems. In Handbook on Monitoring and Evaluation of Human Resources for Health. Edited by Dal Poz MR, Gupta N, Quain EE, Soucat ALB. Geneva: World Health Organization; 2009: 113-127.
Nguyen LR, Nderitu S, Zuyderduin E, Luboga AS, Hagopian A: Intent to migrate among nursing students in Uganda: Measures of the brain drain in the next generation of health professionals, Human Re-sources for Health 2008, 6:5.
Page ● 30
Kea Tijdens and Daniel de Vries
Pillinger J: Pay and the gender wage gap in health and social care. Report of EPSU Study on pay in the care sector in rela-tion to overall pay levels and the gender pay gap in different countries in the European Union.Brussels, EPSU; 2010.
Schonlau M, Van Soest A, Kapteyn A, Couper M: Selection bias in web-surveys and the use of propensity scores. Sociological Methods Research2009, 37: 291-318.
Smigelskas K, Padaiga Z: Do Lithuanian pharmacists intend to migrate? Journal of Ethnic and Migration Studies 2007, 33: 501-509.
Steinmetz S, Tijdens KG, De Pedraza P: Comparing different weighting procedures for volunteer online panels - Lessons to be learned from German and Dutch WageIndicator data. Amsterdam: University of Amsterdam, AIAS Work-ing Paper 76; 2009 [www.uva-aias.net/fi les/aias/wp76.pdf]
Steinmetz S, Tijdens KG: Can weighting improve the representativeness of volunteer online panels? In-sights form the German WageIndicator data. Concepts and Methods 2009, 5: 7-11.
Tijdens KG, De Vries D: HRH Remuneration: Comparing Wage Levels, Ranking and Dispersion of 16 Occupational Groups across the Health Workforce in 20 Countries. Amsterdam: University of Amsterdam, AIAS Working Paper 111; 2011 [www.uva-aias.net/fi les/aias/wp111.pdf]
Tijdens KG, Van Zijl S, Hughie-Williams M, Van Klaveren M, Steinmetz S: Codebook and explanatory note on the WageIndicator dataset, a worldwide, continuous, multilingual web-survey on work and wages with paper supplements. Amsterdam: University of Amsterdam, AIAS Working Paper 102; 2010 [www.uva-aias.net/fi les/aias/wp109.pdf]
Tijdens KG: Measuring occupations in web-surveys the WISCO database of occupations. Amsterdam: University of Amsterdam, AIAS Working Paper 86; 2010 [www.uva-aias.net/fi les/aias/wp86.pdf]
Vujicic M, Zurn P, Diallo K, Adams O, Dal Poz, M: The role of wages in the migration of health care pro-fessionals from developing countries, Human Resources for Health 2004, 2:3.
World Health Organization: Global Health Atlas. Geneva, Switzerland: WHO, 2009 [http://apps.who.int/globalatlas/default.as]
Page ● 31
Health workforce remuneration
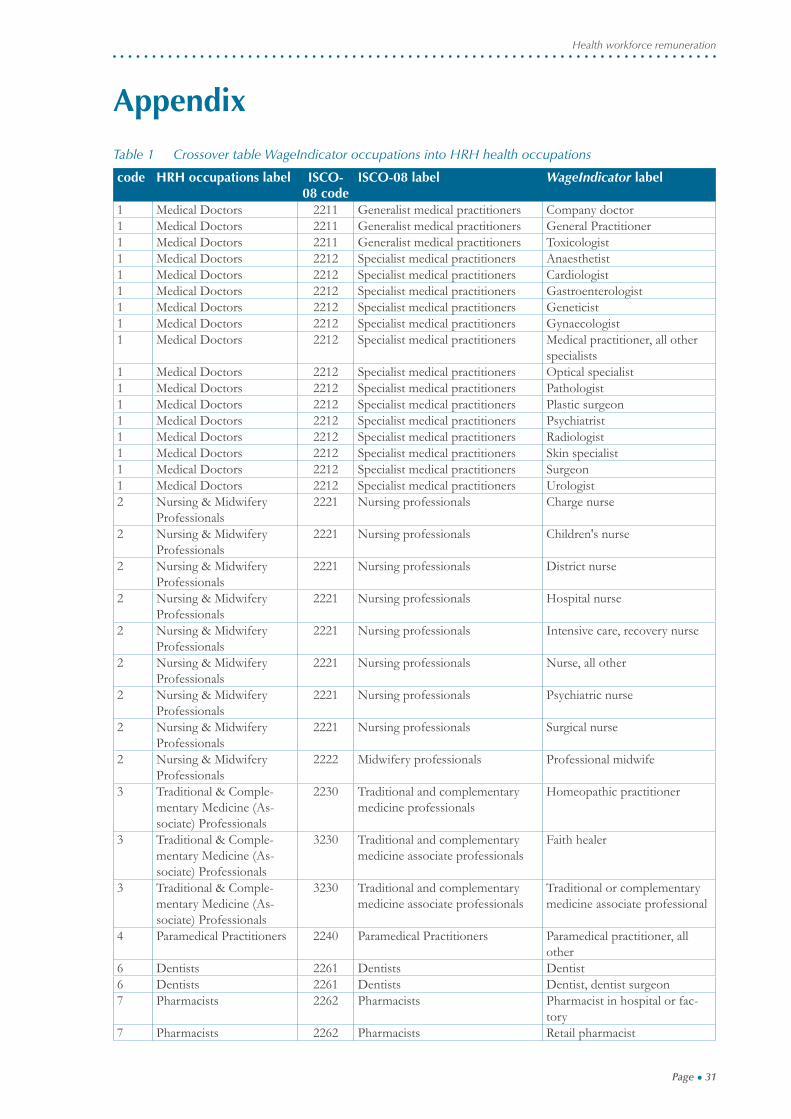
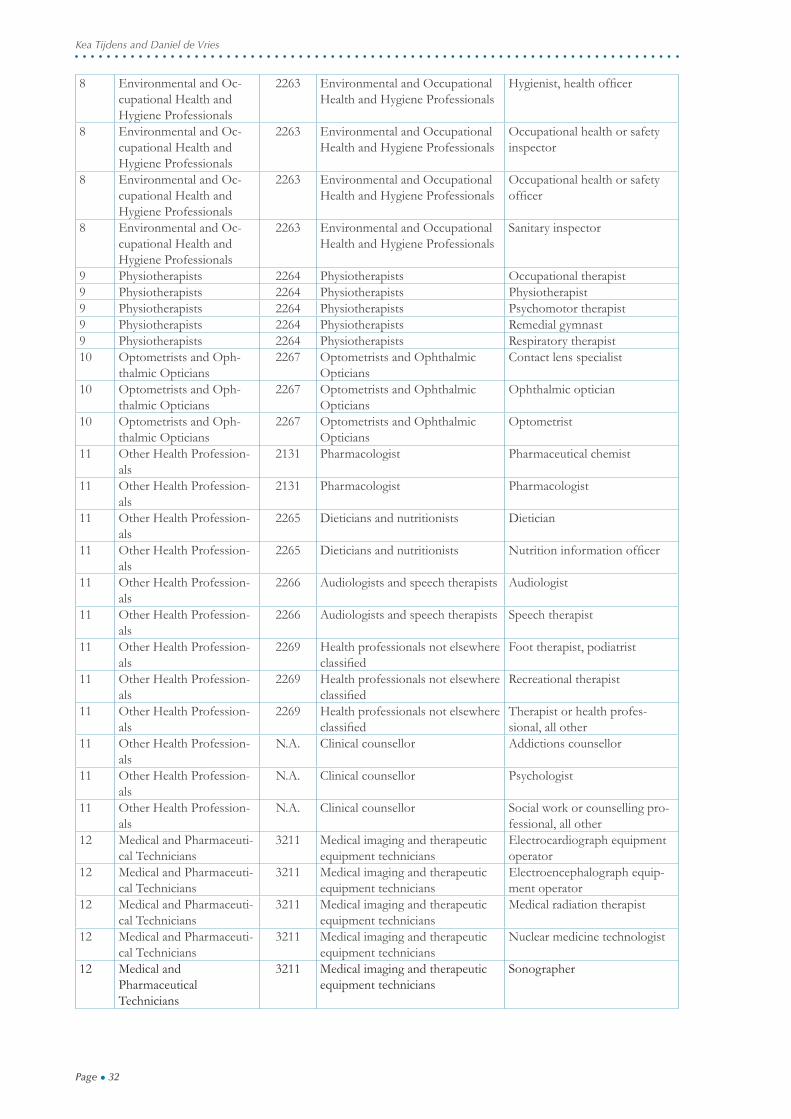
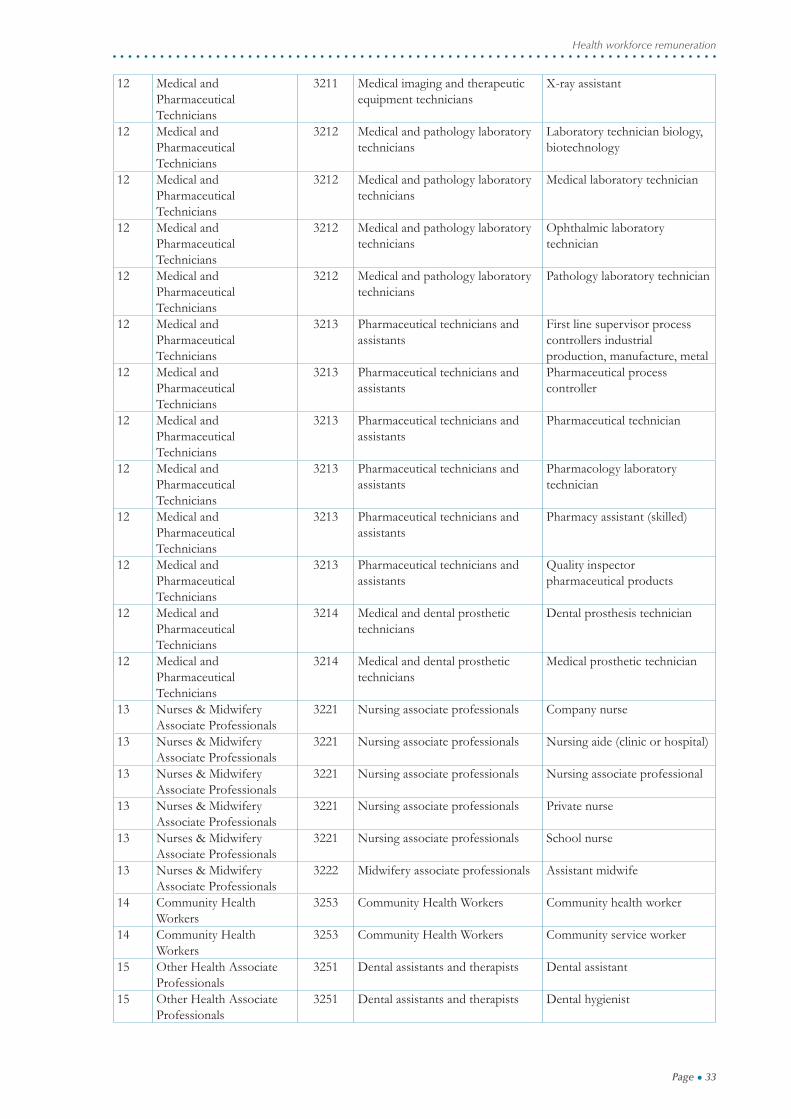
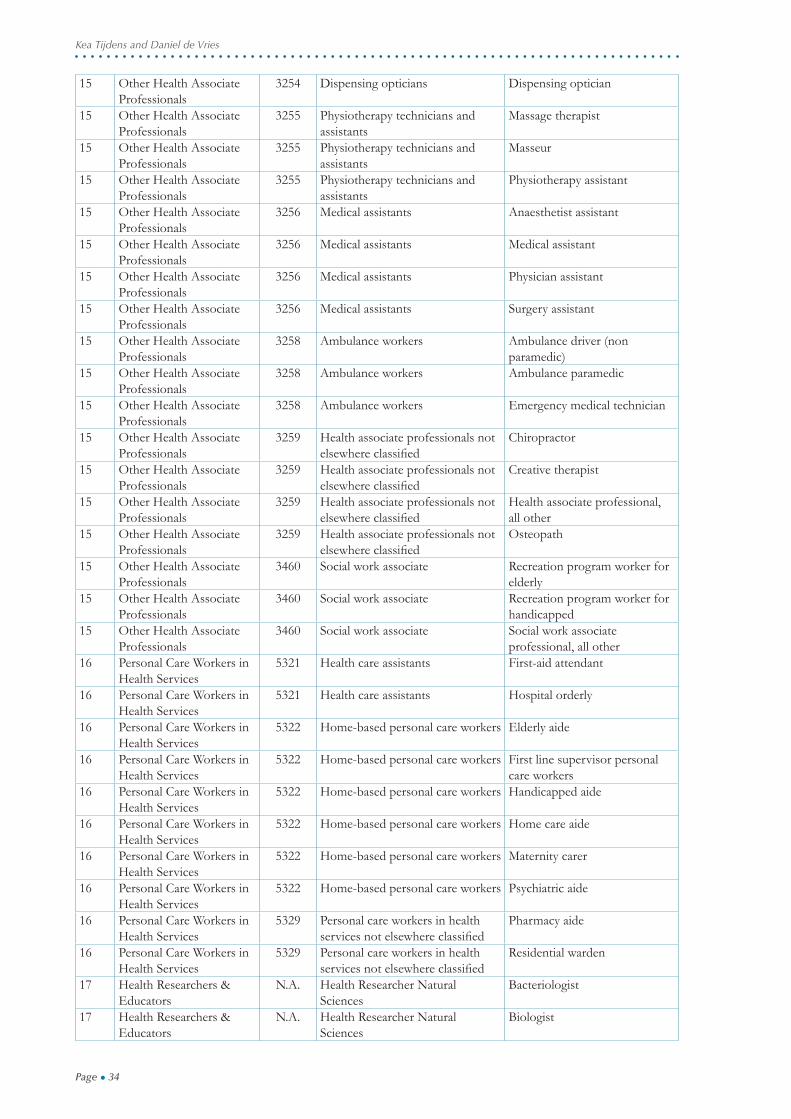
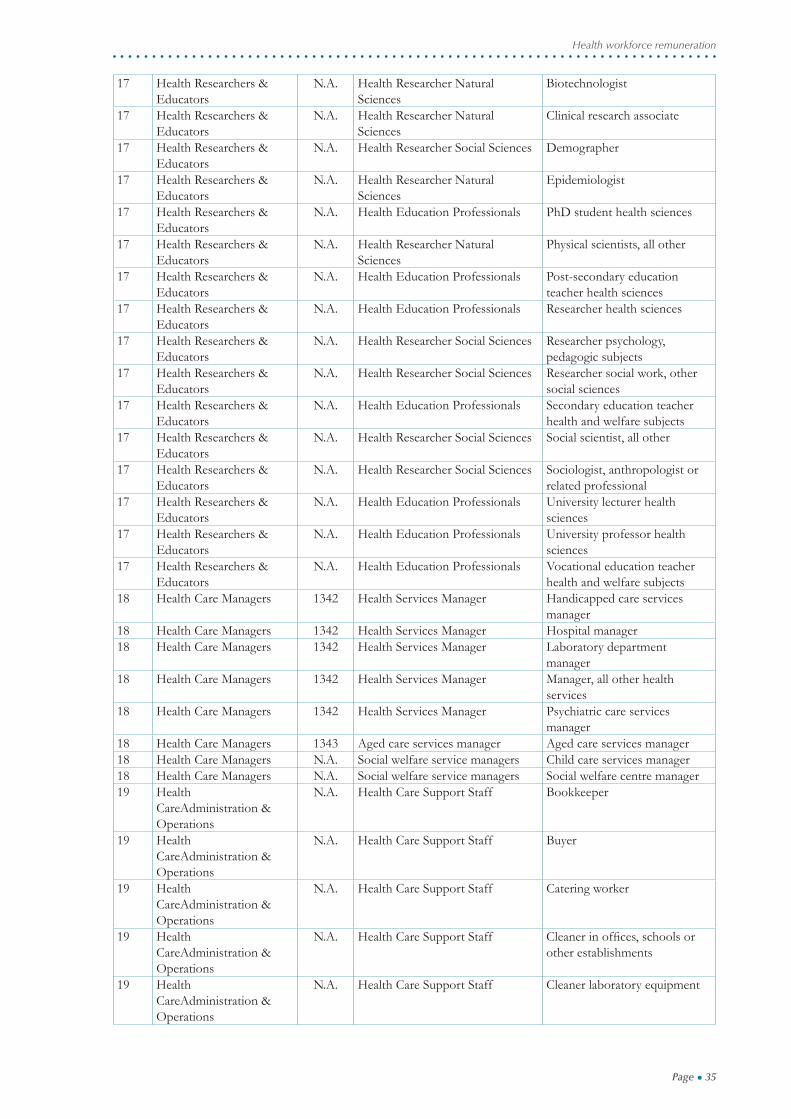
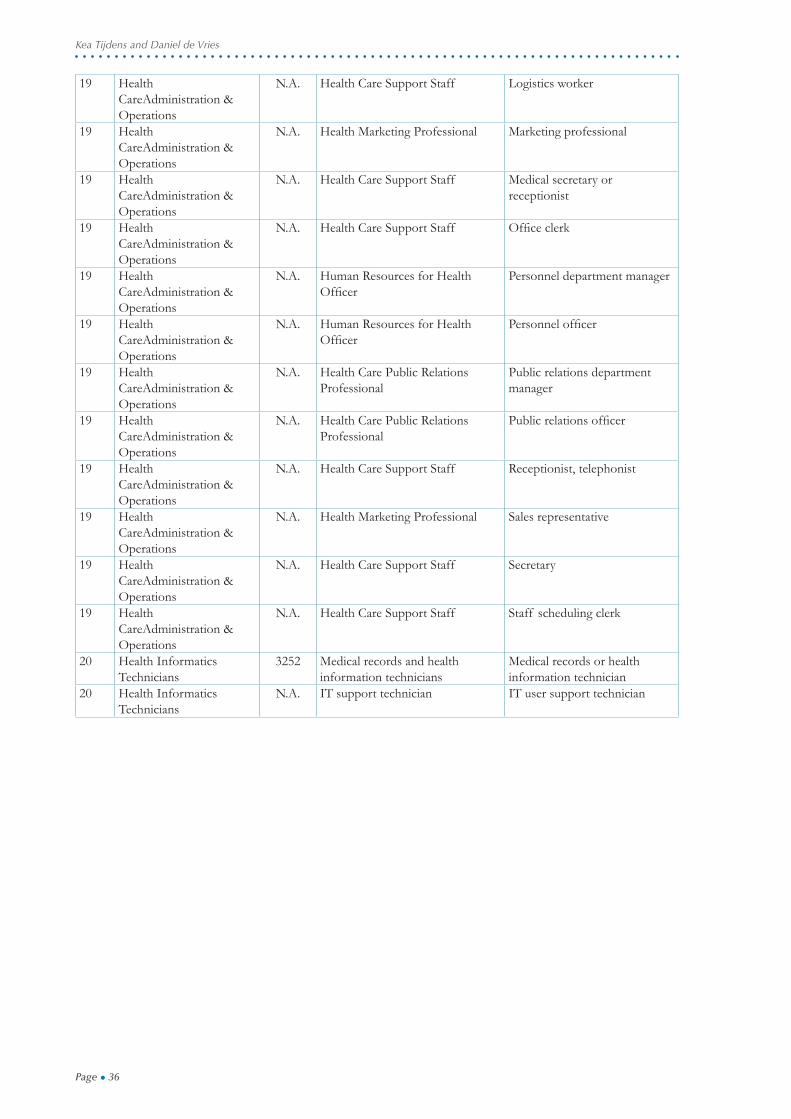
Appendix
Table 1 Crossover table WageIndicator occupations into HRH health occupations
code HRH occupations label ISCO-08 code
ISCO-08 label WageIndicator label
1 Medical Doctors 2211 Generalist medical practitioners Company doctor1 Medical Doctors 2211 Generalist medical practitioners General Practitioner1 Medical Doctors 2211 Generalist medical practitioners Toxicologist1 Medical Doctors 2212 Specialist medical practitioners Anaesthetist1 Medical Doctors 2212 Specialist medical practitioners Cardiologist1 Medical Doctors 2212 Specialist medical practitioners Gastroenterologist1 Medical Doctors 2212 Specialist medical practitioners Geneticist1 Medical Doctors 2212 Specialist medical practitioners Gynaecologist1 Medical Doctors 2212 Specialist medical practitioners Medical practitioner, all other
specialists1 Medical Doctors 2212 Specialist medical practitioners Optical specialist1 Medical Doctors 2212 Specialist medical practitioners Pathologist1 Medical Doctors 2212 Specialist medical practitioners Plastic surgeon1 Medical Doctors 2212 Specialist medical practitioners Psychiatrist1 Medical Doctors 2212 Specialist medical practitioners Radiologist1 Medical Doctors 2212 Specialist medical practitioners Skin specialist1 Medical Doctors 2212 Specialist medical practitioners Surgeon1 Medical Doctors 2212 Specialist medical practitioners Urologist2 Nursing & Midwifery
Professionals2221 Nursing professionals Charge nurse
2 Nursing & Midwifery Professionals
2221 Nursing professionals Children's nurse
2 Nursing & Midwifery Professionals
2221 Nursing professionals District nurse
2 Nursing & Midwifery Professionals
2221 Nursing professionals Hospital nurse
2 Nursing & Midwifery Professionals
2221 Nursing professionals Intensive care, recovery nurse
2 Nursing & Midwifery Professionals
2221 Nursing professionals Nurse, all other
2 Nursing & Midwifery Professionals
2221 Nursing professionals Psychiatric nurse
2 Nursing & Midwifery Professionals
2221 Nursing professionals Surgical nurse
2 Nursing & Midwifery Professionals
2222 Midwifery professionals Professional midwife
3 Traditional & Comple-mentary Medicine (As-sociate) Professionals
2230 Traditional and complementary medicine professionals
Homeopathic practitioner
3 Traditional & Comple-mentary Medicine (As-sociate) Professionals
3230 Traditional and complementary medicine associate professionals
Faith healer
3 Traditional & Comple-mentary Medicine (As-sociate) Professionals
3230 Traditional and complementary medicine associate professionals
Traditional or complementary medicine associate professional
4 Paramedical Practitioners 2240 Paramedical Practitioners Paramedical practitioner, all other
6 Dentists 2261 Dentists Dentist6 Dentists 2261 Dentists Dentist, dentist surgeon7 Pharmacists 2262 Pharmacists Pharmacist in hospital or fac-
tory7 Pharmacists 2262 Pharmacists Retail pharmacist
Page ● 32
Kea Tijdens and Daniel de Vries
8 Environmental and Oc-cupational Health and Hygiene Professionals
2263 Environmental and Occupational Health and Hygiene Professionals
Hygienist, health offi cer
8 Environmental and Oc-cupational Health and Hygiene Professionals
2263 Environmental and Occupational Health and Hygiene Professionals
Occupational health or safety inspector
8 Environmental and Oc-cupational Health and Hygiene Professionals
2263 Environmental and Occupational Health and Hygiene Professionals
Occupational health or safety offi cer
8 Environmental and Oc-cupational Health and Hygiene Professionals
2263 Environmental and Occupational Health and Hygiene Professionals
Sanitary inspector
9 Physiotherapists 2264 Physiotherapists Occupational therapist9 Physiotherapists 2264 Physiotherapists Physiotherapist 9 Physiotherapists 2264 Physiotherapists Psychomotor therapist9 Physiotherapists 2264 Physiotherapists Remedial gymnast 9 Physiotherapists 2264 Physiotherapists Respiratory therapist 10 Optometrists and Oph-
thalmic Opticians2267 Optometrists and Ophthalmic
OpticiansContact lens specialist
10 Optometrists and Oph-thalmic Opticians
2267 Optometrists and Ophthalmic Opticians
Ophthalmic optician
10 Optometrists and Oph-thalmic Opticians
2267 Optometrists and Ophthalmic Opticians
Optometrist
11 Other Health Profession-als
2131 Pharmacologist Pharmaceutical chemist
11 Other Health Profession-als
2131 Pharmacologist Pharmacologist
11 Other Health Profession-als
2265 Dieticians and nutritionists Dietician
11 Other Health Profession-als
2265 Dieticians and nutritionists Nutrition information offi cer
11 Other Health Profession-als
2266 Audiologists and speech therapists Audiologist
11 Other Health Profession-als
2266 Audiologists and speech therapists Speech therapist
11 Other Health Profession-als
2269 Health professionals not elsewhere classifi ed
Foot therapist, podiatrist
11 Other Health Profession-als
2269 Health professionals not elsewhere classifi ed
Recreational therapist
11 Other Health Profession-als
2269 Health professionals not elsewhere classifi ed
Therapist or health profes-sional, all other
11 Other Health Profession-als
N.A. Clinical counsellor Addictions counsellor
11 Other Health Profession-als
N.A. Clinical counsellor Psychologist
11 Other Health Profession-als
N.A. Clinical counsellor Social work or counselling pro-fessional, all other
12 Medical and Pharmaceuti-cal Technicians
3211 Medical imaging and therapeutic equipment technicians
Electrocardiograph equipment operator
12 Medical and Pharmaceuti-cal Technicians
3211 Medical imaging and therapeutic equipment technicians
Electroencephalograph equip-ment operator
12 Medical and Pharmaceuti-cal Technicians
3211 Medical imaging and therapeutic equipment technicians
Medical radiation therapist
12 Medical and Pharmaceuti-cal Technicians
3211 Medical imaging and therapeutic equipment technicians
Nuclear medicine technologist
12 Medical and Pharmaceutical Technicians
3211 Medical imaging and therapeutic equipment technicians
Sonographer
Page ● 33
Health workforce remuneration
12 Medical and Pharmaceutical Technicians
3211 Medical imaging and therapeutic equipment technicians
X-ray assistant
12 Medical and Pharmaceutical Technicians
3212 Medical and pathology laboratory technicians
Laboratory technician biology, biotechnology
12 Medical and Pharmaceutical Technicians
3212 Medical and pathology laboratory technicians
Medical laboratory technician
12 Medical and Pharmaceutical Technicians
3212 Medical and pathology laboratory technicians
Ophthalmic laboratory technician
12 Medical and Pharmaceutical Technicians
3212 Medical and pathology laboratory technicians
Pathology laboratory technician
12 Medical and Pharmaceutical Technicians
3213 Pharmaceutical technicians and assistants
First line supervisor process controllers industrial production, manufacture, metal
12 Medical and Pharmaceutical Technicians
3213 Pharmaceutical technicians and assistants
Pharmaceutical process controller
12 Medical and Pharmaceutical Technicians
3213 Pharmaceutical technicians and assistants
Pharmaceutical technician
12 Medical and Pharmaceutical Technicians
3213 Pharmaceutical technicians and assistants
Pharmacology laboratory technician
12 Medical and Pharmaceutical Technicians
3213 Pharmaceutical technicians and assistants
Pharmacy assistant (skilled)
12 Medical and Pharmaceutical Technicians
3213 Pharmaceutical technicians and assistants
Quality inspector pharmaceutical products
12 Medical and Pharmaceutical Technicians
3214 Medical and dental prosthetic technicians
Dental prosthesis technician
12 Medical and Pharmaceutical Technicians
3214 Medical and dental prosthetic technicians
Medical prosthetic technician
13 Nurses & Midwifery Associate Professionals
3221 Nursing associate professionals Company nurse
13 Nurses & Midwifery Associate Professionals
3221 Nursing associate professionals Nursing aide (clinic or hospital)
13 Nurses & Midwifery Associate Professionals
3221 Nursing associate professionals Nursing associate professional
13 Nurses & Midwifery Associate Professionals
3221 Nursing associate professionals Private nurse
13 Nurses & Midwifery Associate Professionals
3221 Nursing associate professionals School nurse
13 Nurses & Midwifery Associate Professionals
3222 Midwifery associate professionals Assistant midwife
14 Community Health Workers
3253 Community Health Workers Community health worker
14 Community Health Workers
3253 Community Health Workers Community service worker
15 Other Health Associate Professionals
3251 Dental assistants and therapists Dental assistant
15 Other Health Associate Professionals
3251 Dental assistants and therapists Dental hygienist
Page ● 34
Kea Tijdens and Daniel de Vries
15 Other Health Associate Professionals
3254 Dispensing opticians Dispensing optician
15 Other Health Associate Professionals
3255 Physiotherapy technicians and assistants
Massage therapist
15 Other Health Associate Professionals
3255 Physiotherapy technicians and assistants
Masseur
15 Other Health Associate Professionals
3255 Physiotherapy technicians and assistants
Physiotherapy assistant
15 Other Health Associate Professionals
3256 Medical assistants Anaesthetist assistant
15 Other Health Associate Professionals
3256 Medical assistants Medical assistant
15 Other Health Associate Professionals
3256 Medical assistants Physician assistant
15 Other Health Associate Professionals
3256 Medical assistants Surgery assistant
15 Other Health Associate Professionals
3258 Ambulance workers Ambulance driver (non paramedic)
15 Other Health Associate Professionals
3258 Ambulance workers Ambulance paramedic
15 Other Health Associate Professionals
3258 Ambulance workers Emergency medical technician
15 Other Health Associate Professionals
3259 Health associate professionals not elsewhere classifi ed
Chiropractor
15 Other Health Associate Professionals
3259 Health associate professionals not elsewhere classifi ed
Creative therapist
15 Other Health Associate Professionals
3259 Health associate professionals not elsewhere classifi ed
Health associate professional, all other
15 Other Health Associate Professionals
3259 Health associate professionals not elsewhere classifi ed
Osteopath
15 Other Health Associate Professionals
3460 Social work associate Recreation program worker for elderly
15 Other Health Associate Professionals
3460 Social work associate Recreation program worker for handicapped
15 Other Health Associate Professionals
3460 Social work associate Social work associate professional, all other
16 Personal Care Workers in Health Services
5321 Health care assistants First-aid attendant
16 Personal Care Workers in Health Services
5321 Health care assistants Hospital orderly
16 Personal Care Workers in Health Services
5322 Home-based personal care workers Elderly aide
16 Personal Care Workers in Health Services
5322 Home-based personal care workers First line supervisor personal care workers
16 Personal Care Workers in Health Services
5322 Home-based personal care workers Handicapped aide
16 Personal Care Workers in Health Services
5322 Home-based personal care workers Home care aide
16 Personal Care Workers in Health Services
5322 Home-based personal care workers Maternity carer
16 Personal Care Workers in Health Services
5322 Home-based personal care workers Psychiatric aide
16 Personal Care Workers in Health Services
5329 Personal care workers in health services not elsewhere classifi ed
Pharmacy aide
16 Personal Care Workers in Health Services
5329 Personal care workers in health services not elsewhere classifi ed
Residential warden
17 Health Researchers & Educators
N.A. Health Researcher Natural Sciences
Bacteriologist
17 Health Researchers & Educators
N.A. Health Researcher Natural Sciences
Biologist
Page ● 35
Health workforce remuneration
17 Health Researchers & Educators
N.A. Health Researcher Natural Sciences
Biotechnologist
17 Health Researchers & Educators
N.A. Health Researcher Natural Sciences
Clinical research associate
17 Health Researchers & Educators
N.A. Health Researcher Social Sciences Demographer
17 Health Researchers & Educators
N.A. Health Researcher Natural Sciences
Epidemiologist
17 Health Researchers & Educators
N.A. Health Education Professionals PhD student health sciences
17 Health Researchers & Educators
N.A. Health Researcher Natural Sciences
Physical scientists, all other
17 Health Researchers & Educators
N.A. Health Education Professionals Post-secondary education teacher health sciences
17 Health Researchers & Educators
N.A. Health Education Professionals Researcher health sciences
17 Health Researchers & Educators
N.A. Health Researcher Social Sciences Researcher psychology, pedagogic subjects
17 Health Researchers & Educators
N.A. Health Researcher Social Sciences Researcher social work, other social sciences
17 Health Researchers & Educators
N.A. Health Education Professionals Secondary education teacher health and welfare subjects
17 Health Researchers & Educators
N.A. Health Researcher Social Sciences Social scientist, all other
17 Health Researchers & Educators
N.A. Health Researcher Social Sciences Sociologist, anthropologist or related professional
17 Health Researchers & Educators
N.A. Health Education Professionals University lecturer health sciences
17 Health Researchers & Educators
N.A. Health Education Professionals University professor health sciences
17 Health Researchers & Educators
N.A. Health Education Professionals Vocational education teacher health and welfare subjects
18 Health Care Managers 1342 Health Services Manager Handicapped care services manager
18 Health Care Managers 1342 Health Services Manager Hospital manager18 Health Care Managers 1342 Health Services Manager Laboratory department
manager18 Health Care Managers 1342 Health Services Manager Manager, all other health
services18 Health Care Managers 1342 Health Services Manager Psychiatric care services
manager18 Health Care Managers 1343 Aged care services manager Aged care services manager18 Health Care Managers N.A. Social welfare service managers Child care services manager18 Health Care Managers N.A. Social welfare service managers Social welfare centre manager19 Health
CareAdministration & Operations
N.A. Health Care Support Staff Bookkeeper
19 Health CareAdministration & Operations
N.A. Health Care Support Staff Buyer
19 Health CareAdministration & Operations
N.A. Health Care Support Staff Catering worker
19 Health CareAdministration & Operations
N.A. Health Care Support Staff Cleaner in offi ces, schools or other establishments
19 Health CareAdministration & Operations
N.A. Health Care Support Staff Cleaner laboratory equipment
Page ● 36
Kea Tijdens and Daniel de Vries
19 Health CareAdministration & Operations
N.A. Health Care Support Staff Logistics worker
19 Health CareAdministration & Operations
N.A. Health Marketing Professional Marketing professional
19 Health CareAdministration & Operations
N.A. Health Care Support Staff Medical secretary or receptionist
19 Health CareAdministration & Operations
N.A. Health Care Support Staff Offi ce clerk
19 Health CareAdministration & Operations
N.A. Human Resources for Health Offi cer
Personnel department manager
19 Health CareAdministration & Operations
N.A. Human Resources for Health Offi cer
Personnel offi cer
19 Health CareAdministration & Operations
N.A. Health Care Public Relations Professional
Public relations department manager
19 Health CareAdministration & Operations
N.A. Health Care Public Relations Professional
Public relations offi cer
19 Health CareAdministration & Operations
N.A. Health Care Support Staff Receptionist, telephonist
19 Health CareAdministration & Operations
N.A. Health Marketing Professional Sales representative
19 Health CareAdministration & Operations
N.A. Health Care Support Staff Secretary
19 Health CareAdministration & Operations
N.A. Health Care Support Staff Staff scheduling clerk
20 Health Informatics Technicians
3252 Medical records and health information technicians
Medical records or health information technician
20 Health Informatics Technicians
N.A. IT support technician IT user support technician
Page ● 37
Health workforce remuneration
Table 2 Number of observations by occupational group and country
Medical Doctors
Nursing & Midwifery
Prof.
Dentists Pharmacists Environm. and Occ.
Health and Hygiene Prof.
Physiotherapists Other Health
Prof.
Medical and Pharmaceutical
Technicians
Argentina 114 106 7 20 21 11 55 144Belgium 50 288 8 44 32 41 214 182Brazil 188 154 101 100 59 58 152 343Belarus 164 19 24 9 20 2 19 45Chile 47 42 14 4 13 20 51 25Colombia 69 27 15 4 5 19 46 43Czech Republic
46 253 6 25 32 4 54 112
Finland 36 279 2 4 19 41 117 74Germany 393 1072 36 59 0 277 2418 432India 42 13 1 7 7 3 21 27Mexico 216 34 20 11 7 10 57 72Netherlands 164 472 21 24 109 185 667 538Poland 55 23 0 8 12 7 18 14Russian Federation
123 18 15 7 8 0 9 19
South Africa 33 65 3 10 21 6 80 85Spain 69 84 3 13 16 23 82 81Sweden 3 41 0 5 2 3 19 23Ukraine 73 26 15 12 11 1 22 15United Kingdom
66 144 15 35 22 17 139 71
United States 37 79 3 6 1 13 39 28Total 1988 3239 309 407 417 741 4279 2373
Community Health
Workers
Other Health Associate
Professionals
Personal Care
Workers in Health Services
Health Researchers & Educators
Health Care
Managers
Health Care Administration &
Operations
Health Informatics Technicians
total
Argentina 8 165 32 30 54 195 549 1554Belgium 59 164 143 127 207 304 210 2168Brazil 36 478 66 77 123 926 1094 4072Belarus 22 87 1 47 21 47 181 719Chile 20 85 4 18 24 32 183 591Colombia 8 42 22 12 23 66 159 599Czech Republic 29 205 25 85 305 501 324 2091Finland 21 206 214 103 76 166 183 1646Germany 192 1312 233 583 37 2633 2 10325India 5 25 2 82 35 136 205 612Mexico 14 56 13 32 63 75 849 1553Netherlands 61 1262 827 135 117 1140 465 7375Poland 10 26 5 30 16 13 33 272Russian Federa-tion
13 71 4 19 20 42 102 487
South Africa 5 74 5 60 78 203 263 1007Spain 16 148 30 41 39 52 212 934Sweden 10 49 3 15 20 32 63 297Ukraine 15 54 2 25 3 27 78 388United King-dom
44 185 148 90 152 202 214 1558
United States 8 93 15 42 52 59 62 551Total 596 4787 1794 1653 1465 6851 5431 38799
Page ● 38
Kea Tijdens and Daniel de Vries
Tabl
e 3
Ran
king
of o
ccup
atio
ns in
20
coun
trie
s Arg
enti
naB
elgi
umB
razi
lB
elar
usC
hile
Col
ombi
aC
zech
R
epub
licFi
nlan
dG
erm
any
Indi
a
Med
ical D
octo
rs16
.015
.016
.011
.416
.016
.012
.816
.013
.716
.0N
ursin
g &
Mid
wife
ry P
rofe
ssio
nals
10.0
10.0
14.0
2.3
13.7
9.6
7.5
9.1
8.0
1.3
Den
tists
14.0
16.0
15.0
8.0
14.9
13.9
1.1
14
.9
Phar
mac
ists
13.0
13.0
11.0
16.0
16.0
16
.05.
3E
nv. a
nd O
ccup
atio
nal H
ealth
Pro
fess
iona
ls8.
011
.09.
012
.611
.414
.99.
614
.9
4.0
Phys
ioth
erap
ists
11.0
9.0
12.0
9.
18.
5
5.7
2.3
O
ther
Hea
lth P
rofe
ssio
nals
5.0
4.0
8.0
9.1
8.0
6.4
10.7
6.9
10.3
12.0
Med
ical a
nd P
harm
aceu
tical
Tech
nicia
ns9.
08.
05.
010
.35.
77.
54.
38.
05.
713
.3N
urse
s & M
idw
ifery
Ass
ociat
e Pr
ofes
siona
ls3.
06.
06.
01.
11.
12.
12.
14.
63.
4
Com
mun
ity H
ealth
Wor
kers
6.0
3.0
3.0
5.7
6.9
12.8
5.3
3.4
11.4
2.7
Oth
er H
ealth
Ass
ociat
e Pr
ofes
siona
ls4.
01.
04.
06.
93.
45.
36.
410
.34.
66.
7Pe
rson
al Ca
re W
orke
rs in
Hea
lth S
ervi
ces
1.0
2.0
1.0
10.7
3.2
1.1
1.1
H
ealth
Res
earc
hers
& E
duca
tors
15.0
12.0
13.0
3.4
12.6
4.3
13.9
13.7
12.6
14.7
Hea
lth C
are
Man
ager
s12
.014
.010
.014
.910
.311
.714
.912
.69.
19.
3H
ealth
Car
e A
dmin
istra
tion
& O
pera
tions
2.0
7.0
2.0
4.6
2.3
1.1
8.5
2.3
6.9
8.0
Hea
lth In
form
atics
Tec
hnici
ans
7.0
5.0
7.0
13.7
4.6
3.2
11.7
11.4
10
.7
Mex
ico
Net
herl
ands
Pola
ndR
ussi
an
Fede
rati
onSo
uth
Afr
ica
Spai
nSw
eden
Ukr
aine
Uni
ted
Kin
gdom
Uni
ted
Stat
esM
edica
l Doc
tors
16.0
15.0
12.6
10.3
16.0
16.0
5.3
14.9
16.0
Nur
sing
& M
idw
ifery
Pro
fess
iona
ls9.
012
.05.
73.
49.
612
.810
.22.
16.
911
.4D
entis
ts12
.016
.06.
914
.916
.0Ph
arm
acist
s2.
014
.06.
912
.614
.911
.716
.012
.813
.714
.9E
nv. a
nd O
ccup
atio
nal H
ealth
. Pr
ofes
siona
ls11
.010
.08.
013
.713
.914
.96.
48.
0Ph
ysio
ther
apist
s1.
08.
011
.48.
54.
312
.612
.6O
ther
Hea
lth P
rofe
ssio
nals
7.0
9.0
4.6
14.9
7.5
5.3
5.8
11.7
5.7
8.0
Med
ical a
nd P
harm
aceu
tical
Tech
nicia
ns8.
06.
010
.38.
05.
39.
68.
77.
52.
35.
7N
urse
s & M
idw
ifery
Ass
ociat
e Pr
ofes
siona
ls3.
03.
01.
111
.78.
511
.61.
19.
16.
9Co
mm
unity
Hea
lth W
orke
rs6.
07.
03.
42.
36.
410
.71.
53.
210
.32.
3O
ther
Hea
lth A
ssoc
iate
Prof
essio
nals
10.0
4.0
2.3
5.7
4.3
3.2
2.9
4.3
3.4
4.6
Pers
onal
Care
Wor
kers
in H
ealth
Ser
vice
s15
.01.
01.
11.
11.
110
.71.
1H
ealth
Res
earc
hers
& E
duca
tors
14.0
11.0
16.0
9.1
10.7
13.9
13.1
8.5
11.4
13.7
Hea
lth C
are
Man
ager
s13
.013
.014
.916
.012
.87.
514
.513
.910
.3H
ealth
Car
e A
dmin
istra
tion
& O
pera
tions
4.0
5.0
13.7
4.6
2.1
2.1
7.3
9.6
1.1
3.4
Hea
lth In
form
atics
Tec
hnici
ans
5.0
2.0
9.1
11.4
3.2
6.4
4.4
16.0
4.6
9.1
Page ● 39
Health workforce remuneration
AIAS Working Papers (€ 7,50)
Recent publications of the Amsterdam Institute for Advanced Labour Studies. They can be downloaded from our website www.uva-aias.net under the subject Publications.
11-110 Over- and underqualifi cation of migrant workers. Evidence from WageIndicator survey data 2011 - Kea Tijdens and Maarten van Klaveren
11-109 Employees’ experiences of the impact of the economic crisis in 2009 and 2010 2011 - Kea Tijdens, Maarten van Klaveren, Reinhard Bispinck, Heiner Dribbusch and Fikret Öz
11-108 A deeper insight into the ethnic make-up of school cohorts: Diversity and school achievement 2011 - Virginia Maestri
11-107 Codebook and explanatory note on the EurOccupations dataset about the job content of 150 occupations 2011 - Kea Tijdens, Esther de Ruijter and Judith de Ruijter
10-106 The Future of Employment Relations: Goodbye ‘Flexicurity’ – Welcome Back Transitional Labour Markets? 2010 - Günther Schmid
11-105 Forthcoming: This time is different ?! The depth of the Financial Crisis and its effects in the Netherlands. Wiemer Salverda
11-104 Forthcoming: Integrate to integrate. Explaining institutional change in the public employment service - the one shop offi ce Marieke Beentjes, Jelle Visser and Marloes de Graaf-Zijl
11-103 Separate, joint or integrated? Active labour market policy for unemployed on social assistance and unemployment benefi ts 2011 - Lucy Kok, Caroline Berden and Marloes de Graaf-Zijl
10-102 Codebook and explanatory note on the WageIndicator dataset a worldwide, continuous, multilingual web-survey on work and wages with paper supplements 2010 - Kea Tijdens, Sanne van Zijl, Melanie Hughie-Williams, Maarten van Klaveren, Stephanie Steinmetz
10-101 Uitkeringsgebruik van Migranten 2010 - Aslan Zorlu, Joop Hartog and Marieke Beentjes
10-100 Low wages in the retail industry in the Netherlands. RSF project Future of work in Europe / Low-wage Employment: Opportunity in the Workplace in Europe and the USA 2010 - Maarten van Klaveren
10-99 Forthcoming: Pension fund governance. The intergenerational confl ict over risk and contributions 2010 - David Hollanders
10-98 The greying of the median voter. Aging and the politics of the welfare state in OECD countries 2010 - David Hollanders and Ferry Koster
10-97 An overview of women’s work and employment in Zimbabwe Decisions for Life Country Report 2010 - Maarten van Klaveren, Kea Tijdens, Melanie Hughie-Williams and Nuria Ramos
Page ● 40
Kea Tijdens and Daniel de Vries
10-96 An overview of women’s work and employment in Belarus Decisions for Life Country Report 2010 - Maarten van Klaveren, Kea Tijdens, Melanie Hughie-Williams and Nuria Ramos
10-95 Uitzenden in tijden van crisis 2010 - Marloes de Graaf-Zijl and Emma Folmer
10-94 An overview of women’s work and employment in Ukraine Decisions for Life Country Report 2010 - Maarten van Klaveren, Kea Tijdens, Melanie Hughie-Williams and Nuria Ramos
10-93 An overview of women’s work and employment in Kazakhstan Decisions for Life Country Report 2010 - Maarten van Klaveren, Kea Tijdens, Melanie Hughie-Williams and Nuria Ramos
10-92 An overview of women’s work and employment in Azerbaijan Decisions for Life Country Report 2010 - Maarten van Klaveren, Kea Tijdens, Melanie Hughie-Williams and Nuria Ramos
10-91 An overview of women’s work and employment in Indonesia Decisions for Life Country Report 2010 - Maarten van Klaveren, Kea Tijdens, Melanie Hughie-Williams and Nuria Ramos
10-90 An overview of women’s work and employment in India Decisions for Life Country Report 2010 - Maarten van Klaveren, Kea Tijdens, Melanie Hughie-Williams and Nuria Ramos
10-89 Coordination of national social security in the EU – Rules applicable in multiple cross border situations 2010 - Jan Cremers
10-88 Geïntegreerde dienstverlening in de keten van Werk en Inkomen 2010 - Marloes de Graaf-Zijl, Marieke Beentjes, Eline van Braak
10-87 Emigration and labour shortages. An opportunity for trade unions in new member states? 2010 - Monika Ewa Kaminska and Marta Kahancová
10-86 Measuring occupations in web-surveys. The WISCO database of occupations 2010 - Kea Tijdens
09-85 Multinationals versus domestic fi rms: Wages, working hours and industrial relations 2009 - Kea Tijdens and Maarten van Klaveren
09-84 Working time fl exibility components of companies in Europe 2009 - Heejung Chung and Kea Tijdens
09-83 An overview of women’s work and employment in Brazil Decisions for Life Country Report 2009 - Maarten van Klaveren, Kea Tijdens, Melanie Hughie-Williams and Nuria Ramos
09-82 An overview of women’s work and employment in Malawi Decisions for Life Country Report 2009 - Maarten van Klaveren, Kea Tijdens, Melanie Hughie-Williams and Nuria Ramos
09-81 An overview of women’s work and employment in Botswana Decisions for Life Country Report 2009 - Maarten van Klaveren, Kea Tijdens, Melanie Hughie-Williams and Nuria Ramos
Page ● 41
Health workforce remuneration
09-80 An overview of women’s work and employment in Zambia Decisions for Life Country Report 2009 - Maarten van Klaveren, Kea Tijdens, Melanie Hughie-Williams and Nuria Ramos
09-79 An overview of women’s work and employment in South Africa Decisions for Life Country Report 2009 - Maarten van Klaveren, Kea Tijdens, Melanie Hughie-Williams and Nuria Ramos
09-78 An overview of women’s work and employment in Angola Decisions for Life Country Report 2009 - Maarten van Klaveren, Kea Tijdens, Melanie Hughie-Williams and Nuria Ramos
09-77 An overview of women’s work and employment in Mozambique Decisions for Life Country Report 2009 - Maarten van Klaveren, Kea Tijdens, Melanie Hughie-Williams and Nuria Ramos
09-76 Comparing different weighting procedures for volunteer web surveys. Lessons to be learned from German and Dutch Wage indicator data 2009 - Stephanie Steinmetz, Kea Tijdens and Pablo de Pedraza
09-75 Welfare reform in the UK, the Netherlands, and Finland. Change within the limits of path dependence. 2009 - Minna van Gerven
09-74 Flexibility and security: an asymmetrical relationship? The uncertain relevance of fl exicurity policies for segmented labour markets and residual welfare regimes 2009 - Aliki Mouriki (guest at AIAS from October 2008 - March 2009)
09-73 Education, inequality, and active citizenship tensions in a differentiated schooling system 2009 - Herman van de Werfhorst
09-72 An analysis of fi rm support for active labor market policies in Denmark, Germany, and the Netherlands 2009 - Moira Nelson
08-71 The Dutch minimum wage radical reduction shifts main focus to part-time jobs 2008 - Wiemer Salverda
08-70 Parallelle innovatie als een vorm van beleidsleren: Het voorbeeld van de keten van werk en inkomen 2008 - Marc van der Meer, Bert Roes
08-69 Balancing roles - bridging the divide between HRM, employee participation and learning in the Dutch knowledge economy 2008 - Marc van der Meer, Wout Buitelaar
08-68 From policy to practice: Assessing sectoral fl exicurity in the Netherlands October 2008 - Hesther Houwing / Trudie Schils
08-67 The fi rst part-time economy in the world. Does it work? Republication August 2008 - Jelle Visser 08-66 Gender equality in the Netherlands: an example of Europeanisation of social law and policy May 2008 - Nuria E.Ramos-Martin07-65 Activating social policy and the preventive approach for the unemployed in the Netherlands January 2008 - Minna van Gerven
07-64 Struggling for a proper job: Recent immigrants in the Netherlands January 2008 - Aslan Zorlu
Page ● 42
Kea Tijdens and Daniel de Vries
07-63 Marktwerking en arbeidsvoorwaarden – de casus van het openbaar vervoer, de energiebedrijven en de thuiszorg July 2007 - Marc van der Meer, Marian Schaapman & Monique Aerts
07-62 Vocational education and active citizenship behaviour in cross-national perspective November 2007 - Herman G. van der Werfhorst
07-61 The state in industrial relations: The politics of the minimum wage in Turkey and the USA November 2007 - Ruÿa Gökhan Koçer & Jelle Visser
07-60 Sample bias, weights and effi ciency of weights in a continuous web voluntary survey September 2007 - Pablo de Pedraza, Kea Tijdens & Rafael Muñoz de Bustillo
07-59 Globalization and working time: Work-Place hours and fl exibility in Germany October 2007 - Brian Burgoon & Damian Raess
07-58 Determinants of subjective job insecurity in 5 European countries August 2007 - Rafael Muñoz de Bustillo & Pablo de Pedraza
07-57 Does it matter who takes responsibility? May 2007 - Paul de Beer & Trudie Schils
07-56 Employement protection in dutch collective labour agreements April 2007 - Trudie Schils
07-54 Temporary agency work in the Netherlands February 2007 - Kea Tijdens, Maarten van Klaveren, Hester Houwing, Marc van der Meer & Marieke van Essen
07-53 Distribution of responsibility for social security and labour market policy Country report: Belgium January 2007 - Johan de Deken
07-52 Distribution of responsibility for social security and labour market policy Country report: Germany January 2007 - Bernard Ebbinghaus & Werner Eichhorst
07-51 Distribution of responsibility for social security and labour market policy Country report: Denmark January 2007 - Per Kongshøj Madsen
07-50 Distribution of responsibility for social security and labour market policy Country report: The United Kingdom January 2007 - Jochen Clasen
07-49 Distribution of responsibility for social security and labour market policy Country report: The Netherlands January 2007 - Trudie Schils
06-48 Population ageing in the Netherlands: demographic and fi nancial arguments for a balanced approach January 2007 - Wiemer Salverda
06-47 The effects of social and political openness on the welfare state in 18 OECD countries, 1970-2000 January 2007 - Ferry Koster
06-46 Low pay incidence and mobility in the Netherlands - Exploring the role of personal, job and employer characteristics October 2006 - Maite Blázques Cuesta & Wiemer Salverda
Page ● 43
Health workforce remuneration
06-45 Diversity in work: The heterogeneity of women’s labour market participation patterns September 2006 - Mara Yerkes
06-44 Early retirement patterns in Germany, the Netherlands and the United Kingdom October 2006 - Trudie Schils
06-43 Women’s working preferences in the Netherlands, Germany and the UK August 2006 - Mara Yerkes
05-42 Wage bargaining institutions in Europe: a happy marriage or preparing for divorce? December 2005 - Jelle Visser
05-41 The work-family balance on the union’s agenda December 2005 - Kilian Schreuder
05-40 Boxing and dancing: Dutch trade union and works council experiences revisited November 2005 - Maarten van Klaveren & Wim Sprenger
05-39 Analysing employment practices in western european multinationals: coordination, indus- trial relations and employment fl exibility in Poland October 2005 - Marta Kahancova & Marc van der Meer
05-38 Income distribution in the Netherlands in the 20th century: long-run developments and cyclical properties September 2005 - Emiel Afman
05-37 Search, mismatch and unemployment July 2005 - Maite Blazques & Marcel Jansen
05-36 Women’s preferences or delineated policies? The development of part-time work in the Netherlands, Germany and the United Kingdom July 2005 - Mara Yerkes & Jelle Visser
05-35 Vissen in een vreemde vijver: Het werven van verpleegkundigen en verzorgenden in het buitenland May 2005 - Judith Roosblad
05-34 Female part-time employment in the Netherlands and Spain: an analysis of the reasons for taking a part-time job and of the major sectors in which these jobs are performed May 2005 - Elena Sirvent Garcia del Valle
05-33 Een functie met inhoud 2004 - Een enquête naar de taakinhoud van secretaressen 2004, 2000, 1994 April 2005 - Kea Tijdens
04-32 Tax evasive behavior and gender in a transition country November 2004 - Klarita Gërxhani
04-31 How many hours do you usually work? An analysis of the working hours questions in 17 large-scale surveys in 7 countries November 2004 - Kea Tijdens
04-30 Why do people work overtime hours? Paid and unpaid overtime working in the Netherlands August 2004 - Kea Tijdens
04-29 Overcoming marginalisation? Gender and ethnic segregation in the Dutch construction, health, IT and printing industries July 2004 - Marc van der Meer
Page ● 44
Kea Tijdens and Daniel de Vries
04-28 The work-family balance in collective agreements. More female employees, more provi- sions? July 2004 - Killian Schreuder
04-27 Female income, the ego effect and the divorce decision: evidence from micro data March 2004 - Randy Kesselring (Professor of Economics at Arkansas State University, USA) was guest at AIAS in April and May 2003
04-26 Economische effecten van Immigratie – Ontwikkeling van een Databestand en eerste analyses Januari 2004 - Joop Hartog & Aslan Zorlu
03-25 Wage Indicator – Dataset Loonwijzer Januari 2004 - Kea Tijdens
03-24 Codeboek DUCADAM dataset December 2003 - Kilian Schreuder & Kea Tijdens
03-23 Household consumption and savings around the time of births and the role of education December 2003 - Adriaan S. Kalwij
03-22 A panel data analysis of the effects of wages, standard hours and unionisation on paid overtime work in Britain October 2003 - Adriaan S. Kalwij
03-21 A two-step fi rst-difference estimator for a panel data tobit model December 2003 - Adriaan S. Kalwij
03-20 Individuals’ unemployment durations over the business cycle June 2003 - Adriaan Kalwei
03-19 Een onderzoek naar CAO-afspraken op basis van de FNV cao-databank en de AWVN-database December 2003 - Kea Tijdens & Maarten van Klaveren
03-18 Permanent and transitory wage inequality of British men, 1975-2001: Year, age and cohort effects October 2003 - Adriaan S. Kalwij & Rob Alessie
03-17 Working women’s choices for domestic help October 2003 - Kea Tijdens, Tanja van der Lippe & Esther de Ruijter
03-16 De invloed van de Wet arbeid en zorg op verlofregelingen in CAO’s October 2003 - Marieke van Essen
03-15 Flexibility and social protection August 2003 - Ton Wilthagen
03-14 Top incomes in the Netherlands and the United Kingdom over the Twentieth Century September 2003 - A.B.Atkinson & dr. W. Salverda
03-13 Tax evasion in Albania: An institutional vacuum April 2003 - Klarita Gërxhani
03-12 Politico-economic institutions and the informal sector in Albania May 2003 - Klarita Gërxhani
03-11 Tax evasion and the source of income: An experimental study in Albania and the Nether- lands May 2003 - Klarita Gërxhani
Page ● 45
Health workforce remuneration
03-10 Chances and limitations of “benchmarking” in the reform of welfare state structures - the case of pension policy May 2003 - Martin Schludi
03-09 Dealing with the “fl exibility-security-nexus: Institutions, strategies, opportunities and barriers May 2003 - Ton Wilthagen & Frank Tros
03-08 Tax evasion in transition: Outcome of an institutional clash -Testing Feige’s conjecture March 2003 - Klarita Gërxhani
03-07 Teleworking policies of organisations- The Dutch experiencee February 2003 - Kea Tijdens & Maarten van Klaveren
03-06 Flexible work - Arrangements and the quality of life February 2003 - Cees Nierop
01-05 Employer’s and employees’ preferences for working time reduction and working time differentia- tion – A study of the 36 hours working week in the Dutch banking industry 2001 - Kea Tijdens
01-04 Pattern persistence in europan trade union density October 2001 - Danielle Checchi & Jelle Visser
01-03 Negotiated fl exibility in working time and labour market transitions – The case of the Netherlands 2001 - Jelle Visser
01-02 Substitution or segregation: Explaining the gender composition in Dutch manufacturing industry 1899 – 1998 June 2001 - Maarten van Klaveren & Kea Tijdens
00-01 The fi rst part-time economy in the world. Does it work? 2000 - Jelle Visser

Page ● 46
Kea Tijdens and Daniel de Vries
Page ● 47
Health workforce remuneration
Information about AIAS
AIAS is a young interdisciplinary institute, established in 1998, aiming to become the leading expert cen-
tre in the Netherlands for research on industrial relations, organisation of work, wage formation and labour
market inequalities. As a network organisation, AIAS brings together high-level expertise at the University
of Amsterdam from fi ve disciplines:
● Law
● Economics
● Sociology
● Psychology
● Health and safety studies
AIAS provides both teaching and research. On the teaching side it offers a Masters in Comparative
Labour and Organisation Studies and one in Human Resource Management. In addition, it organizes spe-
cial courses in co-operation with other organisations such as the Netherlands Centre for Social Innovation
(NCSI), the Netherlands Institute for Small and Medium-sized Companies (MKB-Nederland), the National
Centre for Industrial Relations ‘De Burcht’, the National Institute for Co-determination (GBIO), and the
Netherlands Institute of International Relations ‘Clingendael’. AIAS has an extensive research program
(2004-2008) on Institutions, Inequalities and Internationalisation, building on the research performed by its
member scholars. Current research themes effectively include:
● Wage formation, social policy and industrial relations
● The cycles of policy learning and mimicking in labour market reforms in Europe
● The distribution of responsibility between the state and the market in social security
● The wage-indicator and world-wide comparison of employment conditions
● The projects of the LoWER network
Amsterdam Institute for Advanced labour Studies
University of Amsterdam
Plantage Muidergracht 12 ● 1018 TV Amsterdam ● The Netherlands
Tel +31 20 525 4199 ● Fax +31 20 525 4301
[email protected] ● www.uva-aias.net