healthcare associated infection report march 2017 data · ongoing alert organism surveillance and...
TRANSCRIPT

Heather Gourlay- Senior Manager Prevention and Control of Infection Sandra McAuley- Clinical Nurse Manager Prevention and Control of Infection Date 20/04/17
Page 1 of 18
Healthcare Associated Infection Report
March 2017 data
Section 1 – Board Wide Issues
Key Healthcare Associated Infection Headlines
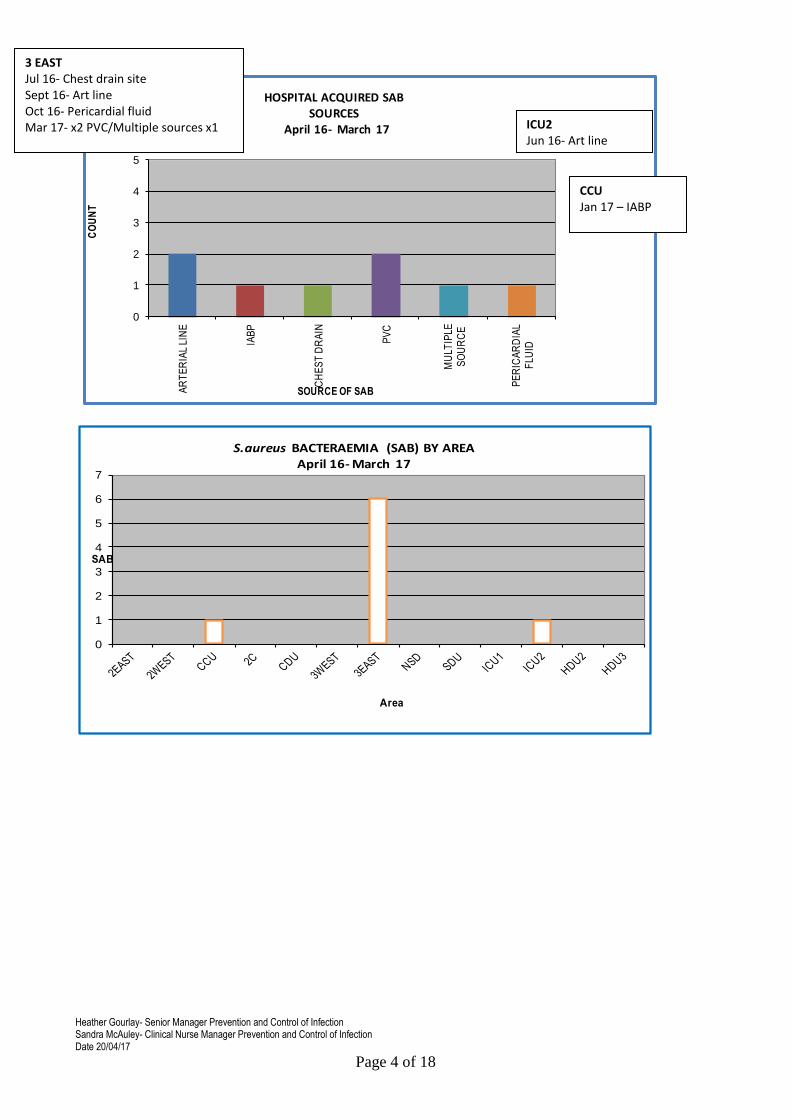
Staphylococcus aureus Bacteraemia- 3 SAB cases to report in March in 3 East. Routine Enhanced SAB Investigation is underway and additional support is currently being provided to target potential root causes. The SAB HEAT target has been achieved but awaits HPS validation. To date- April 2016 – March 2017, 8 SAB have been noted In comparison- April 2015 - March 2016, 11 SAB were noted
Clostridium difficile infection- 1 case to report in March. This has been the first case noted since March 2014. No risk factors other than age, justified use of prophylaxis and use of proton pump inhibiters were noted. No cross contamination noted. The CDI HEAT target has been achieved but awaits HPS validation.
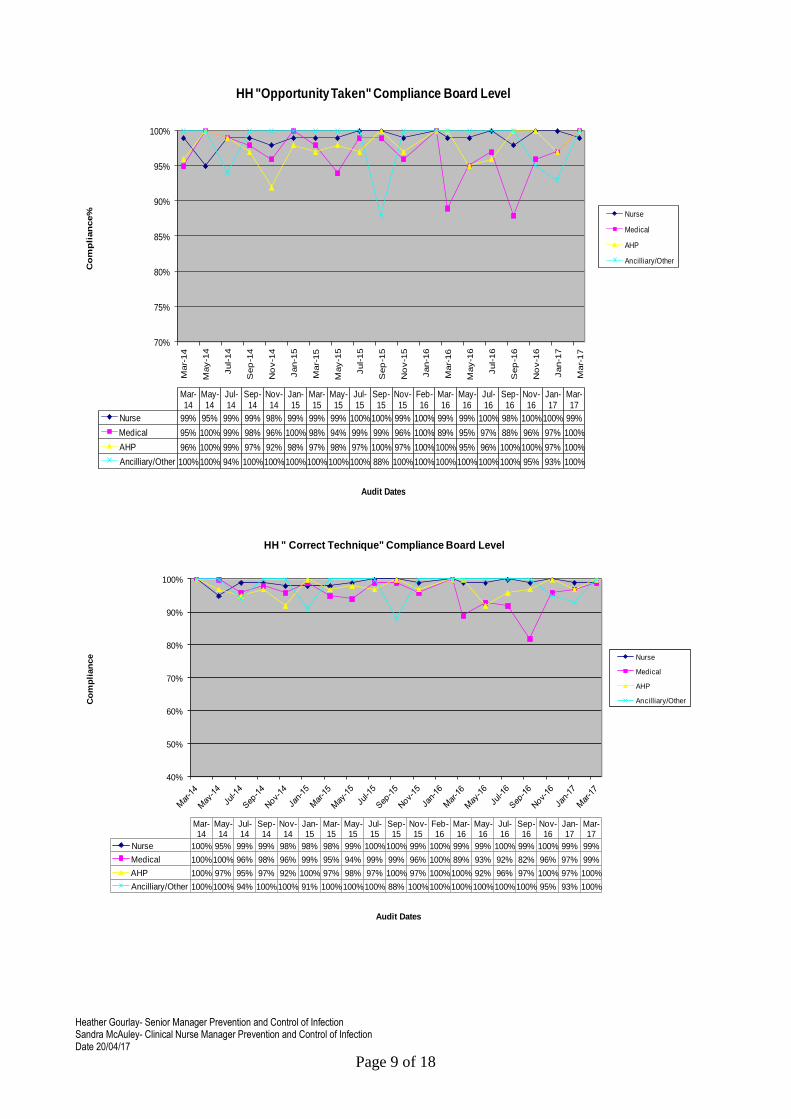
Hand Hygiene- The bimonthly report from March demonstrates 99% compliance with Hand Hygiene, noted improvement with medical staff compliance.
Cleaning and the Healthcare Environment- Facilities Management Tool
Housekeeping Compliance – 98.61% Estates Compliance –99.34%.
Surgical Site Infection- CABG and Ortho SSI rates are within control limits. Three SSI have been reported in CABG surgery in March, the team have arranged a meeting with key stakeholders to review and establish any further learning points. No Total Knee Replacement SSI (within 30 days of procedure) reported since Mar 16. No Total Hip Replacement SSI (within 30 days of procedure) reported since Oct 16.
Other HAI Related Activity
Pseudomonas in Critical Care Final Report has been circulated to PAG members and will be submitted to PCIC 5th May and Clinical Governance Risk Management Group thereafter.
Problem Assessment Groups (PAG) - Locally convened group to further investigate an HAI issue
(not outbreak) which may require additional multidisciplinary controls.
PAGs Update Progress
Mycobacterium chimaera
Heath Protection Scotland are leading Scotland’s response to the international investigation of Mycobacterium infections associated the use of cardiopulmonary bypass heater cooler machines, and have initiated a subgroup with representatives nominated by the Medical Director from each Board to agree how to progress the Patient Notification Exercise(PNE). This commenced 20th March 2017 and is being lead locally by Surgical Specialities. We are continuing to work with HPS to manage the very low risk associated with colonised machines. Scottish Government HAI Policy Unit are also informed of our current position.
Section 1 of the HAIRT covers Board wide infection prevention and control activity and actions. For reports on individual departments, please refer to the ‘Healthcare Associated Infection Report Cards’ in Section 2.

Heather Gourlay- Senior Manager Prevention and Control of Infection Sandra McAuley- Clinical Nurse Manager Prevention and Control of Infection Date 20/04/17
Page 2 of 18
Staphylococcus aureus (including MRSA)
GJNH approach to SAB prevention and reduction
It is accepted within HPS that care must be taken in making comparisons with other Boards data because of the specialist patient population within GJNH. All SAB isolates identified within the laboratory are subject to case investigation to determine future learning and quality improvement. Small numbers of cases can quickly change our targeted approach to SAB reduction. The SAB Improvement Group is responsible for reviewing trends in SAB acquisition and associated improvement actions. Broad HAI initiatives which influence our SAB rate include-
Hand Hygiene monitoring
MRSA screening at pre-assessment clinics and admission
Compliance with National Cleaning Specifications
Audit of the environment and practices via Prevention and Control of Infection Annual Reviews & monthly SCN led Standard Infection Control Precautions and Peer Review monitoring
Participation in National Enhanced SAB surveillance- gaining further intelligence on the epidemiology of SAB locally and nationally.
SSI Related SAB
Introduction of MSSA screening for cardiac and subsequent treatment pre and Post op as a risk reduction approach.
Surgical Site Infection Surveillance in collaboration with Health Protection Scotland and compared with Health Protection Agency data to allow rapid identification of increasing and decreasing trends of SSI.
Standardisation of post op cardiac wound care.
Development and implementation of a wound swabbing protocol and competency. Device Related SAB
SPSP work streams continue to aim to sustain compliance with PVC CVC, PICC and IABP bundles, assessment of compliance locally aids targeting of
Staphylococcus aureus is an organism which is responsible for a large number of healthcare associated infections, although it can also cause infections in people who have not had any recent contact with the healthcare system. The most common form of this is Meticillin Sensitive Staphylococcus aureus (MSSA), but the more well known is MRSA (Meticillin Resistant Staphylococcus aureus), which is a specific type of the organism which is resistant to certain antibiotics and is therefore more difficult to treat. More information on these organisms can be found at: http://www.nhs24.com/content/default.asp?page=s5_4&articleID=346
MRSA: http://www.nhs24.com/content/default.asp?page=s5_4&articleID=252
NHS Boards carry out surveillance of Staphylococcus aureus blood stream infections, known as bacteraemias. These are a serious form of infection and there is a national target to reduce them. The number of patients with MSSA and MRSA bacteraemias for the Board can be found at the end of section 1 and for each hospital in section 2. Information on the national surveillance programme for Staphylococcus aureus bacteraemias can be found at:
http://www.hps.scot.nhs.uk/haiic/sshaip/publicationsdetail.aspx?id=30248

Heather Gourlay- Senior Manager Prevention and Control of Infection Sandra McAuley- Clinical Nurse Manager Prevention and Control of Infection Date 20/04/17
Page 3 of 18
SAB Local Delivery Plan (LDP) Heat Delivery Trajectories Boards are expected to achieve a rolling target of 0.24 cases per 1,000 acute occupied bed days or lower by year ending March 2017 Boards currently with a rate of less than 0.24 are again expected to at least maintain this, as reflected in their trajectories. Our local rate Jan- Mar 17 is 0.34 per 1000 occupied bed days. Overall Apr 16- Mar 17 rate 0.16 per 1000 occupied bed days. The Prevention and Control of Infection Team continue to work closely with the clinical teams and clinical educators to gain insight into the sources of SAB acquisition and associated learning.
0.00
0.08
0.00
0.08
0.33
0.25
0.16 0.16
0.08
0.16
0.08
0.34
0.00
0.05
0.10
0.15
0.20
0.25
0.30
0.35
0.40
Apr-Jun 14
Jul-Sep 14 Oct-Dec 14
Jan-Mar 15
Apr-Jun 15
Jul- Sep 15
Oct-Dec 15
Jan-Mar 16
Apr-Jun 16
Jul -Sep 16
Oct-Dec 16
Jan- Mar 17
2016/17 SAB RATE LOCAL/NATIONAL TRAJECTORY BY QUARTER by 1000aobd
LOCAL RATE
NAT TRAJECTORY 0.24
LOCAL TRAJECTORY 0.12
interventions accordingly.
Ongoing testing of new combined PVC insertion and maintenance bundle
Development and testing of Arterial line maintenance bundle in Critical Care. Contaminated samples
Blood Culture collection system to reduce risk of contaminants.
Heather Gourlay- Senior Manager Prevention and Control of Infection Sandra McAuley- Clinical Nurse Manager Prevention and Control of Infection Date 20/04/17
Page 4 of 18
0
1
2
3
4
5
AR
TE
RIA
L LI
NE
IAB
P
CH
ES
T D
RA
IN
PV
C
MU
LTIP
LE
SO
UR
CE
PE
RIC
AR
DIA
L
FLU
ID
CO
UN
T
SOURCE OF SAB
HOSPITAL ACQUIRED SAB SOURCES
April 16- March 17
0
1
2
3
4
5
6
7
SAB
Area
S.aureus BACTERAEMIA (SAB) BY AREAApril 16- March 17
3 EAST Jul 16- Chest drain site Sept 16- Art line Oct 16- Pericardial fluid Mar 17- x2 PVC/Multiple sources x1
ICU2 Jun 16- Art line
CCU Jan 17 – IABP

Heather Gourlay- Senior Manager Prevention and Control of Infection Sandra McAuley- Clinical Nurse Manager Prevention and Control of Infection Date 20/04/17
Page 5 of 18
In comparison to 2015/16 data, the sources of SAB have changed and whilst sustained compliance with IABP bundles has to be achieved there is a clear reduction of IABP related SAB. This year, arterial line bundles have been developed by Critical Care and the arterial line policy has been updated in response to arterial line related SAB. Our work plan for the first quarter of 17/18 will focus on PVC maintenance bundle compliance in 3 East.
0
1
2
3
4
5
IAB
P
PV
C
SW
AN
GA
NZ
SS
I
AR
TE
RIA
L LI
NE
CH
ES
T D
RA
IN
COUNT
SOURCE OF SAB
HOSPITAL ACQUIRED SAB SOURCES April 15- Mar 16
IABP
PVC
SWAN GANZ
SSI
ARTERIAL LINE
CHEST DRAIN
0
1
2
3
4
SAB
Area
S.aureus bacteraemias (SAB) by area April 15 - Mar 16

Heather Gourlay- Senior Manager Prevention and Control of Infection Sandra McAuley- Clinical Nurse Manager Prevention and Control of Infection Date 20/04/17
Page 6 of 18
Clostridium difficile
CDI LDP Heat Delivery Trajectories Boards are again expected to achieve a rolling trajectory of 0.32 cases CDI per 1,000 occupied bed days by year ending March 2017. This relates to people aged 15 and over. Boards currently with a rate of less than 0.32 will be expected to at least maintain this, as reflected in their trajectories. The CDI HEAT target has been achieved but awaits HPS validation. Overall Apr 16- Mar 17 rate 0.02 per 1000 occupied bed days still well below the national target. Our local rate Jan- Mar 17 is 0.09 per 1000 occupied bed days (n=1 case).
This has been the first case noted since March 2014. No risk factors other than age, justified use of prophylaxis and use of proton pump inhibiters were noted. No cross contamination noted. C. difficile bacteria are found in the digestive system of about 1 in every 30 healthy adults. The bacteria often live harmlessly because the other bacteria normally found in the bowel keep it under control. However, some antibiotics and drugs can interfere with the balance of bacteria in the bowel, which can cause the C. difficile bacteria to multiply and produce toxins that make the person ill.
GJNH approach to CDI prevention and reduction
Our numbers of CDI cases are low in comparison with other Boards, which is likely to relate to our specialist patient population. We have had no identified cases since March 2014 Actions to reduce CDI-
Ongoing alert organism surveillance and close monitoring of the severity of cases by the PCIT.
Unit specific reporting and triggers.
Implementation of HPS Trigger Tool if trigger is breached.
Implementation of HPS Severe Case Investigation Tool if the case definition is met
Typing of isolates when two or more cases occur within 30 days in one unit.
Clostridium difficile is an organism which is responsible for a large number of healthcare associated infections, although it can also cause infections in people who have not had any recent contact with the healthcare system. More information can be found at:
http://www.nhs.uk/conditions/Clostridium-difficile/Pages/Introduction.aspx
NHS Boards carry out surveillance of Clostridium difficile infections (CDI), and there is a national target to reduce these. The number of patients with CDI for the Board can be found at the end of section 1 and for each hospital in section 2. Information on the national surveillance programme for Clostridium difficile infections can be found at:
http://www.hps.scot.nhs.uk/haiic/sshaip/ssdetail.aspx?id=277

Heather Gourlay- Senior Manager Prevention and Control of Infection Sandra McAuley- Clinical Nurse Manager Prevention and Control of Infection Date 20/04/17
Page 7 of 18
Hand Hygiene
0.00 0.00 0.00 0.00 0.00 0.00 0.00 0.00 0.00 0.00 0.00
0.09
0.00
0.05
0.10
0.15
0.20
0.25
0.30
0.35
Apr-Jun 14
Jul-Sep 14
Oct-Dec 14
Jan-Mar 15
Apr-Jun 15
Jul-Sep 15
Oct-Dec 15
Jan-Mar 16
Apr- Jun 16
Jul- Sept 16
Oct- Dec 16
Jan-Mar 17
CD
I RA
TE2016/17 CDI RATE LOCAL/NATIONAL TRAJECTORY by QUARTER & 1000 aobd
LOCAL RATE
NAT TRAJECTORY
Good hand hygiene by staff, patients and visitors is a key way to prevent the spread of infections. More information on the importance of good hand hygiene can be found at:
http://www.washyourhandsofthem.com/
NHS Boards monitor hand hygiene and ensure a zero tolerance approach to non compliance. The hand hygiene compliance score for the Board can be found at the end of section 1 and for each hospital in section 2. Information on national hand hygiene monitoring can be found at:
http://www.hps.scot.nhs.uk/haiic/ic/nationalhandhygienecampaign.aspx
GJNH approach to Hand Hygiene
The bimonthly report from March is demonstrates a Board compliance rate of 99%.

Heather Gourlay- Senior Manager Prevention and Control of Infection Sandra McAuley- Clinical Nurse Manager Prevention and Control of Infection Date 20/04/17
Page 8 of 18
March 2017 Bi Monthly Hand Hygiene Audit
AREA AUDITED COMPLIANCE
2 EAST 95%
HDU 3 95%
TH 15 95%
PACU 100%
2C 100%
CCU 100%
3 EAST 100%
NSD 100%
ICU 2 100%
3 WEST 100%
ICU 1 100%
2D 100%
TH 2 100%
TH 16 100%
TH 9 100%
95% Compliance or above
80% - 94% Compliance
Below 70% Compliance
AREA STAFF GROUP KEY MOMENT OPPORTUNITY TAKEN
CORRECT TECHNIQUE
HDU 3 NURSE 2 NO NA
2 EAST NURSE 5 YES NO
TH15 DOCTOR 2 YES NO
Key Moments
1 Before patient contact
2 Before aseptic task
3 After body fluid exposure risk
4 After patient contact
5 After contact with patient surroundings
Actions Taken
All non compliant staff were alerted to the non compliance and reminded of the importance of adhering to Standard Infection Control Precautions
Heather Gourlay- Senior Manager Prevention and Control of Infection Sandra McAuley- Clinical Nurse Manager Prevention and Control of Infection Date 20/04/17
Page 9 of 18
70%
75%
80%
85%
90%
95%
100%
Mar-
14
May-1
4
Jul-14
Sep
-14
No
v-1
4
Jan-1
5
Mar-
15
May-1
5
Jul-15
Sep
-15
No
v-1
5
Jan-1
6
Mar-
16
May-1
6
Jul-16
Sep
-16
No
v-1
6
Jan-1
7
Mar-
17
Co
mp
lian
ce%
Audit Dates
Mar-14
May-14
Jul-14
Sep-14
Nov-14
Jan-15
Mar-15
May-15
Jul-15
Sep-15
Nov-15
Feb-16
Mar-16
May-16
Jul-16
Sep-16
Nov-16
Jan-17
Mar-17
Nurse 99% 95% 99% 99% 98% 99% 99% 99% 100%100% 99% 100% 99% 99% 100% 98% 100%100% 99%
Medical 95% 100% 99% 98% 96% 100% 98% 94% 99% 99% 96% 100% 89% 95% 97% 88% 96% 97% 100%
AHP 96% 100% 99% 97% 92% 98% 97% 98% 97% 100% 97% 100%100% 95% 96% 100%100% 97% 100%
Ancilliary/Other 100%100% 94% 100%100%100%100%100%100% 88% 100%100%100%100%100%100% 95% 93% 100%
HH "Opportunity Taken" Compliance Board Level
Nurse
Medical
AHP
Ancilliary/Other
40%
50%
60%
70%
80%
90%
100%
Co
mp
lian
ce
Audit Dates
Mar-14
May-14
Jul-14
Sep-14
Nov-14
Jan-15
Mar-15
May-15
Jul-15
Sep-15
Nov-15
Feb-16
Mar-16
May-16
Jul-16
Sep-16
Nov-16
Jan-17
Mar-17
Nurse 100% 95% 99% 99% 98% 98% 98% 99% 100%100% 99% 100% 99% 99% 100% 99% 100% 99% 99%
Medical 100%100% 96% 98% 96% 99% 95% 94% 99% 99% 96% 100% 89% 93% 92% 82% 96% 97% 99%
AHP 100% 97% 95% 97% 92% 100% 97% 98% 97% 100% 97% 100%100% 92% 96% 97% 100% 97% 100%
Ancilliary/Other 100%100% 94% 100%100% 91% 100%100%100% 88% 100%100%100%100%100%100% 95% 93% 100%
HH " Correct Technique" Compliance Board Level
Nurse
Medical
AHP
Ancilliary/Other

Heather Gourlay- Senior Manager Prevention and Control of Infection Sandra McAuley- Clinical Nurse Manager Prevention and Control of Infection Date 20/04/17
Page 10 of 18
2016/ 17 Hand Hygiene Compliance The data below demonstrates compliance with hand
hygiene by staff group throughout 2016/17. With the exception of September data, all staff groups are above the national 90% target. No trends were noted in the type of missed opportunities (5 Key Moments).
84%
85%
86%
87%
88%
89%
90%
91%
92%
93%
94%
95%
96%
97%
98%
99%
100%
Co
mb
ined
Sco
re %
Audit Dates
Mar-14May-14Jul-14Sep-14Nov-14Jan-15Mar-15May-15Jul-15Sep-15Nov-15Feb-16Mar-16May-16Jul-16Sep-16Nov-16Jan-17Mar-17
Series1 98% 97% 97% 99% 97% 97% 97% 97% 99% 99% 98% 100% 97% 97% 98% 96% 99% 98% 99%
HH Combined (Opportunity and Technique)Score
Series1
80%
82%
84%
86%
88%
90%
92%
94%
96%
98%
100%
% C
om
plia
nce
Month
Hand Hygine Compliance by Staff Group 16/17
Nurse
Medical
AHP
Ancilliary/Other
National Target
Action taken by Medical Director to address

Heather Gourlay- Senior Manager Prevention and Control of Infection Sandra McAuley- Clinical Nurse Manager Prevention and Control of Infection Date 20/04/17
Page 11 of 18
Cleaning and Maintaining the Healthcare Environment
Housekeeping FMT Audit Results
Cleaning services continue to be monitored against the NHSScotland National Cleaning Service Specifications (NCSS) using the HFS Domestic monitoring tool. All healthcare facilities and component parts, e.g. wards, treatment rooms, corridors etc, are expected to be at least 90% compliant with the requirements set out in the NCSS.
NHS SCOTLAND National Cleaning Services Specification The revised NCSS has been published following testing within several boards. An implementation strategy was developed to assist boards introduce the revised NCSS where they felt their current process was inadequate. Following a review of our current practice and associated schedule linked to our FM performance, the PCIC has supported continuation with our existing work schedule at this time, supported by a local risk assessment.
HDU2 HDU3
Operating
Theatres 2 East 2 West 3 East 3 West 4 West CDUSDU
(prev HDU1)
CCU
2C&D
(prev .
CCU 1/2) ICU 1 ICU 2 NSU
Theatre
Recovery
Theatres +
Cath Lab
Mar-16 99.02 99.80 99.48 98.05 96.49 98.53 98.06 99.72 99.80 99.14 99.02 98.65 98.31 98.92 99.56
Apr-16 99.23 99.47 100.00 96.56 96.55 98.81 99.57 98.42 99.77 99.43 99.40 98.20 98.96 98.75 99.19
May-16 100.00 99.76 99.48 98.24 96.49 99.71 99.71 99.16 99.48 99.13 97.69 100.00 98.82 98.88 99.05
Jun-16 99.54 99.48 96.35 98.42 99.12 99.18 99.35 99.15 99.54 97.92 98.15 98.05 98.43 98.66 98.81
Jul-16 98.52 99.39 99.48 97.97 98.94 99.68 99.08 99.45 99.25 97.55 99.29 98.98 100.00 97.99 100.00
Aug-16 98.14 98.96 99.36 97.42 98.41 98.35 98.80 98.84 98.94 97.08 98.41 96.27 98.92 100.00 100.00
Sep-16 97.24 97.82 98.44 98.55 98.87 97.62 97.95 96.56 98.24 97.99 97.63 98.93 97.60 100.00 98.76
Oct-16 96.56 99.28 98.44 99.29 99.31 99.31 98.59 96.61 98.38 98.41 98.32 98.67 97.92 97.51 99.52
Nov-16 98.33 98.51 99.48 98.56 98.27 99.41 98.32 99.16 99.57 99.15 98.67 97.85 97.30 94.64 100.00
Dec-16 98.42 99.46 98.96 98.79 96.15 98.29 98.83 98.65 98.31 98.52 98.31 98.36 99.29 98.69 100.00
Jan-17 98.75 100.00 99.31 99.26 98.53 98.87 99.20 99.11 99.10 99.21 98.70 98.97 96.49 100.00 100.00
Feb-17 98.58 97.07 95.83 97.09 98.21 98.49 98.93 98.57 99.12 97.64 96.89 96.20 96.39 98.90 97.49
Mar-17 98.96 98.41 99.48 97.02 93.23 98.32 98.56 99.43 99.58 98.06 99.38 99.53 97.70 100.00 100.00
HOUSEKEEPING FMT AUDIT RESULTS
80.00
82.00
84.00
86.00
88.00
90.00
92.00
94.00
96.00
98.00
100.00
HDU2 HDU3 Operating Theatres
2 East 2 West 3 East 3 West 4 West CDU SDU(prev
HDU1)
CCU 2C&D(prev.
CCU 1/2)
ICU 1 ICU 2 NSU Theatre Recovery
Theatres + Cath Lab
Oct-16
Nov-16
Dec-16
Jan-17
Feb-17
Mar-17

Heather Gourlay- Senior Manager Prevention and Control of Infection Sandra McAuley- Clinical Nurse Manager Prevention and Control of Infection Date 20/04/17
Page 12 of 18
Other HAI Related Activity
MRSA Screening Compliance
Long Term Patient Screening
o All patients should be rescreened on Day 10 and weekly thereafter.
o Day 10 screen was identified as the initial screen date as it captures patient stay beyond routine pathways
o Compliance is monitored via reviewing a sample of eligible patients against submitted MRSA screens.
o SCNs are informed of results at the time of audit and action plan required to improve compliance
March Data
Staff in 2 West have increased awareness of the use of Wardwatcher and included this issue within the safety brief.
2016/ 17 Data Overview
Mar-17 3WEST 3EAST 2C 2D CCU NSD ICU2 ICU1 HDU2 HDU3 2EAST 2WEST
SAMPLE SIZE 11 27 7 2 8 6 5 2 7 CLOSED 16 20
ADMIT COMPLIANCE 100% 100% 100% 100% 100% 100% 100% 100% 100% NA 100% 100%
SAMPLE SIZE 1 8 4 2 1 5
10 DAY COMPLIANCE 100% 100% 100% 100% 100% 0%
SAMPLE SIZE 1 1 4 1
7 DAY COMPLIANCE 100% 100% 100% 100%
MRSA SCREENING COMPLIANCE APR 16 - MAR 17
3 WEST 3 EAST 2C 2D CCU NSD ICU 1 ICU 2 HDU 2 HDU 3 2 EAST 2 WEST
ADMIT SCREEN 99% (n=186) 99% (n= 252) 99% (n=70) 100% (n= 48) 100% (n=61) 99% (n = 71) 97% (n =38) 97% (n = 67) 98% ( n = 45) 100% ( n = 45) 99% ( n = 251) 99% ( n = 259)
10 DAY SCREEN 96% (n=28) 85% (n= 40) NA NA NA 87% (n = 23) 0% (n = 1) 91% (n = 23) 75% ( n = 4) 50% (n = 4) 75% (n = 16) 58% (n = 25)
7 DAY SCREEN 94% (n=17) 77% (n= 13) NA NA NA 77% (n =22) NA 89% ( n = 18) 100% (n = 2) 67% ( n = 6) 64% ( n = 14) 82% ( n = 11)

Heather Gourlay- Senior Manager Prevention and Control of Infection Sandra McAuley- Clinical Nurse Manager Prevention and Control of Infection Date 20/04/17
Page 13 of 18
Admission screening compliance has sustained reliability. Variation does exists when reviewing compliance with 10 and 7 day long term screens, however caution should be taken given the low denominators in some areas e.g. ICU1. In comparison to 2015/17 data there is an overall improvement NSD/ICU2 and HDU2. To improve compliance throughout 16/17, the team arranged a focus group to identify barriers to screening and made refinements on Wardview to clearly identify to staff when screens are due.

Heather Gourlay- Senior Manager Prevention and Control of Infection Sandra McAuley- Clinical Nurse Manager Prevention and Control of Infection Date 20/04/17
Page 14 of 18
Healthcare Associated Infection Reporting Template (HAIRT)
Section 2 – Healthcare Associated Infection Report Cards
The following section is a series of ‘Report Cards’ that provide information, for each acute hospital and key community hospitals in the Board, on the number of cases of Staphylococcus aureus blood stream infections (also broken down into MSSA and MRSA) and Clostridium difficile infections, as well as hand hygiene and cleaning compliance. In addition, there is a single report card which covers all community hospitals [which do not have individual cards], and a report which covers infections identified as having been contracted from outwith hospital. The information in the report cards is provisional local data, and may differ from the national surveillance reports carried out by Health Protection Scotland and Health Facilities Scotland. The national reports are official statistics which undergo rigorous validation, which means final national figures may differ from those reported here. However, these reports aim to provide more detailed and up to date information on HAI activities at local level than is possible to provide through the national statistics. Understanding the Report Cards – Infection Case Numbers Clostridium difficile infections (CDI) and Staphylococcus aureus bacteraemia (SAB) cases are presented for each hospital, broken down by month. Staphylococcus aureus bacteraemia (SAB) cases are further broken down into Meticillin Sensitive Staphylococcus aureus (MSSA) and Meticillin Resistant Staphylococcus aureus (MRSA). More information on these organisms can be found on the NHS24 website: Clostridium difficile : http://www.nhs24.com/content/default.asp?page=s5_4&articleID=2139§ionID=1 Staphylococcus aureus : http://www.nhs24.com/content/default.asp?page=s5_4&articleID=346 MRSA: http://www.nhs24.com/content/default.asp?page=s5_4&articleID=252§ionID=1 For each hospital the total number of cases for each month are those which have been reported as positive from a laboratory report on samples taken more than 48 hours after admission. For the purposes of these reports, positive samples taken from patients within 48 hours of admission will be considered to be confirmation that the infection was contracted prior to hospital admission and will be shown in the “out of hospital” report card. Targets There are national targets associated with reductions in C. difficile and SABs. More information on these can be found on the Scotland Performs website: http://www.scotland.gov.uk/About/Performance/scotPerforms/partnerstories/NHSScotlandperformance Understanding the Report Cards – Hand Hygiene Compliance Hospitals carry out regular audits of how well their staff are complying with hand hygiene. Each hospital report card presents the combined percentage of hand hygiene compliance with both opportunity taken and technique used broken down by staff group. Understanding the Report Cards – Cleaning Compliance Hospitals strive to keep the care environment as clean as possible. This is monitored through cleaning and estates compliance audits. More information on how hospitals carry out these audits can be found on the Health Facilities Scotland website: http://www.hfs.scot.nhs.uk/online-services/publications/hai/ Understanding the Report Cards – ‘Out of Hospital Infections’ Clostridium difficile infections and Staphylococcus aureus (including MRSA) bacteraemia cases are all associated with being treated in hospitals. However, this is not the only place a patient may contract an infection. This total will also include infection from community sources such as GP surgeries and care homes. The final Report Card report in this section covers ‘Out of Hospital Infections’ and reports on SAB and CDI cases reported to a Health Board which are not attributable to a hospital.

Heather Gourlay- Senior Manager Prevention and Control of Infection Sandra McAuley- Clinical Nurse Manager Prevention and Control of Infection Date 20/04/17
Page 15 of 18
NHS BOARD REPORT CARD
Staphylococcus aureus bacteraemia monthly case numbers
Apr
16
May
16
June
16
July
16
Aug
16
Sept
16
Oct
16
Nov
16
Dec
16
Jan
17
Feb
17
Mar
17
MRSA 0 0 0 0 0 0 0 0 0 0 0 0
MSSA 0 0 1 1 0 1 1 0 0 1 0 3
Total
SABS
0 0 1 1 0 1 1 0 0 1 0 3
Clostridium difficile infection monthly case numbers
Apr
16
May
16
June
16
July
16
Aug
16
Sept
16
Oct
16
Nov
16
Dec
16
Jan
17
Feb
17
Mar
17
Ages15-64 0 0 0 0 0 0 0 0 0 0 0 0
Ages 65+ 0 0 0 0 0 0 0 0 0 0 0 1
Ages 15 + 0 0 0 0 0 0 0 0 0 0 0 0
Hand Hygiene Monitoring Compliance (%)
Apr
16
May
16
June
16
July
16
Aug
16
Sept
16
Oct
16
Nov
16
Dec
16
Jan
17
Feb
17
Mar
17
AHP 92 96 97 100% 97% 100%
Ancillary 100 100 100 95% 93% 100%
Medical 93 92 86 96% 97% 99%
Nurse 99 100 99 100% 99% 99%
Board Total 97 98 96 99 98 99%
Cleaning Compliance (%)
Apr
16
May 16
June 16
July
16
Aug
16
Sept
16
Oct
16
Nov
16
Dec
16
Jan
17
Feb
17
Mar
17
Board Total 98.79 99.05 97.94 99.04 98.46 98.16 98.27 98.48 98.5 99.05 97.65 98.61
Estates Monitoring Compliance (%)
Apr
16
May
16
June
16
July
16
Aug
16
Sept
16
Oct
16
Nov
16
Dec
16
Jan
17
Feb
17
Mar
17
Board Total 98.95 98.97 99.6 99.36 98.55 98.62 99.44 98.77 98.77 99.5 98.75 99.34

Heather Gourlay- Senior Manager Prevention and Control of Infection Sandra McAuley- Clinical Nurse Manager Prevention and Control of Infection Date 20/04/17
Page 16 of 18
Surgical Site Surveillance
CABG and CABG +/- Valve SSI Local Data
*A surgical site infection is defined a superficial, deep or organ space infection occurring within 30 days of operation. Definitions of superficial, deep
and organ space are defined in Health Protection Scotland Surgical Site Infection Surveillance Protocol.
-1%0%1%2%3%4%5%6%7%8%9%
10%
CABG- Monthly Surgical Site Infection Rates
SURGICAL SITE INFECTION RATE
CENTRE LINE
UPPER CONTROL LIMIT
HPA 2010-2015 ( INPATIENT AND READMISSION)
-1%0%1%2%3%4%5%6%7%8%9%
10%11%12%
Valve Replacement +/- CABG Surgery- Monthly Surgical Site Infection Rates
SURGICAL SITE INFECTION RATE
CENTRE LINE
UPPER CONTROL LIMIT
HPA Rate 2010-2015
CABG Jun 16- 1 Deep Sternum Jul 16- I Sup Sternum Sept 16- 3 Sup Sternum Oct 16- 1 Organ Space Dec 16 – 2 Superficial Sternum Jan 17 – 2 Superficial Sternum Feb 17- 2 Superficial Sternum Mar 17-2 Superficial Sternum 1 Superficial Leg
Valve +/- CABG Jun 16- 1 Deep Sternum 1 Superficial Sternum Nov16- 1 Superficial Sternum Dec 16 – 2 Deep Sternum Jan 17 – 4 Superficial Sternum Feb 17- 2 Superficial Sternum
Mar 17- 1 Superficial Sternum

Heather Gourlay- Senior Manager Prevention and Control of Infection Sandra McAuley- Clinical Nurse Manager Prevention and Control of Infection Date 20/04/17
Page 17 of 18
Orthopaedic SSI Local data Infection rates remain below the upper control limit
*A surgical site infection is defined a superficial, deep or organ space infection occurring within 30 days of operation. Definitions of superficial, deep
and organ space are defined in Health Protection Scotland Surgical Site Infection Surveillance Protocol.
-0.1%
0.1%
0.3%
0.5%
0.7%
0.9%
1.1%
1.3%
1.5%
Hip Replacement - Monthly Surgical Site Infection Rates
SURGICAL SITE INFECTION RATE
CENTRE LINE
UPPER CONTROL LIMIT
-0.1%
0.1%
0.3%
0.5%
0.7%
0.9%
1.1%
Knee Replacement- Monthly Surgical Site Infection Rates
SURGICAL SITE INFECTION RATE
CENTRE LINE
UPPER CONTROL LIMIT
THR Jun 16- 1 Deep infection Aug 16- Superficial Infection

Heather Gourlay- Senior Manager Prevention and Control of Infection Sandra McAuley- Clinical Nurse Manager Prevention and Control of Infection Date 20/04/17
Page 18 of 18
HAIRT Table of Abbreviations
AHP Allied Healthcare Practitioner
CABG Coronary Artery Bypass Graft
CCU Coronary Care Unit
CDI/C.difficile Clostridium Difficile Infection
CVC Central Venous Catheter
DMT Domestic Monitoring Tool
E.coli Escherichia coli
FMT Facilities Monitoring Tool
GJNH Golden Jubilee National Hospital
GP General Practitioner
HAI Healthcare Associated Infection
HAIRT Healthcare Associated Infection Report Template
HA MRSA Hospital Acquired Meticillin Resistant Staphylococcus aureus
HEI Healthcare Environment Inspection
HFS Healthcare Facilities Scotland
HH Hand Hygiene
HIS Healthcare Improvement Scotland
HPA Health Protection Agency
HPS Health Protection Scotland
IABP Intra aortic balloon pump
IC Infection Control
ICAR Infection Control Audit Review
Lan Qip Lanarkshire Quality Improvement Programme
LDP Local Delivery Plan
MRSA Meticillin Resistant Staphylococcus Aureus
MSSA Meticillin Sensitive Staphylococcus Aureus
NAT National
NCSS National Cleaning Standard Specification
PAG Problem Assessment Group
PCIC Prevention & Control of Infection Committee
PCINs Prevention & Control of Infection Nurses
PCIT Prevention & Control of Infection Team
PICC Line Peripherally inserted central catheter line
PNE Patient Notification Exercise
PVC Peripheral Venous Cannula
SAB Staphylococcus aureus bacteraemia
SCN Senior Charge Nurse
SICP s Standard Infection Control Precautions
SPSP Scottish Patient Safety Programme
SSI Surgical Site Infection
TBPs Transmission Based Precautions
THR Total Hip Replacement
VAP Ventilator Associated Pneumonia