healthcare associated objectives infections (hai): rates · hai infection rates 1 healthcare...
TRANSCRIPT

HAI Infection Rates
1
Healthcare Associated Infections (HAI):
Rates
Healthcare Associated Infections (HAI):
RatesInfectious Disease Epidemiology Section
Office of Public HealthLouisiana Department of Health
504-568-8313 *** 800-256-2748www.infectiousdisease.dhh.louisiana.gov
Your taxes at work
HAI RatesObjectives
• Describe methods used to calculate HAI rates and select the most appropriate method for each type of HAI
• Understand the importance of producing data taking into account the severity of patient’s condition and the complexity of the intervention to allow meaningful comparisons
• Collect appropriate numerators and denominators for rate calculation
Rates: Numerators
Number of infections
Number of patients infected
• Note: Infections caused by multiple organisms of similar
origin at the same site = single infection
In a patient with a previously established nosocomial infection, a second nosocomial infectionshould be recorded in two situations:
1. the appearance of clinical infection at a new and different site
2. the appearance in culture of new and different organisms if deterioration in patient's condition
Rates: Denominators
• Number of patients admitted (or discharged)
• Number of hospital days
• Number of device days

HAI Infection Rates
2
Hospital Wide Rates
• Hospital wide nosocomial infection rate /100 Admissions for a given period: month, quarter, year.
= Number of nosocomial infections *100Number of patients admitted
In this rate a patient with 2 infections is counted twice
• Hospital wide patient infected rate /100 Admissions for a given period: month, quarter, year
= Number of patients infected *100Number of patients admitted
In this rate a patient with 2 infections is counted only once
Ward Specific Rates
• Rate of infection /1,000 HD= Number of infections *1000
Number of hospital days
• Rate of Patients infected /1,000 HD= Number of patients infected *1,000
Number of hospital days
Ward Ward WardICU ICU
Device Specific Rates, Procedure Specific Rates
• Surgical Site Infection rate:= Number of surgical site infections *100
Number of patients operated on
• Ventilator Associated Pneumonia rate:= Number of ventilator associated pneumonia *1,000
Number of patients on ventilator-days
• Catheter Related Blood Stream Infection rate:= Number of Catheter related BSI *100
Number of patients on IV line-days
How To Calculate A Device-Associated Infection Rate
• Step 1: Decide on the time period for analysis: month, quarter, 6 months, year
• Step 2: Select patient population for analysis (stratum), example: type of ICU or birthweight category
• Step 3: Select infections to be used in numerator• must be site-specific • must have occurred in selected patient population• date of onset must be during the selected time period

HAI Infection Rates
3
How To Calculate A Device-Associated Infection Rate cont.
• Step 4: Determine number of device-days used as denominator
Device-days = total number of days of exposure to device (central line, ventilator, or urinary catheter) by all patients in selected population during selected time period
• Step 5: Calculate device-associated infection rate (per 1000 device-days) using the formula:
Device-associated infection rate = Number of device-associated infections for specific site * 1000
Number of device-days
Utilization Rate
• The Device Utilization Rate (DUR) is the proportion of patient days for which a certain device is used
• DUR are specific to a certain device: catheter, IV line, ventilator
• DUR reflects the amount of devices used and is a reflection of the patient severity
= Number of Device Days *100Number of Patient Days
How to Calculate a Device Utilization Ratio
• Step 1: Decide on the time period for analysis: month, quarter, 6 months, year
• Step 2: Select patient population for analysis, ie, type of ICU or a birthweight category
• Step 3: Determine the number of device-days used as a numerator
Device-days = total number of days of exposure to the device (central line, ventilator, or urinary catheter) by all patients in the selected population during the selected time period
Note: Step 3 is the same as Step 4 in the device-day but here it is used as a numerator
Device Utilization Ratio cont.
• Step 4: Determine the number of patient-days which is used as denominator of DU ratio
Patient-days = total number of days that patients are in the ICU during selected time period
• Step 5: Calculate the DU ratio with the following formula:DU ratio = Number of device-days
Number of patient-days
Example DU = 28/72 = 0.39 or 39% of patient-days were also central line-days for the first week of the month
HAI Infection Rates
4
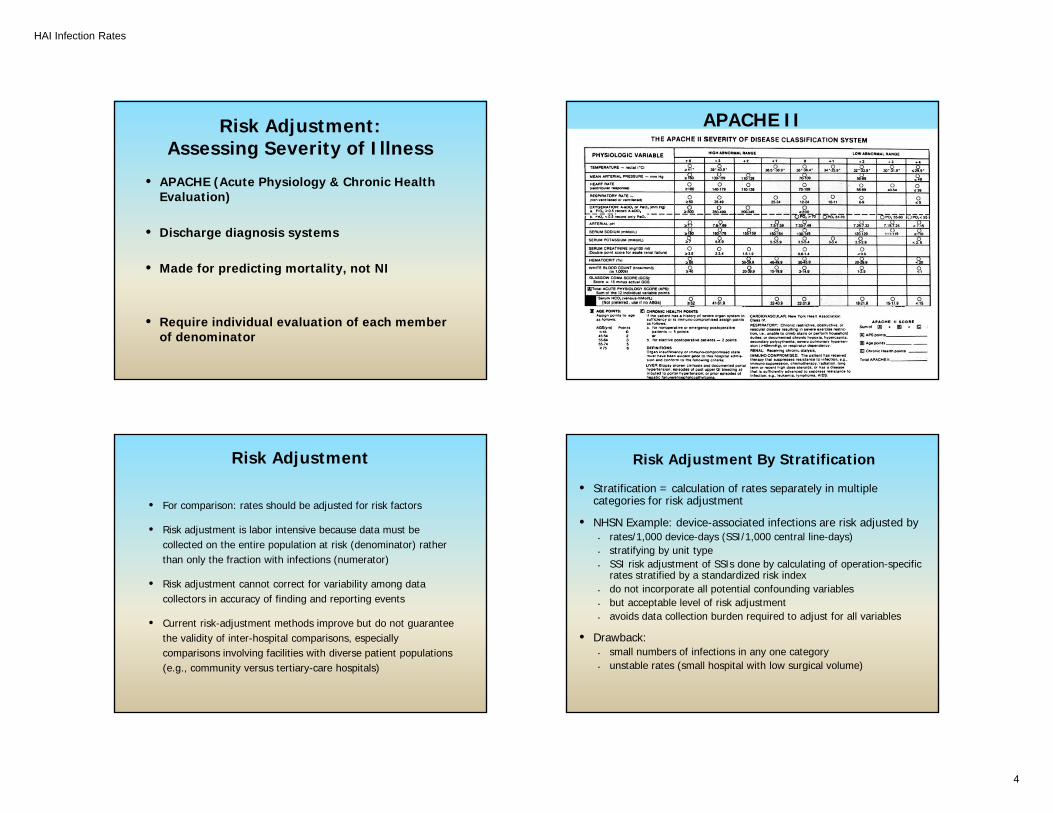
Risk Adjustment: Assessing Severity of Illness
• APACHE (Acute Physiology & Chronic Health Evaluation)
• Discharge diagnosis systems
• Made for predicting mortality, not NI
• Require individual evaluation of each member of denominator
APACHE II
Risk Adjustment
• For comparison: rates should be adjusted for risk factors
• Risk adjustment is labor intensive because data must be collected on the entire population at risk (denominator) rather than only the fraction with infections (numerator)
• Risk adjustment cannot correct for variability among data collectors in accuracy of finding and reporting events
• Current risk-adjustment methods improve but do not guarantee the validity of inter-hospital comparisons, especially comparisons involving facilities with diverse patient populations (e.g., community versus tertiary-care hospitals)
Risk Adjustment By Stratification
• Stratification = calculation of rates separately in multiple categories for risk adjustment
• NHSN Example: device-associated infections are risk adjusted by • rates/1,000 device-days (SSI/1,000 central line-days) • stratifying by unit type • SSI risk adjustment of SSIs done by calculating of operation-specific
rates stratified by a standardized risk index• do not incorporate all potential confounding variables• but acceptable level of risk adjustment • avoids data collection burden required to adjust for all variables
• Drawback:• small numbers of infections in any one category• unstable rates (small hospital with low surgical volume)

HAI Infection Rates
5
Percentiles
• Step 1: Evaluate the rate (ratio) calculated for the hospital and confirm that variables in the rate (both numerator and denominator) are identical to the rates (ratios) in the Table.
• Step 2: Examine the percentiles in each of the Tables and look for the 50th percentile (or median).
- At the 50th percentile, 50% of the hospitals have lower rates (ratios) than the median, and 50% have higher rates (ratios).
• Step 3: Determine whether the hospital’s rate (ratio) is above or below this median.
Percentiles
• Step 4: If the hospital’s rate or ratio is > median, determine where rate the (ratio) falls: between 50th
and 75th, 75th and 90th or >90th.
• Step 5: Do the same if the hospital rate (ratio) is< median.
Percentiles Percentiles• If the ratio is above the 90th percentile, it is a high outlier • It may be due to:
• True excess of HAI• Excess infections due to misclassification: including
colonization for example• Underestimation of denominators: low device days
Prevent miscalculations:
1-Follow definitions
2-Check risk factors and strata
3-Check device-days
HAI Infection Rates
6
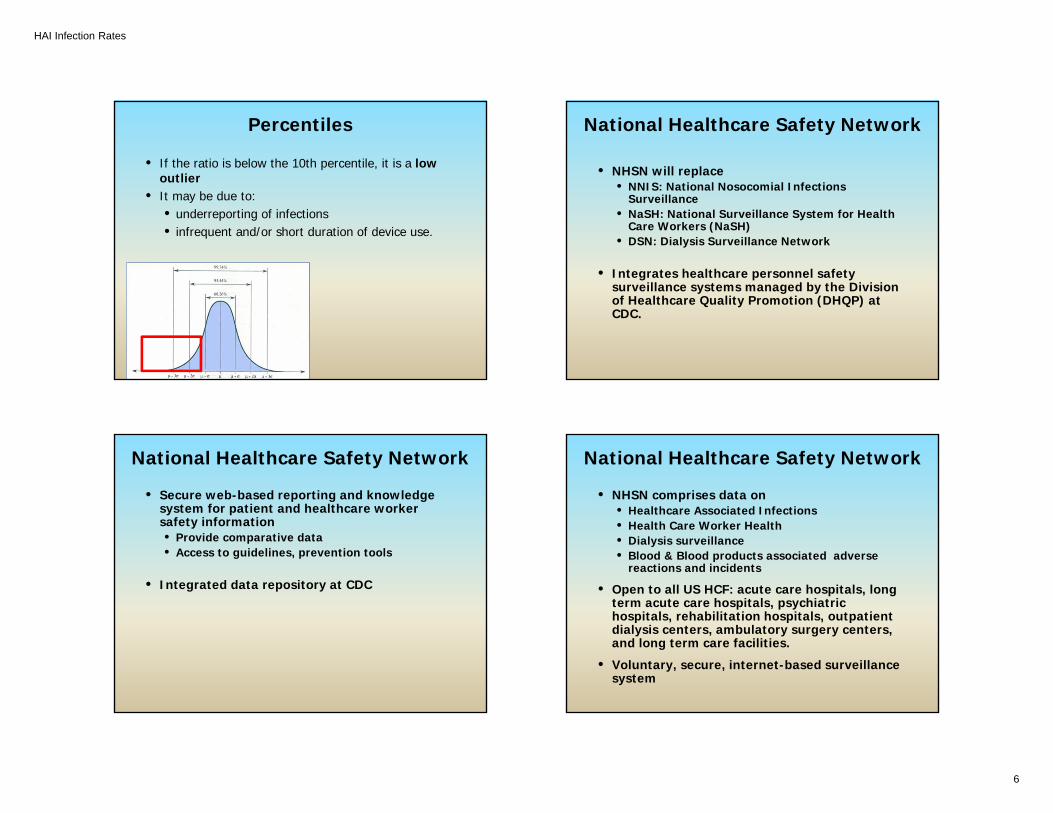
Percentiles
• If the ratio is below the 10th percentile, it is a low outlier
• It may be due to:• underreporting of infections• infrequent and/or short duration of device use.
National Healthcare Safety Network
• NHSN will replace • NNIS: National Nosocomial Infections
Surveillance • NaSH: National Surveillance System for Health
Care Workers (NaSH)• DSN: Dialysis Surveillance Network
• Integrates healthcare personnel safety surveillance systems managed by the Division of Healthcare Quality Promotion (DHQP) at CDC.
National Healthcare Safety Network
• Secure web-based reporting and knowledge system for patient and healthcare worker safety information• Provide comparative data• Access to guidelines, prevention tools
• Integrated data repository at CDC
National Healthcare Safety Network
• NHSN comprises data on• Healthcare Associated Infections• Health Care Worker Health• Dialysis surveillance• Blood & Blood products associated adverse
reactions and incidents
• Open to all US HCF: acute care hospitals, long term acute care hospitals, psychiatric hospitals, rehabilitation hospitals, outpatient dialysis centers, ambulatory surgery centers, and long term care facilities.
• Voluntary, secure, internet-based surveillance system
HAI Infection Rates
7
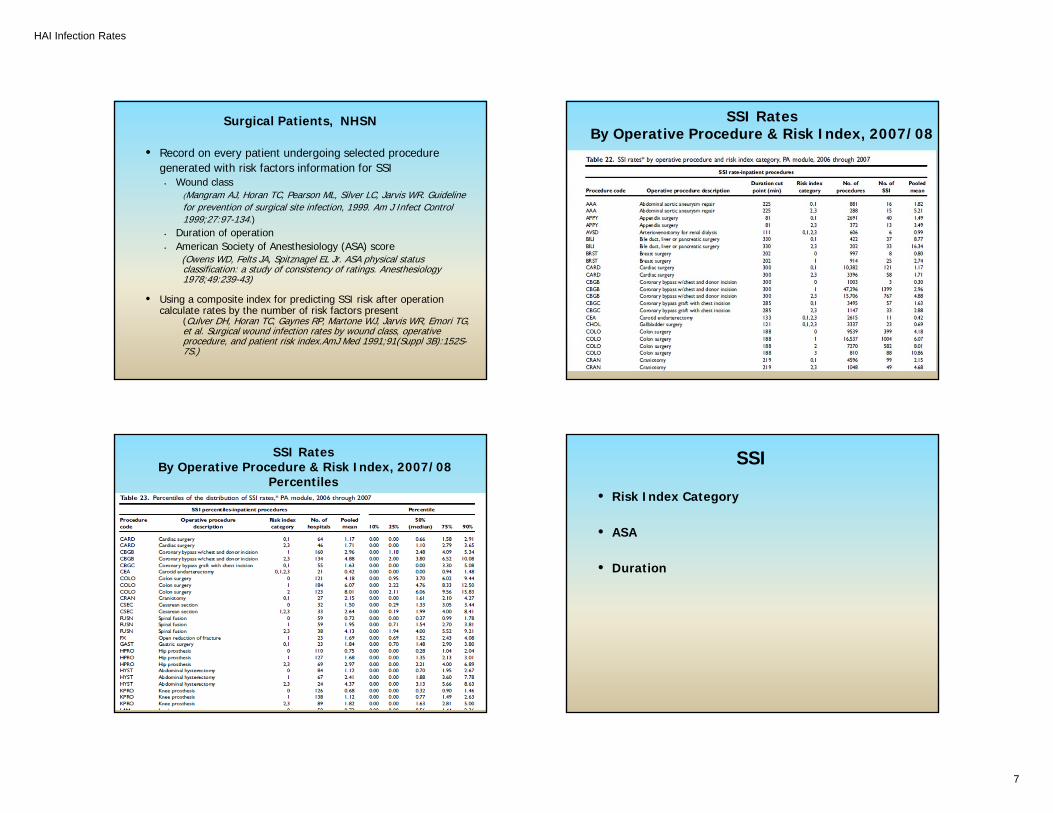
Surgical Patients, NHSN
• Record on every patient undergoing selected proceduregenerated with risk factors information for SSI
• Wound class(Mangram AJ, Horan TC, Pearson ML, Silver LC, Jarvis WR. Guidelinefor prevention of surgical site infection, 1999. Am J Infect Control1999;27:97-134.)
• Duration of operation • American Society of Anesthesiology (ASA) score
(Owens WD, Felts JA, Spitznagel EL Jr. ASA physical status classification: a study of consistency of ratings. Anesthesiology 1978;49:239-43)
• Using a composite index for predicting SSI risk after operation calculate rates by the number of risk factors present
(Culver DH, Horan TC, Gaynes RP, Martone WJ, Jarvis WR, Emori TG, et al. Surgical wound infection rates by wound class, operative procedure, and patient risk index.AmJ Med 1991;91(Suppl 3B):152S-7S.)
SSI RatesBy Operative Procedure & Risk Index, 2007/08
SSI RatesBy Operative Procedure & Risk Index, 2007/08
Percentiles
SSI
• Risk Index Category
• ASA
• Duration
HAI Infection Rates
8
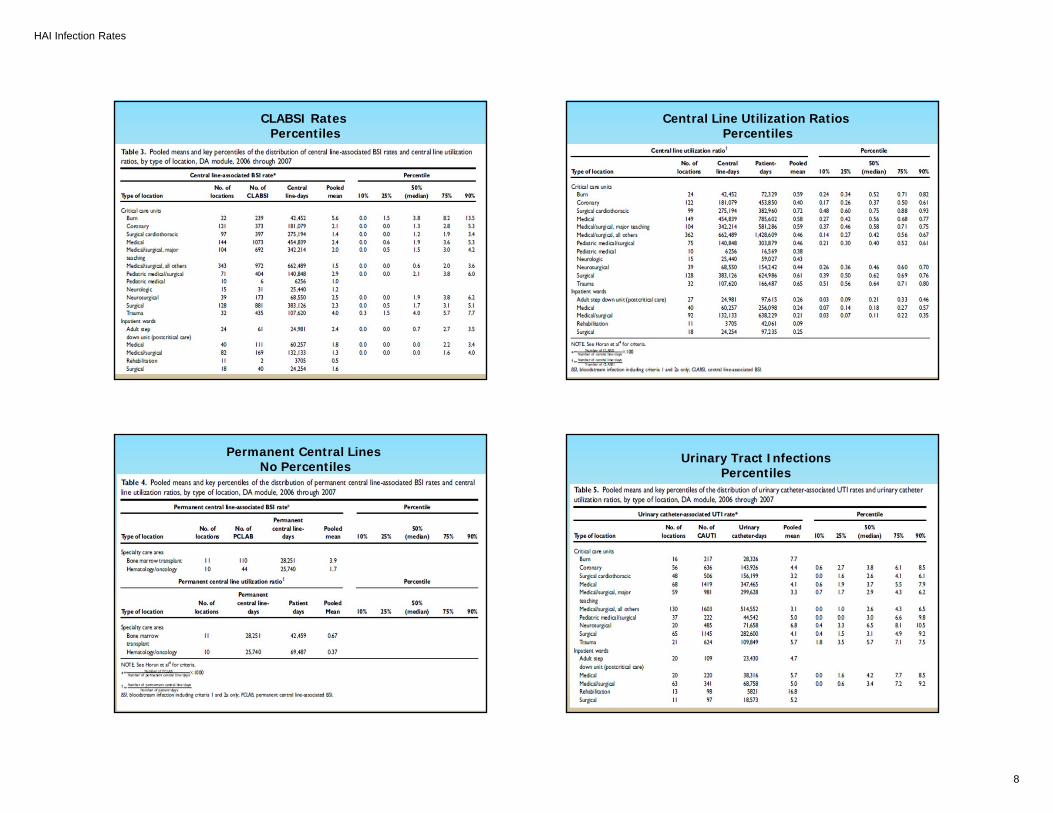
CLABSI RatesPercentiles
Central Line Utilization RatiosPercentiles
Permanent Central LinesNo Percentiles
Urinary Tract Infections Percentiles
HAI Infection Rates
9
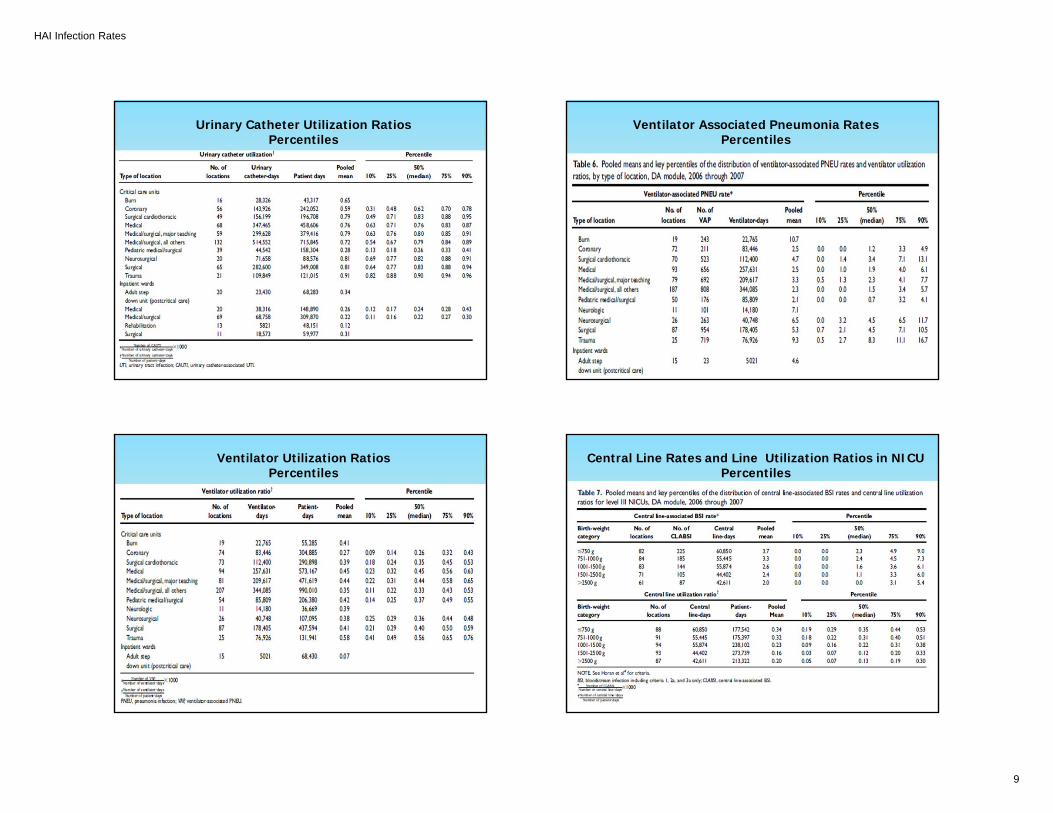
Urinary Catheter Utilization RatiosPercentiles
Ventilator Associated Pneumonia RatesPercentiles
Ventilator Utilization RatiosPercentiles
Central Line Rates and Line Utilization Ratios in NICUPercentiles
HAI Infection Rates
10
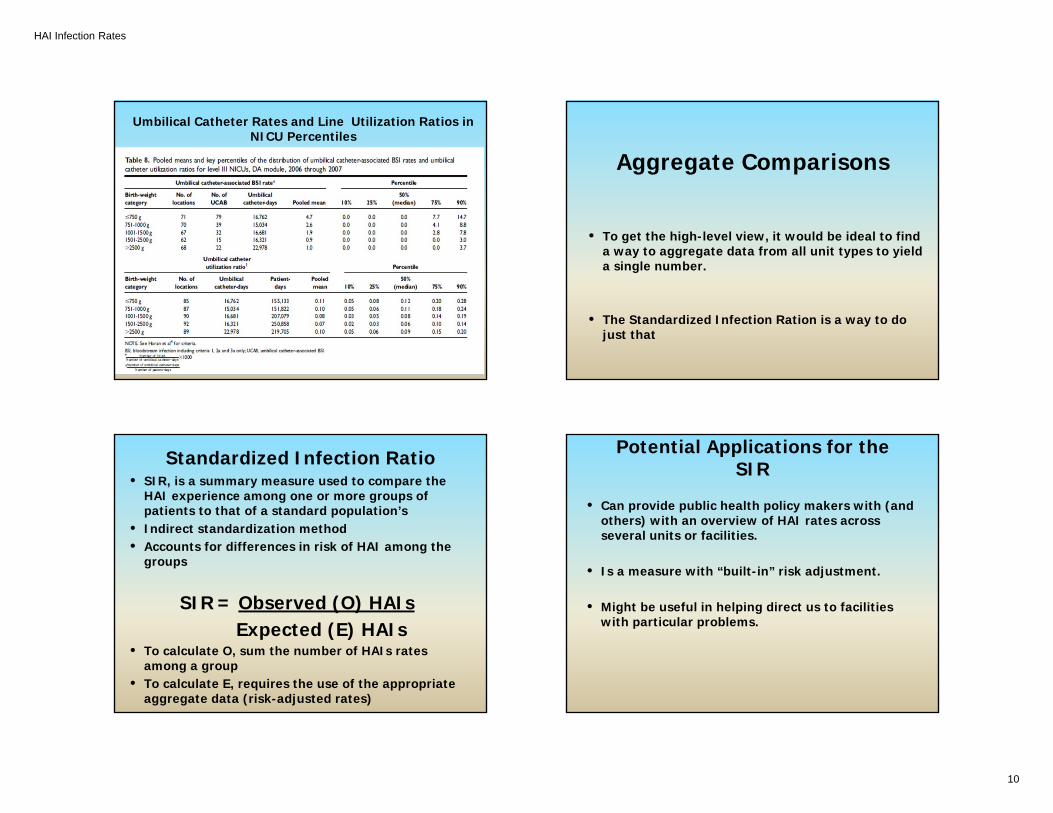
Umbilical Catheter Rates and Line Utilization Ratios in NICU Percentiles
Aggregate Comparisons
• To get the high-level view, it would be ideal to find a way to aggregate data from all unit types to yield a single number.
• The Standardized Infection Ration is a way to do just that
Standardized Infection Ratio• SIR, is a summary measure used to compare the
HAI experience among one or more groups of patients to that of a standard population’s
• Indirect standardization method• Accounts for differences in risk of HAI among the
groups
SIR = Observed (O) HAIs Expected (E) HAIs
• To calculate O, sum the number of HAIs rates among a group
• To calculate E, requires the use of the appropriate aggregate data (risk-adjusted rates)
Potential Applications for the SIR
• Can provide public health policy makers with (and others) with an overview of HAI rates across several units or facilities.
• Is a measure with “built-in” risk adjustment.
• Might be useful in helping direct us to facilities with particular problems.

HAI Infection Rates
11
Using the SIR to Direct Prevention Interventions
Like any aggregate measure, the SIR does not tell the
whole story.