healthcare in rural, regional and remote...
TRANSCRIPT

ibhi.nsw.gov.auThe Insights Series – Healthcare in rural, regional and remote NSW
The Insights Series
Healthcare in rural, regional and remote NSW

BUREAU OF HEALTH INFORMATION
Level 11, Sage Building, 67 Albert Avenue Chatswood NSW 2067 Australia Telephone: +61 2 9464 4444 Email: [email protected] bhi.nsw.gov.au
© Copyright Bureau of Health Information 2016This work is copyrighted. It may be reproduced in whole or in part for study or training purposes subject to the inclusion of an acknowledgement of the source. It may not be reproduced for commercial usage or sale. Reproduction for purposes other than those indicated above requires written permission from the Bureau of Health Information.
State Health Publication Number: (BHI) 160421ISSN: 1839-1680 (print); 2204-5511 (online)
Suggested citation:Bureau of Health Information. The Insights Series – Healthcare in rural, regional and remote NSWSydney (NSW); BHI; 2016.
Please note there is the potential for minor revisions of data in this report. Please check the online version at bhi.nsw.gov.au for any amendments.
Published November 2016
The conclusions in this report are those of BHI and no official endorsement by the NSW Minister for Health, the NSW Ministry of Health or any other NSW public health organisation is intended or should be inferred.
Foreword i
Key Findings 2
Summary 3
Setting the scene 5
Overall views of healthcare 23
Healthcare performance
Accessibility 27
Appropriateness 59
Effectiveness 91
Appendices 113
References 122
Acknowledgements 126
Table of contents

bhi.nsw.gov.auThe Insights Series – Healthcare in rural, regional and remote NSW i
People in rural, regional and remote areas of NSW are familiar with the challenges posed by geography and isolation. Healthcare systems are similarly challenged. Low population density, long travelling times, limited opportunities to harness economies of scale, difficulties recruiting a skilled workforce and an ageing population all place significant pressure upon healthcare services.
Capturing, in a meaningful way, how the healthcare system and the organisations within that system, respond to these challenges is the main aim of this report. It describes the diversity and responsiveness that are hallmarks of healthcare in NSW and compares performance across the rural–urban continuum, identifying areas of achievement and highlighting areas for potential improvement. The report focuses on issues that are known to affect rural areas but in doing so, creates a mirroring effect, also providing insights into urban challenges.
Assessing healthcare in rural, regional and remote NSW presents some 100 indicators, organised in line with our performance measurement framework. It reflects the extent to which the healthcare sector in rural and remote areas provides services when and where needed, whether patients receive the right care in the right way, and how healthcare makes a difference for people.
For many of the measures included, performance is strong in rural, regional and remote areas of NSW. Rural healthcare organisations often provide accessible, coordinated and integrated care. Linkages between providers and with community organisations are strong. Founded upon interpersonal relationships that define rural communities, much of the coordination is informal yet effective.
However, rural healthcare organisations can be vulnerable to unforeseen changes in staffing and local availability of resources. Overall, the report suggests that rural NSW does well but for some measures, the disparities between rural and urban areas are significant.
The report also presents comparisons with Canada and Sweden, drawing on international survey results. These two countries share key characteristics with NSW with regards to rurality – both have highly urbanised areas with densely populated cities, a range of smaller regional centres, and vast areas that are sparsely populated.
Assessment of healthcare is always a challenge. Performance is often nuanced, and almost always multifaceted, dynamic and strongly influenced by local and regional contexts. Assessment therefore has to include various dimensions and perspectives in order to be fair and balanced.
We hope that this report will provide a foundation to understand current issues in healthcare in rural, regional and remote areas and to monitor its evolution in the future.
Dr Jean-Frédéric Lévesque Chief Executive, Bureau of Health Information
Foreword

1 bhi.nsw.gov.auThe Insights Series – Healthcare in rural, regional and remote NSW
Key findings
2bhi.nsw.gov.auThe Insights Series – Healthcare in rural, regional and remote NSW
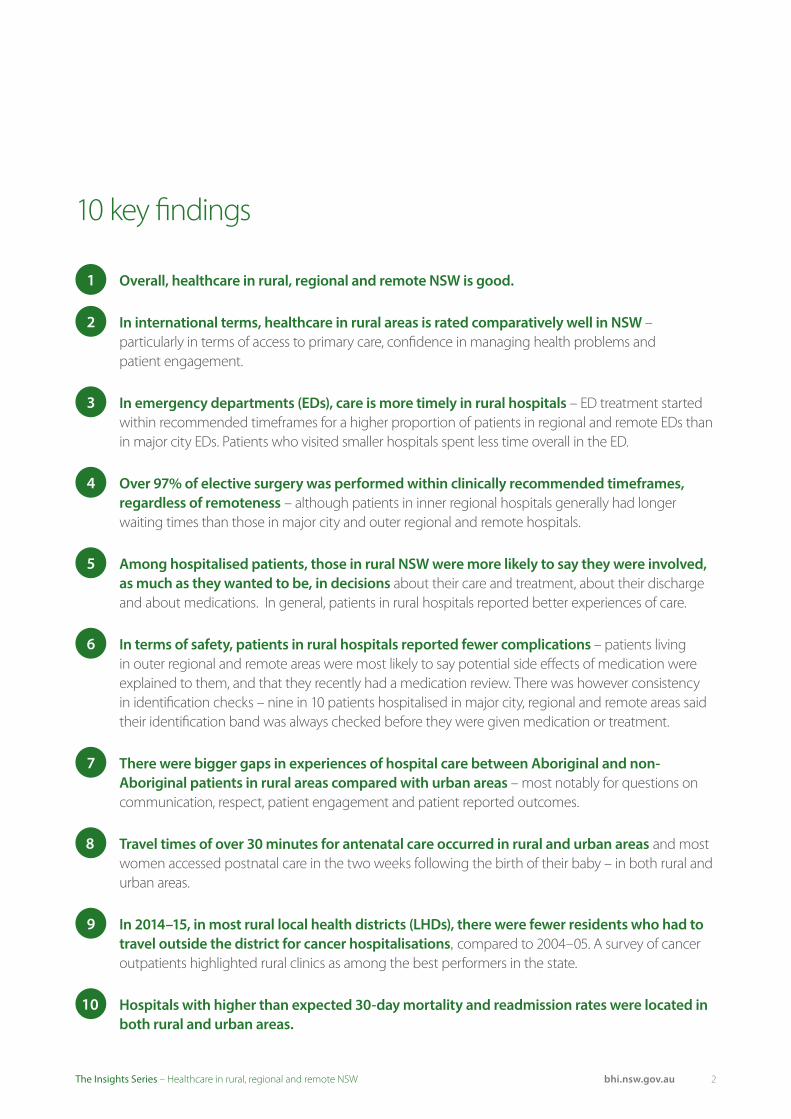
10 key findings
1 Overall, healthcare in rural, regional and remote NSW is good.
2 In international terms, healthcare in rural areas is rated comparatively well in NSW –
particularly in terms of access to primary care, confidence in managing health problems and patient engagement.
3 In emergency departments (EDs), care is more timely in rural hospitals – ED treatment started within recommended timeframes for a higher proportion of patients in regional and remote EDs than in major city EDs. Patients who visited smaller hospitals spent less time overall in the ED.
4 Over 97% of elective surgery was performed within clinically recommended timeframes,
regardless of remoteness – although patients in inner regional hospitals generally had longer waiting times than those in major city and outer regional and remote hospitals.
5 Among hospitalised patients, those in rural NSW were more likely to say they were involved,
as much as they wanted to be, in decisions about their care and treatment, about their discharge and about medications. In general, patients in rural hospitals reported better experiences of care.
6 In terms of safety, patients in rural hospitals reported fewer complications – patients living in outer regional and remote areas were most likely to say potential side effects of medication were explained to them, and that they recently had a medication review. There was however consistency in identification checks – nine in 10 patients hospitalised in major city, regional and remote areas said their identification band was always checked before they were given medication or treatment.
7 There were bigger gaps in experiences of hospital care between Aboriginal and non-Aboriginal patients in rural areas compared with urban areas – most notably for questions on communication, respect, patient engagement and patient reported outcomes.
8 Travel times of over 30 minutes for antenatal care occurred in rural and urban areas and most women accessed postnatal care in the two weeks following the birth of their baby – in both rural and urban areas.
9 In 2014–15, in most rural local health districts (LHDs), there were fewer residents who had to travel outside the district for cancer hospitalisations, compared to 2004–05. A survey of cancer outpatients highlighted rural clinics as among the best performers in the state.
10 Hospitals with higher than expected 30-day mortality and readmission rates were located in both rural and urban areas.
3 bhi.nsw.gov.auThe Insights Series – Healthcare in rural, regional and remote NSW
Summary
Overall, the report shows that the healthcare provided to people in rural, regional and remote NSW is good.
Healthcare in rural, regional and remote NSW uses a range of information sources to assess healthcare services provided to patients in urban and rural areas of NSW. It is based on information from hospital records, ED datasets, patient surveys and a qualitative data gathering exercise. Altogether, the report features some 100 measures that assess accessibility, appropriateness and effectiveness of healthcare.
Throughout the report, comparisons are made on the basis of ‘remoteness’, a term used to classify geographical areas in terms of distance from large population centres and associated amenities. Variation is assessed across three remoteness categories: major cities, inner regional areas, and outer regional, remote and very remote areas. The more generic term ‘rural’ is used to refer to areas outside major cities.
Accessibility: Healthcare, when and where needed
Across NSW, in both rural and urban areas, more than nine in 10 adults aged 55+ years said they have a regular doctor or GP clinic. However, healthcare is not always accessible – 33% of people in outer regional and remote areas and 19% in inner regional areas said they have difficulties accessing healthcare. In particular, there were unmet needs for primary care:
• 14% of adults in outer regional and remote areas, 15% in inner regional areas, and 12% in major cities said there was a time in the previous year when they needed primary care but did not receive it
• About four in 10 people said they were able to get a same day primary care appointment when they needed medical attention – regardless of whether they lived in rural or urban areas. However, 39% of people in outer regional and remote NSW said it is very difficult to get out-of-hours medical care, compared with 33% of people in inner regional areas and 17% in major cities.
Within NSW public hospital EDs, the time patients had to wait to start treatment was shortest in outer regional and remote hospitals. Compared with major city EDs, a smaller proportion of patients in rural EDs did not wait for care or left at their own risk.
Over 97% of all elective surgical procedures were performed within clinically recommended timeframes – regardless of the remoteness of the hospital. However, patients treated in hospitals in inner regional areas generally had longer waiting times than those treated in hospitals in major city and in outer regional and remote areas.
Across rural and urban areas:
• A higher percentage of women had travel times of over 30 minutes for antenatal care in rural areas
• However there were few differences in the percentage of women who received postnatal care in the two weeks following birth.
Among patients admitted to a public hospital in 2014–15, the percentage who were admitted in their LHD of residence ranged across rural LHDs from 65.8% in Far West to 91.6% in Hunter New England. More specifically for cancer care, in 2014–15, in most rural LHDs, there were fewer patients who had to travel outside the district to be hospitalised, compared with 2004–05.
Appropriateness: The right healthcare, the right way
While the ‘right’ healthcare is provided to most patients, there is room to improve:
• Despite higher patient-reported prevalence of hypertension (high blood pressure) and diabetes in rural areas, there were no significant differences in patient-reported rates of blood pressure and cholesterol checks, or influenza vaccinations
• For hospital care, the proportion of patients in rural hospitals who underwent hip fracture surgery within the recommended two days of admission was higher than in major city hospitals

4bhi.nsw.gov.auThe Insights Series – Healthcare in rural, regional and remote NSW
• While 93% of pregnant women in outer regional and remote areas had five or more antenatal visits, this was a lower percentage than in major city or inner regional areas (both 96%). However, there were no meaningful differences in the proportion of births that were elective caesarean sections by hospital remoteness
• For many measures, there was variation within hospital remoteness categories. For example, across rural hospitals, between 84% and 95% of patients said their identification band or name was ‘always’ checked before they were given medication or treatment.
Information from patient surveys shows that most patients in NSW are treated in the ‘right way’:
• In both rural and urban areas, seven in 10 patients said their GP ‘always’ explained things in an understandable way and spent enough time with them
• Among admitted patients, those in rural NSW were more likely to say they were involved – as much as they wanted to be – in decisions about their care and treatment; about discharge; and about medications
• However, differences in experiences of hospital care between Aboriginal and non-Aboriginal patients were more pronounced in hospitals in rural areas than those in urban areas.
Effectiveness: Making a difference for patients
Healthcare makes a difference in NSW. Survey results show that a higher proportion of people living in outer regional and remote areas were ‘very confident’ or ‘confident’ in managing their health problems; and patients treated in inner regional hospitals were most likely to say they had confidence and trust in healthcare professionals. Other outcome measures showed:
• ED re-presentations within 48 hours were more common in rural hospitals
About information sources
Healthcare in rural, regional and remote NSW draws on a range of data sources, each one making a contribution to assessment.
Administrative datasets generally capture information on all patients. Measures based on administrative data usually have sufficient power to detect small levels of variation and provide confidence that the variation is not artefactual. They are however limited by the number of variables captured in the datasets, and are dependent upon the accuracy of note-taking, recording and coding.
Survey data are based on a subset of all patients – and in some cases, small sample size limits the ability to draw broad conclusions. Differences that do not reach statistical significance should be interpreted with care. Survey data do however provide direct evidence of patient experiences and reflect on elements of care not captured in administrative datasets.
Qualitative data are often based on small samples with limited generalisability but they provide insights into context and experiences.
• Hospitals with higher than expected mortality and readmission rates were located in both rural and urban areas
• Patients hospitalised in rural hospitals were less likely to say they experienced a complication or adverse event
• A survey of cancer outpatients highlighted rural clinics as among the best performers in the state
• Across NSW, Aboriginal patients were less positive than non-Aboriginal patients regarding self-reported outcomes of hospital care. However, the disparity was similar in scale for hospitals in rural and urban areas.

5 bhi.nsw.gov.auThe Insights Series – Healthcare in rural, regional and remote NSW

6bhi.nsw.gov.auThe Insights Series – Healthcare in rural, regional and remote NSW
Setting the scene

7 bhi.nsw.gov.auThe Insights Series – Healthcare in rural, regional and remote NSW
What is rurality?
Rurality is often used as a generic term to describe a way of life characterised by close links with the land and agriculture. Rurality is not synonymous with remoteness – which is a more precisely defined concept used to measure isolation and distance from large population centres. The Australian Bureau of Statistics (ABS) classification of remoteness differentiates between major cities, inner regional, outer regional, remote and very remote areas. In this report, variation is assessed across three remoteness categories: major cities, inner regional areas, and outer regional, remote and very remote areas. The more generic term ‘rural’ is used to refer to geographic areas outside major cities.
Two types of measures featured in the report use remoteness categories: the first type differentiates on the basis of where patients live (NSW by remoteness of residence); and the second type differentiates on hospital locations (NSW public hospitals by remoteness). Other measures compare LHDs, using the NSW Ministry of Health designation of rural and metropolitan LHDs. The classification of LHDs is not
clear-cut however with considerable variation in LHD remoteness profiles (Figure 1.1).
Rural NSW
Rural NSW covers around 99% of the state’s land mass. One in four people in NSW live in rural, regional or remote parts of the state. Generally speaking, people in rural areas have poorer health.1 On average, they have shorter lives and more illness than people living in major cities. Employment opportunities are often limited within remote and rural communities, and household incomes are generally lower than in urban areas (Figure 1.2).1
At the same time, there are important social benefits associated with rural life. There are higher levels of cohesiveness, higher rates of community engagement and participation in volunteer work and a stronger sense of security across rural NSW.2
This report focuses mainly on care provided by the public healthcare system in NSW. To properly capture patients’ healthcare experiences however, it also includes some information about other types of services such as primary care.
Introduction
Figure 1.1 Population distribution, by LHD and remoteness category of residence, NSW, 2011
Source: NSW Ministry of Health, extracted from SAPHaRI, Centre for Epidemiology and Evidence (BHI analysis).
100%
43%
40%
24%
30%
14%
57%
60%
76%
50%
72%
35%
31%
15%
11%
20%
23%
51%
69%
85%
89%
98%
99%
99%
100%
100%
0 10 20 30 40 50 60 70 80 90 100
Far West
Western NSW
Murrumbidgee
Mid North Coast
Southern NSW
Northern NSW
Hunter New England
Illawarra Shoalhaven
Nepean Blue Mountains
South Western Sydney
Central Coast
Northern Sydney
Western Sydney
South Eastern Sydney
Sydney
% of population
Outer regional and remote Inner regional Major cities

8bhi.nsw.gov.auThe Insights Series – Healthcare in rural, regional and remote NSW
Figure 1.2 Socioeconomic characteristics by LHD and remoteness category, NSW
Life expectancy (years)
Persons aged 65+ years % aged 15–64 years
with weekly income <$600
% of population who are
Aboriginal peopleMALE FEMALE Number % of population
Rem
ote
nes
s
Major cities 81.7 85.8 784,088 14.0 41.2 1.8
Inner regional 79.5 84.1 280,750 19.5 47.2 4.7
Outer regional 78.9 84.3 92,097 20.4 51.5 8.3
Remote 70.3 71.9 5,074 16.4 47.7 26.2
Very remote – – 1,075 12.8 49.1 39.3
Ru
ral l
oca
l hea
lth
dis
tric
ts
Far West 76.4 81.0 5,997 19.3 50.1 11.7
Hunter New England 79.0 84.0 164,853 18.2 46.3 5.4
Mid North Coast 79.7 84.1 48,182 22.7 53.2 5.8
Murrumbidgee 79.8 84.5 44,727 18.6 46.1 4.8
Northern NSW 78.9 84.3 61,469 20.9 52.8 4.8
Southern NSW 79.8 84.4 38,518 19.1 42.3 3.5
Western NSW 78.3 83.2 48,215 17.3 45.9 11.1
Urb
an lo
cal h
ealt
h d
istr
icts
Central Coast 79.9 84.3 65,852 19.9 46.1 3.4
Illawarra Shoalhaven 80.5 84.4 74,519 18.8 48.1 3.4
Nepean Blue Mountains 80.4 84.0 47,822 13.3 41.3 3.2
Northern Sydney 83.7 87.5 137,362 15.4 34.7 0.3
South Eastern Sydney 83.0 87.0 125,908 14.3 35.4 0.9
South Western Sydney 81.1 85.1 115,492 12.5 48.4 1.8
Sydney 81.7 86.4 74,627 12.1 37.7 1.1
Western Sydney 81.0 85.1 101,130 11.2 43.6 1.7
Sources: Centre for Epidemiology and Evidence. Health Statistics New South Wales. Sydney: NSW Ministry of Health. Available at: www.healthstats.nsw.gov.au.
A note about Aboriginality
Aboriginal health is an important issue to be considered in assessing healthcare in rural, regional and remote NSW. A large proportion of Aboriginal people live in metropolitan LHDs, and over 90% live in major cities or inner regional areas. In outer regional and remote areas however, Aboriginal people represent a higher proportion of the population. For example, 11.7% of the population is Aboriginal in Far West, and 11.1% in Western NSW.

9 bhi.nsw.gov.auThe Insights Series – Healthcare in rural, regional and remote NSW
Geographical areas vary in their resident populations’ health and healthcare needs, the range of services available, and the resources used to deliver care. The extent of variation is important context for any assessment of healthcare performance.
Health and healthcare needs
Life expectancy in NSW is among the longest in the world. Within NSW however, increasing rurality is associated with decreasing life expectancy. For example, a baby girl born in a remote or very remote area in 2012 can expect to live for 72 years while a baby girl born in a major city can expect to live for 86 years (Figure 1.2).
Similarly, while there was an overall decline in mortality rates in NSW between 2001 and 2013, improvements did not occur uniformly across the state – with steeper falls among populations living in major cities (-21%), compared with those living in inner regional areas (-17%), and outer regional areas (-17%).1
In terms of healthcare needs, most people in NSW require healthcare in the course of a year. In 2014–15, more than eight in 10 NSW adults (84%) needed to see a GP, and this did not differ substantially by remoteness. Almost six in 10 adults said they needed to see a dentist; and four in 10 needed to see a medical specialist – although perceived need for these healthcare professionals was lower in outer regional and remote areas (Figure 1.3).
Healthcare needs tend to increase with age. Older people often have multiple health conditions and are more more likely to be frequent users of healthcare services.
In 2014, the concentration of people aged 65+ years was greater in outer regional and remote areas (20% of residents) and inner regional areas (19%) than in major cities (14%) (Figure 1.2). Across the state’s LHDs, there was a twofold difference in the percentage of the resident population aged 65+ years, and rural LHDs generally had a higher proportion of older residents (Figure 1.4).
Aboriginal people also have greater health needs. They are known to have lower life expectancy, higher rates of cardiovascular disease and chronic disease. About 60% of the NSW Aboriginal population lives in a rural LHD.1
There are a number of important health issues known to affect rural populations1,3 including:
• Higher mortality rates and lower life expectancy
• Higher road injury and fatality rates
• Higher reported rates of high blood pressure, diabetes, and obesity
• Higher death rates from chronic disease
• Higher prevalence of mental health problems
• Higher rates of alcohol abuse and smoking
• Poorer dental health.
Figure 1.3 Percentage of persons aged 16+ years who said they needed to see a medical professional at least once in the preceding year, by remoteness of residence, NSW, 2014–15
Source: ABS, Patient Experience Survey 2014–15 (customised request).
39
53
84
41
54
84
43
61
84
0 20 40 60 80 100
Medical Specialist
Dentist
GP
% of persons
Outer regional and remote Inner regional Major cities
Background

10bhi.nsw.gov.auThe Insights Series – Healthcare in rural, regional and remote NSW
There are also important differences in health behaviours. For example, tobacco smoking is a major risk factor for heart disease, stroke, cancer and chronic obstructive pulmonary disease (COPD) and high smoking rates are associated with increased healthcare needs. In 2015, people living in outer regional and remote areas were more likely to be current smokers (20% of adults) than those living in major cities (13%) (Figure 1.5).
It is not currently possible to ascertain, with any certainty, the extent to which poorer health seen among residents in more rural areas of NSW is caused by remoteness, socioeconomic status or Aboriginality. Most likely all three factors intersect and play a role. Difficulties in establishing causality however, do not preclude meaningful measurement of healthcare accessibility, appropriateness and effectiveness provided to people living in rural areas.
Figure 1.4 Percentage of the population aged 65+ years, by LHD of residence, NSW, 2014
Source: Centre for Epidemiology and Evidence, Health Statistics New South Wales, Sydney: NSW Ministry of Health. Available at: healthstats.nsw.gov.au
23
21
19
19
19
18
17
20
19
15
14
13
13
12
11
0 20 40 60 80 100
Mid North Coast
Northern NSW
Central Coast
Far West
Southern NSW
Illawarra Shoalhaven
Murrumbidgee
Hunter New England
Western NSW
Northern Sydney
South Eastern Sydney
Nepean Blue Mountains
South Western Sydney
Sydney
Western Sydney
% of population
Rural Urban
Figure 1.5 Current smoking rates among persons aged 16+ years, by remoteness of residence, NSW, 2015
Source: Centre for Epidemiology and Evidence, Health Statistics New South Wales, Sydney: NSW Ministry of Health. Available at: healthstats.nsw.gov.au
20
26
15
23
13
22
0 20 40 60 80 100
2015
2002
% of persons
Outer regional and remote Inner regional Major cities
Views from the qualitative consultation
Rural areas tend to have lower levels of education and higher levels of socio-economic disadvantage than urban areas. Inequities in service delivery and health outcomes for rural people extend across mental health, aged populations, disability and culturally and linguistically diverse (CALD) groups.
The shift from traditional self-contained hospitals to hub and spoke models of networked providers and other alternative service models allows rural healthcare to respond effectively to changing demographics.

11 bhi.nsw.gov.auThe Insights Series – Healthcare in rural, regional and remote NSW
Healthcare services in NSW
NSW has a pluralist healthcare system with a mix of Commonwealth and state government responsibilities and funding streams; public, private and not-for-profit providers; and intersectoral networks of community, primary, secondary, tertiary and quaternary care. Patient pathways cross boundaries, both geographical and organisational.
Responsibilities
The Commonwealth government funds 44% of total health expenditure in NSW.4 Responsibilities include most primary care services, Medicare and subsidies for most prescription drugs through the Pharmaceutical Benefits Scheme (PBS).
The NSW government funds 24% of total health expenditure.4 Responsibilities include management and administration of public hospitals, community health services, mental health services, public dental clinics, public health, ambulance and emergency services and patient transport.
Individuals fund 17% of total health expenditure.4
Out-of-pocket spending includes direct payment for services not covered by insurance, as well as insurance excess payments, gap payments and co-payments. Other private sources (e.g. health insurers) fund 15% of total health expenditure.4
Types of services
Three main types of healthcare services are used by NSW residents: primary care, emergency department care and hospital-based services.
Primary care offers front-line services for a wide range of acute and chronic health problems, helping prevent illness and acting as an entry point to the wider healthcare system. In 2014–15, in major cities, there were 36 million GP services provided; compared to eight million in inner regional areas and two million in outer regional and remote areas. Per capita, there were far more GP services provided in major cities compared with rural NSW (Figure 1.6).
Emergency departments (EDs) range from Level 1 (able to provide first aid) to Level 6 (major trauma centres).5 They provide specialised assessment and life-saving care and are often the gateway to inpatient services for acutely unwell patients. In 2015, there were 2.6 million ED visits across the state.
Source: NSW Population Health Survey (SAPHaRI), Centre for Epidemiology and Evidence, NSW Ministry of Health.
24
23
23
22
21
20
20
21
18
17
16
15
15
15
14
0 20 40 60 80 100
Northern NSW
Far West
Murrumbidgee
Western NSW
Mid North Coast
Central Coast
Southern NSW
Hunter New England
Nepean Blue Mountains
South Western Sydney
Illawarra Shoalhaven
Western Sydney
Sydney
South Eastern Sydney
Northern Sydney
% of population
Rural Urban% by LHDs
Figure 1.7 Percentage of persons aged 16+ years reporting ED use in the previous year by LHD of residence, NSW, 2014
Source: NSW Population Health Survey (SAPHaRI), Centre for Epidemiology and Evidence, NSW Ministry of Health.
12% 11% 10%Outer regional
and remoteInner
regional Major cities
Figure 1.6 GP services provided per capita, by remoteness of residence, NSW, 2014–15
Source: Australian Government Department of Health, General Practice Statistics.
4.5
5.7
6.4
0 1 2 3 4 5 6 7
MBS services per capita
Outer regionaland remote
Inner regional
Major cities

12bhi.nsw.gov.auThe Insights Series – Healthcare in rural, regional and remote NSW
In 2014, almost two in 10 NSW adults (17%) said they visited an ED in the preceding 12 months. The proportion of residents who visited an ED varied by remoteness and across LHDs. People living in Northern NSW were almost twice as likely to visit an ED as those living in Northern Sydney (Figure 1.7).
By remoteness, residents in outer regional and remote areas of NSW were most likely to visit an ED and 27% visited an ED at least once during the year 2014–15. A subset of that group, 5% of outer regional and remote residents, visited an ED three or more times during the year. In comparison, 25% of residents in inner regional areas and 17% of residents in major cities visited an ED at least once (Figure 1.8).
There are more than 220 public hospitals in NSW and they range in size and the complexity of services offered. While the largest – principal referral hospitals – are only found in major cities, other types are distributed across areas of remoteness (Appendix 1).
Smaller facilities that focus on providing flexible and integrated care are prevalent in regional and remote areas (See Appendix 1). Multipurpose services (MPS), in particular, integrate a range of health services, including acute care, subacute care (such as palliative care), emergency, allied health, oral health, primary health and community services.
Across the state, only 6% of hospital admissions occur in small hospitals (that is, other than principal referral, major, or district hospitals) and this proportion is similar in all urban LHDs. However in rural LHDs, a varying proportion of admissions occur in smaller hospitals – ranging from 4% in Northern NSW to 22% in Western NSW and 32% in Murrumbidgee (Appendix 1).
3+ visits
2 visits
0
20
40
60
80
100
Source: NSW Ministry of Health, extracted from SAPHaRI, Centre for Epidemiology and Evidence (BHI analysis).
83%of this
group had 0 visits
75%of this
group had 0 visits
73%of this
group had 0 visits
Major citiesInner regionalOuter regional and remote
2% of peoplein major citiesvisited anED 3+ times
4% of peoplein inner regional visited an ED3+ times
5% of peoplein outer regional/remote visited an ED 3+ times
They accounted for 42% of ED visits in this area
They accounted for 40% of ED visits in this area
They accounted for 32% of ED visits in this area
3+ visits
2 visits
3+ visits
2 visits
1 visit
0 visits
1 visit
0 visits
1 visit
0 visits
24%of visits
32%of visits
44%of visits
12%3%
36%of visits
24%of visits
40%of visits
17% 16%6%5%
5%
42%of visits
24%of visits
34%of visits
Figure 1.8 Percentage of the population who frequently visited an emergency department, by remoteness of residence, NSW, 2014–15
13 bhi.nsw.gov.auThe Insights Series – Healthcare in rural, regional and remote NSW
hospitals have a greater proportion of their budgets allocated via block funding. Across LHDs the use of block funding varies considerably. In 2015–16, block funding comprised 1% of the budget in Western Sydney and 41% in Murrumbidgee.6
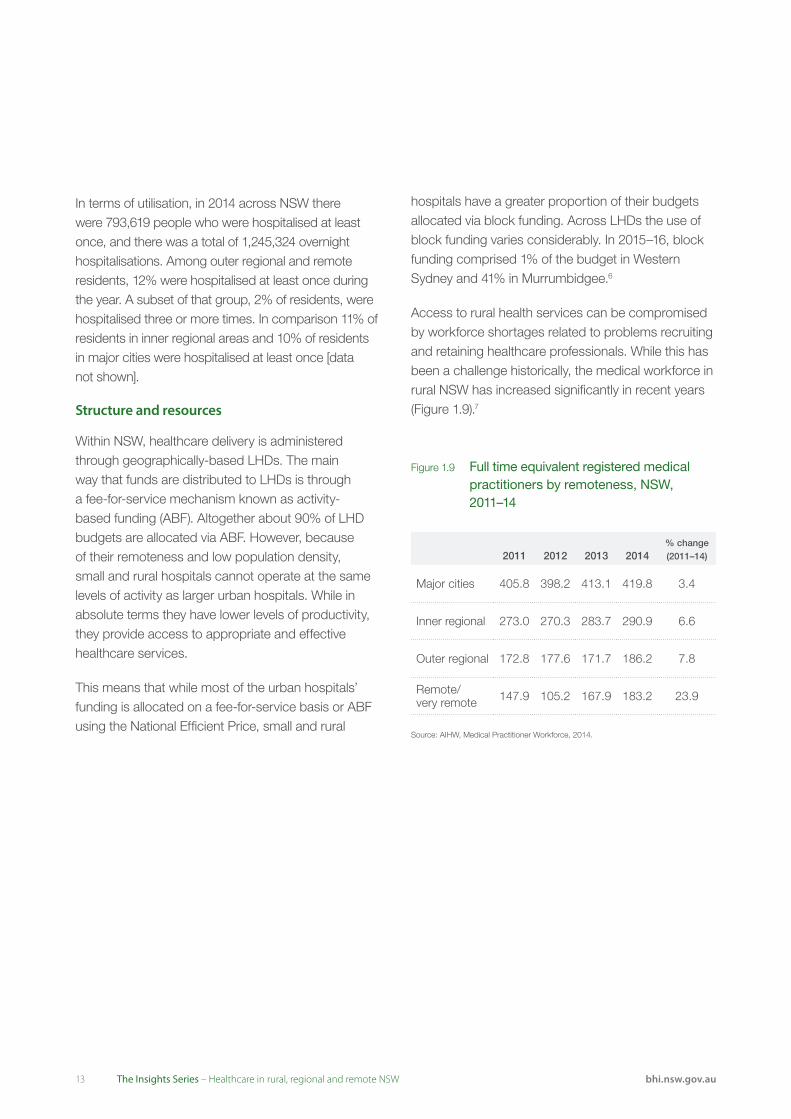
Access to rural health services can be compromised by workforce shortages related to problems recruiting and retaining healthcare professionals. While this has been a challenge historically, the medical workforce in rural NSW has increased significantly in recent years (Figure 1.9).7
Figure 1.9 Full time equivalent registered medical practitioners by remoteness, NSW, 2011–14
2011 2012 2013 2014% change (2011–14)
Major cities 405.8 398.2 413.1 419.8 3.4
Inner regional 273.0 270.3 283.7 290.9 6.6
Outer regional 172.8 177.6 171.7 186.2 7.8
Remote/ very remote 147.9 105.2 167.9 183.2 23.9
Source: AIHW, Medical Practitioner Workforce, 2014.
In terms of utilisation, in 2014 across NSW there were 793,619 people who were hospitalised at least once, and there was a total of 1,245,324 overnight hospitalisations. Among outer regional and remote residents, 12% were hospitalised at least once during the year. A subset of that group, 2% of residents, were hospitalised three or more times. In comparison 11% of residents in inner regional areas and 10% of residents in major cities were hospitalised at least once [data not shown].
Structure and resources
Within NSW, healthcare delivery is administered through geographically-based LHDs. The main way that funds are distributed to LHDs is through a fee-for-service mechanism known as activity-based funding (ABF). Altogether about 90% of LHD budgets are allocated via ABF. However, because of their remoteness and low population density, small and rural hospitals cannot operate at the same levels of activity as larger urban hospitals. While in absolute terms they have lower levels of productivity, they provide access to appropriate and effective healthcare services.
This means that while most of the urban hospitals’ funding is allocated on a fee-for-service basis or ABF using the National Efficient Price, small and rural
14bhi.nsw.gov.auThe Insights Series – Healthcare in rural, regional and remote NSW
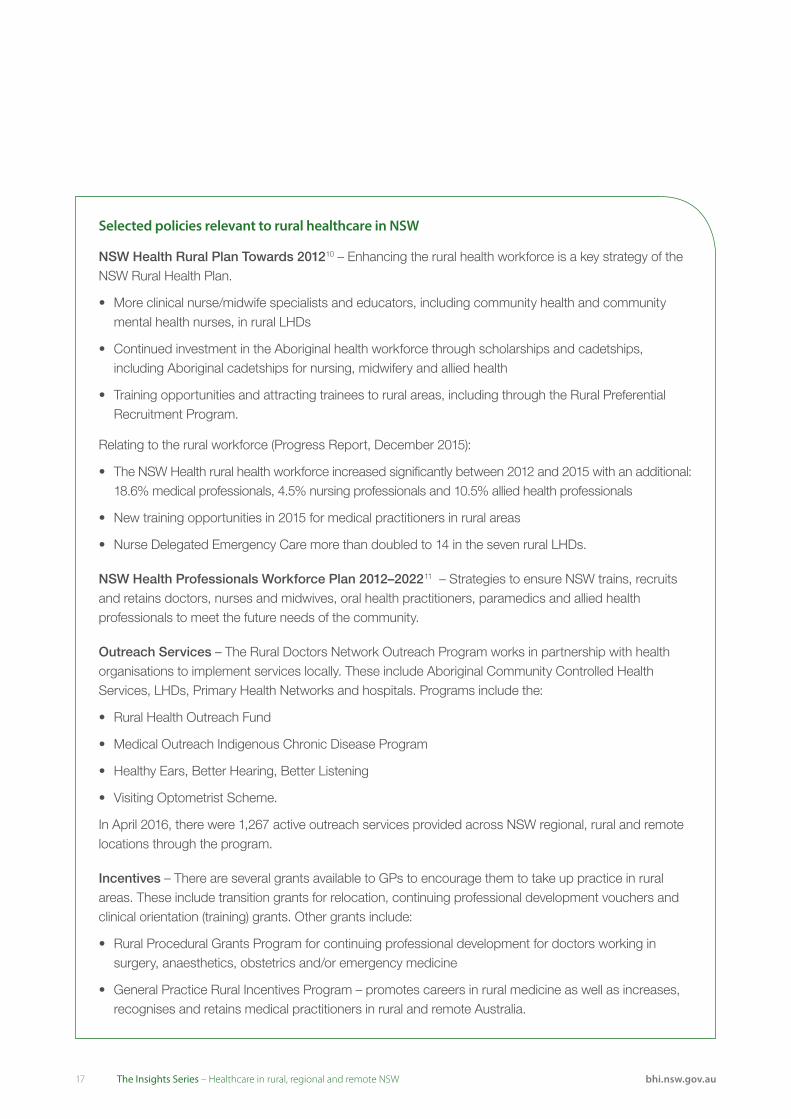
Views from the qualitative consultation
The commissioned research identified workforce issues as the biggest challenge for rural healthcare. Service adaptation and transformation are seen as essential if rural health services are to meet contemporary challenges of sustainability, and safety and quality in rural healthcare.
Rural areas use a range of innovative and responsive strategies to enhance recruitment and retention of health professionals and develop a skilled and stable workforce. These include working with universities to support rural placements through undergraduate medical programs, targeted scholarship programs and support for international medical graduates.
Rural and remote healthcare is characterised by a lack of economies of scale and staffing issues. However, efficiencies are created by using flexible and adaptive models of service delivery such as the use of networking and hub and spoke models.
All of the small hospitals visited had undergone significant transformation and adaptations to service models. Rural hospitals had transformed into MPS, Urgent Care Centres with palliative or rehabilitation beds, Health Ones* or primary health services (without beds). Many rural services have used MPS as a transformative device to provide aged care beds; in one rural LHD, the number of MPS had grown from zero to 14 in a period of 15 years. In another LHD, a large number of faith-based and private organisations provide aged care accommodation.
“Workforce issues are the biggest challenge for rural healthcare performance... The biggest challenge many face is a lack of a specialist medical workforce resulting in a heavy reliance on visiting locums... [which can be] extremely costly and in some cases contribute to inconsistencies in care.” (Qualitative consultation respondent)
“The biggest challenges faced by rural areas in terms of workforce include an ageing workforce, attracting new graduates, recruitment and retention of mid-career professionals, training and ensuring an appropriate skill mix.” (Qualitative consultation respondent)
* Health One NSW services provide integrated care across general practice and community health services, see page 33 for details.
15 bhi.nsw.gov.auThe Insights Series – Healthcare in rural, regional and remote NSW
Utilisation of resources
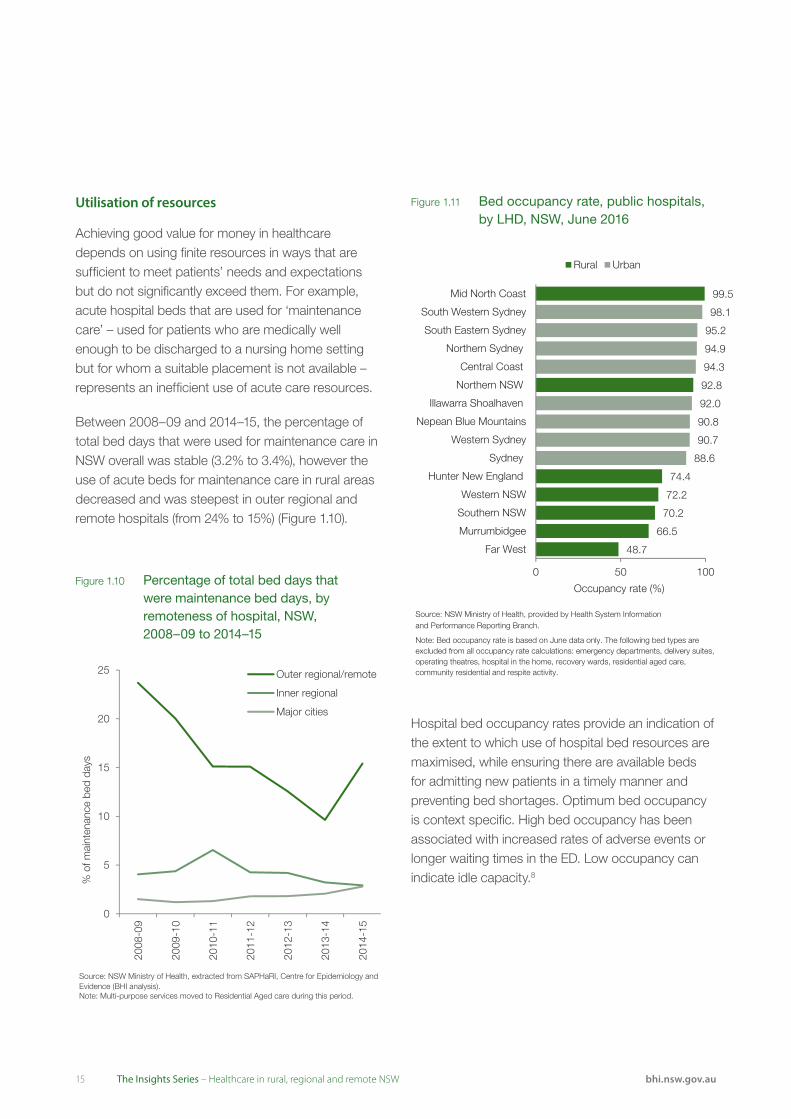
Achieving good value for money in healthcare depends on using finite resources in ways that are sufficient to meet patients’ needs and expectations but do not significantly exceed them. For example, acute hospital beds that are used for ‘maintenance care’ – used for patients who are medically well enough to be discharged to a nursing home setting but for whom a suitable placement is not available – represents an inefficient use of acute care resources.
Between 2008–09 and 2014–15, the percentage of total bed days that were used for maintenance care in NSW overall was stable (3.2% to 3.4%), however the use of acute beds for maintenance care in rural areas decreased and was steepest in outer regional and remote hospitals (from 24% to 15%) (Figure 1.10).
Hospital bed occupancy rates provide an indication of the extent to which use of hospital bed resources are maximised, while ensuring there are available beds for admitting new patients in a timely manner and preventing bed shortages. Optimum bed occupancy is context specific. High bed occupancy has been associated with increased rates of adverse events or longer waiting times in the ED. Low occupancy can indicate idle capacity.8
Figure 1.11 Bed occupancy rate, public hospitals, by LHD, NSW, June 2016
Rural Urban
Mid North Coast
South Western Sydney
South Eastern Sydney
99.5
98.1
95.2
Northern Sydney
Central Coast
Northern NSW
Illawarra Shoalhaven
94.9
94.3
92.8
92.0
Nepean Blue Mountains 90.8
Western Sydney 90.7
Sydney
Hunter New England
88.6
74.4
Western NSW
Southern NSW
Murrumbidgee
Far West
72.2
70.2
66.5
48.7
0 50 100
Occupancy rate (%)
Source: NSW Ministry of Health, provided by Health System Informationand Performance Reporting Branch.
Note: Bed occupancy rate is based on June data only. The following bed types are excluded from all occupancy rate calculations: emergency departments, delivery suites, operating theatres, hospital in the home, recovery wards, residential aged care, community residential and respite activity.
Figure 1.10 Percentage of total bed days that were maintenance bed days, by remoteness of hospital, NSW, 2008–09 to 2014–15
Source: NSW Ministry of Health, extracted from SAPHaRI, Centre for Epidemiology and Evidence (BHI analysis).Note: Multi-purpose services moved to Residential Aged care during this period.
0
5
10
15
20
25
2008
-09
2009
-10
2010
-11
2011
-12
2012
-13
2013
-14
2014
-15
% o
f mai
nten
ance
bed
day
s
Outer regional/remote
Inner regional
Major cities

16bhi.nsw.gov.auThe Insights Series – Healthcare in rural, regional and remote NSW
Views from the qualitative consultation
The adaptation of rural healthcare services to meet the changing demographics of rural populations was one of the key features of our research. The shift from traditional self-contained hospitals to hub and spokes models of networked services and other alternative service models is allowing rural communities to respond effectively to changing demographics. Many small rural hospitals have converted to alternative service models including multipurpose services which often combine aged or palliative care facilities with emergency services or inpatient beds.
Significant reforms to rural health service organisation have occurred over the past two decades to meet the unique challenges of rural and remote healthcare including ageing and shrinking populations, rising levels of chronic disease, high costs of service delivery, recruitment and retention challenges and technology developments.3 The National Strategic Framework for Rural and Remote Health identifies the need to continue to develop flexible, responsive, integrated and innovative service models and models of care to meet rural healthcare needs into the future.3
“People always feel that not having the beds full is a threat. They fear that if the beds are seen to be empty, the service will be closed. I explain to my staff that it’s not about how many people are in the beds; it’s about providing an effective and streamlined service.” (Qualitative consultation respondent)
“There is a networking and infrastructure issue to consider when managing rural networks: how do you coordinate efficient services when rural communities are incredibly passionate and protective of their own communities and hospitals. You are fighting the problem of inefficiencies but at the same time you can’t underestimate the importance of small hospitals to a small community in terms of its social role.” (Qualitative consultation respondent)
“Our hospital has an occupancy rate of about 60% but is kept open for accessibility reasons... this ties into people’s expectations of reasonable healthcare and reasonable distance. We run as efficiently as we can given these constraints – if it means we run at 25%, we run at 25%.” (Qualitative consultation respondent)
Overall in 2011, NSW had a bed occupancy rate of 87% – within three percentage points of the UK, Canada and Switzerland.9 In June 2016, the bed occupancy rate in public hospitals varied across LHDs from 48.7% in Far West to 99.5% in Mid North Coast (Figure 1.11).
Bed occupancy is not a direct reflection of system or organisational efficiency. A bed is part of the ‘production process’ of treatment. While it may be in use for 85% of the time and considered ‘efficient’, a care model that relies on hospital beds rather than community care or hospital-in-the-home for example, may not represent efficient use of overall organisational or system resources.
17 bhi.nsw.gov.auThe Insights Series – Healthcare in rural, regional and remote NSW
Selected policies relevant to rural healthcare in NSW
NSW Health Rural Plan Towards 201210 – Enhancing the rural health workforce is a key strategy of the NSW Rural Health Plan.
• More clinical nurse/midwife specialists and educators, including community health and community mental health nurses, in rural LHDs
• Continued investment in the Aboriginal health workforce through scholarships and cadetships, including Aboriginal cadetships for nursing, midwifery and allied health
• Training opportunities and attracting trainees to rural areas, including through the Rural Preferential Recruitment Program.
Relating to the rural workforce (Progress Report, December 2015):
• The NSW Health rural health workforce increased significantly between 2012 and 2015 with an additional: 18.6% medical professionals, 4.5% nursing professionals and 10.5% allied health professionals
• New training opportunities in 2015 for medical practitioners in rural areas
• Nurse Delegated Emergency Care more than doubled to 14 in the seven rural LHDs.
NSW Health Professionals Workforce Plan 2012–202211 – Strategies to ensure NSW trains, recruits and retains doctors, nurses and midwives, oral health practitioners, paramedics and allied health professionals to meet the future needs of the community.
Outreach Services – The Rural Doctors Network Outreach Program works in partnership with health organisations to implement services locally. These include Aboriginal Community Controlled Health Services, LHDs, Primary Health Networks and hospitals. Programs include the:
• Rural Health Outreach Fund
• Medical Outreach Indigenous Chronic Disease Program
• Healthy Ears, Better Hearing, Better Listening
• Visiting Optometrist Scheme.
In April 2016, there were 1,267 active outreach services provided across NSW regional, rural and remote locations through the program.
Incentives – There are several grants available to GPs to encourage them to take up practice in rural areas. These include transition grants for relocation, continuing professional development vouchers and clinical orientation (training) grants. Other grants include:
• Rural Procedural Grants Program for continuing professional development for doctors working in surgery, anaesthetics, obstetrics and/or emergency medicine
• General Practice Rural Incentives Program – promotes careers in rural medicine as well as increases, recognises and retains medical practitioners in rural and remote Australia.

18bhi.nsw.gov.auThe Insights Series – Healthcare in rural, regional and remote NSW
Selected improvement initiatives implemented in NSW
Isolated Patients Travel and Accommodation Assistance Scheme provides transport and travel assistance to people who cannot use or have difficulty using public and/or private transport or who are disadvantaged by distance.
The NSW Rural Doctors Network (RDN) has worked closely with Hunter New England LHD, Western NSW LHD, Pius X Aboriginal Health Service, and South West Hospital & Health Service to establish a GP-obstetrician and midwife service for Aboriginal women and babies in Collarenebri and Mungindi. The service is funded through the Medical Outreach Indigenous Chronic Disease Program, which is an Australian Government initiative administered in NSW by RDN. The service allows Aboriginal women to access comprehensive antenatal care on country and closer to home, and to receive timely referrals to specialised perinatal services.
Western NSW Patient Flow Unit – Western NSW is the second most sparsely populated LHD in NSW, with just over one person per sq km (271,000 people; 250,000 sq km). Patients frequently require supported transport to maximise the utilisation of available beds and to access an appropriate level of service. The LHD spends in excess of $26 million in transporting patients and specialists throughout the district. In response, the LHD’s Patient Flow Unit supports the delivery of care at the right place and right time.
Aboriginal Maternal and Infant Health Service (AMIHS) and Building Strong Foundations (BSF) for Aboriginal Children Families and Communities programs provide support to the workforce in the provision of culturally appropriate maternity and child and family healthcare in rural and regional NSW.

19 bhi.nsw.gov.auThe Insights Series – Healthcare in rural, regional and remote NSW
Data and methods Determining remoteness
This report uses the Australian Bureau of Statistics (ABS) classification of remoteness area (RA). Patients admitted to hospital have been assigned to a ‘mesh block’ of residence in the data made available to BHI by the NSW Ministry of Health. An RA category has been assigned to each mesh block in NSW, so summary statistics by three-categories (major cities; inner regional; and outer regional, remote and very remote) can be computed simply. Indicators that report hospital level measures use the facility’s geographical location to define remoteness. They are assigned to an RA on the basis of Statistical area, level 1, which is part of the Australian Statistical Geography Standard (ASGS).
Administrative data sources
Admitted Patient Data Collection (APDC) – All NSW public hospitals, public psychiatric hospitals, public multipurpose services, private hospitals and private day procedure centres in NSW provide data to the NSW Ministry of Health on patients admitted for care. The collection also includes data relating to NSW residents hospitalised interstate in public hospitals.
Emergency Department Data Collection (EDDC) – The EDDC is derived from computer databases used for managing patients in EDs in public hospitals in NSW. Statewide, approximately 95% of all ED attendances (around 2 million visits per year) are included in the EDDC.
Secure Analytics for Population Health Research and Intelligence (SAPHaRI) is a data warehouse administered by the Centre for Epidemiology and Evidence (CEE) at the NSW Ministry of Health. It provides administrative data linked by the Centre of Health Record Linkage (CHeReL) using probabilistic record linkage methods.
Clinical Services Planning Analytics (CaSPA) tools were used to examine patient flows.
Patient surveys
International, national and state surveys were used.
The 2014 Commonwealth Fund International Health Policy Survey – Reflected the experiences of 25,530 adults aged 55+ years in 11 countries: Australia, Canada, Germany, France, the Netherlands, New Zealand, Norway, Sweden, Switzerland, the United Kingdom and the United States. In NSW, 2,800 adults were surveyed between March and May 2014. Where questions of interest were not available in 2014, information was sourced from the 2013 Commonwealth Fund International Health Policy Survey. It reflected the experiences of 20,045 adults aged 18+ years in the same 11 countries. In NSW, 1,524 adults were surveyed between March and June 2013.
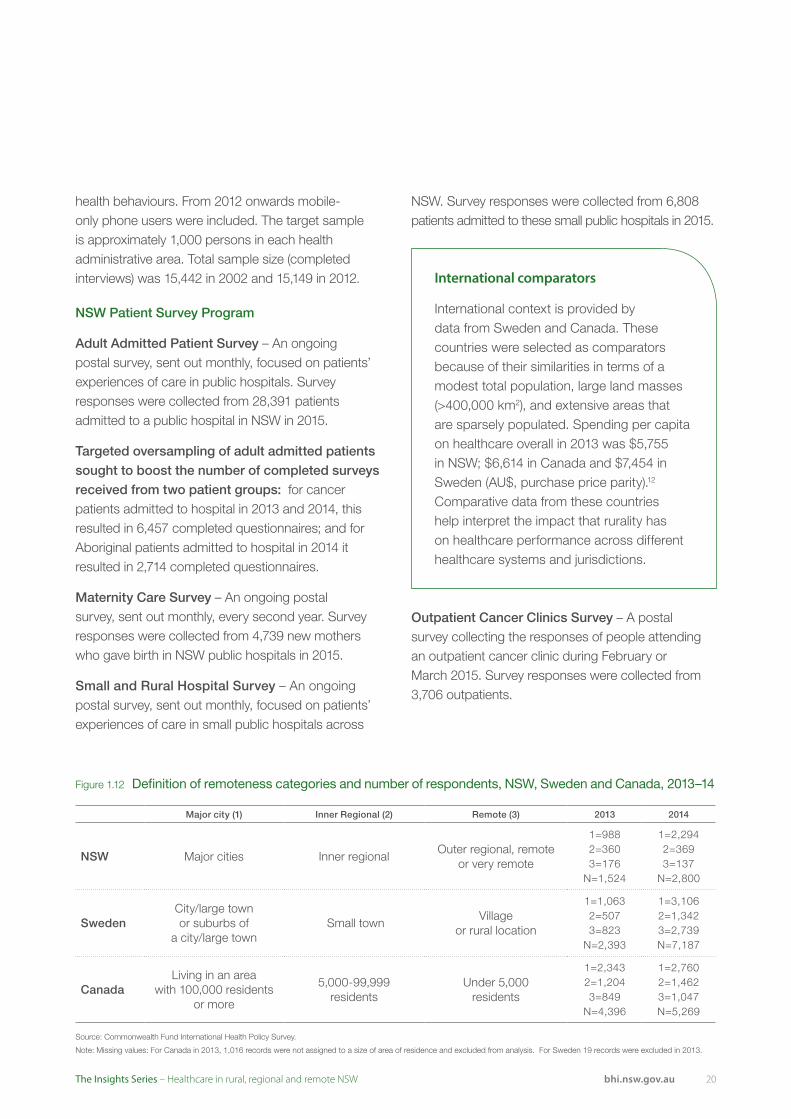
Respondents were grouped as either living in or very close to an urban centre, or living in small town/inner regional areas or a non-urban area. Definitions differed by jurisdiction (Figure 1.12).
Results were weighted to represent the age, sex, education and regional distribution of each country’s population in the survey year, with targets based on country census data. Results for comparisons based on fewer than 30 responses have been suppressed.Differences between the remote or inner regional values with major cities were tested at a 5% significance level and marked (*) when differences were significant (p<0.05). For details see Technical Supplement of Healthcare in Focus at bhi.nsw.gov.au
The Australian Bureau of Statistics (ABS) Patient Experience Survey – Conducted annually, the ABS Patient Experience Survey collects data on accessibility of a range of healthcare services. Nationally, information was collected from 30,749 fully responding households in 2012–13. A customised report with NSW data was provided by the ABS.
NSW Adult Population Health Survey – This is a telephone survey of NSW people who live in private households, focused on their health status and
About this report
20bhi.nsw.gov.auThe Insights Series – Healthcare in rural, regional and remote NSW
health behaviours. From 2012 onwards mobile-only phone users were included. The target sample is approximately 1,000 persons in each health administrative area. Total sample size (completed interviews) was 15,442 in 2002 and 15,149 in 2012.
NSW Patient Survey Program
Adult Admitted Patient Survey – An ongoing postal survey, sent out monthly, focused on patients’ experiences of care in public hospitals. Survey responses were collected from 28,391 patients admitted to a public hospital in NSW in 2015.
Targeted oversampling of adult admitted patients sought to boost the number of completed surveys received from two patient groups: for cancer patients admitted to hospital in 2013 and 2014, this resulted in 6,457 completed questionnaires; and for Aboriginal patients admitted to hospital in 2014 it resulted in 2,714 completed questionnaires.
Maternity Care Survey – An ongoing postal survey, sent out monthly, every second year. Survey responses were collected from 4,739 new mothers who gave birth in NSW public hospitals in 2015.
Small and Rural Hospital Survey – An ongoing postal survey, sent out monthly, focused on patients’ experiences of care in small public hospitals across
NSW. Survey responses were collected from 6,808 patients admitted to these small public hospitals in 2015.
Outpatient Cancer Clinics Survey – A postal survey collecting the responses of people attending an outpatient cancer clinic during February or March 2015. Survey responses were collected from 3,706 outpatients.
Figure 1.12 Definition of remoteness categories and number of respondents, NSW, Sweden and Canada, 2013–14
Source: Commonwealth Fund International Health Policy Survey.
Note: Missing values: For Canada in 2013, 1,016 records were not assigned to a size of area of residence and excluded from analysis. For Sweden 19 records were excluded in 2013.
International comparators
International context is provided by data from Sweden and Canada. These countries were selected as comparators because of their similarities in terms of a modest total population, large land masses (>400,000 km2), and extensive areas that are sparsely populated. Spending per capita on healthcare overall in 2013 was $5,755 in NSW; $6,614 in Canada and $7,454 in Sweden (AU$, purchase price parity).12 Comparative data from these countries help interpret the impact that rurality has on healthcare performance across different healthcare systems and jurisdictions.
Major city (1) Inner Regional (2) Remote (3) 2013 2014
NSW Major cities Inner regionalOuter regional, remote
or very remote
1=9882=3603=176
N=1,524
1=2,2942=3693=137
N=2,800
SwedenCity/large town or suburbs of
a city/large town Small town
Village or rural location
1=1,0632=5073=823
N=2,393
1=3,1062=1,3423=2,739N=7,187
CanadaLiving in an area
with 100,000 residents or more
5,000-99,999 residents
Under 5,000 residents
1=2,3432=1,2043=849
N=4,396
1=2,7602=1,4623=1,047N=5,269

21 bhi.nsw.gov.auThe Insights Series – Healthcare in rural, regional and remote NSW
Assessing healthcare
BHI reports are based on a framework that identifies key dimensions of healthcare performance.13 Healthcare in rural, regional and remote NSW explores:
Accessibility: Healthcare, when and where needed – Are patients’ and populations’ health needs met? How easy is it for them to obtain healthcare?
Appropriateness: The right healthcare, the right way – Are evidence-based services provided in a technically proficient way? Are services delivered in ways that are responsive to patients’ expectations?
Effectiveness: Making a difference for patients – Do healthcare services address patients’ problems and improve their health?
Appendix 2 provides a summary of patient survey results by LHD.
Qualitative data
BHI commissioned the University Centre for Rural Health (UCRH) to gather qualitative data that would complement available quantitative data and enhance interpretation of any comparative results. The UCRH project gathered reflections from key informants in regional and remote health districts, collected contextual information on a series of site visits to rural areas and convened a deliberative forum with key stakeholders.
Quotes and reflections collected by the UCRH team are used throughout the report in ‘Views from the qualitative consultation’ boxes. These provide context and insights from providers of healthcare in rural, regional and remote areas of NSW.
Patient flows
The report examines changes over time in the number and proportion of patients who were hospitalised in a public hospital in their LHD of residence; in a public hospital in another LHD or state (outflows); or in a private hospital. These data should be interpreted with care. Certain types of care can only be provided in a small number of specialist settings and providing the most appropriate and safe care can mean patients have to travel outside of their LHD of residence. Additional complexity comes with trying to track changes over time where there have been significant shifts in patient need and demand for services; in models of care; as well as in local capacity and resources.
Report structure
This introductory section outlined the report’s purpose, providing background information about rural health; and summarising data sources and methods used. The main body of the report comprises four chapters, which explore differences in healthcare in NSW by remoteness.
Chapter 1 describes patients’ overall views about, and experiences of, healthcare
Chapter 2 focuses on accessibility measures
Chapter 3 focuses on appropriateness measures
Chapter 4 focuses on effectiveness measures.
While a variety of measures are included, particular attention is given to thematic areas of importance in rural areas: antenatal and maternity care; cancer care; experiences of Aboriginal patients, and patients’ experiences in smaller rural hospitals.
22bhi.nsw.gov.auThe Insights Series – Healthcare in rural, regional and remote NSW
How to interpret
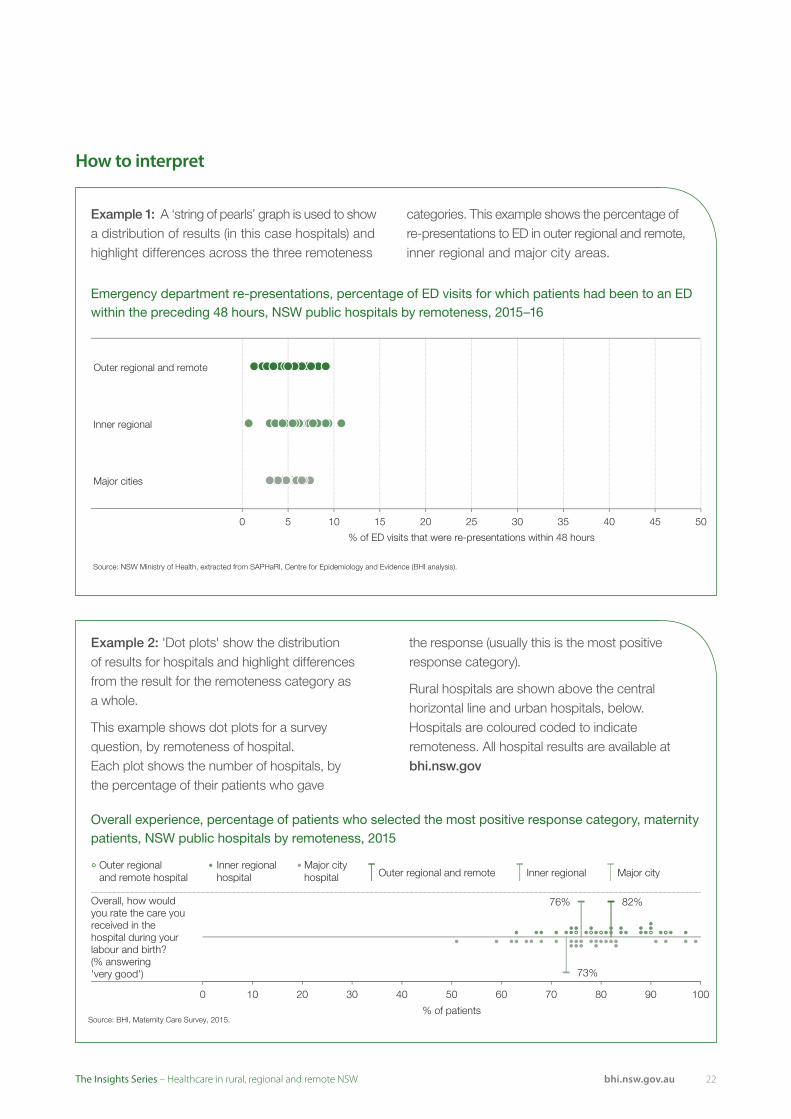
Example 2: 'Dot plots' show the distribution of results for hospitals and highlight differences from the result for the remoteness category as a whole.
This example shows dot plots for a survey question, by remoteness of hospital. Each plot shows the number of hospitals, by the percentage of their patients who gave
the response (usually this is the most positive response category).
Rural hospitals are shown above the central horizontal line and urban hospitals, below. Hospitals are coloured coded to indicate remoteness. All hospital results are available at bhi.nsw.gov
Example 1: A ‘string of pearls’ graph is used to show a distribution of results (in this case hospitals) and highlight differences across the three remoteness
categories. This example shows the percentage of re-presentations to ED in outer regional and remote, inner regional and major city areas.
Source: BHI, Maternity Care Survey, 2015.
82%76%
73%
0 10 20 30 40 50 60 70 80 90 100
% of patients
Overall, how would you rate the care you received in the hospital during your labour and birth? (% answering 'very good')
Outer regionaland remote hospital
Inner regional Major cityhospital hospital Outer regional and remote Inner regional Major city
Emergency department re-presentations, percentage of ED visits for which patients had been to an ED within the preceding 48 hours, NSW public hospitals by remoteness, 2015–16
Outer regional and remote
Inner regional
Major cities
0 5 10 15 20 25 30 35
% of ED visits that were re-presentations within 48 hours
40 45 50
Source: NSW Ministry of Health, extracted from SAPHaRI, Centre for Epidemiology and Evidence (BHI analysis).
Overall experience, percentage of patients who selected the most positive response category, maternity patients, NSW public hospitals by remoteness, 2015

23 bhi.nsw.gov.auThe Insights Series – Healthcare in rural, regional and remote NSW
24bhi.nsw.gov.auThe Insights Series – Healthcare in rural, regional and remote NSW
Overall views of healthcare
25 bhi.nsw.gov.auThe Insights Series – Healthcare in rural, regional and remote NSW
One important way to assess healthcare is to ask patients about their overall views of the healthcare system and their experiences of care.
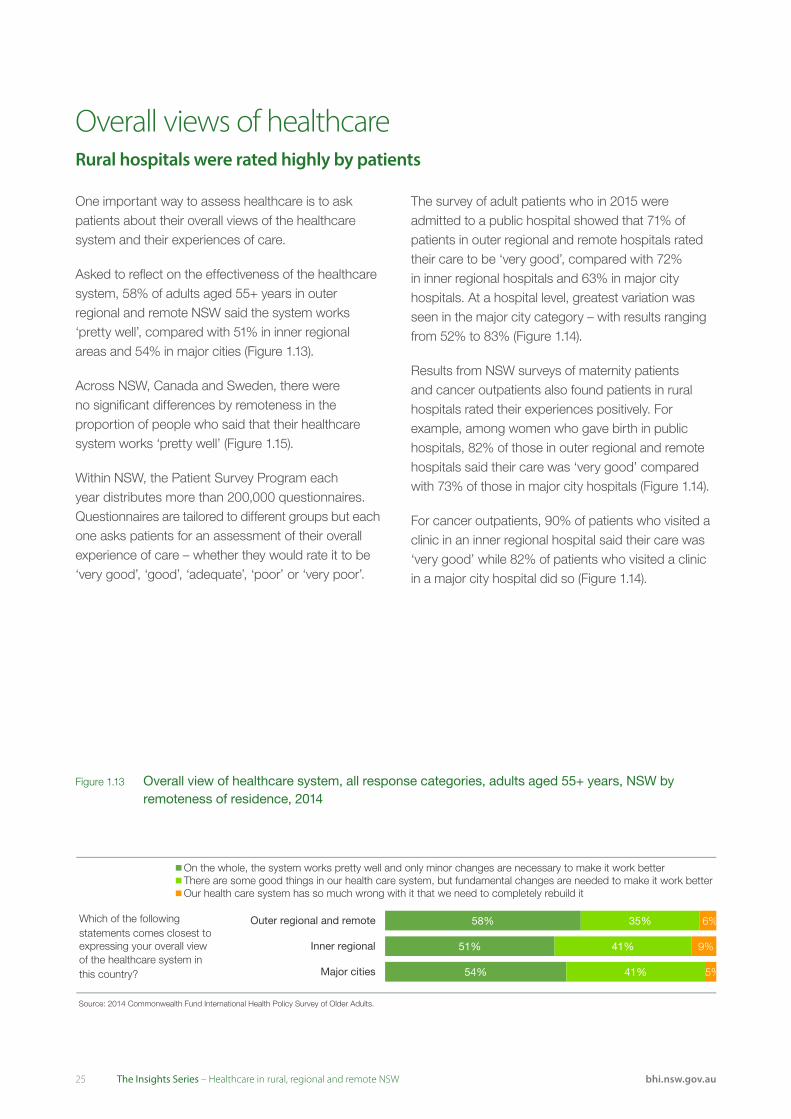
Asked to reflect on the effectiveness of the healthcare system, 58% of adults aged 55+ years in outer regional and remote NSW said the system works ‘pretty well’, compared with 51% in inner regional areas and 54% in major cities (Figure 1.13).
Across NSW, Canada and Sweden, there were no significant differences by remoteness in the proportion of people who said that their healthcare system works ‘pretty well’ (Figure 1.15).
Within NSW, the Patient Survey Program each year distributes more than 200,000 questionnaires. Questionnaires are tailored to different groups but each one asks patients for an assessment of their overall experience of care – whether they would rate it to be ‘very good’, ‘good’, ‘adequate’, ‘poor’ or ‘very poor’.
The survey of adult patients who in 2015 were admitted to a public hospital showed that 71% of patients in outer regional and remote hospitals rated their care to be ‘very good’, compared with 72% in inner regional hospitals and 63% in major city hospitals. At a hospital level, greatest variation was seen in the major city category – with results ranging from 52% to 83% (Figure 1.14).
Results from NSW surveys of maternity patients and cancer outpatients also found patients in rural hospitals rated their experiences positively. For example, among women who gave birth in public hospitals, 82% of those in outer regional and remote hospitals said their care was ‘very good’ compared with 73% of those in major city hospitals (Figure 1.14).
For cancer outpatients, 90% of patients who visited a clinic in an inner regional hospital said their care was ‘very good’ while 82% of patients who visited a clinic in a major city hospital did so (Figure 1.14).
Overall views of healthcareRural hospitals were rated highly by patients
Figure 1.13 Overall view of healthcare system, all response categories, adults aged 55+ years, NSW by remoteness of residence, 2014
Source: 2014 Commonwealth Fund International Health Policy Survey of Older Adults.
Which of the following statements comes closest to expressing your overall view of the healthcare system in this country? 54%
51%
58%
41%
41%
35%
5%
9%
6%
Major cities
Inner regional
Outer regional and remote
On the whole, the system works pretty well and only minor changes are necessary to make it work betterThere are some good things in our health care system, but fundamental changes are needed to make it work betterOur health care system has so much wrong with it that we need to completely rebuild it

26bhi.nsw.gov.auThe Insights Series – Healthcare in rural, regional and remote NSW
Figure 1.15 Overall view of healthcare system, percentage of adults aged 55+ years who selected the most positive response category, NSW, Canada and Sweden by remoteness of residence, 2014
Figure 1.14 Overall experience, percentage of patients who selected the most positive response category, adult admitted patients, rural hospital patients, maternity patients and cancer outpatients, NSW public hospitals by remoteness, 2015
NSW
Canada
Sweden
Which of the following statements comes closest to expressing your overall view of the healthcare system in this country?(% answering that the system works pretty well)
Source: 2014 Commonwealth Fund International Health Policy Survey of Older Adults.
0 10 20 30 40 50 60 70 80 90 100
% of adults
Outer regional and remote Inner regional Major cities
Source: BHI, Adult Admitted Patient Survey, 2015.
71% 72%
63%
0 10 20 30 40 50 60 70 80 90 100
% of patients
Overall, how would you rate the care you received while in hospital? (% answering 'very good')
Outer regionaland remote hospital
Inner regional Major cityhospital hospital Outer regional and remote Inner regional Major city
Source: BHI, Maternity Care Survey, 2015.
82%76%
73%
0 10 20 30 40 50 60 70 80 90 100
% of patients
Overall, how would you rate the care you received in the hospital during your labour and birth? (% answering 'very good')
Outer regionaland remote hospital
Inner regional Major cityhospital hospital Outer regional and remote Inner regional Major city
Sources: BHI, Adult Admitted Patient Survey, 2015; BHI, Small and Rural Facilities Survey, 2015; BHI, Maternity Care Survey, 2015; BHI, Outpatient Cancer Clinics Survey, 2015.
90%
82%
0 10 20 30 40 50 60 70 80 90 100
% of patients
Inner regional hospital Major city hospital
Overall, how would you rate the care you received in the cancer outpatient clinic? (% answering 'very good')
Source: BHI, Small and Rural Facilities Survey, 2015.
76% 82%
0 10 20 30 40 50 60 70 80 90 100
% of patients
Outer regional and remote hospital Inner regional hospital Major city hospital
Overall, how would you rate the care you received while in [the small] hospital? (% answering 'very good')

2727 bhi.nsw.gov.auThe Insights Series – Healthcare in rural, regional and remote NSW
AccessibilityHealthcare, when and where needed

Acc
essi
bili
ty
28bhi.nsw.gov.auThe Insights Series – Healthcare in rural, regional and remote NSW
AccessibilityHealthcare, when and where needed
2929 bhi.nsw.gov.auThe Insights Series – Healthcare in rural, regional and remote NSW
Accessibility depends upon healthcare services being provided to patients when and where they need them. Patients vary in the extent to which they are able: to recognise and identify their healthcare needs; to seek care; to reach providers; to pay for care and; to receive care that is proportionate and matched to their needs. High performing healthcare organisations and systems adapt their offer of services to respond to these relative abilities to access them.1
This means that the measurement of accessibility focuses on utilisation of services or unmet needs, timeliness and punctuality, and on perceived barriers that disrupt or prevent receipt of healthcare. Measures reflect the availability and approachability of healthcare services, and assess whether costs to patients in terms of time, effort or money are onerous or unreasonable.
AccessibilityHealthcare, when and where needed
Summary of findings
• More than nine in 10 adults aged 55+ years in NSW have a regular doctor or GP clinic and this did not differ by remoteness
• 33% of patients in outer regional and remote areas and 19% of those in inner regional areas said they had difficulties accessing healthcare
• In particular, there were unmet needs for primary care – 14% of adults in outer regional and remote areas and 15% in inner regional areas said there was an occasion in the preceding year when they needed primary care but did not receive it
• About four in 10 people said they were able to get a same day primary care appointment when needed and this proportion was similar across remoteness categories. However, 39% of people who live in outer regional and remote areas said it was very difficult to get out-of-hours medical care, compared with 33% of people in inner regional areas and 17% in major cities
• Within NSW public hospital emergency departments (EDs), median waiting times to start treatment were shortest in outer regional and remote hospitals
• Waiting times to see a specialist or for non-urgent elective surgery were longer in rural areas. While over 97% of all elective surgery was completed within clinically recommended timeframes – regardless of the remoteness of the hospital – patients treated in inner regional hospitals generally had longer waiting times than those treated in major city or in outer regional and remote hospitals
• Travel times of over 30 minutes for antenatal care occurred in both rural and urban areas. Most women accessed postnatal care in the two weeks following the birth of their baby, and this did not differ by remoteness
• In 2014–15 in most rural local health districts (LHDs), there were fewer patients who had to travel outside the district for cancer care, compared to 2004–05
• Among patients admitted to a public hospital in 2014–15, the percentage who were admitted in their LHD of residence ranged across rural LHDs from 65.8% in Far West to 91.6% in Hunter New England.

Acc
essi
bili
ty
30bhi.nsw.gov.auThe Insights Series – Healthcare in rural, regional and remote NSW
Insights from the peer reviewed literature
• Adults and children living outside major cities have poorer oral health and are less likely to have visited a dentist in the preceding 12 months 2,3
• People in outer regional and remote areas use EDs for primary care more than urban populations, and are more likely to be hospitalised for conditions considered to be potentially preventable 4
• Rural populations have inequitable access to mental health services and are more likely to consult a GP for a mental health problem rather than a mental health professional 5
• Evaluation of the Mental Health Emergency Care–Rural Access Program (telehealth) found that providing reliable remote access to specialist mental health assessment and advice while supporting providers in rural communities resulted in better outcomes for patients and services 6
• Aboriginal people presenting to rural hospitals with acute ischaemic heart disease were less likely than non-Aboriginal people to be transferred to metropolitan hospitals and if transferred were also less likely to receive coronary angiography7
• Across Australia, the highest rates of patients waiting for residential aged care were reported for those living in remote areas and for those living in areas classified to the two most disadvantaged socioeconomic status groups.8
Accessibility in a pluralist system
For most people in NSW, primary care acts as the first — and the main — source of healthcare. It is pivotal in the provision of integrated and coordinated services and plays an essential role in healthcare systems. Being able to access primary care when and where needed is an important issue for people in rural areas. NSW has a pluralist healthcare system — with responsibility for primary care services largely borne by the Commonwealth government; while the state government takes responsibility for most public hospital, mental health, community health and ambulance services. The measures in this chapter reflect on the different types of services — considering access from a patient perspective rather than from an administrative or organisational perspective focused only on state-funded care.
3131 bhi.nsw.gov.auThe Insights Series – Healthcare in rural, regional and remote NSW
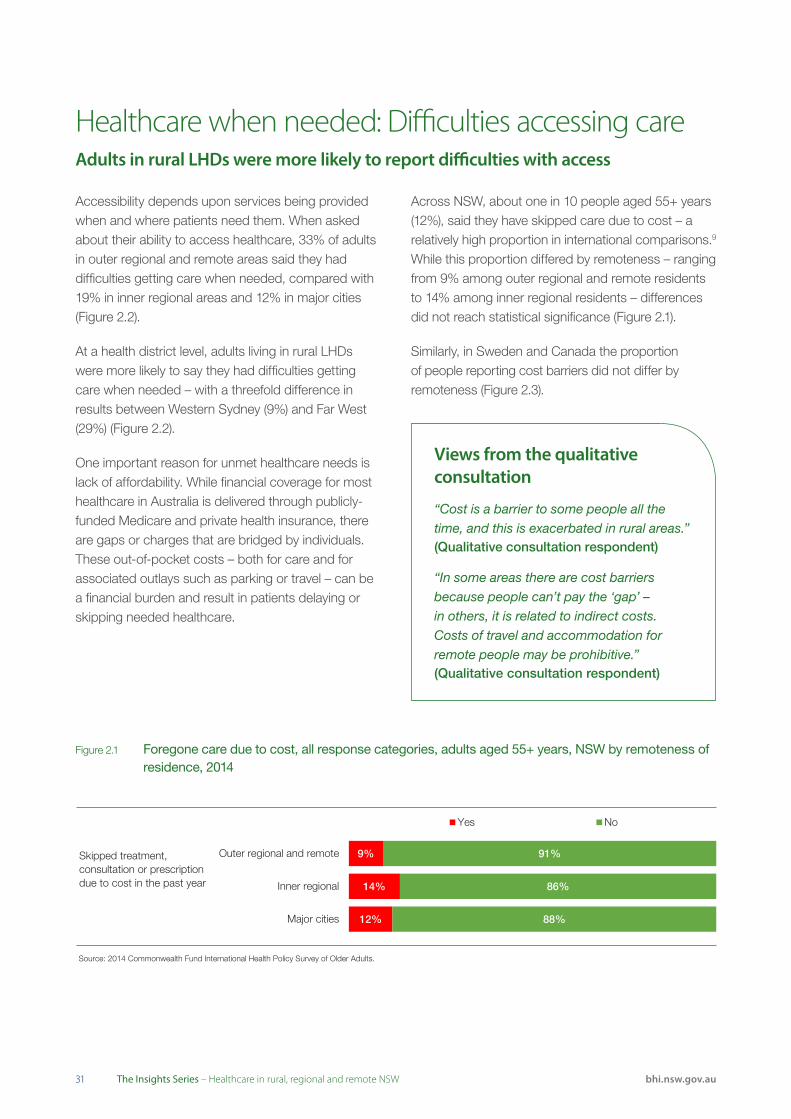
Accessibility depends upon services being provided when and where patients need them. When asked about their ability to access healthcare, 33% of adults in outer regional and remote areas said they had difficulties getting care when needed, compared with 19% in inner regional areas and 12% in major cities (Figure 2.2).
At a health district level, adults living in rural LHDs were more likely to say they had difficulties getting care when needed – with a threefold difference in results between Western Sydney (9%) and Far West (29%) (Figure 2.2).
One important reason for unmet healthcare needs is lack of affordability. While financial coverage for most healthcare in Australia is delivered through publicly-funded Medicare and private health insurance, there are gaps or charges that are bridged by individuals. These out-of-pocket costs – both for care and for associated outlays such as parking or travel – can be a financial burden and result in patients delaying or skipping needed healthcare.
Healthcare when needed: Difficulties accessing careAdults in rural LHDs were more likely to report difficulties with access
Views from the qualitative consultation
“Cost is a barrier to some people all the time, and this is exacerbated in rural areas.”(Qualitative consultation respondent)
“In some areas there are cost barriers because people can’t pay the ‘gap’ – in others, it is related to indirect costs. Costs of travel and accommodation for remote people may be prohibitive.”(Qualitative consultation respondent)
Source: 2014 Commonwealth Fund International Health Policy Survey of Older Adults.
Skipped treatment, consultation or prescription due to cost in the past year
12%
14%
9%
88%
86%
91%
Major cities
Inner regional
Outer regional and remote
Yes No
Across NSW, about one in 10 people aged 55+ years (12%), said they have skipped care due to cost – a relatively high proportion in international comparisons.9 While this proportion differed by remoteness – ranging from 9% among outer regional and remote residents to 14% among inner regional residents – differences did not reach statistical significance (Figure 2.1).
Similarly, in Sweden and Canada the proportion of people reporting cost barriers did not differ by remoteness (Figure 2.3).
Figure 2.1 Foregone care due to cost, all response categories, adults aged 55+ years, NSW by remoteness of residence, 2014

Acc
essi
bili
ty
32bhi.nsw.gov.auThe Insights Series – Healthcare in rural, regional and remote NSW
Figure 2.2 Healthcare when needed, percentage of people aged 16+ years who said they had difficulty getting care, NSW by remoteness of residence and LHD, 2012
Figure 2.3 Foregone care due to cost, percentage of adults aged 55+ years who skipped care, NSW, Canada and Sweden by remoteness of residence, 2014
Source: NSW Population Health Survey (SAPHaRI), Centre for Epidemiology and Evidence, NSW Ministry of Health.
Note: Data exclude people who said they did not need healthcare.
29
28
26
25
24
23
21
23
19
15
12
12
11
10
9
0 10 20 30 40 50 60 70 80 90 100
Far West
Western NSW
Murrumbidgee
Southern NSW
Mid North Coast
Central Coast
Northern NSW
Hunter New England
Illawarra Shoalhaven
Nepean Blue Mountains
South Eastern Sydney
Sydney
South Western Sydney
Northern Sydney
Western Sydney
% answering yes
% by LHDs Rural Urban
33% Outer
regional & remote
19% Inner
regional
12% Major cities
% by remoteness of residence
NSW
Canada
Sweden
Skipped treatment,consultation or prescriptiondue to cost in the past year(% answering 'Yes' to anyof these)
Source: 2014 Commonwealth Fund International Health Policy Survey of Older Adults.
0 10 20 30 40 50 60 70 80 90 100
% of adults
Outer regional and remote Inner regional Major cities

3333 bhi.nsw.gov.auThe Insights Series – Healthcare in rural, regional and remote NSW
Coverage – the potential to access services should they be needed, is key to accessibility. Unmet healthcare needs often reflect a lack of coverage, such as shortfalls in insurance entitlements or a lack of affiliation with a primary care provider.
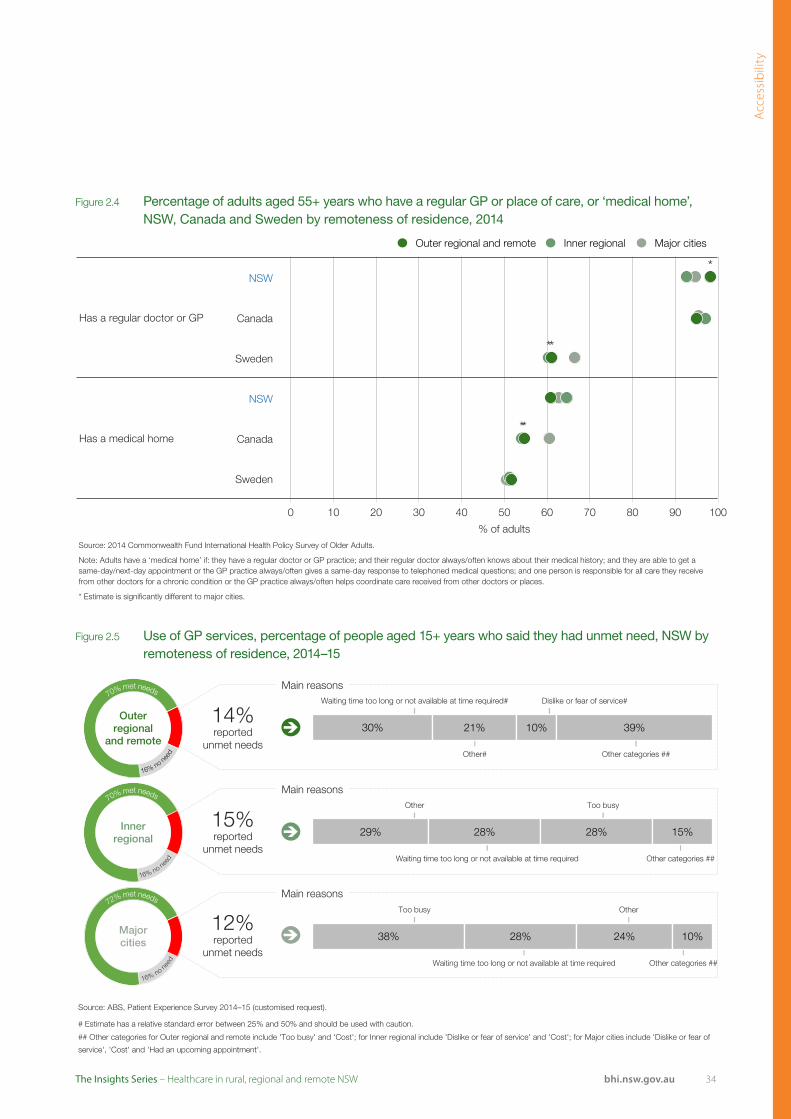
Primary care coverage is important because of the essential role played by GP practices and clinics – delivering preventive care, providing front line services for acute and chronic health problems, and acting as a gateway to the wider healthcare system. In 2014 across NSW, most adults aged 55+ years (95%) had a regular GP or clinic and patients in outer regional and remote areas were most likely to do so (98%) (Figure 2.4).
While coverage is key, it is also important to consider other characteristics of the care provided. Research has shown that primary care practices that act as a ‘medical home’ – that is, those that consistently provide continuity of care, coordinate wider healthcare services for their patients, and make care available at the time patients need it – achieve higher ratings of care, better patient engagement and improved outcomes.10
Affiliation with a medical home is measured by a score that combines patient responses to questions about the availability, continuity and coordination of care. Patients who answer positively to all of these questions are considered to have a medical home. Around six in 10 NSW patients are affiliated with a GP practice that has the hallmarks of a medical home, and this proportion did not differ with remoteness (Figure 2.4).
There is unmet need for GP services however. For example, 15% of people in inner regional areas said that on at least one occasion in the preceding year they needed to see a GP but did not do so (Figure 2.5).
Coverage for primary care ‘No difference’ by remoteness in unmet needs for primary care
Views from the qualitative consultation
“We are better off here [for primary care] than in the city – we are working toward continuity of care all the time. We don’t really have wait times. We just have a list and people are reminded to come in.”(Qualitative consultation respondent)
Improvement initiatives in NSW
HealthOne NSW Service Models provide integrated care across general practice and community health services – particularly in rural areas. The models have three key principles: multidisciplinary team care; provision of care spanning prevention to continuing care and; client and community involvement.
There are three main types of models in use across the state:
• Co-location – services located in close physical proximity
• Hub and spoke models – a core central base providing support for satellite services
• Virtual integration – providers linked by communication technologies.
Primary healthcare researchers have found that multidisciplinary integrated primary healthcare centres can improve access and integration.11 Co-location, in particular, was found to make informal communication and information sharing easier for professionals of different disciplines.
Acc
essi
bili
ty
34bhi.nsw.gov.auThe Insights Series – Healthcare in rural, regional and remote NSW
Source: ABS, Patient Experience Survey 2014–15 (customised request).
# Estimate has a relative standard error between 25% and 50% and should be used with caution.
## Other categories for Outer regional and remote include 'Too busy' and 'Cost'; for Inner regional include 'Dislike or fear of service' and 'Cost'; for Major cities include 'Dislike or fear of
service', 'Cost' and 'Had an upcoming appointment'.
Main reasons
14% reported
unmet needs
Waiting time too long or not available at time required# Dislike or fear of service#
Other#
30% 21% 10% 39% Outer
regional and remote
Main reasons
15% reported
unmet needs
Inner regional
Main reasons
12% reported
unmet needs
Major cities
Other Too busy
Waiting time too long or not available at time required
Too busy Other
Waiting time too long or not available at time required
Other categories ##
Other categories ##
Other categories ##
29% 28% 28% 15%
38% 28% 24% 10%
Figure 2.4 Percentage of adults aged 55+ years who have a regular GP or place of care, or ‘medical home’, NSW, Canada and Sweden by remoteness of residence, 2014
Figure 2.5 Use of GP services, percentage of people aged 15+ years who said they had unmet need, NSW by remoteness of residence, 2014–15
NSW
Canada
Sweden
NSW
Canada
Sweden
* Estimate is significantly different to major cities.
Has a regular doctor or GP
Has a medical home
Source: 2014 Commonwealth Fund International Health Policy Survey of Older Adults.
Note: Adults have a ‘medical home’ if: they have a regular doctor or GP practice; and their regular doctor always/often knows about their medical history; and they are able to get a same-day/next-day appointment or the GP practice always/often gives a same-day response to telephoned medical questions; and one person is responsible for all care they receive from other doctors for a chronic condition or the GP practice always/often helps coordinate care received from other doctors or places.
*
*
*
*
*
0 10 20 30 40 50 60 70 80 90 100
% of adults
Outer regional and remote Inner regional Major cities
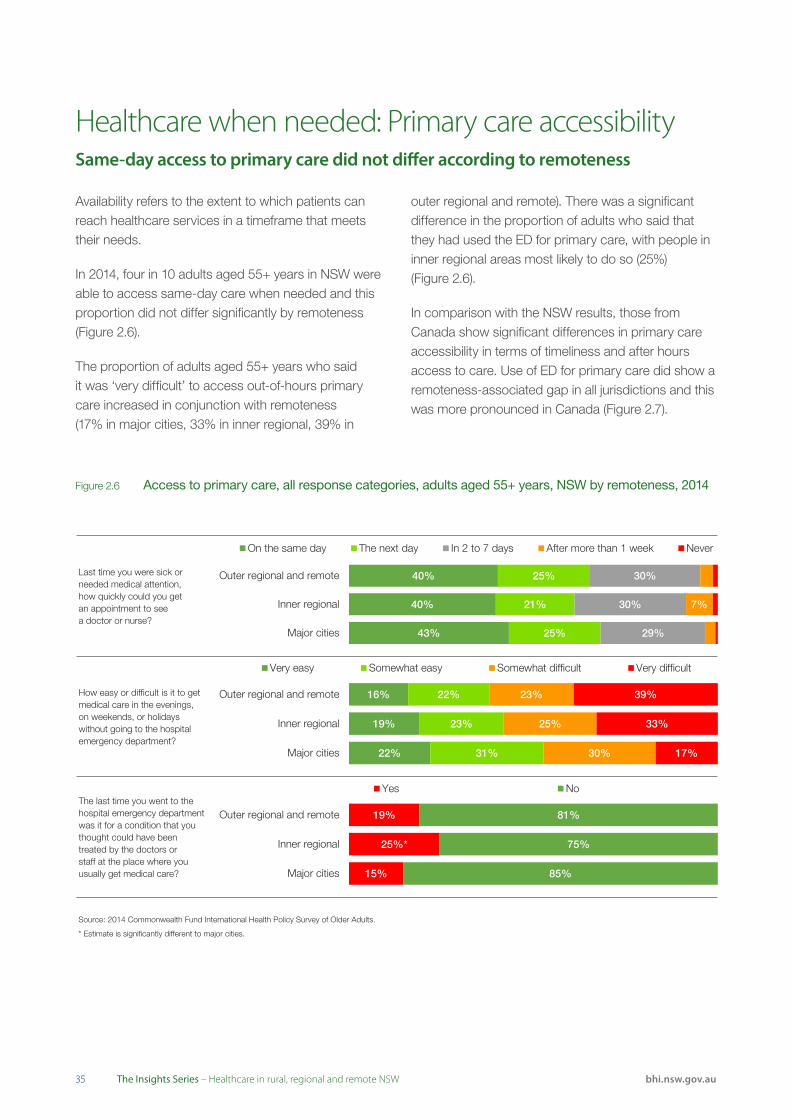
3535 bhi.nsw.gov.auThe Insights Series – Healthcare in rural, regional and remote NSW
Availability refers to the extent to which patients can reach healthcare services in a timeframe that meets their needs.
In 2014, four in 10 adults aged 55+ years in NSW were able to access same-day care when needed and this proportion did not differ significantly by remoteness (Figure 2.6).
The proportion of adults aged 55+ years who said it was ‘very difficult’ to access out-of-hours primary care increased in conjunction with remoteness (17% in major cities, 33% in inner regional, 39% in
outer regional and remote). There was a significant difference in the proportion of adults who said that they had used the ED for primary care, with people in inner regional areas most likely to do so (25%) (Figure 2.6).
In comparison with the NSW results, those from Canada show significant differences in primary care accessibility in terms of timeliness and after hours access to care. Use of ED for primary care did show a remoteness-associated gap in all jurisdictions and this was more pronounced in Canada (Figure 2.7).
Healthcare when needed: Primary care accessibility Same-day access to primary care did not differ according to remoteness
Source: 2014 Commonwealth Fund International Health Policy Survey of Older Adults.
* Estimate is significantly different to major cities.
Last time you were sick orneeded medical attention,how quickly could you getan appointment to seea doctor or nurse?
How easy or difficult is it to getmedical care in the evenings,on weekends, or holidayswithout going to the hospitalemergency department?
The last time you went to thehospital emergency departmentwas it for a condition that youthought could have beentreated by the doctors orstaff at the place where youusually get medical care?
43%
40%
40%
25%
21%
25%
29%
30%
30%
7%
Major cities
Inner regional
Outer regional and remote
On the same day The next day In 2 to 7 days After more than 1 week Never
15%
25%*
19%
85%
75%
81%
Major cities
Inner regional
Outer regional and remote
Yes No
22%
19%
16%
31%
23%
22%
30%
25%
23%
17%
33%
39%
Major cities
Inner regional
Outer regional and remote
Very easy Somewhat easy Somewhat difficult Very difficult
Figure 2.6 Access to primary care, all response categories, adults aged 55+ years, NSW by remoteness, 2014
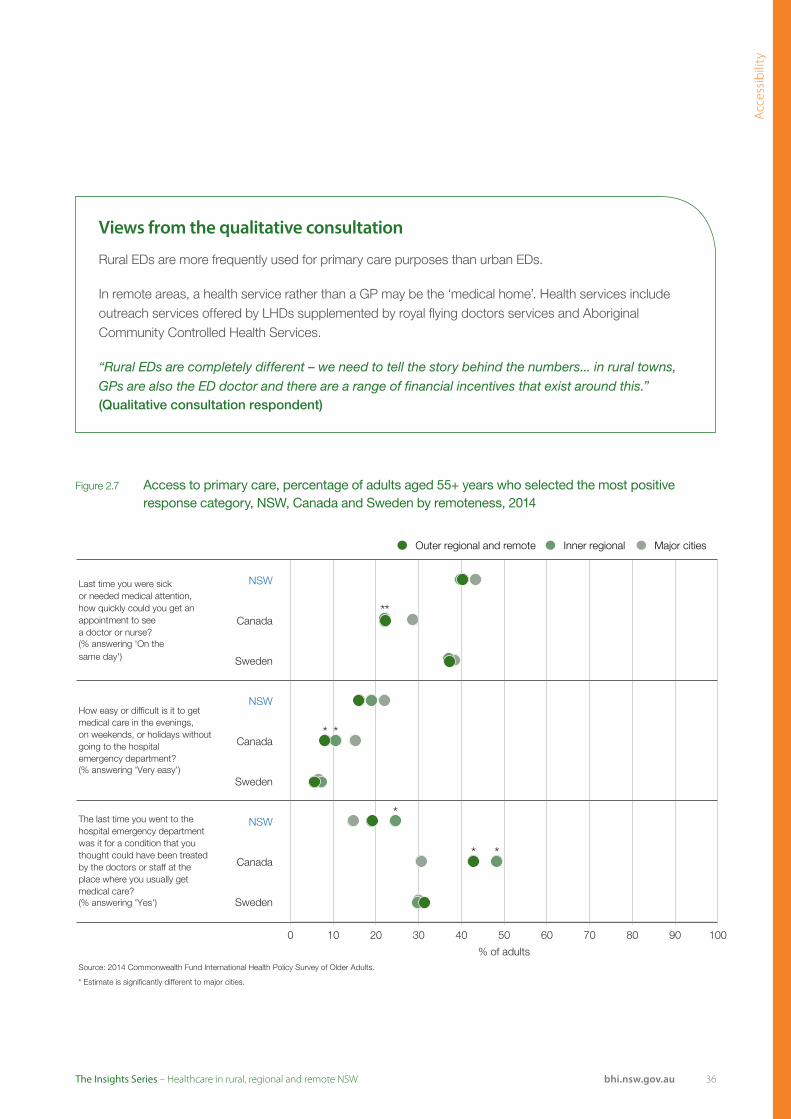
Acc
essi
bili
ty
36bhi.nsw.gov.auThe Insights Series – Healthcare in rural, regional and remote NSW
NSW
Canada
Sweden
NSW
Canada
Sweden
NSW
Canada
Sweden
* Estimate is significantly different to major cities.
Last time you were sickor needed medical attention, how quickly could you get an appointment to seea doctor or nurse?(% answering 'On the same day')
How easy or difficult is it to get medical care in the evenings, on weekends, or holidays without going to the hospital emergency department?(% answering 'Very easy')
The last time you went to the hospital emergency department was it for a condition that you thought could have been treated by the doctors or staff at the place where you usually get medical care?(% answering 'Yes')
Source: 2014 Commonwealth Fund International Health Policy Survey of Older Adults.
*
*
*
* *
*
*
0 10 20 30 40 50 60 70 80 90 100
% of adults
Outer regional and remote Inner regional Major cities
Figure 2.7 Access to primary care, percentage of adults aged 55+ years who selected the most positive response category, NSW, Canada and Sweden by remoteness, 2014
Views from the qualitative consultation
Rural EDs are more frequently used for primary care purposes than urban EDs.
In remote areas, a health service rather than a GP may be the ‘medical home’. Health services include outreach services offered by LHDs supplemented by royal flying doctors services and Aboriginal Community Controlled Health Services.
“Rural EDs are completely different – we need to tell the story behind the numbers... in rural towns, GPs are also the ED doctor and there are a range of financial incentives that exist around this.”(Qualitative consultation respondent)
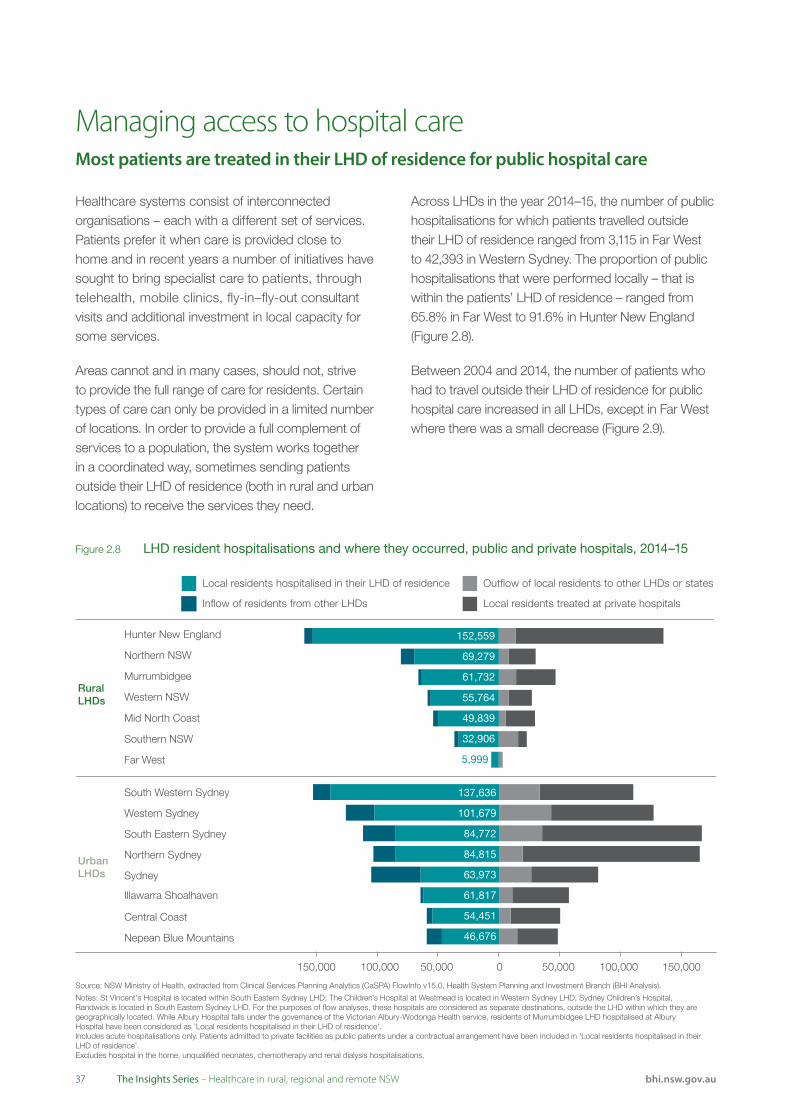
3737 bhi.nsw.gov.auThe Insights Series – Healthcare in rural, regional and remote NSW
Healthcare systems consist of interconnected organisations – each with a different set of services. Patients prefer it when care is provided close to home and in recent years a number of initiatives have sought to bring specialist care to patients, through telehealth, mobile clinics, fly-in–fly-out consultant visits and additional investment in local capacity for some services.
Areas cannot and in many cases, should not, strive to provide the full range of care for residents. Certain types of care can only be provided in a limited number of locations. In order to provide a full complement of services to a population, the system works together in a coordinated way, sometimes sending patients outside their LHD of residence (both in rural and urban locations) to receive the services they need.
Across LHDs in the year 2014–15, the number of public hospitalisations for which patients travelled outside their LHD of residence ranged from 3,115 in Far West to 42,393 in Western Sydney. The proportion of public hospitalisations that were performed locally – that is within the patients’ LHD of residence – ranged from 65.8% in Far West to 91.6% in Hunter New England (Figure 2.8).
Between 2004 and 2014, the number of patients who had to travel outside their LHD of residence for public hospital care increased in all LHDs, except in Far West where there was a small decrease (Figure 2.9).
Managing access to hospital careMost patients are treated in their LHD of residence for public hospital care
Figure 2.8 LHD resident hospitalisations and where they occurred, public and private hospitals, 2014–15
0 100,000100,000 50,00050,000 150,000150,000
Hunter New England
South Eastern Sydney
South Western Sydney
Western Sydney
Northern Sydney
Sydney
Illawarra Shoalhaven
Northern NSW
Murrumbidgee
Central Coast
Western NSW
Mid North Coast
Southern NSW
Far West
UrbanLHDs
RuralLHDs
Local residents treated at private hospitalsInflow of residents from other LHDs
Local residents hospitalised in their LHD of residence Outflow of local residents to other LHDs or states
Nepean Blue Mountains
137,636
101,679
84,772
84,815
63,973
61,817
54,451
46,676
152,559
69,279
55,764
61,732
49,839
32,906
5,999
Source: NSW Ministry of Health, extracted from Clinical Services Planning Analytics (CaSPA) FlowInfo v15.0, Health System Planning and Investment Branch (BHI Analysis).
Notes: St Vincent's Hospital is located within South Eastern Sydney LHD; The Children’s Hospital at Westmead is located in Western Sydney LHD; Sydney Children’s Hospital, Randwick is located in South Eastern Sydney LHD. For the purposes of flow analyses, these hospitals are considered as separate destinations, outside the LHD within which they are geographically located. While Albury Hospital falls under the governance of the Victorian Albury-Wodonga Health service, residents of Murrumbidgee LHD hospitalised at Albury Hospital have been considered as 'Local residents hospitalised in their LHD of residence'.Includes acute hospitalisations only. Patients admitted to private facilities as public patients under a contractual arrangement have been included in 'Local residents hospitalised in their LHD of residence'. Excludes hospital in the home, unqualified neonates, chemotherapy and renal dialysis hospitalisations.

Acc
essi
bili
ty
38bhi.nsw.gov.auThe Insights Series – Healthcare in rural, regional and remote NSW
2004–2005(LHD residents)
2014–2015(LHD residents)
Murrumbidgee 15,324 17,781 Murrumbidgee
Southern NSW 11,126 15,853 Southern NSW
Hunter New England 13,960 14,001 Hunter New England
Western NSW 8,015 8,302 Western NSW
Northern NSW 6,323 8,226 Northern NSW
Mid North Coast 5,038 5,463 Mid North Coast
Far West 3,123 3,115 Far West
Hospitalisations
Source: NSW Ministry of Health, extracted from Clinical Services Planning Analytics (CaSPA) FlowInfo v15.0, Health System Planning and Investment Branch (BHI Analysis).
Views from the qualitative consultation
Rural health services network between LHDs, across state borders, and with regional or metropolitan referral hospitals as appropriate to provide patient care. This is especially characteristic of remote services or LHDs that traverse both rural and remote areas.
The process of networking was described as being based on relationships and systems. In some cases, relationships are formalised through agreements and pathways, in other cases they happen in a more organic manner. When networks function effectively, then healthcare performance is optimised, but when they operate poorly, this impacts on service performance.
“There is a networking and infrastructure issue to consider when managing rural networks: how do you coordinate efficient services when rural communities are incredibly passionate and protective of their own communities and hospitals? You are fighting the problem of inefficiencies but at the same time you can’t underestimate the importance of a small hospital to a small community in terms of its social role. So one way to manage this is to make small hospitals part of a network.” (Qualitative consultation respondent)
Figure 2.9 Hospitalisations, number that occurred outside the patients’ LHD of residence, NSW public hospitals, 2004–05 and 2014–15
Note: The NSW Health system includes non-geographical specialty networks (e.g. St Vincent’s, Children’s Hospital Westmead). Patients admitted to a hospital in these networks are shown as outflows from their LHD of residence, despite the fact that for some patients, the network hospital is situated in their local area.

3939 bhi.nsw.gov.auThe Insights Series – Healthcare in rural, regional and remote NSW
Emergency departments (EDs) provide specialised assessment and life-saving care and are an entry point to inpatient services for acutely unwell patients. They are open to all with no coverage restrictions.
In 2013, of the NSW adults who said they visited an ED in the preceding two years, 46% waited less than 30 minutes to be treated – and this did not differ by remoteness. Results in Canada were much lower overall and Canadian patients in most rural areas were significantly more likely to report short waits than those in major cities (Figure 2.10).
While patient survey results provide information on experiences of care, they are based on a subset of all patients. Administrative data also measure timeliness, and are based on information about all ED visits. In administrative datasets, ED patients are allocated to one of five urgency (triage) categories. Each category has a defined maximum recommended time within which patients should start to receive treatment: resuscitation (within seconds); emergency (within 10 minutes); urgent (within 30 minutes); semi-urgent (within 60 minutes); and non-urgent (within 120 minutes). Hospitals with the shortest waiting times are seen in rural areas (Figures 2.11 and 2.12).
Timeliness in the emergency departmentPatients in rural areas had shorter waiting times to start treatment in the ED
.Figure 2.10 Waiting in the emergency department, percentage of adults who said they waited less than 30
minutes before being treated, NSW, Canada and Sweden by remoteness of residence, 2013
NSW
Canada
Sweden
The last time you went to the hospital ED, how long did you wait before being treated? (% answering 'Less than 30 minutes')
Source: 2013 Commonwealth Fund International Health Policy Survey.
Note: Acuity patterns of ED visits vary by rurality. In 2015, 23% of visits to outer regional and remote EDs were triage 5, compared with 15% in inner regional and 10% in major city EDs.
* Estimate is significantly different to major cities.
*
0 10 20 30 40 50 60 70 80 90 100
% of adults who used ED in past 2 years
Outer regional and remote Inner regional Major cities
Views from the qualitative consultation
Timeliness of service provision in rural EDs reflects their successful adaptation of existing service models to community needs.
The need to operate efficiently while still providing the best possible level of service to patients emerged as a central tension in rural health practice. Rural and remote healthcare providers are characterised by a lack of economies of scale and an absence of systems such as a ‘pool’ of emergency staff to call on if necessary. A certain number of resources are required to provide a minimum level of service, even when this appears to be inefficient. Rural health services demonstrate incredible flexibility and adaptation in models of service to meet the needs of rural communities such as the use of networking, hub and spokes models, service adaptations and compensatory mechanisms. This means at times refashioning the services they provide to create efficiency that is broader than the small population they might service geographically.

Acc
essi
bili
ty
40bhi.nsw.gov.auThe Insights Series – Healthcare in rural, regional and remote NSW
Outer regional and remot e hospital Inner regional hospital Major city hospital
Outer regional and remote
Inner regional
Major cities
Triage 2
Outer regional and remote
Inner regional
Major cities
Triage 3
Outer regional and remote
Inner regional
Major cities
Triage 4
Outer regional and remote
Inner regional
Major cities
Triage 5
0 10 20 30 40 50
Median time to treatment (minutes)
60 70 80
Source: NSW Ministry of Health, Emergency Department Data Collection.
Note: Time to start treatment is calculated as the difference between the visit time (the time of first recorded contact with an ED staff member, this may be at the commencement of clerical registration or of the triage process) and the commencement of clinical care (the time at which care commenced by a doctor, nurse, mental health practitioner or other health professional). Triage 1 patients are the most urgent and are almost all treated within two minutes. Clinicians treating them are focused on providing immediate and essential care, rather than recording times, therefore times to start treatment are generally not reported.
Figure 2.11 Emergency department treatment, median waiting time for treatment to start by urgency, NSW public hospitals by remoteness, 2015
Figure 2.12 Waiting in the emergency department, percentage of patients whose treatment started on time, by triage category, NSW public hospitals by remoteness, 2015
Source: NSW Ministry of Health, Emergency Department Data Collection.
Note: Time to start treatment is calculated as the difference between the visit time (the time of first recorded contact with an ED staff member, this may be at the commencement of clerical registration or of the triage process) and the commencement of clinical care (the time at which care commenced by a doctor, nurse, mental health practitioner or other health professional). Triage 1 patients are the most urgent and are almost all treated within two minutes. Clinicians treating them are focused on providing immediate and essential care, rather than recording times, therefore times to start treatment are generally not reported.
92.4
75.6
66.3
63.2
92.8
77.5
70.8
71.6
96.3
85.4
79.4
78.5
0 10 20 30 70 80 90 100
Triagecategory 5
Triagecategory 4
Triagecategory 3
Triagecategory 2
40 50 60% of patients whose treatment started on time
Outer regional and remote Inner regional Major cities
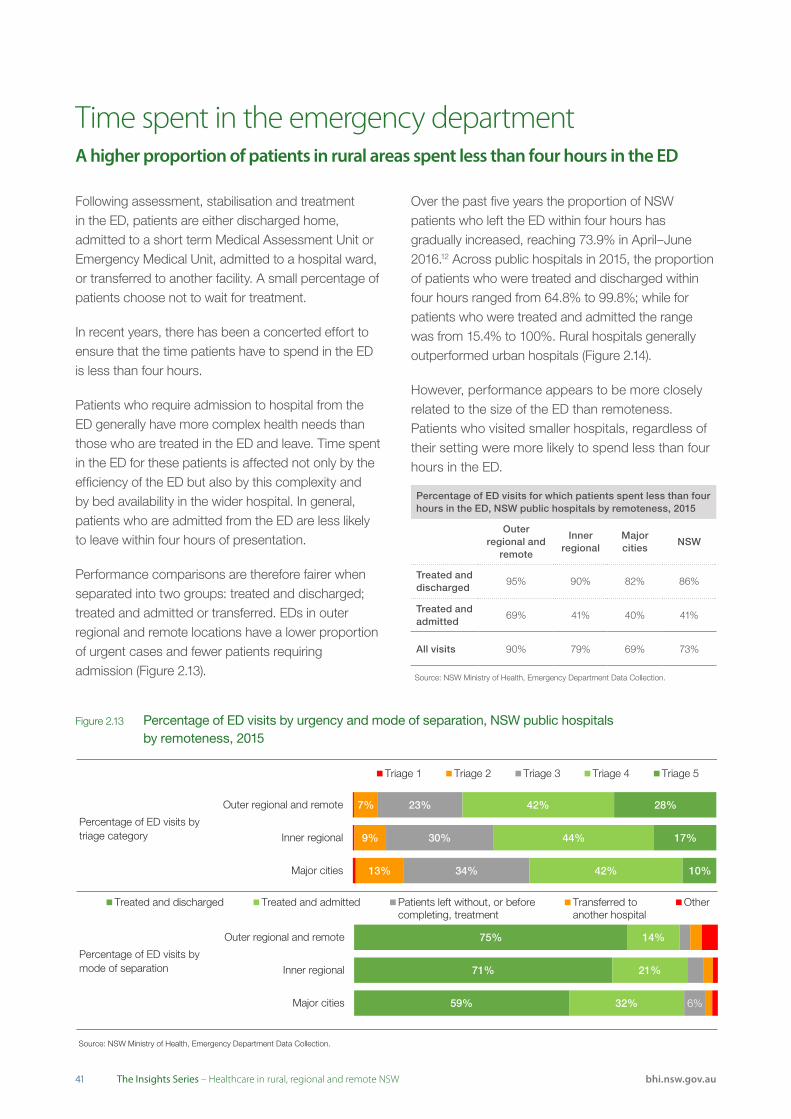
4141 bhi.nsw.gov.auThe Insights Series – Healthcare in rural, regional and remote NSW
Following assessment, stabilisation and treatment in the ED, patients are either discharged home, admitted to a short term Medical Assessment Unit or Emergency Medical Unit, admitted to a hospital ward, or transferred to another facility. A small percentage of patients choose not to wait for treatment.
In recent years, there has been a concerted effort to ensure that the time patients have to spend in the ED is less than four hours.
Patients who require admission to hospital from the ED generally have more complex health needs than those who are treated in the ED and leave. Time spent in the ED for these patients is affected not only by the efficiency of the ED but also by this complexity and by bed availability in the wider hospital. In general, patients who are admitted from the ED are less likely to leave within four hours of presentation.
Performance comparisons are therefore fairer when separated into two groups: treated and discharged; treated and admitted or transferred. EDs in outer regional and remote locations have a lower proportion of urgent cases and fewer patients requiring admission (Figure 2.13).
Over the past five years the proportion of NSW patients who left the ED within four hours has gradually increased, reaching 73.9% in April–June 2016.12 Across public hospitals in 2015, the proportion of patients who were treated and discharged within four hours ranged from 64.8% to 99.8%; while for patients who were treated and admitted the range was from 15.4% to 100%. Rural hospitals generally outperformed urban hospitals (Figure 2.14).
However, performance appears to be more closely related to the size of the ED than remoteness. Patients who visited smaller hospitals, regardless of their setting were more likely to spend less than four hours in the ED.
Time spent in the emergency departmentA higher proportion of patients in rural areas spent less than four hours in the ED
Source: NSW Ministry of Health, Emergency Department Data Collection.
Percentage of ED visits by mode of separation
59%
71%
75%
32%
21%
14%
6% Major cities
Inner regional
Outer regional and remote
Treated and discharged Treated and admitted Patients left without, or beforecompleting, treatment
Transferred toanother hospital
OtherSource: NSW Ministry of Health, Emergency Department Data Collection.
Percentage of ED visits by triage category
13%
9%
7%
34%
30%
23%
42%
44%
42%
10%
17%
28%
Major cities
Inner regional
Outer regional and remote
Triage 1 Triage 2 Triage 3 Triage 4 Triage 5
Figure 2.13 Percentage of ED visits by urgency and mode of separation, NSW public hospitals by remoteness, 2015
Percentage of ED visits for which patients spent less than four hours in the ED, NSW public hospitals by remoteness, 2015
Outer regional and
remote
Inner regional
Major cities
NSW
Treated and discharged
95% 90% 82% 86%
Treated and admitted
69% 41% 40% 41%
All visits 90% 79% 69% 73%
Source: NSW Ministry of Health, Emergency Department Data Collection.

Acc
essi
bili
ty
42bhi.nsw.gov.auThe Insights Series – Healthcare in rural, regional and remote NSW
Outer regional and remote hospital Inner regional hospital Major city hospital
100
80
60
40
20
00 20,000 40,000 60,000 80,000 100,000
Number of visits
% o
f vis
its w
ithin
four
hou
rs
Outer regional and remote hospital Inner regional hospital Major city hospital
100
80
60
40
20
00 20,000 40,000 60,000 80,000 100,000
Number of visits
Source: NSW Ministry of Health, Emergency Department Data Collection.
% o
f vis
its w
ithin
four
hou
rs
A. ED visits for which patients were treated and discharged
B. ED visits for which patients were treated and admitted to hospital
Figure 2.14 Percentage of ED visits for which patients spent less than four hours in the ED, patients who were treated and discharged and patients who were treated and admitted, NSW public hospitals by remoteness, 2015
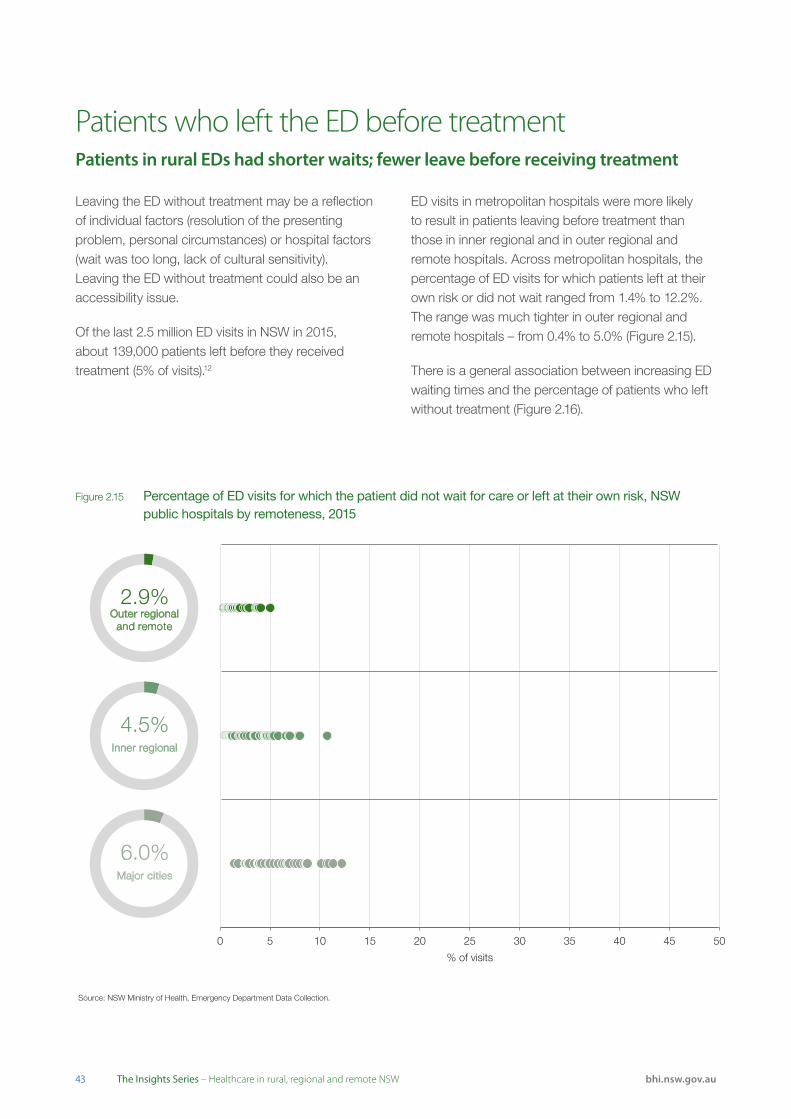
4343 bhi.nsw.gov.auThe Insights Series – Healthcare in rural, regional and remote NSW
Leaving the ED without treatment may be a reflection of individual factors (resolution of the presenting problem, personal circumstances) or hospital factors (wait was too long, lack of cultural sensitivity). Leaving the ED without treatment could also be an accessibility issue.
Of the last 2.5 million ED visits in NSW in 2015, about 139,000 patients left before they received treatment (5% of visits).12
ED visits in metropolitan hospitals were more likely to result in patients leaving before treatment than those in inner regional and in outer regional and remote hospitals. Across metropolitan hospitals, the percentage of ED visits for which patients left at their own risk or did not wait ranged from 1.4% to 12.2%. The range was much tighter in outer regional and remote hospitals – from 0.4% to 5.0% (Figure 2.15).
There is a general association between increasing ED waiting times and the percentage of patients who left without treatment (Figure 2.16).
Patients who left the ED before treatment Patients in rural EDs had shorter waits; fewer leave before receiving treatment
2.9% Outer regional
and remote
4.5% Inner regional
6.0% Major cities
0 5 10 15 20 25 30 35 40 45 50
% of visits
Source: NSW Ministry of Health, Emergency Department Data Collection.
Figure 2.15 Percentage of ED visits for which the patient did not wait for care or left at their own risk, NSW public hospitals by remoteness, 2015
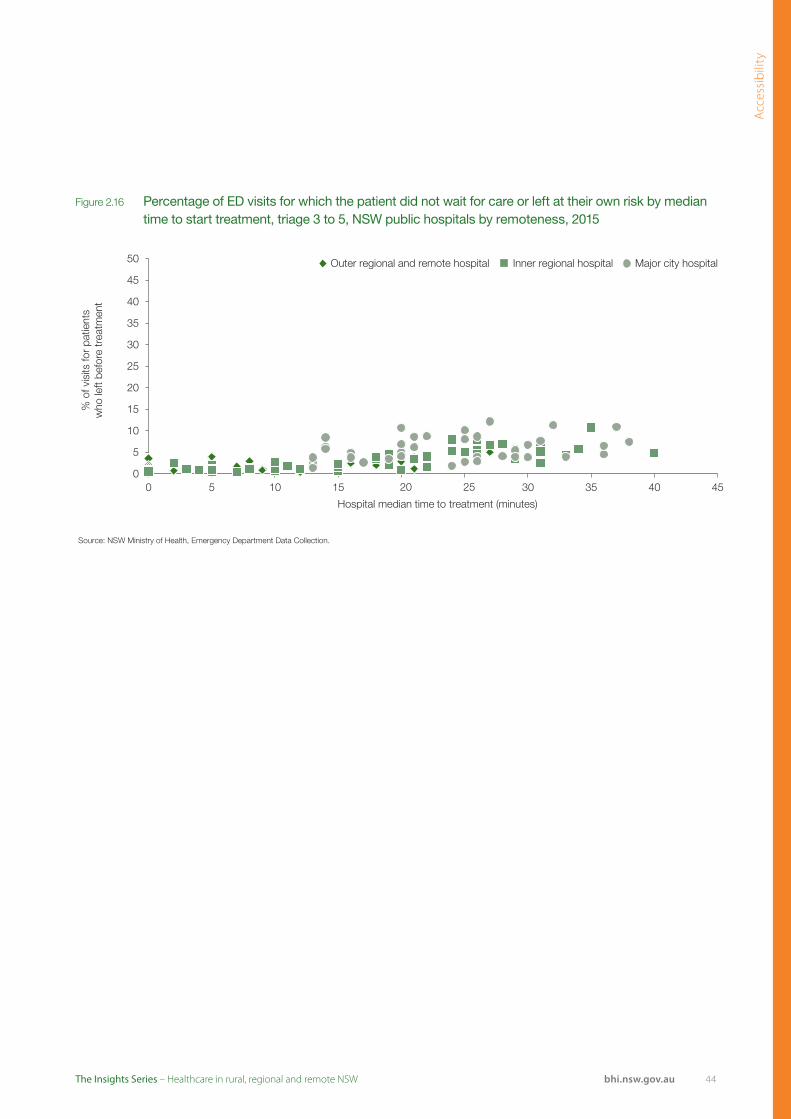
Acc
essi
bili
ty
44bhi.nsw.gov.auThe Insights Series – Healthcare in rural, regional and remote NSW
50 Outer regional and remote hospital Inner regional hospital Major city hospital
45
40
35
30
25
20
15
10
5
00 5 10 15 20 25
Hospital median time to treatment (minutes)
30 35 40 45
Source: NSW Ministry of Health, Emergency Department Data Collection.
% o
f vis
its fo
r p a
tient
sw
ho le
ft be
fore
trea
tmen
t
Figure 2.16 Percentage of ED visits for which the patient did not wait for care or left at their own risk by median time to start treatment, triage 3 to 5, NSW public hospitals by remoteness, 2015
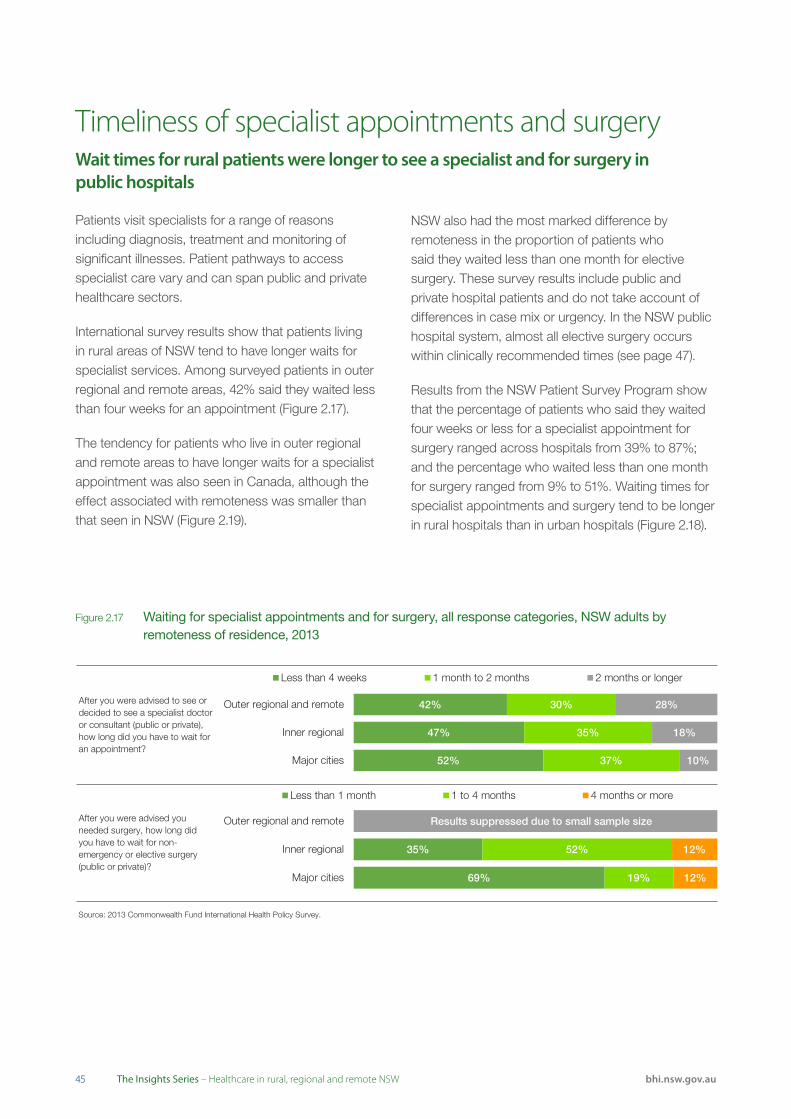
4545 bhi.nsw.gov.auThe Insights Series – Healthcare in rural, regional and remote NSW
Timeliness of specialist appointments and surgery Wait times for rural patients were longer to see a specialist and for surgery in public hospitals
Source: 2013 Commonwealth Fund International Health Policy Survey.
After you were advised to see or decided to see a specialist doctor or consultant (public or private), how long did you have to wait for an appointment?
After you were advised you needed surgery, how long did you have to wait for non-emergency or elective surgery (public or private)?
52%
47%
42%
37%
35%
30%
10%
18%
28%
Major cities
Inner regional
Outer regional and remote
Less than 4 weeks 1 month to 2 months 2 months or longer
69%
35%
19%
52%
12%
12%
Major cities
Inner regional
Outer regional and remote
Less than 1 month 1 to 4 months 4 months or more
Results suppressed due to small sample size
Figure 2.17 Waiting for specialist appointments and for surgery, all response categories, NSW adults by remoteness of residence, 2013
Patients visit specialists for a range of reasons including diagnosis, treatment and monitoring of significant illnesses. Patient pathways to access specialist care vary and can span public and private healthcare sectors.
International survey results show that patients living in rural areas of NSW tend to have longer waits for specialist services. Among surveyed patients in outer regional and remote areas, 42% said they waited less than four weeks for an appointment (Figure 2.17).
The tendency for patients who live in outer regional and remote areas to have longer waits for a specialist appointment was also seen in Canada, although the effect associated with remoteness was smaller than that seen in NSW (Figure 2.19).
NSW also had the most marked difference by remoteness in the proportion of patients who said they waited less than one month for elective surgery. These survey results include public and private hospital patients and do not take account of differences in case mix or urgency. In the NSW public hospital system, almost all elective surgery occurs within clinically recommended times (see page 47).
Results from the NSW Patient Survey Program show that the percentage of patients who said they waited four weeks or less for a specialist appointment for surgery ranged across hospitals from 39% to 87%; and the percentage who waited less than one month for surgery ranged from 9% to 51%. Waiting times for specialist appointments and surgery tend to be longer in rural hospitals than in urban hospitals (Figure 2.18).

Acc
essi
bili
ty
46bhi.nsw.gov.auThe Insights Series – Healthcare in rural, regional and remote NSW
Outer regional and remote Inner regional Major cities
NSWAfter you were advised to see or decided to see a specialist doctor or consultant (public or private), how long did you have to wait for an appointment? (% answering 'Less than 4 weeks')
Canada
Sweden
* NSW
After you were advised you needed surgery, how long did you have to wait for non-emergency or elective surgery (public or private)? (% answering 'Less than 1 month')
Canada
Sweden
0 10 20 30 40 50 60 70 80 90 100
% of adults
Source: 2013 Commonwealth Fund International Health Policy Survey.
Note: Results for NSW outer regional and remote are suppressed due to small sample size.
* Estimate is significantly different to major cities.
Source: BHI, Adult Admitted Patient Survey, 2015.
58% 58%
65%
0 10 20 30 40 50 60 70 80 90 100
% of patients
Thinking back to when you first tried to book an appointment with a specialist, how long did you have to wait to see that specialist? (% answering 'Four weeks or less')
Outer regionaland remote hospital
Inner regional Major cityhospital hospital Outer regional and remote Inner regional Major city
25% 23%
31%
0 10 20 30 40 50 60 70 80 90 100
From the time a specialist said you needed the operation or surgical procedure, how long did you have to wait to be admitted to hospital? (% answering 'Less than 1 month')
% of patients who waited 4 weeks or less
Source: BHI, Adult Admitted Patient Survey, 2015.
Note: These questions were only completed by patients who had a planned operation or surgical procedure.
Outer regionaland remote hospital
Inner regional Major cityhospital hospital Outer regional and remote Inner regional Major city
Figure 2.18 Waiting for specialist appointment before surgery, and for admission to hospital, percentage of patients who said they waited less than four weeks, NSW public hospitals by remoteness, 2015
Figure 2.19 Waiting for specialist appointments and for surgery, percentage of adults who selected the most positive response category, NSW, Canada and Sweden by remoteness of residence, 2013
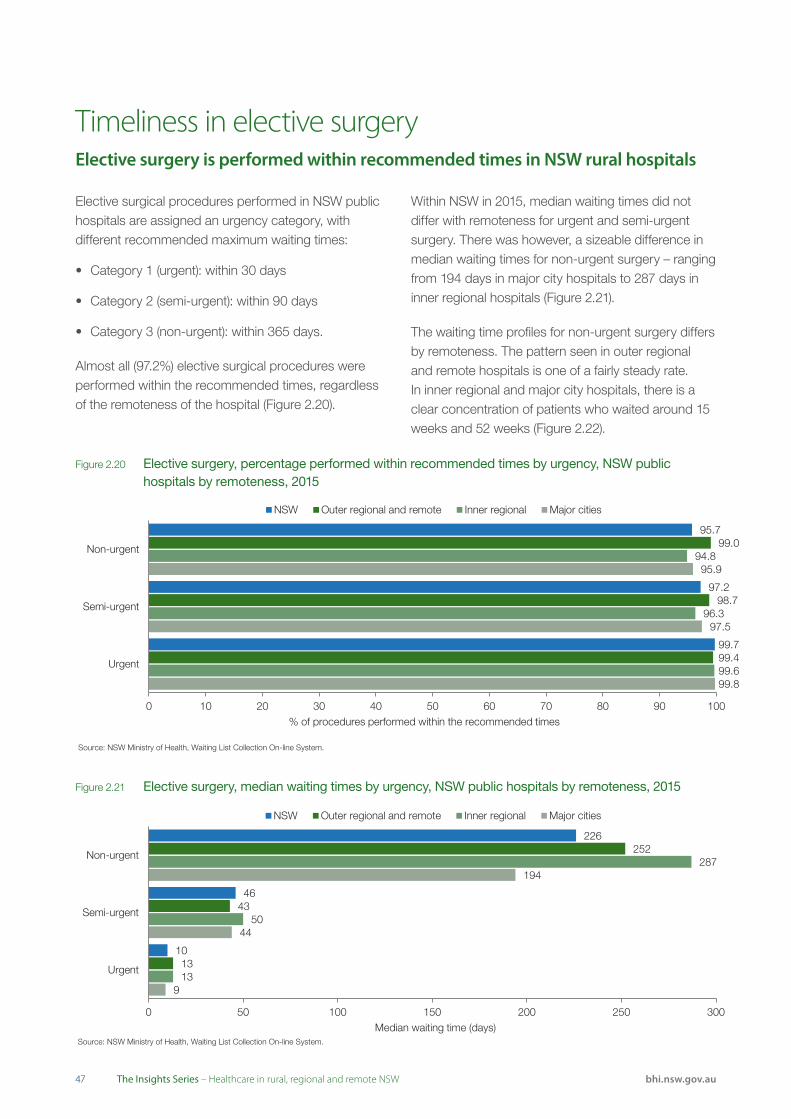
4747 bhi.nsw.gov.auThe Insights Series – Healthcare in rural, regional and remote NSW
Elective surgical procedures performed in NSW public hospitals are assigned an urgency category, with different recommended maximum waiting times:
• Category 1 (urgent): within 30 days
• Category 2 (semi-urgent): within 90 days
• Category 3 (non-urgent): within 365 days.
Almost all (97.2%) elective surgical procedures were performed within the recommended times, regardless of the remoteness of the hospital (Figure 2.20).
Within NSW in 2015, median waiting times did not differ with remoteness for urgent and semi-urgent surgery. There was however, a sizeable difference in median waiting times for non-urgent surgery – ranging from 194 days in major city hospitals to 287 days in inner regional hospitals (Figure 2.21).
The waiting time profiles for non-urgent surgery differs by remoteness. The pattern seen in outer regional and remote hospitals is one of a fairly steady rate. In inner regional and major city hospitals, there is a clear concentration of patients who waited around 15 weeks and 52 weeks (Figure 2.22).
Timeliness in elective surgeryElective surgery is performed within recommended times in NSW rural hospitals
Source: NSW Ministry of Health, Waiting List Collection On-line System.
9
44
194
13
50
287
13
43
252
10
46
226
0 50 100 150 200 250 300
Urgent
Semi-urgent
Non-urgent
Median waiting time (days)
NSW Outer regional and remote Inner regional Major cities
Source: NSW Ministry of Health, Waiting List Collection On-line System.
99.8
97.5
95.9
99.6
96.3
94.8
99.4
98.7
99.0
99.7
97.2
95.7
0 10 20 30 40 50 60 70 80 90 100
Urgent
Semi-urgent
Non-urgent
% of procedures performed within the recommended times
NSW Outer regional and remote Inner regional Major cities
Figure 2.21 Elective surgery, median waiting times by urgency, NSW public hospitals by remoteness, 2015
Figure 2.20 Elective surgery, percentage performed within recommended times by urgency, NSW public hospitals by remoteness, 2015
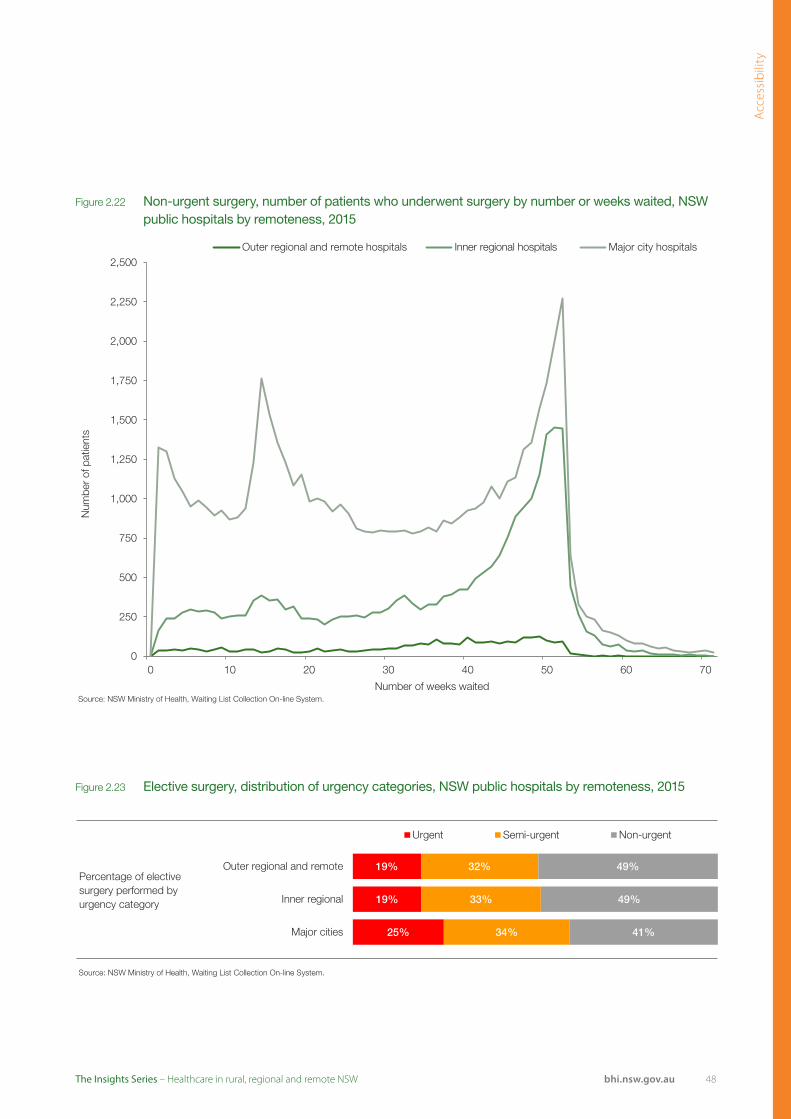
Acc
essi
bili
ty
48bhi.nsw.gov.auThe Insights Series – Healthcare in rural, regional and remote NSW
Source: NSW Ministry of Health, Waiting List Collection On-line System.
0
250
500
750
1,000
1,250
1,500
1,750
2,000
2,250
2,500
0 10 20 30 40 50 60 70
Num
ber o
f pat
ient
s
Number of weeks waited
Outer regional and remote hospitals Inner regional hospitals Major city hospitals
Figure 2.22 Non-urgent surgery, number of patients who underwent surgery by number or weeks waited, NSW public hospitals by remoteness, 2015
Figure 2.23 Elective surgery, distribution of urgency categories, NSW public hospitals by remoteness, 2015
Source: NSW Ministry of Health, Waiting List Collection On-line System.
Percentage of elective surgery performed by urgency category
25%
19%
19%
34%
33%
32%
41%
49%
49%
Major cities
Inner regional
Outer regional and remote
Urgent Semi-urgent Non-urgent
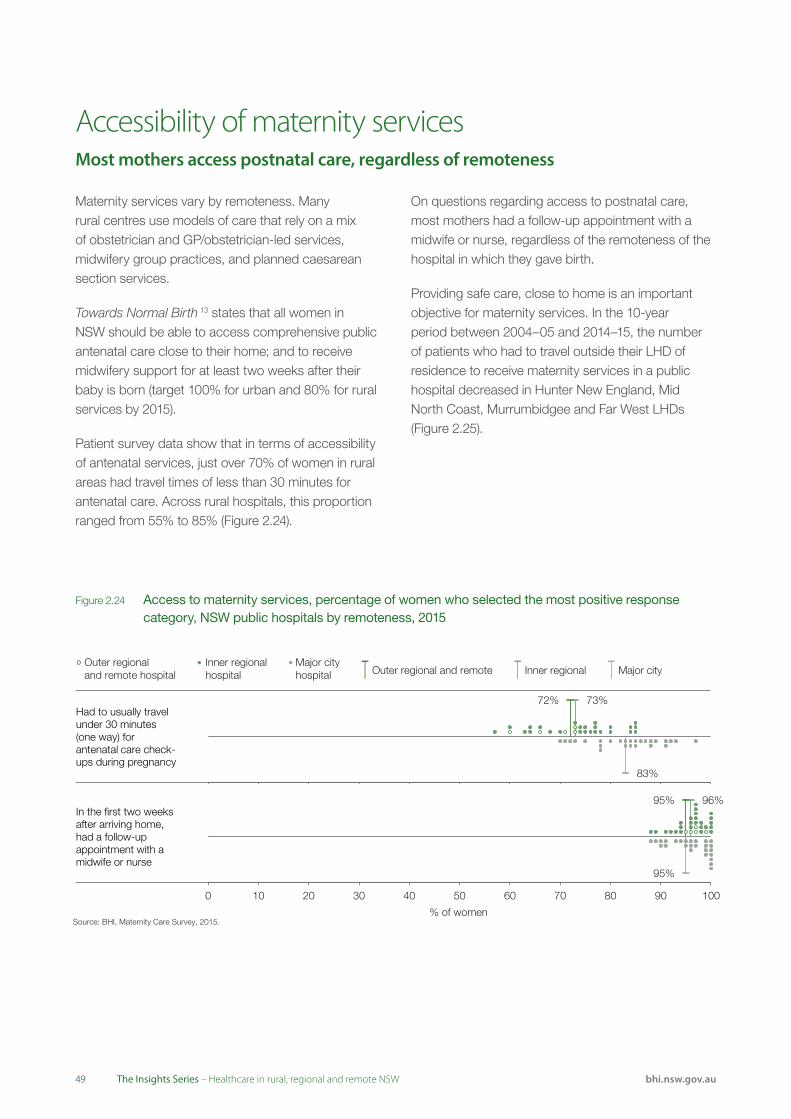
4949 bhi.nsw.gov.auThe Insights Series – Healthcare in rural, regional and remote NSW
Accessibility of maternity servicesMost mothers access postnatal care, regardless of remoteness
Maternity services vary by remoteness. Many rural centres use models of care that rely on a mix of obstetrician and GP/obstetrician-led services, midwifery group practices, and planned caesarean section services.
Towards Normal Birth 13 states that all women in NSW should be able to access comprehensive public antenatal care close to their home; and to receive midwifery support for at least two weeks after their baby is born (target 100% for urban and 80% for rural services by 2015).
Patient survey data show that in terms of accessibility of antenatal services, just over 70% of women in rural areas had travel times of less than 30 minutes for antenatal care. Across rural hospitals, this proportion ranged from 55% to 85% (Figure 2.24).
On questions regarding access to postnatal care, most mothers had a follow-up appointment with a midwife or nurse, regardless of the remoteness of the hospital in which they gave birth.
Providing safe care, close to home is an important objective for maternity services. In the 10-year period between 2004–05 and 2014–15, the number of patients who had to travel outside their LHD of residence to receive maternity services in a public hospital decreased in Hunter New England, Mid North Coast, Murrumbidgee and Far West LHDs (Figure 2.25).
Figure 2.24 Access to maternity services, percentage of women who selected the most positive response category, NSW public hospitals by remoteness, 2015
Source: BHI, Maternity Care Survey, 2015.
95% 96%
95%
0 10 20 30 40 50 60 70 80 90 100
% of women
In the first two weeks after arriving home, had a follow-up appointment with a midwife or nurse
Outer regionaland remote hospital
Inner regional Major cityhospital hospital Outer regional and remote Inner regional Major city
Source: BHI, Maternity Care Survey, 2015.
72% 73%
83%
0 10 20 30 40 50 60 70 80 90 100
% of patients
Had to usually travel under 30 minutes (one way) for antenatal care check-ups during pregnancy
Outer regionaland remote hospital
Inner regional Major cityhospital hospital Outer regional and remote Inner regional Major city

Acc
essi
bili
ty
50bhi.nsw.gov.auThe Insights Series – Healthcare in rural, regional and remote NSW
Figure 2.25 Maternity hospitalisations, number that occurred outside the patients’ LHD of residence, NSW public hospitals, 2004–05 and 2014–15
2004–2005(LHD residents)
2014–2015(LHD residents)
Murrumbidgee 1,862 1,779 Murrumbidgee
Hunter New England 757 407 Hunter New England
Southern NSW 727 972 Southern NSW
Western NSW 490 523 Western NSW
Far West 270 229 Far West
Mid North Coast 219 199 Mid North Coast
Northern NSW 214 275 Northern NSW
Hospitalisations
Source: NSW Ministry of Health, extracted from Clinical Services Planning Analytics (CaSPA) FlowInfo v15.0, Health System Planning and Investment Branch (BHI Analysis).
Notes: St Vincent's Hospital is located within South Eastern Sydney LHD; The Children’s Hospital at Westmead is located in Western Sydney LHD; Sydney Children’s Hospital, Randwick is located in South Eastern Sydney LHD. For the purposes of flow analyses, these hospitals are considered as separate destinations, outside the LHD within which they are geographically located. While Albury Hospital falls under the governance of the Victorian Albury-Wodonga Health service, residents of Murrumbidgee LHD hospitalised at Albury Hospital have been considered as 'Local residents hospitalised in their LHD of residence'.Includes public acute hospitalisations with ARDRG code 7.0: Pregnancy, Childbirth and Puerperium. Excludes hospital in the home, unqualified neonates, chemotherapy and renal dialysis hospitalisations.
Policies implemented in NSW
Mullumbimby Community Birthing Service in Northern NSW is a publicly-funded homebirth model of care that offers women a safe option to birth at home supported by skilled midwives. It also supports their right to choose where they will give birth.
High Risk Maternal Fetal Outreach Clinic in Moree delivers care to a high risk obstetric population. A visiting team from Newcastle (John Hunter Hospital) comprises:
• Maternal Fetal Medicine Specialist
• Obstetrics and Gynaecology (O&G) Senior Registrar
• Clinical Midwifery Consultant – High Risk
• Neonatal ICU Nurse Specialist
• Aboriginal Maternal and Infant Health Service (AMIHS) Manager
• Supported by the local team members including midwife, Aboriginal Health Worker, ultrasound sonographer (private), social worker.
Travel savings for the women and their families were estimated to be 90,100 km (1,000 km round trip to and from Newcastle from Moree; and 550 km round trip to and from Tamworth from Moree).

5151 bhi.nsw.gov.auThe Insights Series – Healthcare in rural, regional and remote NSW
Accessibility of cancer servicesFewer patients have to travel outside their LHD of residence to receive cancer care
For almost 20 years, poorer cancer survival in rural areas has been well documented. There are disparities between rural and urban patients in cancer outcomes, in particular in oesophageal cancer and melanoma mortality rates – although no differences in breast cancer mortality rates.14
Historically, rural and remote cancer patients have been more likely to experience diagnostic delays and lower rates of early detection. This has been attributed to a lack of diagnostic facilities such as computed tomography scanning and tissue biopsy services. As a result, there has been a concerted effort to improve cancer services for people living in rural and remote areas of NSW.
Compared with 2004–05, the number of patients who in 2014–15 had to travel outside their LHD of residence to receive cancer services in a public hospital decreased in Northern NSW, Southern NSW, Hunter New England, Mid North Coast and Western LHDs. In contrast, this number increased in Murrumbidgee and Far West LHDs (Figure 2.26).
A significant proportion of cancer care is provided in outpatient clinics. Patient survey data show that accessibility and timeliness of care varies across NSW (Figure 2.27).
Figure 2.26 Cancer hospitalisations, number that occurred outside the patients’ LHD of residence, NSW public hospitals, 2004–05 and 2014–15
2004–2005(LHD residents)
2014–2015(LHD residents)
Murrumbidgee 320 456 Murrumbidgee
Southern NSW 317 223 Southern NSW
Hunter New England 244 201 Hunter New England
Western NSW 244 187 Western NSW
Mid North Coast 219 148 Mid North Coast
Northern NSW 196 141 Northern NSW
Far West 20 63 Far West
Hospitalisations
Source: NSW Ministry of Health, extracted from Clinical Services Planning Analytics (CaSPA) FlowInfo v15.0, Health System Planning and Investment Branch (BHI Analysis).
Note: St Vincent's Hospital is located within South Eastern Sydney LHD; The Children’s Hospital at Westmead is located in Western Sydney LHD; Sydney Children’s Hospital, Randwick is located in South Eastern Sydney LHD. For the purposes of flow analyses, these hospitals are considered as separate destinations, outside the LHD within which they are geographically located. While Albury Hospital falls under the governance of the Victorian Albury-Wodonga Health service, residents of Murrumbidgee LHD hospitalised at Albury Hospital have been considered as 'Local residents hospitalised in their LHD of residence'.Includes public acute hospitalisations with ARDRG code 7.0: Neoplastic disorder. Excludes hospital in the home, unqualified neonates, chemotherapy and renal dialysis hospitalisations.
Views from the qualitative consultation
“This has been a ‘golden period’ for replacing numerous outdated hospital buildings and the introduction of new services such as medical oncology, haematology, radiation oncology, ...and some types of diagnostic imaging services. This investment [can be measured] by the changes in patient flows in a 10-15 year period.”(Qualitative consultation respondent)

Acc
essi
bili
ty
52bhi.nsw.gov.auThe Insights Series – Healthcare in rural, regional and remote NSW
Figure 2.27 Accessibility of cancer services, percentage of patients who selected the most positive response category, NSW public hospitals by remoteness, 2015
Source: BHI, Outpatient Cancer Clinics Survey, 2015.
99%
98%
0 10 20 30 40 50 60 70 80 90 100
% of patients
Inner regional Major cityhospital hospital Inner regional Major city
Able to get an appointment time that suited them
Source: BHI, Outpatient Cancer Clinics Survey, 2015.
48%
55%
0 10 20 30 40 50 60 70 80 90 100
% of patients
Inner regional Major cityhospital hospital Inner regional Major city
Travelled 'less than 30 minutes' to get to the clinic
Source: BHI, Outpatient Cancer Clinics Survey, 2015.
92%
92%
0 10 20 30 40 50 60 70 80 90 100
% of patients
Inner regional Major cityhospital hospital Inner regional Major city
Time waited for appointment was 'about right'
Source: BHI, Outpatient Cancer Clinics Survey, 2015.
64%
53%
0 10 20 30 40 50 60 70 80 90 100
% of patients
Inner regional Major cityhospital hospital Inner regional Major city
Had no out-of-pocket expenses in relation to visit
Policies implemented in NSW
The NSW Cancer Plan (2016)15 seeks to improve cancer outcomes across the community, but focuses particularly on communities at higher risk of cancers and those who experience poorer outcomes. It reiterates initiatives developed under the NSW Rural Health Plan: Towards 202116, including:
• Cancer prevention and health promotion initiatives in rural communities such as the Get Healthy Information and Coaching Service, NSW Quitline and iCanQuit
• Get Healthy at Work in rural settings, with a focus on physical inactivity, poor nutrition, obesity, tobacco use, harmful consumption of alcohol and ultraviolet radiation exposure
• Ensure at-risk populations in rural communities have access to prevention programs such as the Needle and Syringe Program, vaccination for Hepatitis B and community education campaigns
• Support for those in rural communities facing critical end-of-life decisions
• Ensure statewide research initiatives consider the research needs of rural areas, including those focused on growing research assets, infrastructure and investment.
Since 2010, there have been significant investments in radiotherapy services in Orange, Port Macquarie and Lismore. New regional cancer centres have been established at Tamworth, Nowra and Gosford.17
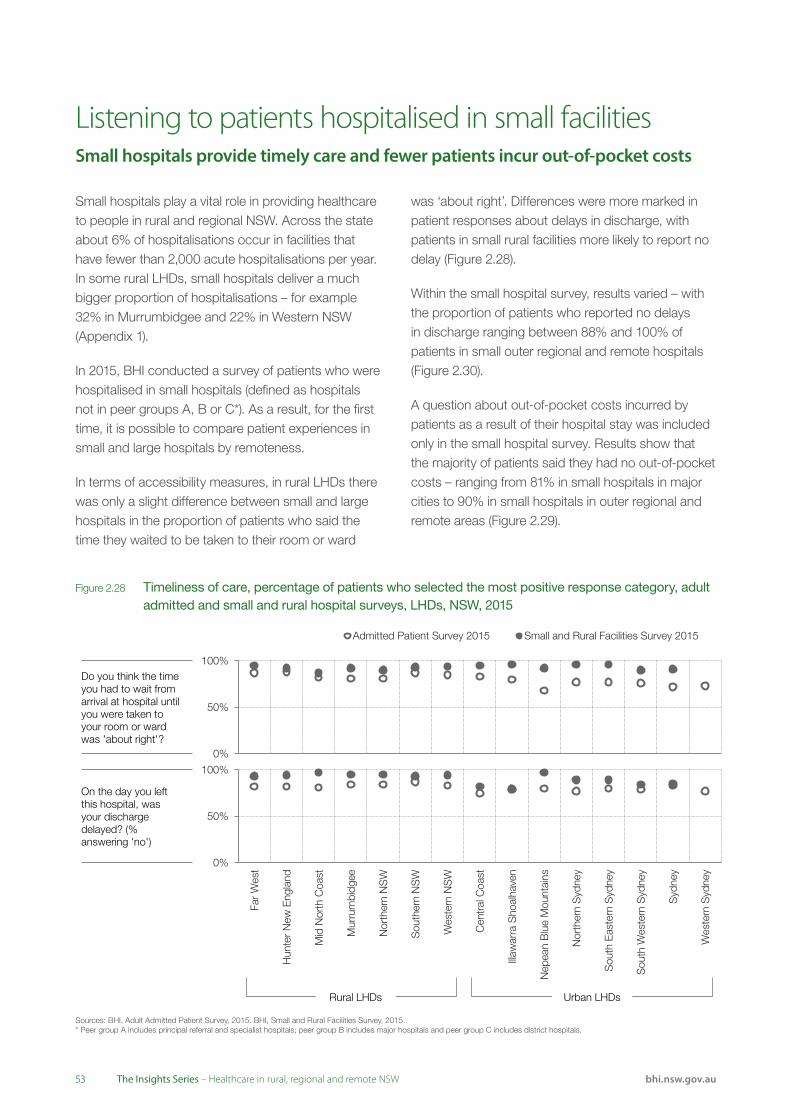
5353 bhi.nsw.gov.auThe Insights Series – Healthcare in rural, regional and remote NSW
Listening to patients hospitalised in small facilitiesSmall hospitals provide timely care and fewer patients incur out-of-pocket costs
Small hospitals play a vital role in providing healthcare to people in rural and regional NSW. Across the state about 6% of hospitalisations occur in facilities that have fewer than 2,000 acute hospitalisations per year. In some rural LHDs, small hospitals deliver a much bigger proportion of hospitalisations – for example 32% in Murrumbidgee and 22% in Western NSW (Appendix 1).
In 2015, BHI conducted a survey of patients who were hospitalised in small hospitals (defined as hospitals not in peer groups A, B or C*). As a result, for the first time, it is possible to compare patient experiences in small and large hospitals by remoteness.
In terms of accessibility measures, in rural LHDs there was only a slight difference between small and large hospitals in the proportion of patients who said the time they waited to be taken to their room or ward
was ‘about right’. Differences were more marked in patient responses about delays in discharge, with patients in small rural facilities more likely to report no delay (Figure 2.28).
Within the small hospital survey, results varied – with the proportion of patients who reported no delays in discharge ranging between 88% and 100% of patients in small outer regional and remote hospitals (Figure 2.30).
A question about out-of-pocket costs incurred by patients as a result of their hospital stay was included only in the small hospital survey. Results show that the majority of patients said they had no out-of-pocket costs – ranging from 81% in small hospitals in major cities to 90% in small hospitals in outer regional and remote areas (Figure 2.29).
Sources: BHI, Adult Admitted Patient Survey, 2015. BHI, Small and Rural Facilities Survey, 2015.
0%
50%
100%
Far
Wes
t
Hun
ter N
ew E
ngla
nd
Mid
Nor
th C
oast
Mur
rum
bidg
ee
Nor
ther
n N
SW
Sou
ther
n N
SW
Wes
tern
NS
W
Cen
tral
Coa
st
Illaw
arra
Sho
alha
ven
Nep
ean
Blu
e M
ount
ains
Nor
ther
n S
ydne
y
Sou
th E
aste
rn S
ydne
y
Sou
th W
este
rn S
ydne
y
Syd
ney
Wes
tern
Syd
ney
Admitted Patient Survey 2015 Small and Rural Facilities Survey 2015
Do you think the time you had to wait from arrival at hospital until you were taken to your room or ward was 'about right'?
Rural LHDs Urban LHDs
Sources: BHI, Adult Admitted Patient Survey, 2015. BHI, Small and Rural Facilities Survey, 2015.
0%
50%
100%
Far
Wes
t
Hun
ter N
ew E
ngla
nd
Mid
Nor
th C
oast
Mur
rum
bidg
ee
Nor
ther
n N
SW
Sou
ther
n N
SW
Wes
tern
NS
W
Cen
tral
Coa
st
Illaw
arra
Sho
alha
ven
Nep
ean
Blu
e M
ount
ains
Nor
ther
n S
ydne
y
Sou
th E
aste
rn S
ydne
y
Sou
th W
este
rn S
ydne
y
Syd
ney
Wes
tern
Syd
ney
Admitted Patient Survey 2015 Small and Rural Facilities Survey 2015
On the day you left this hospital, was your discharge delayed? (% answering 'no')
Rural LHDs Urban LHDs
Figure 2.28 Timeliness of care, percentage of patients who selected the most positive response category, adult admitted and small and rural hospital surveys, LHDs, NSW, 2015
Sources: BHI, Adult Admitted Patient Survey, 2015. BHI, Small and Rural Facilities Survey, 2015.* Peer group A includes principal referral and specialist hospitals; peer group B includes major hospitals and peer group C includes district hospitals.
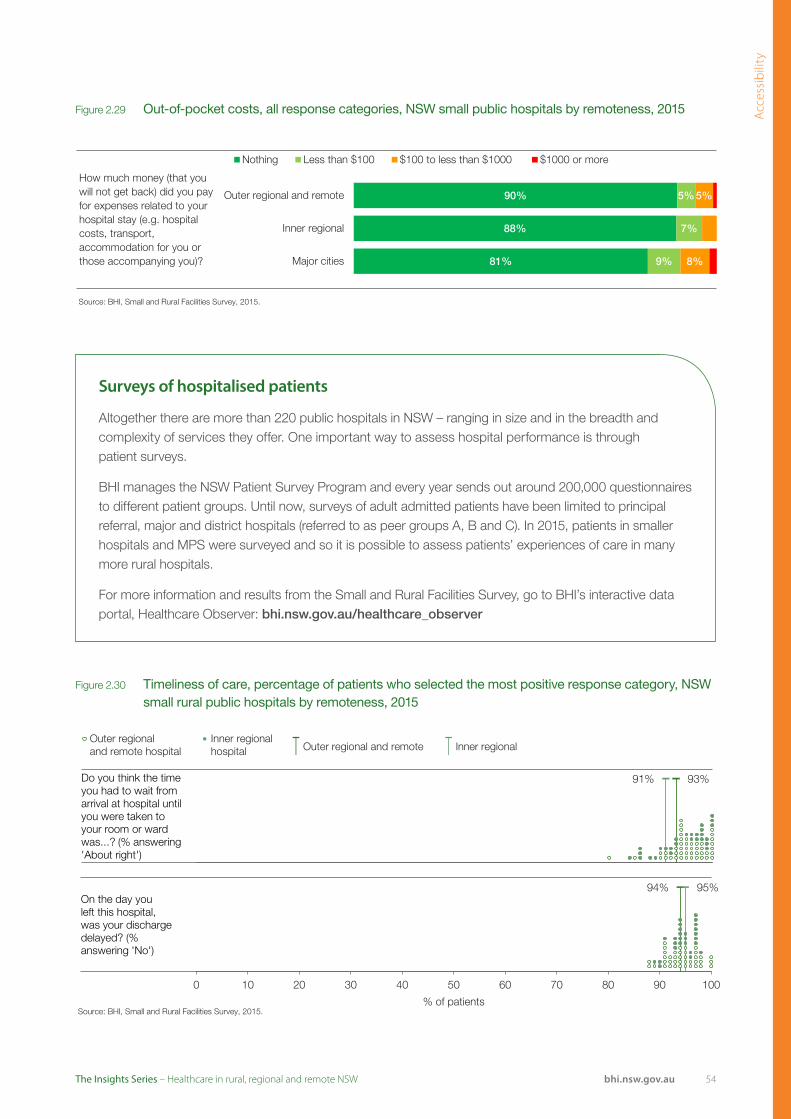
Acc
essi
bili
ty
54bhi.nsw.gov.auThe Insights Series – Healthcare in rural, regional and remote NSW
Source: BHI, Small and Rural Facilities Survey, 2015.
How much money (that you will not get back) did you pay for expenses related to your hospital stay (e.g. hospital costs, transport, accommodation for you or those accompanying you)? 81%
88%
90%
9%
7%
5%
8%
5%
Major cities
Inner regional
Outer regional and remote
Nothing Less than $100 $100 to less than $1000 $1000 or more
Source: BHI, Small and Rural Facilities Survey, 2015.
93% 91%
0 10 20 30 40 50 60 70 80 90 100
% of patients
Outer regionaland remote hospital
Inner regionalhospital Outer regional and remote Inner regional
Do you think the time you had to wait from arrival at hospital until you were taken to your room or ward was...? (% answering 'About right')
Source: BHI, Small and Rural Facilities Survey, 2015.
94% 95%
0 10 20 30 40 50 60 70 80 90 100
% of patients
Outer regionaland remote hospital
Inner regionalhospital Outer regional and remote Inner regional
On the day you left this hospital, was your discharge delayed? (% answering 'No')
Figure 2.30 Timeliness of care, percentage of patients who selected the most positive response category, NSW small rural public hospitals by remoteness, 2015
Figure 2.29 Out-of-pocket costs, all response categories, NSW small public hospitals by remoteness, 2015
Surveys of hospitalised patients
Altogether there are more than 220 public hospitals in NSW – ranging in size and in the breadth and complexity of services they offer. One important way to assess hospital performance is through patient surveys.
BHI manages the NSW Patient Survey Program and every year sends out around 200,000 questionnaires to different patient groups. Until now, surveys of adult admitted patients have been limited to principal referral, major and district hospitals (referred to as peer groups A, B and C). In 2015, patients in smaller hospitals and MPS were surveyed and so it is possible to assess patients’ experiences of care in many more rural hospitals.
For more information and results from the Small and Rural Facilities Survey, go to BHI’s interactive data portal, Healthcare Observer: bhi.nsw.gov.au/healthcare_observer
Outer regionaland remote hospital
Inner regionalhospital Outer regional and remote Inner regional
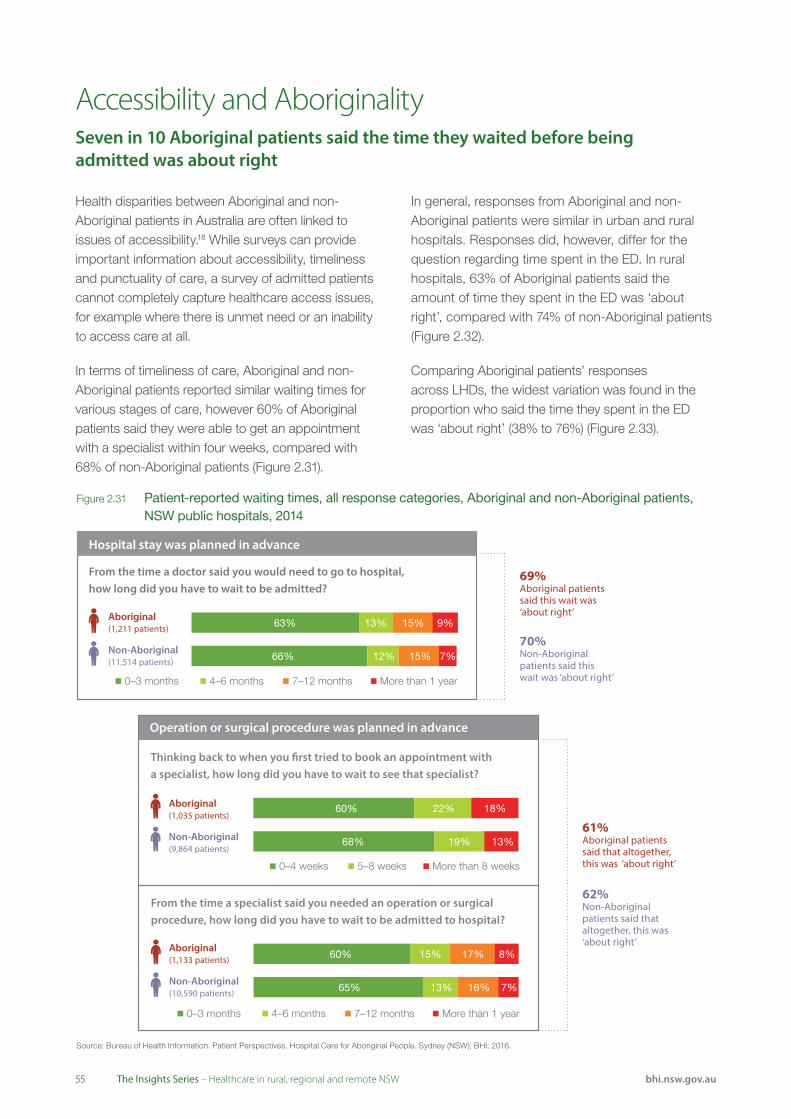
5555 bhi.nsw.gov.auThe Insights Series – Healthcare in rural, regional and remote NSW
Accessibility and AboriginalitySeven in 10 Aboriginal patients said the time they waited before being admitted was about right
Health disparities between Aboriginal and non-Aboriginal patients in Australia are often linked to issues of accessibility.18 While surveys can provide important information about accessibility, timeliness and punctuality of care, a survey of admitted patients cannot completely capture healthcare access issues, for example where there is unmet need or an inability to access care at all.
In terms of timeliness of care, Aboriginal and non-Aboriginal patients reported similar waiting times for various stages of care, however 60% of Aboriginal patients said they were able to get an appointment with a specialist within four weeks, compared with 68% of non-Aboriginal patients (Figure 2.31).
In general, responses from Aboriginal and non-Aboriginal patients were similar in urban and rural hospitals. Responses did, however, differ for the question regarding time spent in the ED. In rural hospitals, 63% of Aboriginal patients said the amount of time they spent in the ED was ‘about right’, compared with 74% of non-Aboriginal patients (Figure 2.32).
Comparing Aboriginal patients’ responses across LHDs, the widest variation was found in the proportion who said the time they spent in the ED was ‘about right’ (38% to 76%) (Figure 2.33).
Figure 2.31 Patient-reported waiting times, all response categories, Aboriginal and non-Aboriginal patients, NSW public hospitals, 2014
Source: Bureau of Health Information. Patient Perspectives. Hospital Care for Aboriginal People. Sydney (NSW); BHI; 2016.
Hospital stay was planned in advance
From the time a doctor said you would need to go to hospital,how long did you have to wait to be admitted?
Aboriginal(1,211 patients)
Non-Aboriginal(11,514 patients)
13% 15% 9%63%
7%15%12%66%
0–3 months 4–6 months 7–12 months More than 1 year
69%Aboriginal patientssaid this wait was ‘about right’
70%Non-Aboriginalpatients said this wait was ‘about right’
61%Aboriginal patientssaid that altogether,this was ‘about right’
62%Non-Aboriginalpatients said thataltogether, this was ‘about right’
0–4 weeks 5–8 weeks More than 8 weeks
Operation or surgical procedure was planned in advance
Thinking back to when you �rst tried to book an appointment witha specialist, how long did you have to wait to see that specialist?
Aboriginal(1,035 patients)
Non-Aboriginal(9,864 patients)
22% 18%60%
13%19%68%
From the time a specialist said you needed an operation or surgicalprocedure, how long did you have to wait to be admitted to hospital?
Aboriginal(1,133 patients)
Non-Aboriginal(10,590 patients)
15% 17% 8%
7%16%13%65%
0–3 months 4–6 months 7–12 months More than 1 year
60%

Acc
essi
bili
ty
56bhi.nsw.gov.auThe Insights Series – Healthcare in rural, regional and remote NSW
Figure 2.32 Access and timeliness, percentage of patients who selected the most positive response category, Aboriginal and non-Aboriginal patients, urban and rural NSW public hospitals, 2014
Figure 2.33 Access and timeliness, percentage of patients who selected the most positive response category, Aboriginal patients by LHD, NSW, 2014
Time spent in the emergency department was ‘about right’
Urban hospitals
Rural hospitals
Time waited to be admitted to hospital was ‘about right’
Urban hospitals
Rural hospitals
Time between booking appointment with specialist and admission for procedure was ‘about right’
Urban hospitals
Rural hospitals
*
Non-Aboriginal patientsAboriginal patients
Source: Bureau of Health Information. Patient Perspectives. Hospital Care for Aboriginal People. Sydney (NSW); BHI; 2016.
* There was a significant difference in the proportion of Aboriginal and non-Aboriginal patients who selected the most positive response category.
Source: Bureau of Health Information. Patient Perspectives. Hospital Care for Aboriginal People. Sydney (NSW); BHI; 2016.
Views from the qualitative consultation
Strong leadership in Aboriginal Community Controlled Health Services and public health are essential to the provision of effective healthcare services to Aboriginal people.
“Our ‘did not waits’ are quite large – for Indigenous patients they are among the highest in the state. We have done a clinical redesign project to look into this. There is a theory that local Indigenous people just don’t pay attention to staff but I don’t think that’s true. I think we just don’t have a lot of Indigenous-friendly features – signage, simple language, etc. and we are working on this. Personally, I think people have often been to the Aboriginal Medical Service and then been referred – so we think they haven’t bothered to wait but actually they have probably been waiting all day.” (Qualitative consultation respondent)
Time spent in the emergency department was ‘about right’
Time waited to be admitted to hospital was ‘about right’
Time between booking appointment with specialist and admission for procedure was ‘about right’
62%
69%
61%
0 10 20 30 40 50 60 70 80 90 100
% of patients
Rural LHDs Urban LHDs NSW result

5757 bhi.nsw.gov.auThe Insights Series – Healthcare in rural, regional and remote NSW
Telehealth – the delivery of healthcare at a distance, through the use of information and communications technology19 – provides a range of benefits for patients, their families and carers, healthcare workers and the broader health system.
Telehealth services can:
• Deliver health services into remote communities, reducing the need for travel
• Provide timely access to services and specialists, providing the ability to diagnose and monitor health remotely
• Help educate, train and support isolated healthcare workers on location
• Support people with chronic conditions to manage their health.
Nationally, Medicare Benefits Schedule (MBS) items have been introduced to provide rebates for telehealth consultations with medical specialists in other locations. MBS items have also been introduced for GPs, other medical practitioners, nurse practitioners, midwives, Aboriginal health workers and practice nurses to provide face-to-face clinical services to a patient during a consultation with a specialist.
The number of MBS claims for telehealth consultations has been increasing across the state fairly steadily since July 2011. Between July 2011 and May 2016, there was a 27-fold increase in claims (Figure 2.34).
Geographic distribution of claims is concentrated in rural areas. Across Australia, the number of claims per 1,000 population is significantly higher in regional and remote areas than in major cities (Figure 2.35).
Resource use and context: Telehealth Telehealth use is increasing across NSW
Figure 2.34 MBS claims for telehealth consultations, NSW, July 2011–May 2016
Source: Medicare Benefits Schedule database.
Note: There is a substantial number of telehealth consultations in NSW that are not claimed for under MBS however these data are not routinely collected or reported.
0
500
1000
1500
2000
2500
3000
3500
4000
4500
Num
ber o
f MB
S c
laim
s
Figure 2.35 Telehealth services, by remoteness of residence, Australia (claims processed as at 31 March 2014)
ServicesClaims per
1,000 population
Major cities 21,752 1.3
Inner regional 74,178 17.6
Outer regional 62,125 30.1
Remote 8,539 26.5
Very remote 2,950 14.1
Unallocated 57 –
Total 169,602 –
Source: Medicare Benefits Schedule database

Acc
essi
bili
ty
58bhi.nsw.gov.auThe Insights Series – Healthcare in rural, regional and remote NSW
Selected policies in NSW
NSW Health’s Telehealth Framework and Implementation Strategy 2016–202120 outlines the role that telehealth can play in delivering patient-centred care and is aligned with other key NSW Health strategies such as the NSW State Health Plan – Towards 2021,21 the NSW Rural Health Plan – Towards 2021,16 eHealth’s A Blueprint for eHealth in NSW22 and the NSW Health Integrated Care Strategy 2014–2017.23
Telehealth usage in NSW commenced in the mid-1990s and sought to improve access, appropriateness and effectiveness of health services, particularly for rural and remote communities.
NSW Health has made considerable investments in telehealth initiatives, particularly in infrastructure and tools needed to support integrated care, the establishment of a videoconferencing system, an increase in available bandwidth, and the capacity to share medical information.
A recent review identified Hunter New England LHD (HNELHD) as a leader in the use of telehealth-enabled services.24 HNELHD uses telehealth for clinical education, training and workforce support and to deliver patient services across a range of clinical specialties. In orthopaedics, for example, the use of telehealth in HNE has been estimated to:
• Deliver 316 outpatient appointments
• Save 72,324 km of travel, and 38 nights away from home
• Represent an estimated $81,014 patient and carer costs saved and 20.4 tonnes of carbon dioxide.

5959 bhi.nsw.gov.auThe Insights Series – Healthcare in rural, regional and remote NSW
AppropriatenessThe right healthcare, the right way
Ap
pro
pria
tene
ss
bhi.nsw.gov.auThe Insights Series – Healthcare in rural, regional and remote NSW
AppropriatenessThe right healthcare, the right way
60

6161 bhi.nsw.gov.auThe Insights Series – Healthcare in rural, regional and remote NSW
Appropriateness refers to the extent to which patients receive services that respond to their health needs, social circumstances and their reasonable expectations regarding how they want to be treated and cared for.
There are two main types of appropriateness measures. The first type focuses on whether healthcare services provided to patients were in line with best-practice models of care – was ‘the right care’ delivered? The second type focuses on patient experiences – was healthcare provided in ‘the right way’?
Appropriateness measures include:
• Assessments of whether services provided to patients are evidence-based or in line with current best practice
• Assessments of whether services are responsive to how people want to be treated when seeking healthcare, the environment in which they are treated and the extent to which services are tailored to their circumstances, values and expectations
• Assessments of technical proficiency and competence focus on error rates.
AppropriatenessThe right healthcare, the right way
Summary of findings
• Over three quarters of women, aged 50 to 69 years, in inner regional NSW said they have recently had a mammogram – a higher proportion than in major cities or outer regional remote areas
• No association was seen between remoteness and the receipt of blood pressure and cholesterol checks, or influenza vaccinations – despite higher patient-reported prevalence of hypertension (high blood pressure) and diabetes in outer regional and remote areas
• In recent years, an increasing proportion of patients in rural hospitals underwent hip fracture surgery within two days of admission
• Across rural hospitals, between 84% and 96% of patients said their identification band or name was always checked before they were given medications or treatments
• Around seven in 10 patients said their GP always explains things in an understandable way and spends enough time with them – and this did not differ by remoteness
• A survey of patients admitted to principal referral, major and district hospitals found that those in rural hospitals were more likely to say they were as involved as they wanted to be in decisions about their care and treatment; about discharge and about medications
• A different survey of patients admitted to smaller hospitals found that rural patients were even more positive about engagement in their care than those hospitalised in larger hospitals
• Across NSW public hospitals, the proportion of births that were elective caesarean sections did not differ by remoteness
• Differences in experiences of hospital care between Aboriginal and non-Aboriginal patients were generally greater in hospitals in rural areas than those in urban areas.
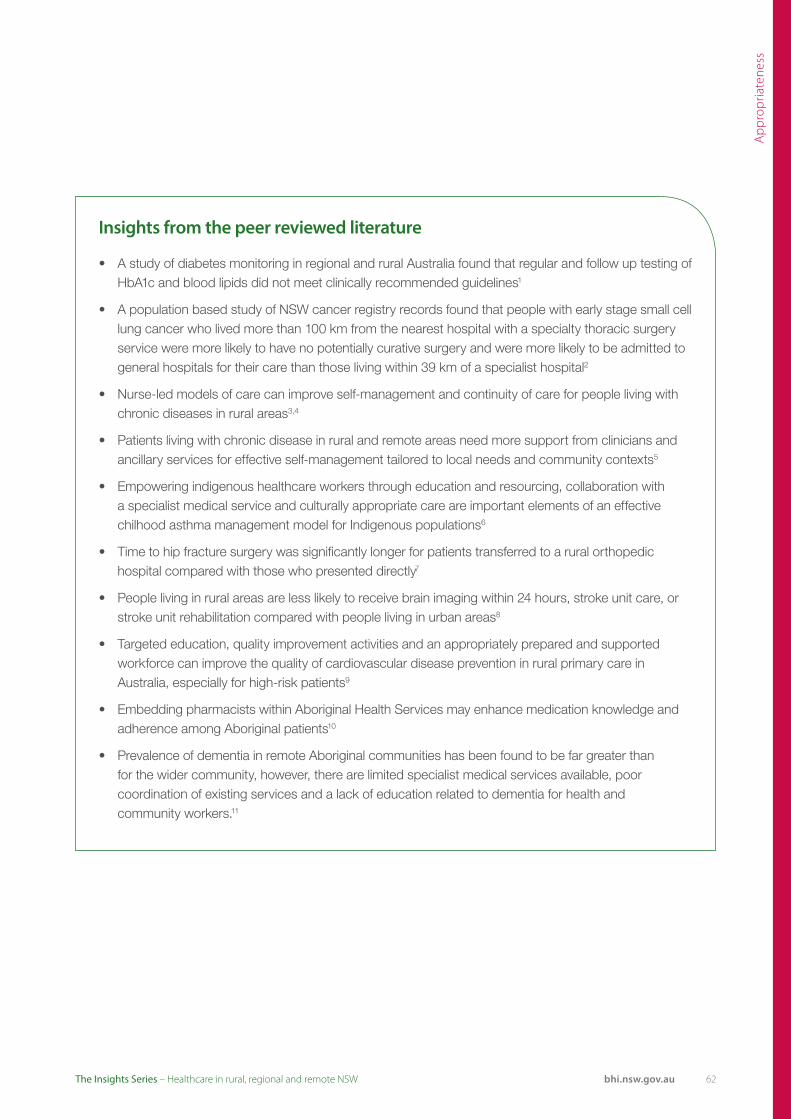
Ap
pro
pria
tene
ss
bhi.nsw.gov.auThe Insights Series – Healthcare in rural, regional and remote NSW
Insights from the peer reviewed literature
• A study of diabetes monitoring in regional and rural Australia found that regular and follow up testing of HbA1c and blood lipids did not meet clinically recommended guidelines1
• A population based study of NSW cancer registry records found that people with early stage small cell lung cancer who lived more than 100 km from the nearest hospital with a specialty thoracic surgery service were more likely to have no potentially curative surgery and were more likely to be admitted to general hospitals for their care than those living within 39 km of a specialist hospital2
• Nurse-led models of care can improve self-management and continuity of care for people living with chronic diseases in rural areas3,4
• Patients living with chronic disease in rural and remote areas need more support from clinicians and ancillary services for effective self-management tailored to local needs and community contexts5
• Empowering indigenous healthcare workers through education and resourcing, collaboration with a specialist medical service and culturally appropriate care are important elements of an effective chilhood asthma management model for Indigenous populations6
• Time to hip fracture surgery was significantly longer for patients transferred to a rural orthopedic hospital compared with those who presented directly7
• People living in rural areas are less likely to receive brain imaging within 24 hours, stroke unit care, or stroke unit rehabilitation compared with people living in urban areas8
• Targeted education, quality improvement activities and an appropriately prepared and supported workforce can improve the quality of cardiovascular disease prevention in rural primary care in Australia, especially for high-risk patients9
• Embedding pharmacists within Aboriginal Health Services may enhance medication knowledge and adherence among Aboriginal patients10
• Prevalence of dementia in remote Aboriginal communities has been found to be far greater than for the wider community, however, there are limited specialist medical services available, poor coordination of existing services and a lack of education related to dementia for health and community workers.11
62

6363 bhi.nsw.gov.auThe Insights Series – Healthcare in rural, regional and remote NSW
Rural and remote health services offer a number of preventive services but these may be limited by resources or have limited effectiveness given the complex health needs of rural populations.
Preventive care has two important types of benefits – for patients it helps avoid unnecessary pain and suffering; for healthcare systems it is cost effective, delivering better health for relatively low expense. Encouraging and supporting behaviour change is a key element of preventive care.
In 2015, around half of NSW people 16+ years were either overweight or obese; one in 10 were current smokers; nine in 10 did not achieve the recommended daily intake for vegetables; and three in 10 consumed alcohol at levels that pose a lifetime risk to health.12
Adults living in outer regional and remote areas were most likely to smoke, to be overweight or obese and engage in risky drinking (Figure 3.1).
In 2014, more than half of NSW adults aged 55+ years said that in the preceding two years a healthcare professional discussed with them diet (52%) or exercise (54%), although a smaller proportion said they had a discussion about worries or stress (32%).13
At a jurisdiction level, results about worry or stress counselling differed by remoteness only in NSW – with the lowest proportion in inner regional areas. In Canada and Sweden however, a lower proportion of adults in inner regional areas said a health professional had discussed exercise with them, and in Sweden, a higher proportion in outer regional and remote areas said they received dietary counselling (Figure 3.2).
Receiving preventive servicesMore people in rural NSW are overweight, but no more likely to discuss diet with GP
Figure 3.1 Health behaviours, percentage of NSW persons aged 16+ years, by remoteness of residence, 2015 (or nearest year)
Source: NSW Population Health Survey (SAPHaRI), Centre for Epidemiology and Evidence, NSW Ministry of Health.
Note: Alcohol data are for 2014.
Overweight or obese
Currently smoking
Risky alcohol consumption
Inadequate physical activity
Did not meet recommended fruit consumption
Did not meet recommended vegetable consumption
13
50
95
52
57
27
15
59
92
51
59
29
20
63
93
54
58
33
0 10 20 30 40 50 60 70 80 90 100
% of persons
Outer regional and remote Inner regional Major cities
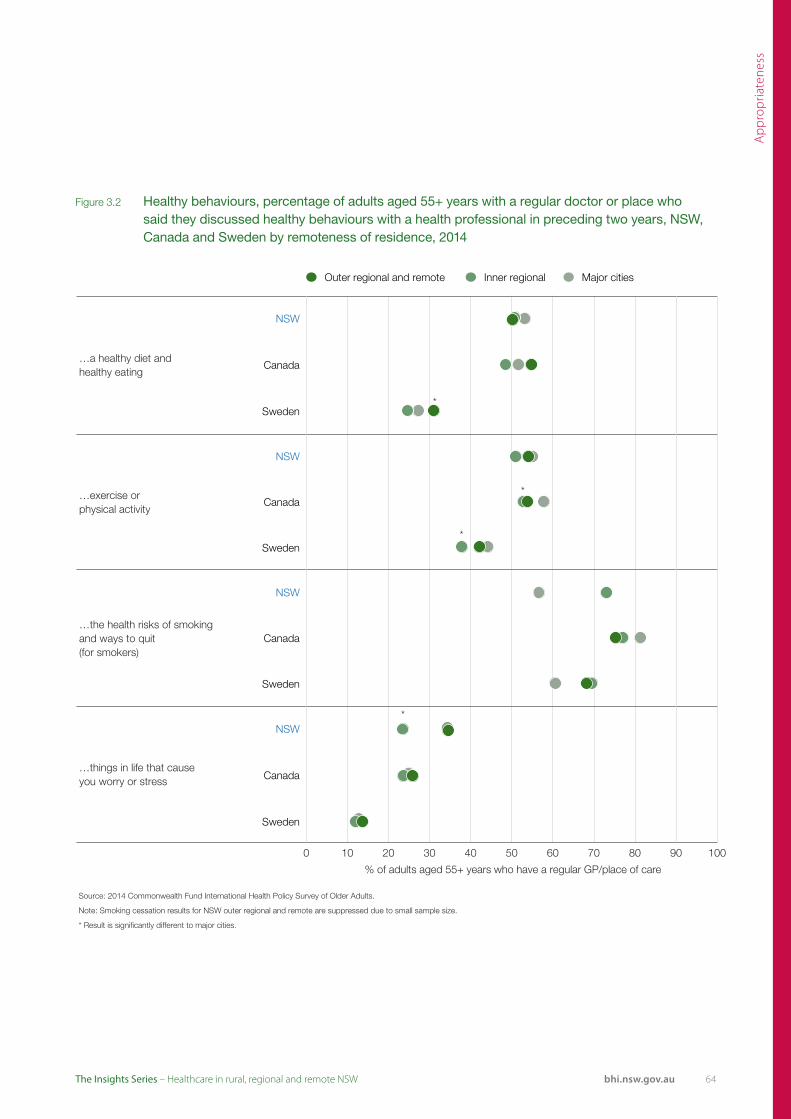
Ap
pro
pria
tene
ss
bhi.nsw.gov.auThe Insights Series – Healthcare in rural, regional and remote NSW
Figure 3.2 Healthy behaviours, percentage of adults aged 55+ years with a regular doctor or place who said they discussed healthy behaviours with a health professional in preceding two years, NSW, Canada and Sweden by remoteness of residence, 2014
Outer regional and remote Inner regional Major cities
NSW
…a healthy diet andhealthy eating
Canada
* Sweden
NSW
…exercise or * Canada
physical activity
* Sweden
NSW
…the health risks of smoking and ways to quit(for smokers)
Canada
Sweden
* NSW
…things in life that cause you worry or stress Canada
Sweden
0 10 20 30 40 50 60 70 80
% of adults aged 55+ years who have a regular GP/place of care
90 100
Source: 2014 Commonwealth Fund International Health Policy Survey of Older Adults.
Note: Smoking cessation results for NSW outer regional and remote are suppressed due to small sample size.
* Result is significantly different to major cities.
64

6565 bhi.nsw.gov.auThe Insights Series – Healthcare in rural, regional and remote NSW
For certain cancers, screening tests can detect disease in its early stages, increasing treatment options and improving outcomes. Current guidelines in NSW recommend that every two years:
• Males and females aged 50+ years should be screened for colorectal cancer by faecal occult blood test (FOBT)
• Females aged 50–74 years should be screened for breast cancer by mammogram
• Females aged 18–70 years should be screened for cervical cancer by pap test.
Patient-reported cancer screening uptake was lowest for colorectal cancer screening. About a third of all NSW adults aged 50–75 years who live in outer regional and remote areas (35%) said they had never undergone colorectal cancer screening – the same proportion as among major city residents (Figure 3.3).
Supplementary data [not shown] from the NSW cancer screening programs show that in 2013–14, 35% of people (aged 50–74 years) were screened for colorectal cancer in the preceding two years; while in 2014–15, 51% of women (aged 50–69 years)
Cancer screening There were few differences in patient-reported cancer screening rates by remoteness
Figure 3.3 Patient-reported cancer screening, all response categories, NSW by remoteness of residence, 2013
Source: 2013 Commonwealth Fund International Health Policy Survey.
* Estimate is significantly different to major cities.
About how long has it been since you had a bowel or colon cancer screening? (aged 50 to 75)
About how long hasit been since you had amammogram or breastcancer screening?(females aged 50 to 69)
About how long has itbeen since you had a pap/cervical smear?(females aged 20 to 69)
49%
56%
57%
13%
13%
7%
4%
35%
27%
35%
Major cities
Inner regional
Outer regional and remote
Less than 5 years ago 5 to 10 years ago More than 10 years ago Never
53%
53%
50%
14%
19%
17%
5%
3%
6%
10%
10%
11%
19%
15%
16%
Major cities
Inner regional
Outer regional and remote
In past 2 years Within the past 3 years Within the past 5 years More than 5 years ago Never
49%
77%*
47%
18%
4%
22%
19%
13%
15%
14%
6%
16%
Major cities
Inner regional
Outer regional and remote
Less than 2 years ago 2 to 3 years ago More than 3 years ago Never
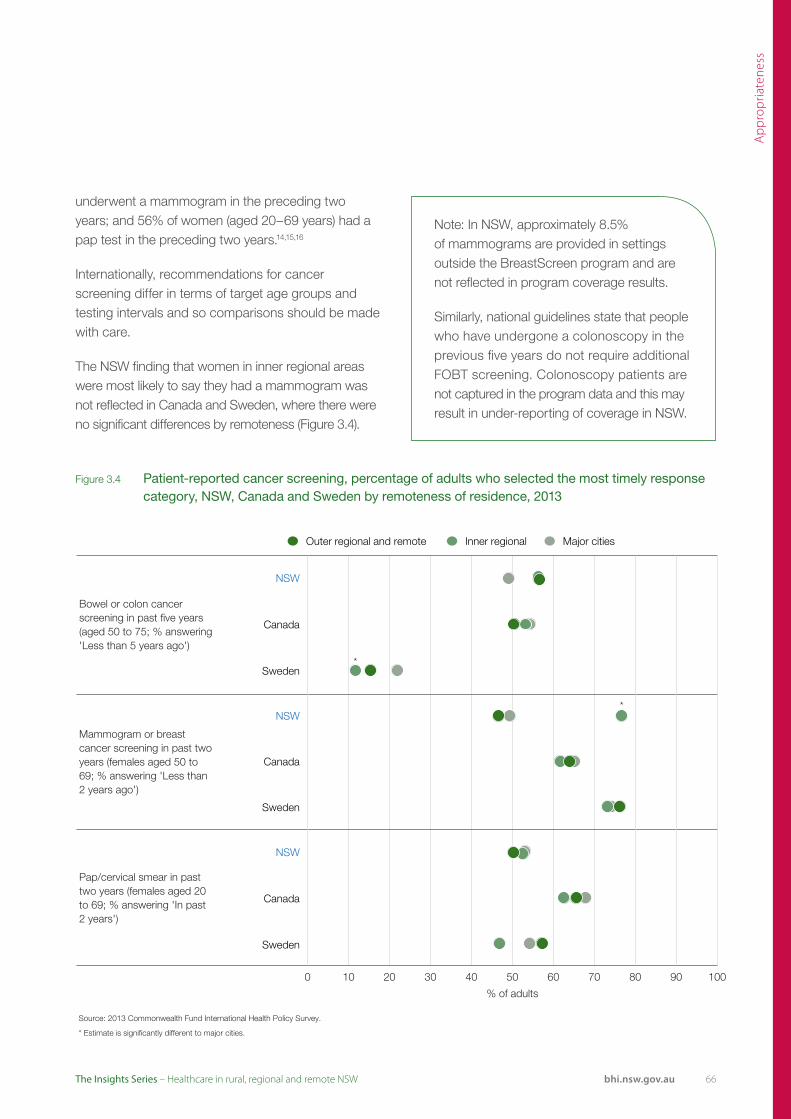
Ap
pro
pria
tene
ss
bhi.nsw.gov.auThe Insights Series – Healthcare in rural, regional and remote NSW
Figure 3.4 Patient-reported cancer screening, percentage of adults who selected the most timely response category, NSW, Canada and Sweden by remoteness of residence, 2013
Outer regional and remote Inner regional Major cities
NSW
Bowel or colon cancer screening in past five years (aged 50 to 75; % answering 'Less than 5 years ago')
Canada
* Sweden
* NSW
Mammogram or breast cancer screening in past two years (females aged 50 to 69; % answering 'Less than 2 years ago')
Canada
Sweden
NSW
Pap/cervical smear in past two years (females aged 20 to 69; % answering 'In past 2 years')
Canada
Sweden
0 10 20 30 40 50 60 70 80 90 100
% of adults
Source: 2013 Commonwealth Fund International Health Policy Survey.
* Estimate is significantly different to major cities.
underwent a mammogram in the preceding two years; and 56% of women (aged 20–69 years) had a pap test in the preceding two years.14,15,16
Internationally, recommendations for cancer screening differ in terms of target age groups and testing intervals and so comparisons should be made with care.
The NSW finding that women in inner regional areas were most likely to say they had a mammogram was not reflected in Canada and Sweden, where there were no significant differences by remoteness (Figure 3.4).
Note: In NSW, approximately 8.5% of mammograms are provided in settings outside the BreastScreen program and are not reflected in program coverage results.
Similarly, national guidelines state that people who have undergone a colonoscopy in the previous five years do not require additional FOBT screening. Colonoscopy patients are not captured in the program data and this may result in under-reporting of coverage in NSW.
66

6767 bhi.nsw.gov.auThe Insights Series – Healthcare in rural, regional and remote NSW
Active management and monitoring of patients with chronic diseases – for example through the use of routine blood pressure and cholesterol checks – can identify patient risk factors and early signs of ill health and; inform treatment options in order to slow or reverse disease progression.
Appropriate care matches patient needs with required services. For example, patients with high blood pressure or cholesterol require regular monitoring; and physically vulnerable patients need an annual influenza vaccination. In terms of needs, patient-
reported prevalence of high blood pressure and diabetes, was more pronounced in outer regional and remote NSW than in inner regional areas or major cities (Figure 3.5).
In outer regional and remote NSW – despite the greater prevalence of high blood pressure – patients were no more likely to report receipt of blood pressure checks. Looking across jurisdictions, only the results for seasonal influenza vaccinations in Canada and Sweden showed any significant rurality-associated gap (Figure 3.6).
Monitoring and managing chronic diseaseOuter regional and remote areas have higher prevalence of disease, but this is not matched by more monitoring
Figure 3.5 Patient-reported prevalence of hypertension, high cholesterol and diabetes, by remoteness, NSW, 2015 (or nearest year)
Source: NSW Population Health Survey (SAPHaRI), Centre for Epidemiology and Evidence, NSW Ministry of Health.
Note: Hypertension and cholesterol data are for 2013 and diabetes data are for 2015.
9
20
26
9
23
35
11
21
37
0 10 20 30 40 50 60 70 80 90 100
Diabetes
High Cholesterol
Hypertension
% of persons aged 16+ years
Outer regional and remote Inner regional Major cities
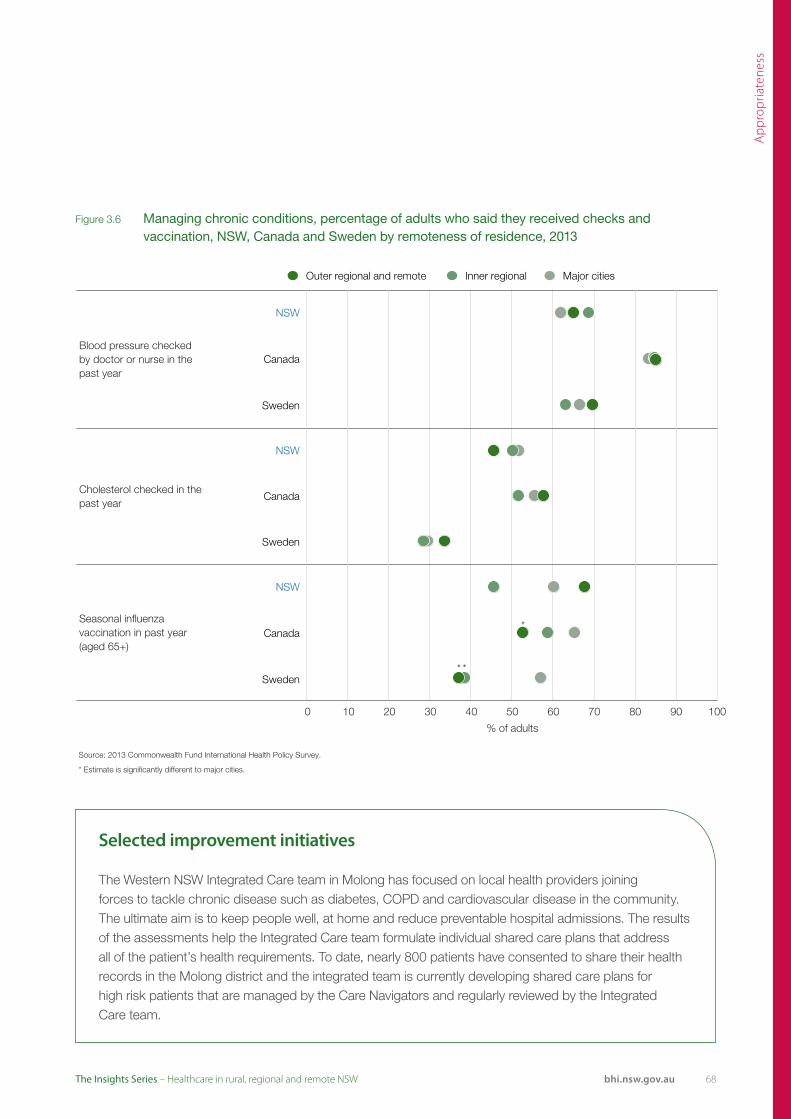
Ap
pro
pria
tene
ss
bhi.nsw.gov.auThe Insights Series – Healthcare in rural, regional and remote NSW
Figure 3.6 Managing chronic conditions, percentage of adults who said they received checks and vaccination, NSW, Canada and Sweden by remoteness of residence, 2013
Outer regional and remote Inner regional Major cities
NSW
Blood pressure checkedby doctor or nurse in the past year
Canada
Sweden
NSW
Cholesterol checked in the past year
Canada
Sweden
NSW
Seasonal influenza vaccination in past year (aged 65+)
* Canada
* * Sweden
0 10 20 30 40 50 60 70 80 90 100
% of adults
Source: 2013 Commonwealth Fund International Health Policy Survey.
* Estimate is significantly different to major cities.
Selected improvement initiatives
The Western NSW Integrated Care team in Molong has focused on local health providers joining forces to tackle chronic disease such as diabetes, COPD and cardiovascular disease in the community. The ultimate aim is to keep people well, at home and reduce preventable hospital admissions. The results of the assessments help the Integrated Care team formulate individual shared care plans that address all of the patient’s health requirements. To date, nearly 800 patients have consented to share their health records in the Molong district and the integrated team is currently developing shared care plans for high risk patients that are managed by the Care Navigators and regularly reviewed by the Integrated Care team.
68

6969 bhi.nsw.gov.auThe Insights Series – Healthcare in rural, regional and remote NSW
Receiving surgical care: Hip fracture surgery Patients admitted to rural hospitals were more likely to receive surgery for hip fracture within the recommended two days of admission
Source: NSW Ministry of Health, extracted from SAPHaRI, Centre for Epidemiology and Evidence (BHI analysis).
Note: Includes episodes with a principal diagnosis ICD-10-AM code of S72.0, S72.1 or S72.2 with a procedure performed (denominator) and where the difference between admission date and procedure date is less than or equal to two days (numerator). Outer regional and remote had less than 50 admissions in 2004, 2006, 2007, 2008 and 2010.
0
10
20
30
40
50
60
70
80
90
100
2004 2005 2006 2007 2008 2009 2010 2011 2012 2013 2014
% o
f hip
frac
ture
sur
gerie
s
Outer regional and remote Inner regional Major cities
Evidence-based guidelines recommend that patients hospitalised with a hip fracture should undergo surgery within 48 hours of admission. Delays to surgery beyond this time can result in prolonged pain and discomfort for patients and have been shown to be associated with more than twice the number of major post-operative complications.17,18
In 2013, there were 5,350 patients aged 65+ years who received surgery for hip fracture in NSW. Of these, 70% underwent surgery within two days of admission to hospital. While this is lower than results achieved in many other jurisdictions, NSW results overall have been improving in recent years.13
In 2014, 73% of hip fracture surgical procedures were performed within two days of admission to hospital
– a nine percentage point improvement over the 2004 result. Over the same period, the volume of hip fracture surgery performed in NSW public hospitals has increased by 9%.13
The most recent data, for 2014, show that the proportion of hip fracture surgery patients who underwent their operation within two days of admission was higher in rural hospitals (79% in inner regional hospitals and 80% in outer regional and remote hospitals) than in major city hospitals (68%) (Figure 3.7).
Across hospitals, results ranged from 37% to 100%, with the lowest percentage recorded in a major city hospital and the highest in a rural hospital (Figure 3.8).
Figure 3.7 Surgery performed within two days of hospital admission, percentage of all hip fracture surgery in public hospitals, patients aged 65+years, NSW by remoteness, 2004–2014
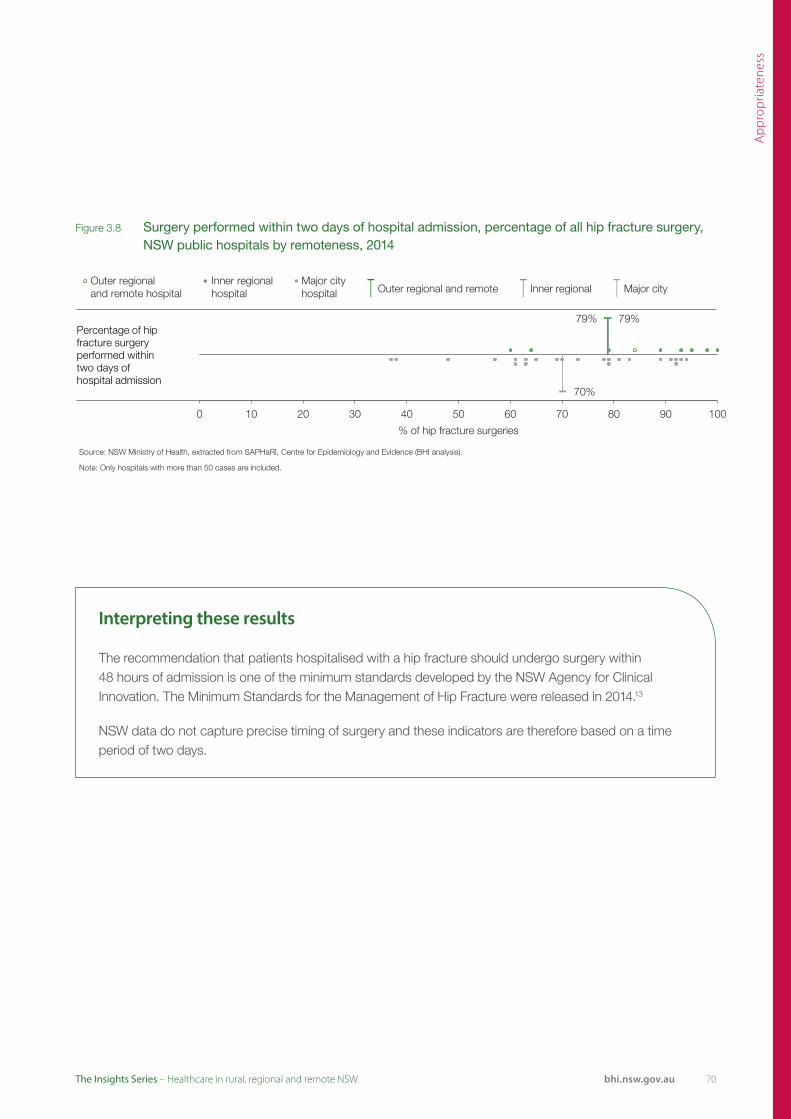
Ap
pro
pria
tene
ss
bhi.nsw.gov.auThe Insights Series – Healthcare in rural, regional and remote NSW
Source: NSW Ministry of Health, extracted from SAPHaRI, Centre for Epidemiology and Evidence (BHI analysis).
Note: Only hospitals with more than 50 cases are included.
79% 79%
70%
0 10 20 30 40 50 60 70 80 90 100
% of hip fracture surgeries
Outer regionaland remote hospital
Inner regional Major cityhospital hospital Outer regional and remote Inner regional Major city
Percentage of hip fracture surgery performed withintwo days ofhospital admission
Figure 3.8 Surgery performed within two days of hospital admission, percentage of all hip fracture surgery, NSW public hospitals by remoteness, 2014
Interpreting these results
The recommendation that patients hospitalised with a hip fracture should undergo surgery within 48 hours of admission is one of the minimum standards developed by the NSW Agency for Clinical Innovation. The Minimum Standards for the Management of Hip Fracture were released in 2014.13
NSW data do not capture precise timing of surgery and these indicators are therefore based on a time period of two days.
70
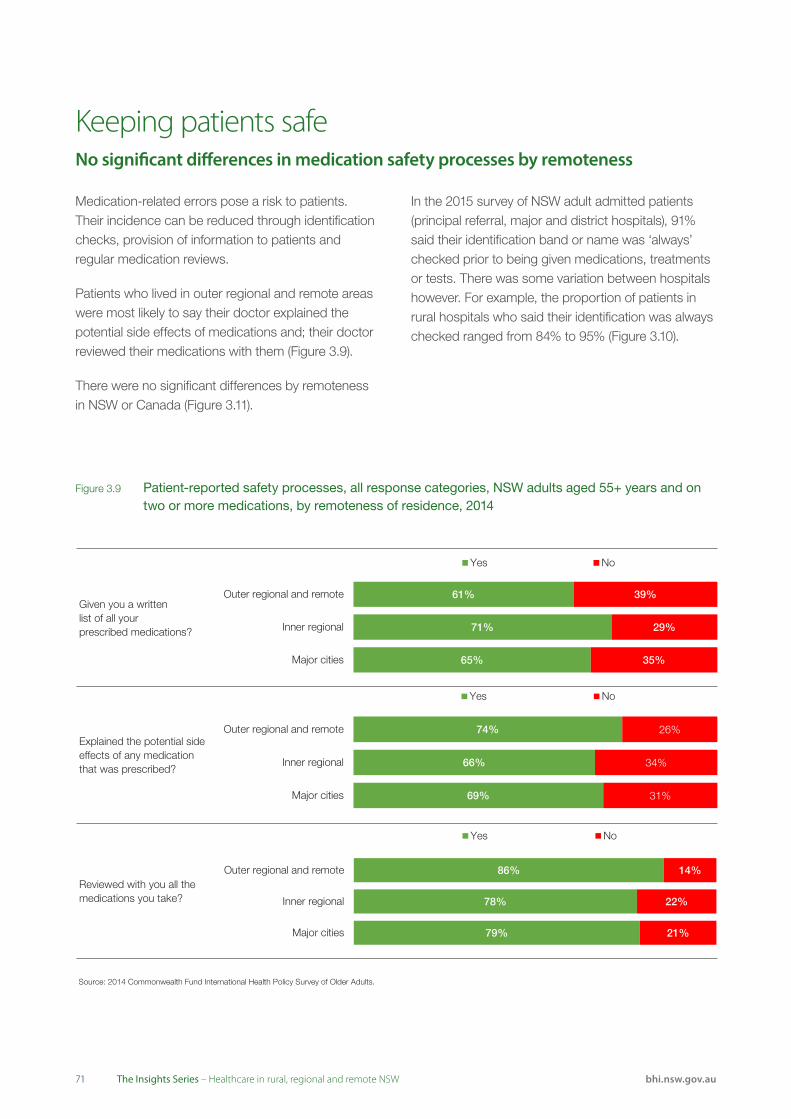
7171 bhi.nsw.gov.auThe Insights Series – Healthcare in rural, regional and remote NSW
Medication-related errors pose a risk to patients. Their incidence can be reduced through identification checks, provision of information to patients and regular medication reviews.
Patients who lived in outer regional and remote areas were most likely to say their doctor explained the potential side effects of medications and; their doctor reviewed their medications with them (Figure 3.9).
There were no significant differences by remoteness in NSW or Canada (Figure 3.11).
In the 2015 survey of NSW adult admitted patients (principal referral, major and district hospitals), 91% said their identification band or name was ‘always’ checked prior to being given medications, treatments or tests. There was some variation between hospitals however. For example, the proportion of patients in rural hospitals who said their identification was always checked ranged from 84% to 95% (Figure 3.10).
Keeping patients safe No significant differences in medication safety processes by remoteness
Figure 3.9 Patient-reported safety processes, all response categories, NSW adults aged 55+ years and on two or more medications, by remoteness of residence, 2014
Source: 2014 Commonwealth Fund International Health Policy Survey of Older Adults.
Given you a writtenlist of all yourprescribed medications?
Explained the potential side effects of any medication that was prescribed?
Reviewed with you all the medications you take?
65%
71%
61%
35%
29%
39%
Major cities
Inner regional
Outer regional and remote
Yes No
79%
78%
86%
21%
22%
14%
Major cities
Inner regional
Outer regional and remote
Yes No
69%
66%
74%
31%
34%
26%
Major cities
Inner regional
Outer regional and remote
Yes No
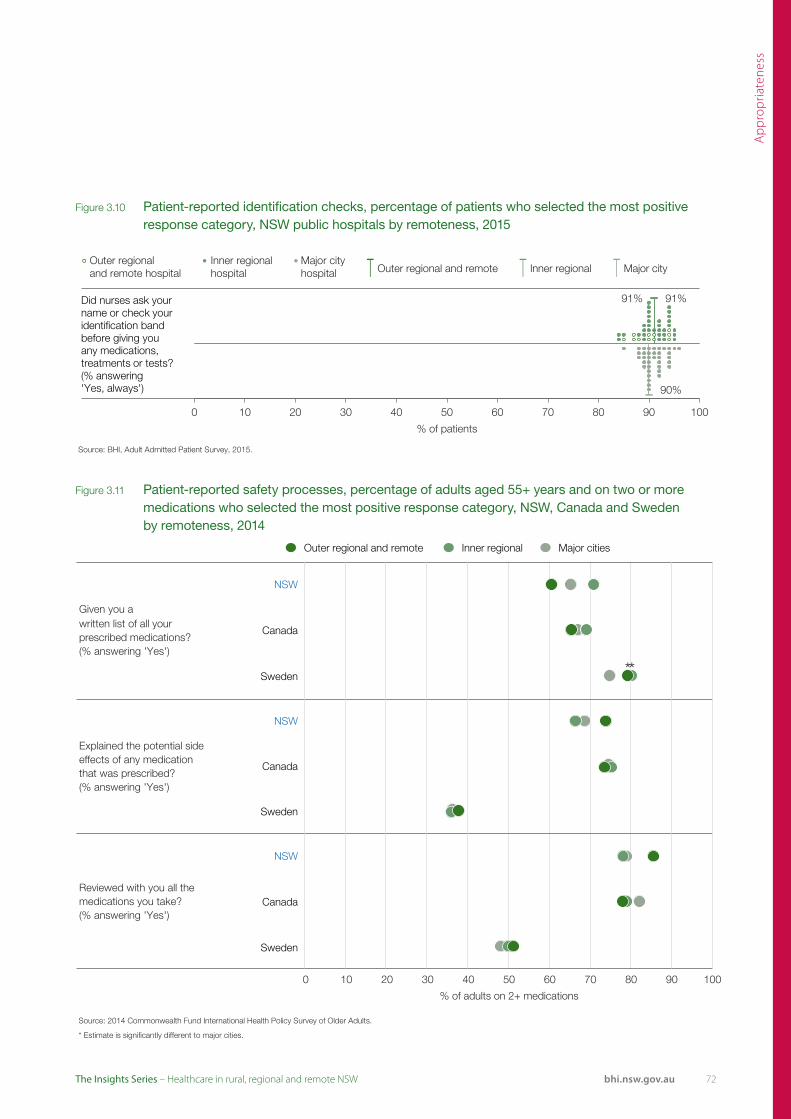
Ap
pro
pria
tene
ss
bhi.nsw.gov.auThe Insights Series – Healthcare in rural, regional and remote NSW
Figure 3.10 Patient-reported identification checks, percentage of patients who selected the most positive response category, NSW public hospitals by remoteness, 2015
Figure 3.11 Patient-reported safety processes, percentage of adults aged 55+ years and on two or more medications who selected the most positive response category, NSW, Canada and Sweden by remoteness, 2014
Source: BHI, Adult Admitted Patient Survey, 2015.
91% 91%
90%
0 10 20 30 40 50 60 70 80 90 100
% of patients
Outer regionaland remote hospital
Inner regional Major cityhospital hospital Outer regional and remote Inner regional Major city
Did nurses ask your name or check your identification band before giving you any medications, treatments or tests? (% answering 'Yes, always')
Outer regional and remote Inner regional Major cities
NSW
Given you awritten list of all your prescribed medications?(% answering 'Yes')
Canada
** Sweden
NSW
Explained the potential side effects of any medication that was prescribed?(% answering 'Yes')
Canada
Sweden
NSW
Reviewed with you all the medications you take?(% answering 'Yes')
Canada
Sweden
0 10 20 30 40 50 60
% of adults on 2+ medications
70 80 90 100
Source: 2014 Commonwealth Fund International Health Policy Survey of Older Adults.
* Estimate is significantly different to major cities.
72
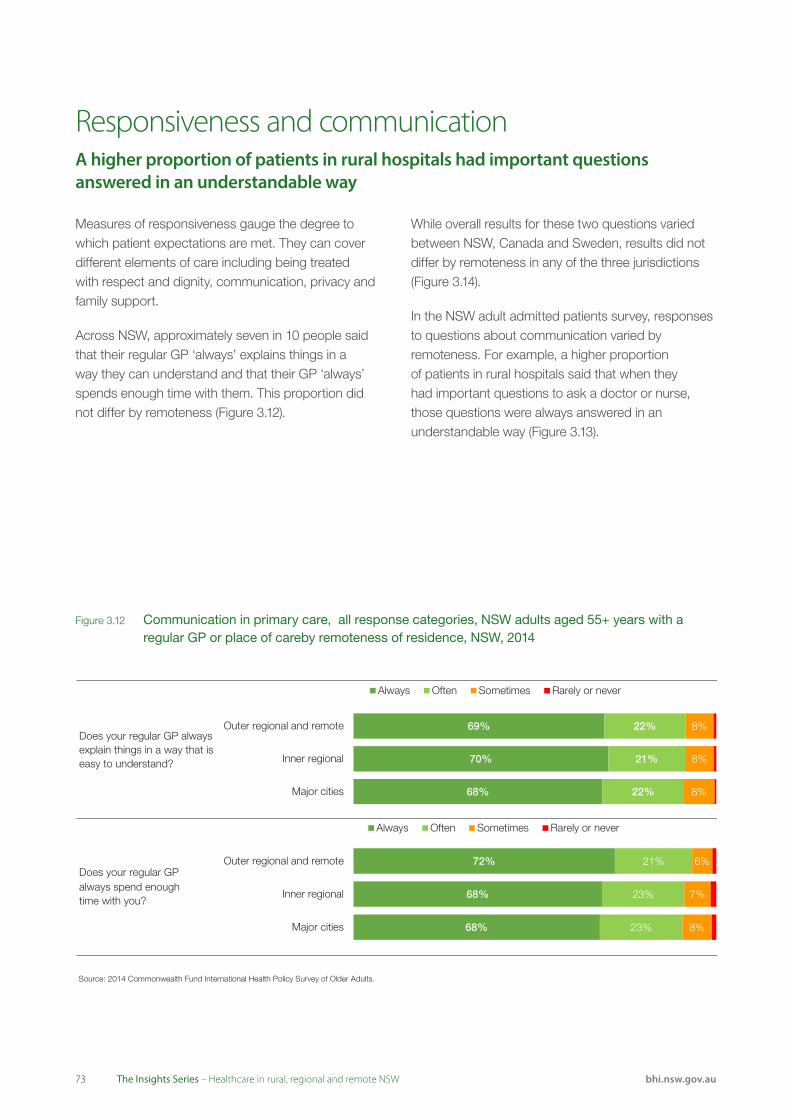
7373 bhi.nsw.gov.auThe Insights Series – Healthcare in rural, regional and remote NSW
Measures of responsiveness gauge the degree to which patient expectations are met. They can cover different elements of care including being treated with respect and dignity, communication, privacy and family support.
Across NSW, approximately seven in 10 people said that their regular GP ‘always’ explains things in a way they can understand and that their GP ‘always’ spends enough time with them. This proportion did not differ by remoteness (Figure 3.12).
While overall results for these two questions varied between NSW, Canada and Sweden, results did not differ by remoteness in any of the three jurisdictions (Figure 3.14).
In the NSW adult admitted patients survey, responses to questions about communication varied by remoteness. For example, a higher proportion of patients in rural hospitals said that when they had important questions to ask a doctor or nurse, those questions were always answered in an understandable way (Figure 3.13).
Responsiveness and communicationA higher proportion of patients in rural hospitals had important questions answered in an understandable way
Figure 3.12 Communication in primary care, all response categories, NSW adults aged 55+ years with a regular GP or place of careby remoteness of residence, NSW, 2014
Source: 2014 Commonwealth Fund International Health Policy Survey of Older Adults.
Does your regular GP always explain things in a way that is easy to understand?
Does your regular GPalways spend enoughtime with you?
68%
70%
69%
22%
21%
22%
8%
8%
8%
Major cities
Inner regional
Outer regional and remote
Always Often Sometimes Rarely or never
68%
68%
72%
23%
23%
21%
8%
7%
6%
Major cities
Inner regional
Outer regional and remote
Always Often Sometimes Rarely or never
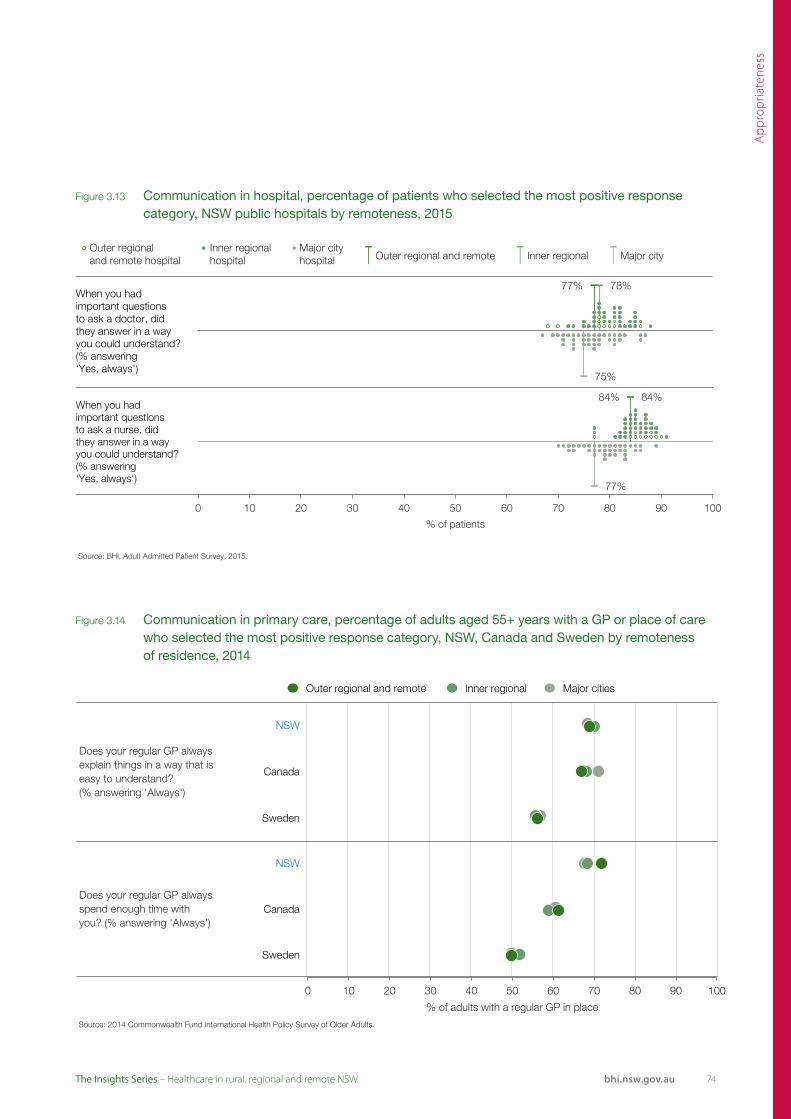
Ap
pro
pria
tene
ss
bhi.nsw.gov.auThe Insights Series – Healthcare in rural, regional and remote NSW
Figure 3.14 Communication in primary care, percentage of adults aged 55+ years with a GP or place of care who selected the most positive response category, NSW, Canada and Sweden by remoteness of residence, 2014
Figure 3.13 Communication in hospital, percentage of patients who selected the most positive response category, NSW public hospitals by remoteness, 2015
Source: BHI, Adult Admitted Patient Survey, 2015.
77% 78%
75%
0 10 20 30 40 50 60 70 80 90 100
% of patients
Outer regionaland remote hospital
Inner regional Major cityhospital hospital Outer regional and remote Inner regional Major city
When you had important questions to ask a doctor, did they answer in a way you could understand? (% answering 'Yes, always')
Source: BHI, Adult Admitted Patient Survey, 2015.
84% 84%
77%
0 10 20 30 40 50 60 70 80 90 100
% of patients
Outer regionaland remote hospital
Inner regional Major cityhospital hospital Outer regional and remote Inner regional Major city
When you had important questions to ask a nurse, did they answer in a way you could understand? (% answering 'Yes, always')
Does your regular GP always explain things in a way that is easy to understand?(% answering 'Always')
Does your regular GP always spend enough time with you? (% answering 'Always')
Source: 2014 Commonwealth Fund International Health Policy Survey of Older Adults.
NSW
Canada
Sweden
0 10 20 30 40 50 60 70 80 90 100
% of adults with a regular GP in place
NSW
Canada
Sweden
Outer regional and remote Inner regional Major cities
74
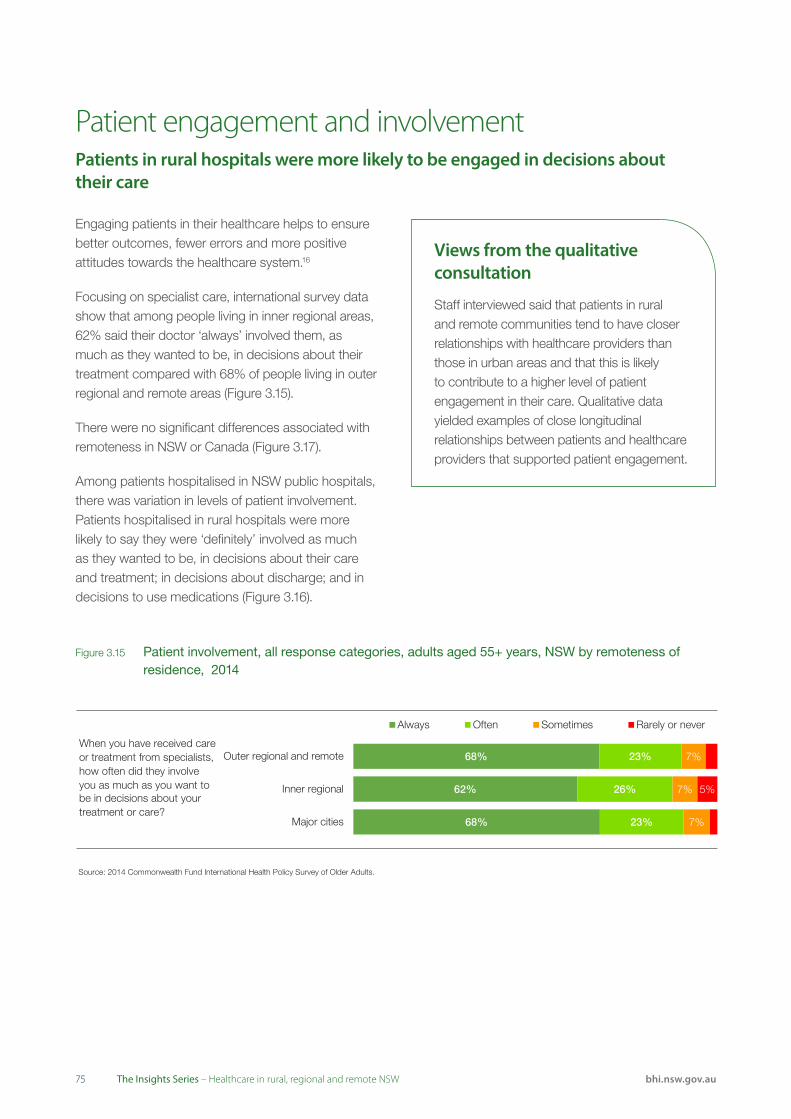
7575 bhi.nsw.gov.auThe Insights Series – Healthcare in rural, regional and remote NSW
Engaging patients in their healthcare helps to ensure better outcomes, fewer errors and more positive attitudes towards the healthcare system.16
Focusing on specialist care, international survey data show that among people living in inner regional areas, 62% said their doctor ‘always’ involved them, as much as they wanted to be, in decisions about their treatment compared with 68% of people living in outer regional and remote areas (Figure 3.15).
There were no significant differences associated with remoteness in NSW or Canada (Figure 3.17).
Among patients hospitalised in NSW public hospitals, there was variation in levels of patient involvement. Patients hospitalised in rural hospitals were more likely to say they were ‘definitely’ involved as much as they wanted to be, in decisions about their care and treatment; in decisions about discharge; and in decisions to use medications (Figure 3.16).
Patient engagement and involvement Patients in rural hospitals were more likely to be engaged in decisions about their care
Figure 3.15 Patient involvement, all response categories, adults aged 55+ years, NSW by remoteness of residence, 2014
Source: 2014 Commonwealth Fund International Health Policy Survey of Older Adults.
When you have received care or treatment from specialists, how often did they involve you as much as you want to be in decisions about your treatment or care?
68%
62%
68%
23%
26%
23%
7%
7%
7%
5%
Major cities
Inner regional
Outer regional and remote
Always Often Sometimes Rarely or never
Views from the qualitative consultation
Staff interviewed said that patients in rural and remote communities tend to have closer relationships with healthcare providers than those in urban areas and that this is likely to contribute to a higher level of patient engagement in their care. Qualitative data yielded examples of close longitudinal relationships between patients and healthcare providers that supported patient engagement.

Ap
pro
pria
tene
ss
bhi.nsw.gov.auThe Insights Series – Healthcare in rural, regional and remote NSW
Figure 3.17 Patient involvement, percentage of adults aged 55+ years who selected the most positive response category, NSW, Canada and Sweden by remoteness of residence, 2014
Figure 3.16 Patient involvement, percentage of patients who selected the most positive response category, NSW public hospitals by remoteness, 2015
Source: BHI, Adult Admitted Patient Survey, 2015.
64% 65%
59%
0 10 20 30 40 50 60 70 80 90 100
% of patients
Outer regionaland remote hospital
Inner regional Major cityhospital hospital Outer regional and remote Inner regional Major city
Were you involved, as much as you wanted to be, in decisions about your care and treatment? (% answering'Yes, definitely')
Source: BHI, Adult Admitted Patient Survey, 2015.
73% 72%
62%
0 10 20 30 40 50 60 70 80 90 100
% of patients
Outer regionaland remote hospital
Inner regional Major cityhospital hospital Outer regional and remote Inner regional Major city
Did you feel involved in decisions about your dischargefrom hospital? (% answering'Yes, definitely')
Source: BHI, Adult Admitted Patient Survey, 2015.
65% 68%
62%
0 10 20 30 40 50 60 70 80 90 100
% of patients
Outer regionaland remote hospital
Inner regional Major cityhospital hospital Outer regional and remote Inner regional Major city
Did you feel involved in the decision to use this medication in your treatment? (% answering'Yes, completely')
Source: 2014 Commonwealth Fund International Health Policy Survey of Older Adults.
* Estimate is significantly different to major cities.
When you havereceived care or treatment from specialists, how often did they involve you as much as you want to be in decisions about your treatment or care?(% answering 'Always')
*
0 10 20 30 40 50 60 70 80 90 100
% of adults
NSW
Canada
Sweden
Outer regional and remote Inner regional Major cities
76
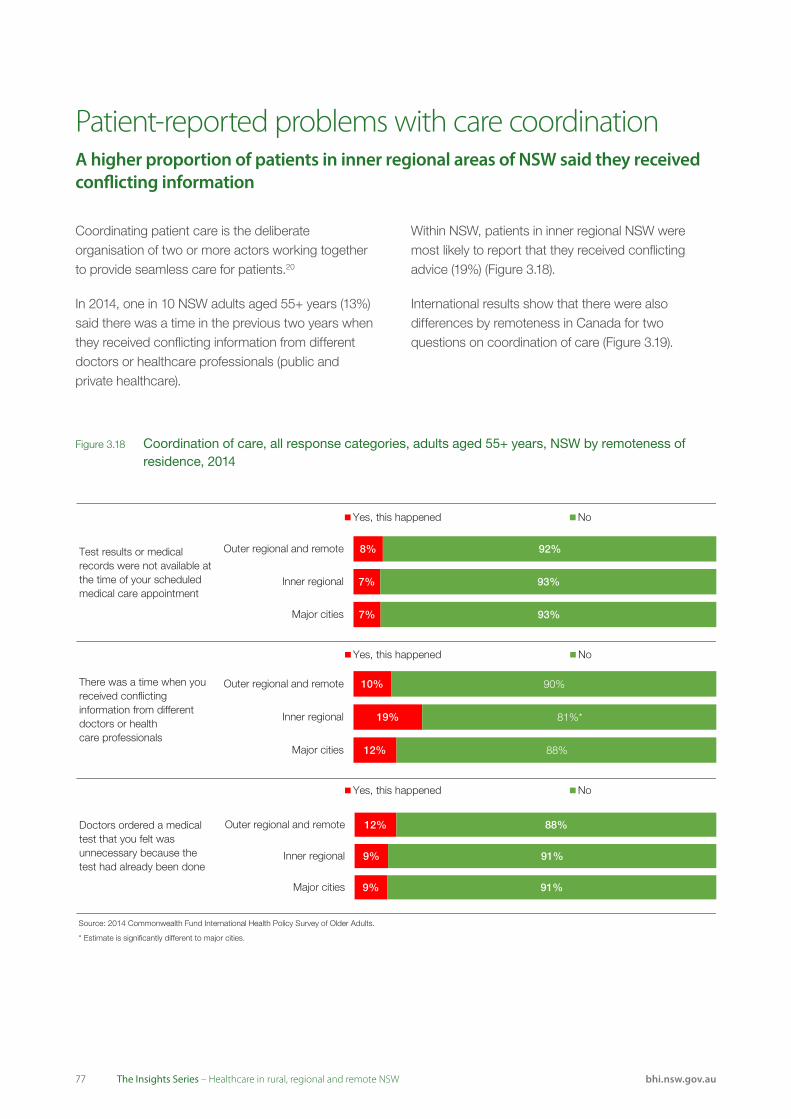
7777 bhi.nsw.gov.auThe Insights Series – Healthcare in rural, regional and remote NSW
Coordinating patient care is the deliberate organisation of two or more actors working together to provide seamless care for patients.20
In 2014, one in 10 NSW adults aged 55+ years (13%) said there was a time in the previous two years when they received conflicting information from different doctors or healthcare professionals (public and private healthcare).
Within NSW, patients in inner regional NSW were most likely to report that they received conflicting advice (19%) (Figure 3.18).
International results show that there were also differences by remoteness in Canada for two questions on coordination of care (Figure 3.19).
Patient-reported problems with care coordinationA higher proportion of patients in inner regional areas of NSW said they received conflicting information
Figure 3.18 Coordination of care, all response categories, adults aged 55+ years, NSW by remoteness of residence, 2014
Source: 2014 Commonwealth Fund International Health Policy Survey of Older Adults.
* Estimate is significantly different to major cities.
Test results or medical records were not available at the time of your scheduled medical care appointment
There was a time when you received conflicting information from different doctors or healthcare professionals
Doctors ordered a medical test that you felt was unnecessary because the test had already been done
7%
7%
8%
93%
93%
92%
Major cities
Inner regional
Outer regional and remote
Yes, this happened No
9%
9%
12%
91%
91%
88%
Major cities
Inner regional
Outer regional and remote
Yes, this happened No
12%
19%
10%
88%
81%*
90%
Major cities
Inner regional
Outer regional and remote
Yes, this happened No

Ap
pro
pria
tene
ss
bhi.nsw.gov.auThe Insights Series – Healthcare in rural, regional and remote NSW
Figure 3.19 Coordination of care, percentage of adults aged 55+ years who experienced problems with coordination, NSW, Canada and Sweden by remoteness of residence, 2014
Outer regional and remote Inner regional Major cities
Test results or medical records were not availableat the time of your scheduled medical care appointment(% answering 'Yes,this happened')
NSW
Canada
Sweden
There was a time whenyou received conflicting information from different doctors or healthcare professionals(% answering 'Yes,this happened')
* NSW
* Canada
Sweden
Doctors ordered a medical test that you felt was unnecessary becausethe test had already been done (% answering 'Yes, this happened')
NSW
* Canada
Sweden
0 10 20 30 40 50 60 70 80 90 100
% of adults Source: 2014 Commonwealth Fund International Health Policy Survey of Older Adults.
* Estimate is significantly different to major cities.
78
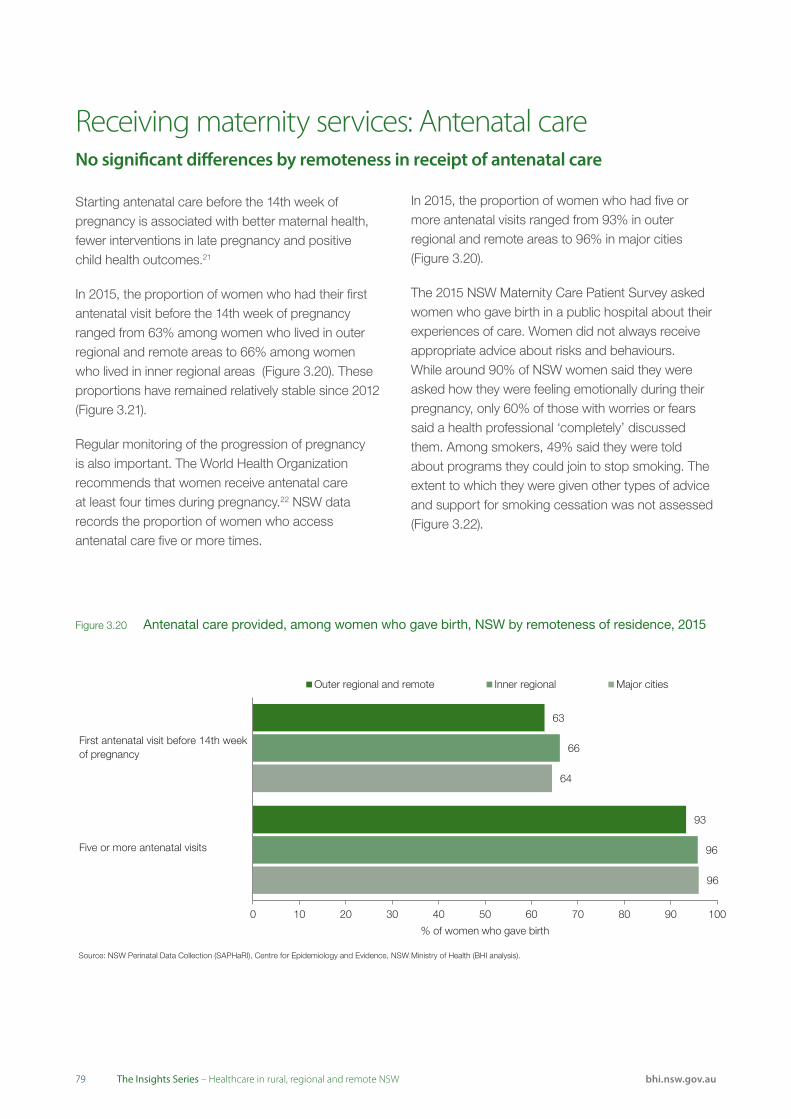
7979 bhi.nsw.gov.auThe Insights Series – Healthcare in rural, regional and remote NSW
Receiving maternity services: Antenatal careNo significant differences by remoteness in receipt of antenatal care
Source: NSW Perinatal Data Collection (SAPHaRI), Centre for Epidemiology and Evidence, NSW Ministry of Health (BHI analysis).
First antenatal visit before 14th week of pregnancy
Five or more antenatal visits
63
93
66
96
64
96
0 10 20 30 40 50 60 70 80 90 100
% of women who gave birth
Outer regional and remote Inner regional Major cities
Starting antenatal care before the 14th week of pregnancy is associated with better maternal health, fewer interventions in late pregnancy and positive child health outcomes.21
In 2015, the proportion of women who had their first antenatal visit before the 14th week of pregnancy ranged from 63% among women who lived in outer regional and remote areas to 66% among women who lived in inner regional areas (Figure 3.20). These proportions have remained relatively stable since 2012 (Figure 3.21).
Regular monitoring of the progression of pregnancy is also important. The World Health Organization recommends that women receive antenatal care at least four times during pregnancy.22 NSW data records the proportion of women who access antenatal care five or more times.
In 2015, the proportion of women who had five or more antenatal visits ranged from 93% in outer regional and remote areas to 96% in major cities (Figure 3.20).
The 2015 NSW Maternity Care Patient Survey asked women who gave birth in a public hospital about their experiences of care. Women did not always receive appropriate advice about risks and behaviours. While around 90% of NSW women said they were asked how they were feeling emotionally during their pregnancy, only 60% of those with worries or fears said a health professional ‘completely’ discussed them. Among smokers, 49% said they were told about programs they could join to stop smoking. The extent to which they were given other types of advice and support for smoking cessation was not assessed (Figure 3.22).
Figure 3.20 Antenatal care provided, among women who gave birth, NSW by remoteness of residence, 2015

Ap
pro
pria
tene
ss
bhi.nsw.gov.auThe Insights Series – Healthcare in rural, regional and remote NSW
Source: NSW Perinatal Data Collection (SAPHaRI), Centre for Epidemiology and Evidence, NSW Ministry of Health (BHI analysis).
0
10
20
30
40
50
60
70
80
90
100
2011 2012 2013 2014 2015
% o
f wom
en
Outer regional and remote Inner regional Major cities
Asked about how theywere feeling emotionallyduring pregnancy
'Completely' discussed worries or fears with a health professional
Health professionals 'always' explained things in an understandable way
Smokers told about programsto stop smoking
Given advice about the risks of consuming alcohol while pregnant
Source: BHI, Maternity Care Survey, 2015.
* Outer regional and remote results suppressed due to small sample size.
90
64
88
*
85
90
59
82
53
88
91
61
84
44
87
0 10 20 30 40 50 60 70 80 90 100
% of women
Outer regional and remote Inner regional Major cities
Figure 3.22 Key elements of antenatal care provided to women who gave birth in a public hospital, NSW by remoteness of hospital, 2015
Figure 3.21 First antenatal visit occurred before 14th week of pregnancy, NSW by remoteness of residence, NSW, 2011–15
80

8181 bhi.nsw.gov.auThe Insights Series – Healthcare in rural, regional and remote NSW
Receiving maternity services: BirthsWhile rates of caesarean section have increased across NSW, rates of elective caesarean sections in public hospitals do not appear to be related to remoteness
Figure 3.23 Type of birth, public and private hospitals, NSW by remoteness of residence, 2004–05 and 2014–15
Outer regional and remote Inner regional Major cities
67.1
2004–05 65.4Normal 60.9vaginal delivery 61.2
2014–15 61.1
54.9
25.1
2004–05 25.6
Caesarean 27.9
section 31.3
2014–15 30.1
32.9
7.3
2004–05 8.7Instrumental 11.0vaginal delivery 7.2
2014–15 8.6
11.9
0 10 20 30 40 50 60 70 80 90 100
% of births
Source: NSW Perinatal Data Collection (SAPHaRI), Centre for Epidemiology and Evidence, NSW Ministry of Health (BHI analysis).
Note: Vaginal breech births account for less than 1% of births in NSW and have not been included.
Caesarean section rates are a controversial issue. While caesarean section deliveries are the best option for some women and are associated with lower maternal or neonatal mortality, high rates have been linked with increased maternal morbidity and mortality, and neonatal intensive care unit admission.23,24,25
Caesarean sections can be emergency (unplanned)or elective (planned). Elective caesarean sections are the type of delivery for which there is an element of discretionary care.
In 2014–15, 32.4% of deliveries (public and private) in NSW were caesarean sections (elective and emergency), compared with 27.3% in 2004–05. While caesarean section rates have increased across the state, the greatest increase was in outer regional and remote areas (Figure 3.23).
There are no published recommendations to guide the appropriate level for elective procedures. Between 2004 and 2014, elective caesarean section rates increased from 13% to 16% of all deliveries in NSW (Figure 3.24).
Such increases in elective caesarean section rates have been attributed to a range of factors including maternal age, number of previous pregnancies, birthweight, patient choice, and changes in obstetric practices.
Among public hospitals, the rates of elective caesarean sections do not appear to be related to remoteness and were around 16% of births in 2014– 15 (Figure 3.25).
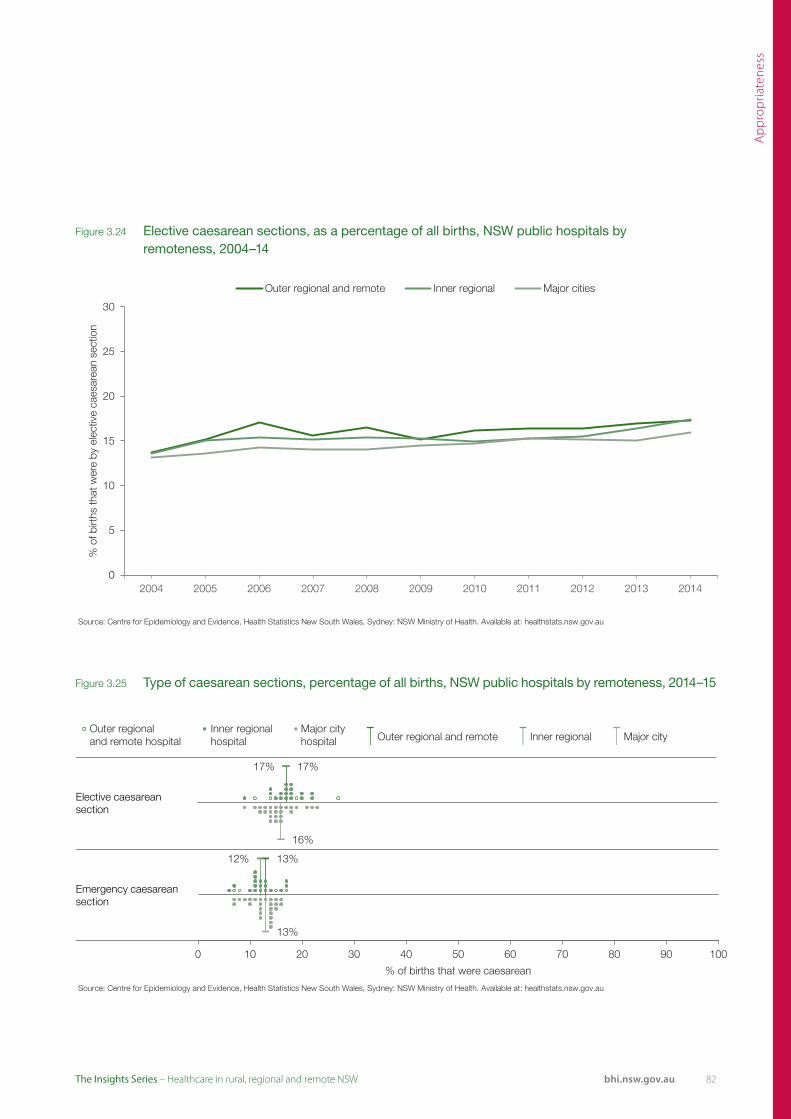
Ap
pro
pria
tene
ss
bhi.nsw.gov.auThe Insights Series – Healthcare in rural, regional and remote NSW
Figure 3.25 Type of caesarean sections, percentage of all births, NSW public hospitals by remoteness, 2014–15
Source: Centre for Epidemiology and Evidence, Health Statistics New South Wales, Sydney: NSW Ministry of Health. Available at: healthstats.nsw.gov.au
17% 17%
16%
0 10 20 30 40 50 60 70 80 90 100
% of births that were elective caesarean
Outer regionaland remote hospital
Inner regional Major cityhospital hospital Outer regional and remote Inner regional Major city
Elective caesarean section
Source: Centre for Epidemiology and Evidence, Health Statistics New South Wales, Sydney: NSW Ministry of Health. Available at: healthstats.nsw.gov.au
13% 12%
13%
0 10 20 30 40 50 60 70 80 90 100
% of births that were caesarean
Outer regionaland remote hospital
Inner regional Major cityhospital hospital Outer regional and remote Inner regional Major city
Emergency caesarean section
Figure 3.24 Elective caesarean sections, as a percentage of all births, NSW public hospitals by remoteness, 2004–14
Source: Centre for Epidemiology and Evidence, Health Statistics New South Wales, Sydney: NSW Ministry of Health. Available at: healthstats.nsw.gov.au
0
5
10
15
20
25
30
2004 2005 2006 2007 2008 2009 2010 2011 2012 2013 2014
% o
f birt
hs th
at w
ere
by e
lect
ive
caes
area
n se
ctio
n
Outer regional and remote Inner regional Major cities
82

8383 bhi.nsw.gov.auThe Insights Series – Healthcare in rural, regional and remote NSW
In the past two years, BHI has released two reports that focus on cancer patients’ experiences of care.26,27
The first report focused on hospital care. Overall, hospitalised cancer patients responded very positively to questions about the appropriateness of care – particularly questions about respectfulness, kindness and courtesy.26 Patients hospitalised in rural hospitals were slightly more positive than those in major city hospitals (Figure 3.26).
The second report focused on the experiences and outcomes of care among patients who visited an outpatient cancer clinic. There were no cancer outpatient clinics situated in outer regional and remote areas of NSW.
The outpatient survey features a number of questions on shared decision-making. When given the opportunity, most people with cancer want to be involved in decisions about their care. Shared decision-making is a collaborative process that allows
Appropriateness of cancer servicesMost rural patients said they were always treated with respect and dignity
Source: BHI, Adult Admitted Patient Survey, 2013-14.
90% 91%
90%
0 10 20 30 40 50 60 70 80 90 100
% of patients
Outer regionaland remote hospital
Inner regional Major cityhospital hospital Outer regional and remote Inner regional Major city
Were you given enough privacy when being examined or treated? (% answering 'Yes, always')
Source: BHI, Adult Admitted Patient Survey, 2013-14.
90% 92%
89%
0 10 20 30 40 50 60 70 80 90 100
% of patients
Outer regionaland remote hospital
Inner regional Major cityhospital hospital Outer regional and remote Inner regional Major city
Were the doctors kind and caring towards you? (% answering 'Yes, always')
Source: BHI, Adult Admitted Patient Survey, 2013-14.
93% 92%
88%
0 10 20 30 40 50 60 70 80 90 100
% of patients
Outer regionaland remote hospital
Inner regional Major cityhospital hospital Outer regional and remote Inner regional Major city
Did you feel you were treated with respect and dignity while you were in the hospital? (% answering'Yes, always')
Source: BHI, Adult Admitted Patient Survey, 2013–14.
92%
85%
0 10 20 30 40 50 60 70 80 90 100
% of patients
Were the nurses kind and caring towards you? (% answering 'Yes, always')
92%
Outer regionaland remote hospital
Inner regional Major cityhospital hospital Outer regional and remote Inner regional Major city
Figure 3.26 Interpersonal aspects of care, percentage of hospitalised cancer patients who selected the most positive response category, NSW public hospitals by remoteness, 2013–14
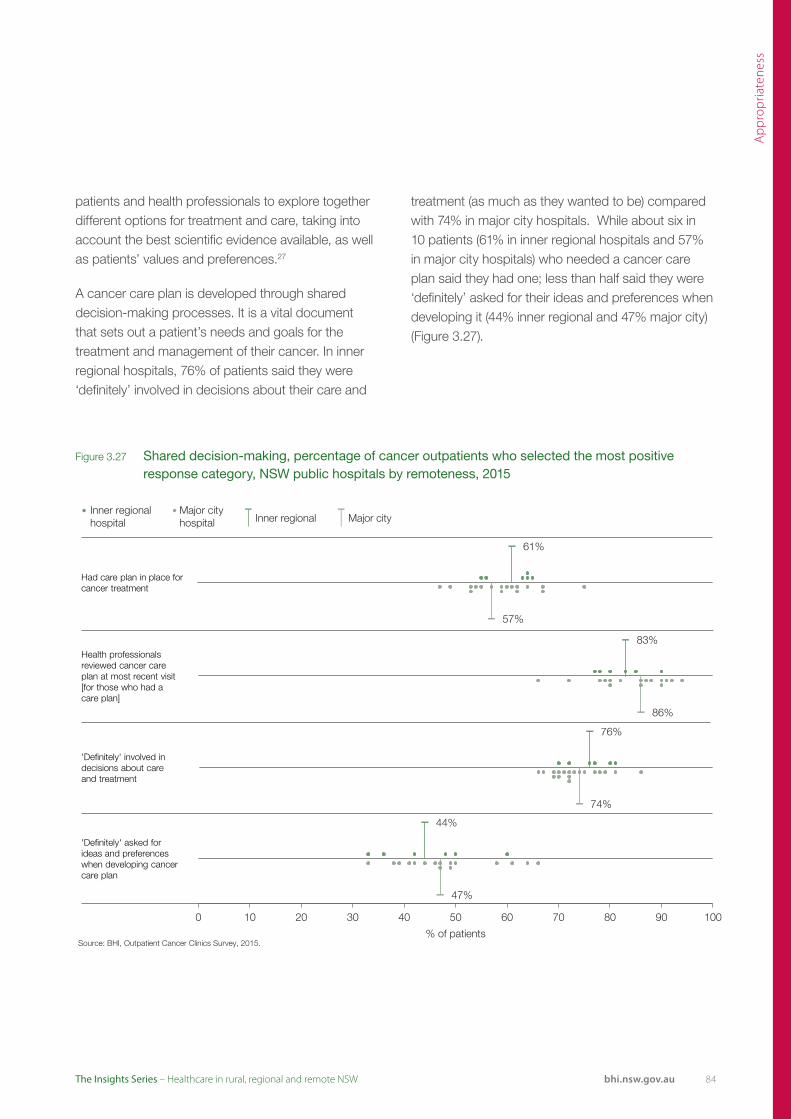
Ap
pro
pria
tene
ss
bhi.nsw.gov.auThe Insights Series – Healthcare in rural, regional and remote NSW
Figure 3.27 Shared decision-making, percentage of cancer outpatients who selected the most positive response category, NSW public hospitals by remoteness, 2015
patients and health professionals to explore together different options for treatment and care, taking into account the best scientific evidence available, as well as patients’ values and preferences.27
A cancer care plan is developed through shared decision-making processes. It is a vital document that sets out a patient’s needs and goals for the treatment and management of their cancer. In inner regional hospitals, 76% of patients said they were ‘definitely’ involved in decisions about their care and
treatment (as much as they wanted to be) compared with 74% in major city hospitals. While about six in 10 patients (61% in inner regional hospitals and 57% in major city hospitals) who needed a cancer care plan said they had one; less than half said they were ‘definitely’ asked for their ideas and preferences when developing it (44% inner regional and 47% major city) (Figure 3.27).
Source: BHI, Outpatient Cancer Clinics Survey, 2015.
61%
57%
0 10 20 30 40 50 60 70 80 90 100
% of patients
Inner regional Major cityhospital hospital Inner regional Major city
Had care plan in place for cancer treatment
Source: BHI, Outpatient Cancer Clinics Survey, 2015.
83%
86%
0 10 20 30 40 50 60 70 80 90 100
% of patients
Inner regional Major cityhospital hospital Inner regional Major city
Health professionals reviewed cancer care plan at most recent visit [for those who had acare plan]
Source: BHI, Outpatient Cancer Clinics Survey, 2015.
76%
74%
0 10 20 30 40 50 60 70 80 90 100
% of patients
Inner regional Major cityhospital hospital Inner regional Major city
'Definitely' involved in decisions about careand treatment
Source: BHI, Outpatient Cancer Clinics Survey, 2015.
44%
47%
0 10 20 30 40 50 60 70 80 90 100
% of patients
Inner regional Major cityhospital hospital Inner regional Major city
'Definitely' asked for ideas and preferences when developing cancer care plan
84

8585 bhi.nsw.gov.auThe Insights Series – Healthcare in rural, regional and remote NSW
Listening to patients hospitalised in small facilitiesSmall hospitals provide coordinated care
Small hospitals play a vital role in providing healthcare to people in rural and regional NSW. While patients admitted to principal referral, major and district hospitals in NSW have been surveyed for over 10 years, until now there has been no data about the experiences of patients admitted to smaller facilities.
The figures on pages 85 to 88 show results from the Small and Rural Facilities survey. Figures 3.28 and 3.30 provide results for each local health district (LHD), comparing responses from patients admitted in larger hospitals with those admitted to smaller hospitals. Figures 3.29 and 3.31 show the variation across all the small facilities surveyed in NSW, by rurality.
Sources: BHI, Adult Admitted Patient Survey, 2015. BHI, Small and Rural Facilities Survey, 2015.
0%
50%
100%
Far
Wes
t
Hun
ter N
ew E
ngla
nd
Mid
Nor
th C
oast
Mur
rum
bidg
ee
Nor
ther
n N
SW
Sou
ther
n N
SW
Wes
tern
NS
W
Cen
tral
Coa
st
Illaw
arra
Sho
alha
ven
Nep
ean
Blu
e M
ount
ains
Nor
ther
n S
ydne
y
Sou
th E
aste
rn S
ydne
y
Sou
th W
este
rn S
ydne
y
Syd
ney
Wes
tern
Syd
ney
Admitted Patient Survey 2015 Small and Rural Facilities Survey 2015
Did a health professional in this hospital tell you about medication side effects to watch for? (% answering 'Yes, completely')
Rural LHDs Urban LHDs
Sources: BHI, Adult Admitted Patient Survey, 2015. BHI, Small and Rural Facilities Survey, 2015.
0%
50%
100%
Far
Wes
t
Hun
ter N
ew E
ngla
nd
Mid
Nor
th C
oast
Mur
rum
bidg
ee
Nor
ther
n N
SW
Sou
ther
n N
SW
Wes
tern
NS
W
Cen
tral
Coa
st
Illaw
arra
Sho
alha
ven
Nep
ean
Blu
e M
ount
ains
Nor
ther
n S
ydne
y
Sou
th E
aste
rn S
ydne
y
Sou
th W
este
rn S
ydne
y
Syd
ney
Wes
tern
Syd
ney
Admitted Patient Survey 2015 Small and Rural Facilities Survey 2015
Thinking about when you left hospital, were you given enough information about how to manage your care at home? (% answering 'Yes, completely')
Rural LHDs Urban LHDs
Sources: BHI, Adult Admitted Patient Survey, 2015. BHI, Small and Rural Facilities Survey, 2015.
0%
50%
100%
Far
Wes
t
Hun
ter N
ew E
ngla
nd
Mid
Nor
th C
oast
Mur
rum
bidg
ee
Nor
ther
n N
SW
Sou
ther
n N
SW
Wes
tern
NS
W
Cen
tral
Coa
st
Illaw
arra
Sho
alha
ven
Nep
ean
Blu
e M
ount
ains
Nor
ther
n S
ydne
y
Sou
th E
aste
rn S
ydne
y
Sou
th W
este
rn S
ydne
y
Syd
ney
Wes
tern
Syd
ney
Admitted Patient Survey 2015 Small and Rural Facilities Survey 2015
In your opinion, did the nurses who treated you know enough about your care and treatment? (% answering 'Yes, always')
Rural LHDs Urban LHDs
Sources: BHI, Adult Admitted Patient Survey, 2015. BHI, Small and Rural Facilities Survey, 2015.
0%
50%
100%
Far W
est
Hunt
er N
ew E
ngla
nd
Mid
Nor
th C
oast
Mur
rum
bidg
ee
North
ern
NSW
Sout
hern
NSW
Wes
tern
NSW
Cent
ral C
oast
Illaw
arra
Sho
alha
ven
Nepe
an B
lue
Mou
ntai
ns
North
ern
Sydn
ey
Sout
h Ea
ster
n Sy
dney
Sout
h W
este
rn S
ydne
y
Sydn
ey
Wes
tern
Syd
ney
Admitted Patient Survey 2015 Small and Rural Facilities Survey 2015
Did hospital staff take your family and home situation into account when planning your discharge? (% answering 'Yes, completely')
Rural LHDs Urban LHDs
Figure 3.28 Communication, coordination and comprehensiveness, percentage of patients who selected the most positive response category, adult admitted and small and rural hospital surveys, LHDs, NSW, 2015
Sources: BHI, Adult Admitted Patient Survey, 2015. BHI, Small and Rural Facilities Survey, 2015.* Peer group A includes (very large) principal referral and specialist hospitals; peer group B includes (large) major hospitals and peer group C includes (medium and small) district hospitals.

Ap
pro
pria
tene
ss
bhi.nsw.gov.auThe Insights Series – Healthcare in rural, regional and remote NSW
Results for nine key questions are reported: they focus on communication, coordination and comprehensiveness, respectfulness, responsiveness and patient engagement.
Around six in 10 patients in small rural hospitals said they were ‘completely’ told about medication side effects (Figure 3.29). Notably, in the smaller facilities survey, 22% of patients in NSW overall said they were
not told about potential side effects compared with 25% in the adult admitted survey [data not shown].
There was marked variation in responses to some of the questions. For example, 82% of patients hospitalised in small facilities in outer regional and remote NSW said hospital staff took their family and home situation into account when planning their discharge, but this ranged across facilities from 63% to 97% (Figure 3.29).
Source: BHI, Small and Rural Facilities Survey, 2015.
63% 60%
0 10 20 30 40 50 60 70 80 90 100
% of patients
Outer regionaland remote hospital
Inner regional Outer regionaland remote hospitals
Inner regionalhospital hospitals
Did a health professional in this hospital tell you about medication side effects to watch for? (% answering 'Yes, completely')
Source: BHI, Small and Rural Facilities Survey, 2015.
82% 85%
0 10 20 30 40 50 60 70 80 90 100
% of patients
Outer regionaland remote hospital
Inner regional Outer regionaland remote hospitals
Inner regionalhospital hospitals
Thinking about when you left this hospital, were you given enough information about how to manage your care at home? (% answering 'Yes, completely')
Source: BHI, Small and Rural Facilities Survey, 2015.
80% 84%
0 10 20 30 40 50 60 70 80 90 100
% of patients
Outer regionaland remote hospital
Inner regional Outer regionaland remote hospitals
Inner regionalhospital hospitals
In your opinion, did the nurses who treated you know enough about your care and treatment? (% answering 'Yes, always')
Source: BHI, Small and Rural Facilities Survey, 2015.
82% 86%
0 10 20 30 40 50 60 70 80 90 100
% of patients
Outer regionaland remote hospital
Inner regional Outer regionaland remote hospitals
Inner regionalhospital hospitals
Did hospital staff take your family and home situation into account when planning your discharge? (% answering 'Yes, completely')
Figure 3.29 Communication, coordination and comprehensiveness, percentage of patients who selected the most positive response category, NSW small rural public hospitals by remoteness, 2015
86
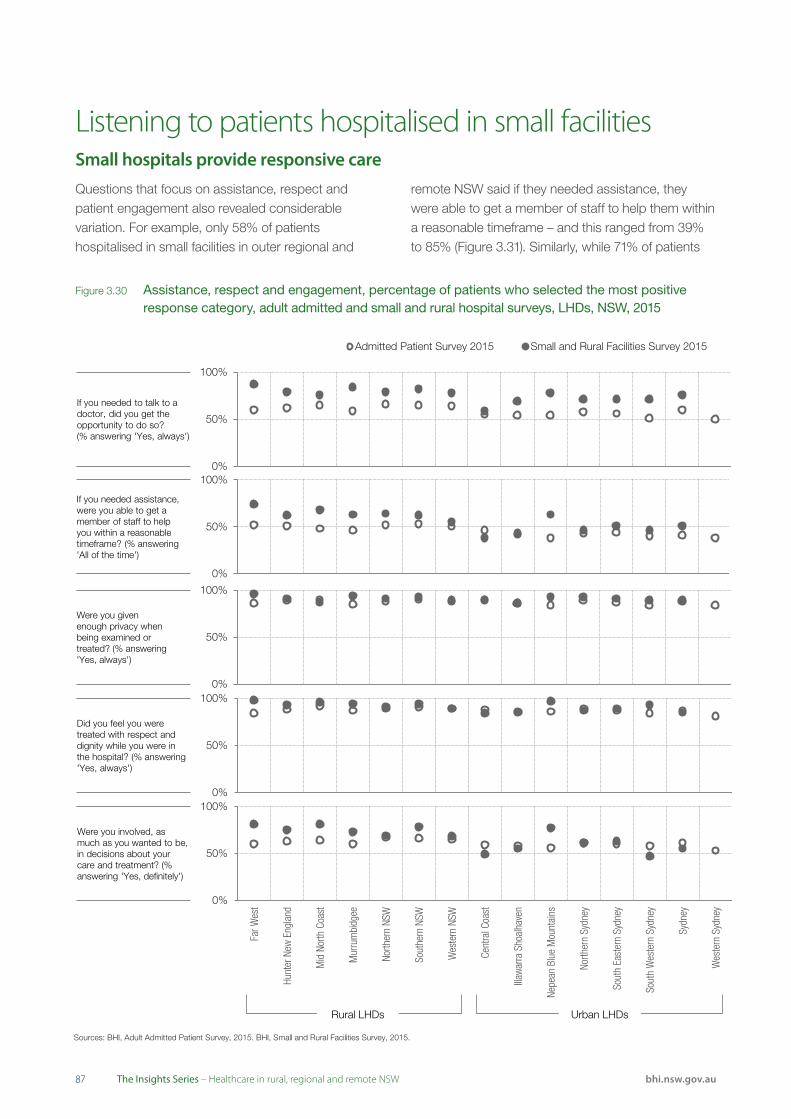
8787 bhi.nsw.gov.auThe Insights Series – Healthcare in rural, regional and remote NSW
Listening to patients hospitalised in small facilitiesSmall hospitals provide responsive care
Sources: BHI, Adult Admitted Patient Survey, 2015. BHI, Small and Rural Facilities Survey, 2015.
0%
50%
100%
Far
Wes
t
Hun
ter N
ew E
ngla
nd
Mid
Nor
th C
oast
Mur
rum
bidg
ee
Nor
ther
n N
SW
Sou
ther
n N
SW
Wes
tern
NS
W
Cen
tral
Coa
st
Illaw
arra
Sho
alha
ven
Nep
ean
Blu
e M
ount
ains
Nor
ther
n S
ydne
y
Sou
th E
aste
rn S
ydne
y
Sou
th W
este
rn S
ydne
y
Syd
ney
Wes
tern
Syd
ney
Admitted Patient Survey 2015 Small and Rural Facilities Survey 2015
Did you feel you were treated with respect and dignity while you were in the hospital? (% answering 'Yes, always')
Rural LHDs Urban LHDs
Questions that focus on assistance, respect and patient engagement also revealed considerable variation. For example, only 58% of patients hospitalised in small facilities in outer regional and
remote NSW said if they needed assistance, they were able to get a member of staff to help them within a reasonable timeframe – and this ranged from 39% to 85% (Figure 3.31). Similarly, while 71% of patients
Sources: BHI, Adult Admitted Patient Survey, 2015. BHI, Small and Rural Facilities Survey, 2015.
0%
50%
100%
Far
Wes
t
Hun
ter N
ew E
ngla
nd
Mid
Nor
th C
oast
Mur
rum
bidg
ee
Nor
ther
n N
SW
Sou
ther
n N
SW
Wes
tern
NS
W
Cen
tral
Coa
st
Illaw
arra
Sho
alha
ven
Nep
ean
Blu
e M
ount
ains
Nor
ther
n S
ydne
y
Sou
th E
aste
rn S
ydne
y
Sou
th W
este
rn S
ydne
y
Syd
ney
Wes
tern
Syd
ney
Admitted Patient Survey 2015 Small and Rural Facilities Survey 2015
If you needed to talk to a doctor, did you get the opportunity to do so?(% answering 'Yes, always')
Rural LHDs Urban LHDs
Sources: BHI, Adult Admitted Patient Survey, 2015. BHI, Small and Rural Facilities Survey, 2015.
0%
50%
100%
Far W
est
Hunt
er N
ew E
ngla
nd
Mid
Nor
th C
oast
Mur
rum
bidg
ee
North
ern
NSW
Sout
hern
NSW
Wes
tern
NSW
Cent
ral C
oast
Illaw
arra
Sho
alha
ven
Nepe
an B
lue
Mou
ntai
ns
North
ern
Sydn
ey
Sout
h Ea
ster
n Sy
dney
Sout
h W
este
rn S
ydne
y
Sydn
ey
Wes
tern
Syd
ney
Admitted Patient Survey 2015 Small and Rural Facilities Survey 2015
Were you involved, as much as you wanted to be, in decisions about your care and treatment? (% answering 'Yes, definitely')
Rural LHDs Urban LHDs
Sources: BHI, Adult Admitted Patient Survey, 2015. BHI, Small and Rural Facilities Survey, 2015.
0%
50%
100%
Far
Wes
t
Hun
ter N
ew E
ngla
nd
Mid
Nor
th C
oast
Mur
rum
bidg
ee
Nor
ther
n N
SW
Sou
ther
n N
SW
Wes
tern
NS
W
Cen
tral
Coa
st
Illaw
arra
Sho
alha
ven
Nep
ean
Blu
e M
ount
ains
Nor
ther
n S
ydne
y
Sou
th E
aste
rn S
ydne
y
Sou
th W
este
rn S
ydne
y
Syd
ney
Wes
tern
Syd
ney
Admitted Patient Survey 2015 Small and Rural Facilities Survey 2015
If you needed assistance, were you able to get a member of staff to help you within a reasonable timeframe? (% answering 'All of the time')
Rural LHDs Urban LHDs
Sources: BHI, Adult Admitted Patient Survey, 2015. BHI, Small and Rural Facilities Survey, 2015.
0%
50%
100%
Far
Wes
t
Hun
ter N
ew E
ngla
nd
Mid
Nor
th C
oast
Mur
rum
bidg
ee
Nor
ther
n N
SW
Sou
ther
n N
SW
Wes
tern
NS
W
Cen
tral
Coa
st
Illaw
arra
Sho
alha
ven
Nep
ean
Blu
e M
ount
ains
Nor
ther
n S
ydne
y
Sou
th E
aste
rn S
ydne
y
Sou
th W
este
rn S
ydne
y
Syd
ney
Wes
tern
Syd
ney
Admitted Patient Survey 2015 Small and Rural Facilities Survey 2015
Were you givenenough privacy when being examined or treated? (% answering 'Yes, always')
Rural LHDs Urban LHDs
Figure 3.30 Assistance, respect and engagement, percentage of patients who selected the most positive response category, adult admitted and small and rural hospital surveys, LHDs, NSW, 2015
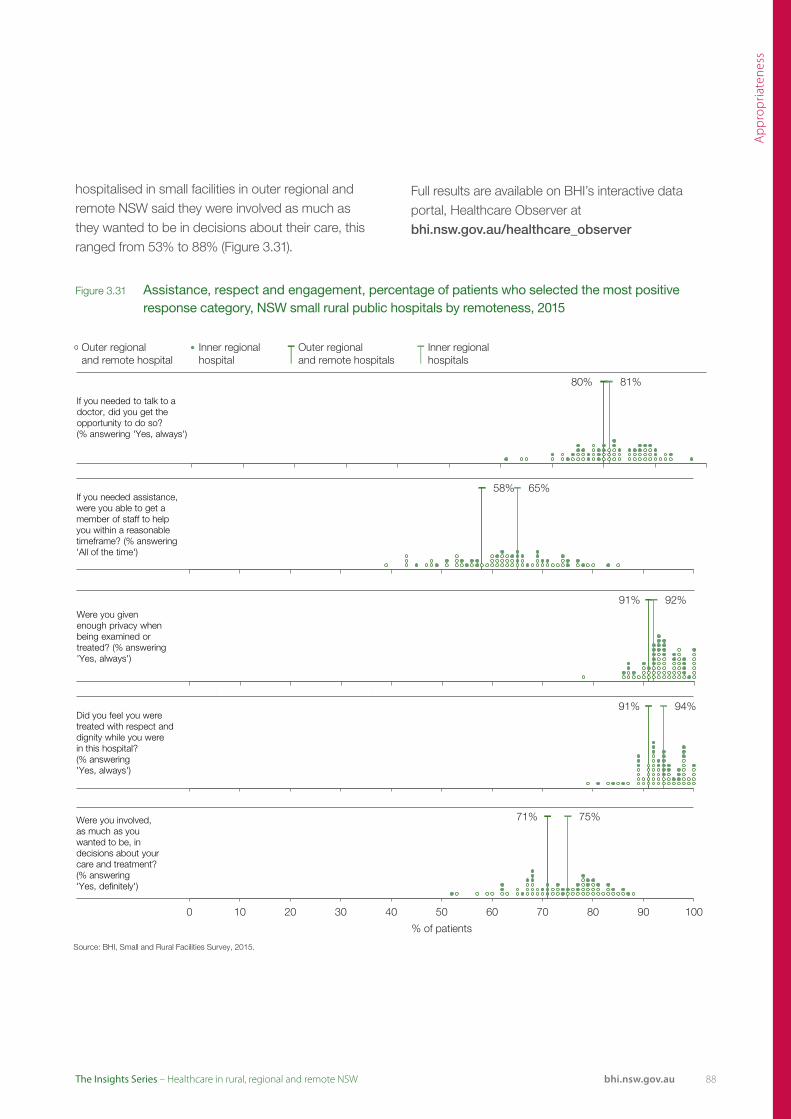
Ap
pro
pria
tene
ss
bhi.nsw.gov.auThe Insights Series – Healthcare in rural, regional and remote NSW
Source: BHI, Small and Rural Facilities Survey, 2015.
91% 94%
0 10 20 30 40 50 60 70 80 90 100
% of patients
Outer regionaland remote hospital
Inner regional Outer regionaland remote hospitals
Inner regionalhospital hospitals
Did you feel you were treated with respect and dignity while you were in this hospital? (% answering 'Yes, always')
hospitalised in small facilities in outer regional and remote NSW said they were involved as much as they wanted to be in decisions about their care, this ranged from 53% to 88% (Figure 3.31).
Full results are available on BHI’s interactive data portal, Healthcare Observer at bhi.nsw.gov.au/healthcare_observer
Source: BHI, Small and Rural Facilities Survey, 2015.
80% 81%
0 10 20 30 40 50 60 70 80 90 100
% of patients
Outer regionaland remote hospital
Inner regional Outer regionaland remote hospitals
Inner regionalhospital hospitals
If you needed to talk to a doctor, did you get the opportunity to do so?(% answering 'Yes, always')
Source: BHI, Small and Rural Facilities Survey, 2015.
71% 75%
0 10 20 30 40 50 60 70 80 90 100
% of patients
Outer regionaland remote hospital
Inner regional Outer regionaland remote hospitals
Inner regionalhospital hospitals
Were you involved,as much as you wanted to be, in decisions about your care and treatment? (% answering 'Yes, definitely')
Source: BHI, Small and Rural Facilities Survey, 2015.
58% 65%
0 10 20 30 40 50 60 70 80 90 100
% of patients
Outer regionaland remote hospital
Inner regional Outer regionaland remote hospitals
Inner regionalhospital hospitals
If you needed assistance, were you able to get a member of staff to help you within a reasonable timeframe? (% answering 'All of the time')
Source: BHI, Small and Rural Facilities Survey, 2015.
91% 92%
0 10 20 30 40 50 60 70 80 90 100
% of patients
Outer regionaland remote hospital
Inner regional Outer regionaland remote hospitals
Inner regionalhospital hospitals
Were you given enough privacy when being examined or treated? (% answering 'Yes, always')
Figure 3.31 Assistance, respect and engagement, percentage of patients who selected the most positive response category, NSW small rural public hospitals by remoteness, 2015
88

8989 bhi.nsw.gov.auThe Insights Series – Healthcare in rural, regional and remote NSW
The 2014 Adult Admitted Patient Survey included an oversample of Aboriginal patients in order to explore, for the first time, variation across NSW in their experiences and self-reported outcomes of hospital care. The survey was sent to a random sample of 13,031 adult patients who were identified as Aboriginal and/or Torres Strait Islander in the admitted patient data collection.
Completed questionnaires were received from 2,714 of patients (response rate 21%). Almost one in 10 of all adult Aboriginal patients hospitalised in 2014 responded to the survey (2,714 out of 13,031 patients).
Aboriginal patients reflected positively on their experiences in hospital – 64% rated care overall as ‘very good’ compared to 63% of non-Aboriginal
Appropriateness and Aboriginality Gaps in experiences of care are wider in rural hospitals
‘Always’ got the opportunity to talk to a nurse when needed
Urban hospitals
Rural hospitals
‘Always’ got the opportunity to talk to a doctor when needed
Urban hospitals
Rural hospitals
Staff assisted within a reasonable timeframe ‘all of the time’
Urban hospitals
Rural hospitals
Healthcare professional ‘completely’ discussed worries or fears
Urban hospitals
Rural hospitals
Cultural or religious beliefs were ‘always’ respected
Urban hospitals
Rural hospitals
‘Always’ treated with respect and dignity
Urban hospitals
Rural hospitals
*
Non-Aboriginal patientsAboriginal patients
*
*
*
*
*
Figure 3.32 Appropriateness of care, percentage of patients who selected the most positive response category, Aboriginal and non-Aboriginal patients, urban and rural NSW public hospitals, 2014
Source: Bureau of Health Information. Patient Perspectives. Hospital Care for Aboriginal People. Sydney (NSW); BHI; 2016.
* There was a significant difference in the proportion of Aboriginal and non-Aboriginal patients who selected the most positive response category.

Ap
pro
pria
tene
ss
bhi.nsw.gov.auThe Insights Series – Healthcare in rural, regional and remote NSW
‘Always’ given enough privacy when being examined or treated
Urban hospitals
Rural hospitals
‘Always’ given enough privacy when discussing condition or treatment
Urban hospitals
Rural hospitals
‘Completely’ involved in decisions about use of medication
Urban hospitals
Rural hospitals
‘Definitely’ involved in decisions about care and treatment
Urban hospitals
Rural hospitals
‘Definitely’ involved in decisions about discharge
Urban hospitals
Rural hospitals
Give ‘completely’ enough information to manage care at home
Urban hospitals
Rural hospitals
*
Non-Aboriginal patientsAboriginal patients
*
*
*
patients. However, when asked about specific aspects of care, Aboriginal patients were less positive than non-Aboriginal patients for 26 of the 55 survey questions analysed in the BHI report.
Differences in experiences of care between Aboriginal and non-Aboriginal patients are generally bigger in hospitals in rural areas (regional and
remote) than those in urban areas (major cities). Results from the NSW Patient Survey Program generally show that patients hospitalised in rural hospitals report more positive patient experiences than those hospitalised in urban hospitals,28 however this effect was often not apparent among Aboriginal patients (Figures 3.32 and 3.33).
*
Figure 3.33 Appropriateness of care, percentage of patients who selected the most positive response category, Aboriginal and non-Aboriginal patients, urban and rural NSW public hospitals, 2014
Source: Bureau of Health Information. Patient Perspectives. Hospital Care for Aboriginal People. Sydney (NSW); BHI; 2016.
* There was a significant difference in the proportion of Aboriginal and non-Aboriginal patients who selected the most positive response category.
90

9191 bhi.nsw.gov.auThe Insights Series – Healthcare in rural, regional and remote NSW
EffectivenessMaking a difference for patients

Effe
ctiv
enes
s
92bhi.nsw.gov.auThe Insights Series – Healthcare in rural, regional and remote NSW
EffectivenessMaking a difference for patients
9393 bhi.nsw.gov.auThe Insights Series – Healthcare in rural, regional and remote NSW
Effectiveness refers to the extent to which healthcare services deliver the benefits expected from them – do they reduce the incidence, duration, intensity or consequences of patients’ health problems?
Effectiveness is closely aligned to the broader concept of impact which considers the extent to which a patient’s overall health and wellbeing are affected by the care received.
Effectiveness measures focus on the outcomes of treatment – such as mortality, unplanned readmissions, changes in functional status, and quality of life – as well as patients’ confidence and trust in the healthcare systems and providers, and their ability to realise the potential benefits of treatment, through increased health literacy and self-efficacy at managing their health problems.
Measures can include:
• Assessments of safety outcomes – whether there were any adverse events
• Measures that assess whether the healthcare services provided made a discernible change to patients’ health and functional status
• Measures of public trust and confidence in healthcare professionals, organisations and systems.
EffectivenessMaking a difference for patients
Summary of findings
• Across the three remoteness categories, a higher proportion of people who lived in outer regional and remote areas were ‘very confident’ or ‘confident’ in managing their health problems
• Results from a survey of adult admitted patients showed that a higher proportion of patients in rural hospitals had confidence and trust in healthcare professionals, compared to patients in major city hospitals
• Emergency department re-presentations within 48 hours were more common in rural hospitals
• Hospitals with higher than expected 30-day mortality and readmission rates were located in rural and urban areas
• A smaller proportion of patients hospitalised in rural hospitals experienced complications
• Responses from patients in two rural outpatient cancer clinics were more positive than NSW for multiple measures
• Aboriginal patients were less positive than non-Aboriginal patients regarding self-reported outcomes of hospital care.

Effe
ctiv
enes
s
94bhi.nsw.gov.auThe Insights Series – Healthcare in rural, regional and remote NSW
Insights from the peer reviewed literature
• There is a marked gradient of increasing chronic disease mortality from cities to remote and very remote areas in NSW1,2
• A systematic review found that common elements of effective and acceptable chronic kidney disease management programs for Indigenous people include integration within existing health services, nurse-led care, intensive follow-up, provision of culturally-appropriate education, governance structures, community ownership, robust clinical systems supporting communication and the role of Indigenous health workers3
• Online and mobile phone-delivered mental health programs may be effective and acceptable tools for reducing symptoms of depression and other mental health problems in rural areas4,5
• Community outreach midwifery-led models of care can improve access to antenatal care for Aboriginal women living in remote areas6
• Telehealth and teleoncology models of care allow for the timely and safe delivery of chemotherapy to patients in rural and remote areas7,8
• Patients living in rural areas are less likely to survive out of hospital cardiac arrest than those living in urban areas9
• A data linkage study found that risk of death from potentially curable colorectal cancer was higher in patients living in remote areas compared with those living in metropolitan areas10
• Under-supply of primary healthcare services contributes to unplanned re-presentations to regional NSW hospitals11
• Mobile screening for abdominal aortic aneurysm in a remote area of Australia was found to be highly acceptable to the target population, with no deleterious effect on psychological well-being or quality of life12
• Cardiologist-supported remote risk stratification, management and facilitated access to tertiary hospital-based early invasive management was associated with an improvement in 30-day mortality for patients who initially present to rural hospitals and are diagnosed with acute myocardial infarction (AMI)13
• Asthma death rates per 100,000 population are lowest in major cities in NSW and highest in inner regional areas.12

9595 bhi.nsw.gov.auThe Insights Series – Healthcare in rural, regional and remote NSW
Effective healthcare supports and enables patients to manage their own care. Often referred to as ‘self-efficacy’, such patient engagement is associated with better quality care, fewer errors and more positive attitudes towards the healthcare system. It is particularly important for patients with chronic conditions.14
Measures of self efficacy focus on patients’ confidence in their ability to participate in their care; and in seeking, obtaining and understanding health information.
Survey data show that among NSW people with a chronic condition, those who lived in outer regional and remote areas had relatively high levels of self-efficacy – 39% said they were ‘very confident’ and 57% said they were ‘confident’ in managing their own health problems (Figure 4.1).
When asked about the effectiveness of their chronic disease treatment plan, compared to other remoteness categories, a higher proportion of patients in inner regional areas said their plan helped a lot (Figure 4.1).
Making a difference: Enabling patientsA higher proportion of people in outer regional and remote areas were ‘very confident’ or ‘confident’ in managing their health problems
Figure 4.1 Self-efficacy and management of chronic conditions, all response categories, adults aged 55+ years, NSW by remoteness of residence, 2013 and 2014
Outer regional and remote
Inner regional
Major cities
How confident are you that you can control and manage your health problems?
Source: 2013 Commonwealth Fund International Health Policy Survey. 2014 Commonwealth Fund International Health Policy Survey of Older Adults.
36%
43%
39%
51%
45%
57%
13%
12%
Very confident Confident Not very confident/Not at all confident
Outer regional and remote
Inner regional
Major cities
Has the treatment plan youhave for your condition helped you control or manage your chronic condition?(adults aged 55+ years)
Source: 2013 Commonwealth Fund International Health Policy Survey. 2014 Commonwealth Fund International Health Policy Survey of Older Adults.
62%
65%
59%
28%
24%
27%
8%
11%
11%
A lot Some Only a little Not at all
Outer regional and remote
Inner regional
Major cities
In the past year, have you stayed overnight in a hospital or visited the emergency department because of your condition (hypertension,diabetes or asthma)?(adults aged 55+ years)
Sources: 2013 Commonwealth Fund International Health Policy Survey. 2014 Commonwealth Fund International Health Policy Survey of Older Adults.
12%
17%
12%
88%
83%
88%
Yes No
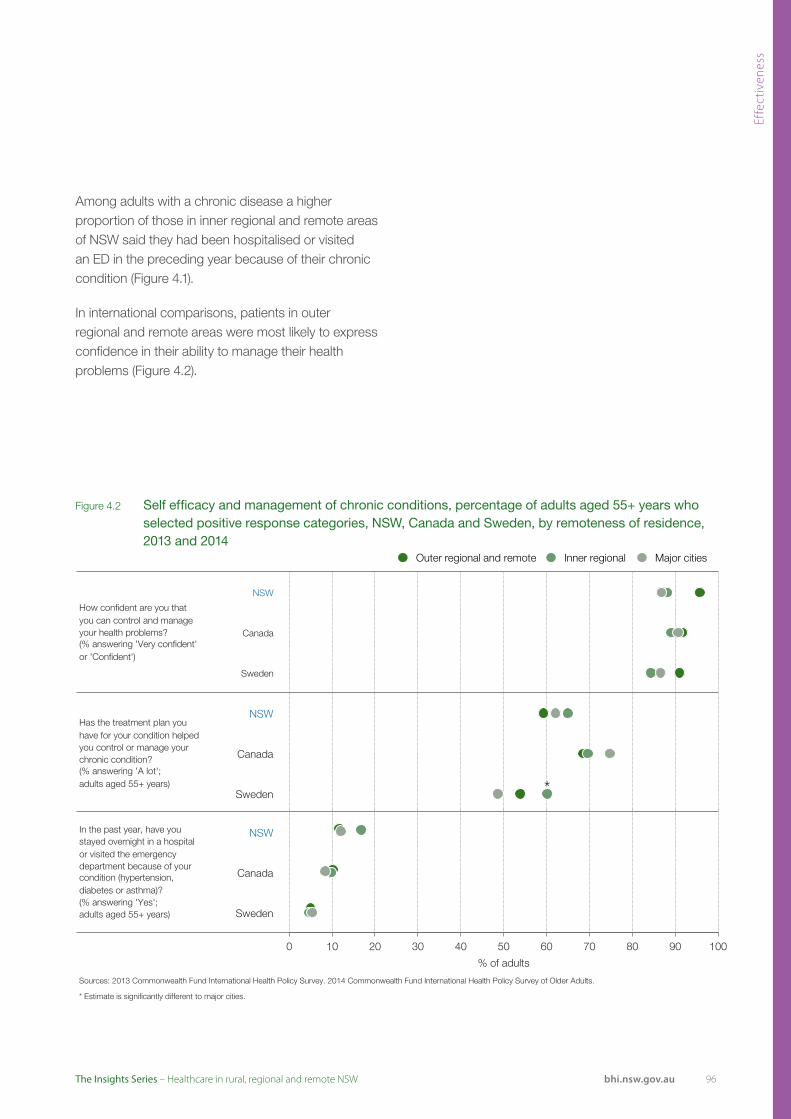
Effe
ctiv
enes
s
96bhi.nsw.gov.auThe Insights Series – Healthcare in rural, regional and remote NSW
NSW
Canada
Sweden
How confident are you thatyou can control and manage your health problems?(% answering 'Very confident'or 'Confident')
Source: 2013 Commonwealth Fund International Health Policy Survey. 2014 Commonwealth Fund International Health Policy Survey of Older Adults.
Outer regional and remote Inner regional Major cities
0 10 20 30 40 50 60 70 80 90 100
% of adults NSW
Canada
Sweden
Has the treatment plan youhave for your condition helped you control or manage your chronic condition?(% answering 'A lot';adults aged 55+ years)
Source: 2013 Commonwealth Fund International Health Policy Survey. 2014 Commonwealth Fund International Health Policy Survey of Older Adults.
Outer regional and remote Inner regional Major cities
*
0 10 20 30 40 50 60 70 80 90 100
% of adults NSW
Canada
Sweden
In the past year, have you stayed overnight in a hospital or visited the emergency department because of your condition (hypertension,diabetes or asthma)? (% answering 'Yes';adults aged 55+ years)
Sources: 2013 Commonwealth Fund International Health Policy Survey. 2014 Commonwealth Fund International Health Policy Survey of Older Adults.
* Estimate is significantly different to major cities.
Outer regional and remote Inner regional Major cities
0 10 20 30 40 50 60 70 80 90 100
% of adults
Figure 4.2 Self efficacy and management of chronic conditions, percentage of adults aged 55+ years who selected positive response categories, NSW, Canada and Sweden, by remoteness of residence, 2013 and 2014
Among adults with a chronic disease a higher proportion of those in inner regional and remote areas of NSW said they had been hospitalised or visited an ED in the preceding year because of their chronic condition (Figure 4.1).
In international comparisons, patients in outer regional and remote areas were most likely to express confidence in their ability to manage their health problems (Figure 4.2).
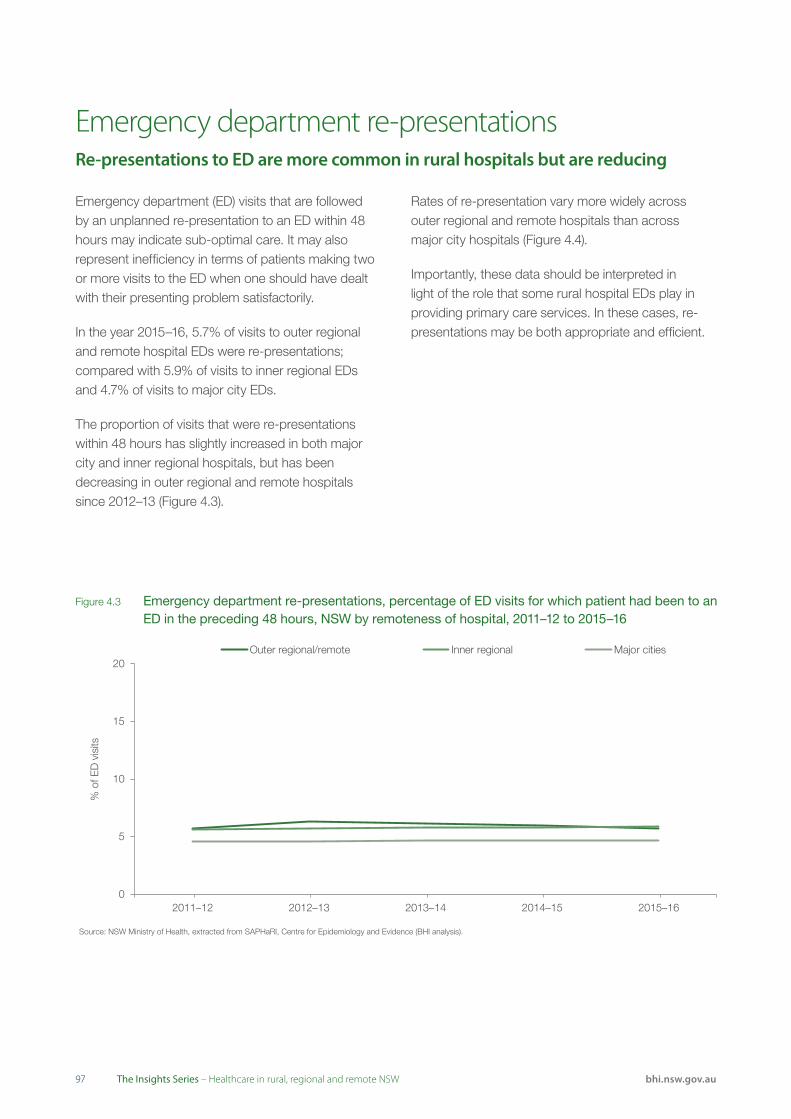
9797 bhi.nsw.gov.auThe Insights Series – Healthcare in rural, regional and remote NSW
Emergency department (ED) visits that are followed by an unplanned re-presentation to an ED within 48 hours may indicate sub-optimal care. It may also represent inefficiency in terms of patients making two or more visits to the ED when one should have dealt with their presenting problem satisfactorily.
In the year 2015–16, 5.7% of visits to outer regional and remote hospital EDs were re-presentations; compared with 5.9% of visits to inner regional EDs and 4.7% of visits to major city EDs.
The proportion of visits that were re-presentations within 48 hours has slightly increased in both major city and inner regional hospitals, but has been decreasing in outer regional and remote hospitals since 2012–13 (Figure 4.3).
Rates of re-presentation vary more widely across outer regional and remote hospitals than across major city hospitals (Figure 4.4).
Importantly, these data should be interpreted in light of the role that some rural hospital EDs play in providing primary care services. In these cases, re-presentations may be both appropriate and efficient.
Emergency department re-presentationsRe-presentations to ED are more common in rural hospitals but are reducing
Figure 4.3 Emergency department re-presentations, percentage of ED visits for which patient had been to an ED in the preceding 48 hours, NSW by remoteness of hospital, 2011–12 to 2015–16
Outer regional/remote Inner regional Major cities20
15
10
5
02011–12 2012–13 2013–14 2014–15 2015–16
Source: NSW Ministry of Health, extracted from SAPHaRI, Centre for Epidemiology and Evidence (BHI analysis).
% o
f ED
vis
its
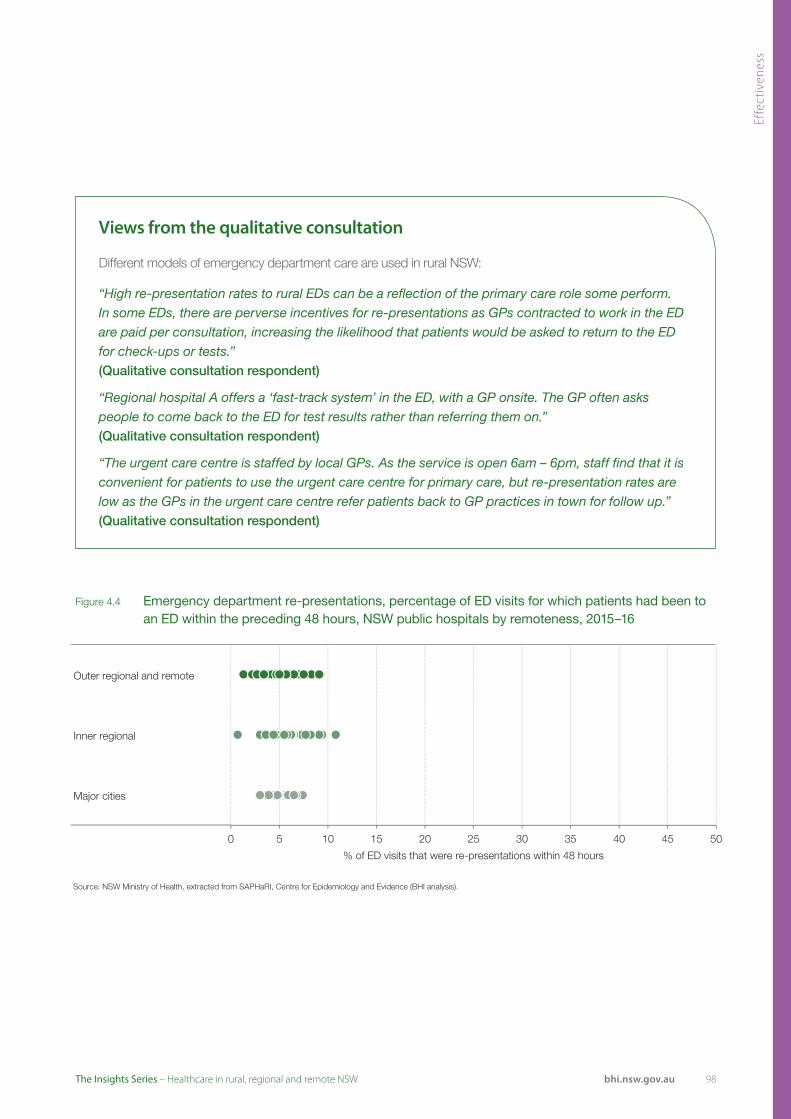
Effe
ctiv
enes
s
98bhi.nsw.gov.auThe Insights Series – Healthcare in rural, regional and remote NSW
Figure 4.4 Emergency department re-presentations, percentage of ED visits for which patients had been to an ED within the preceding 48 hours, NSW public hospitals by remoteness, 2015–16
Outer regional and remote
Inner regional
Major cities
0 5 10 15 20 25 30 35
% of ED visits that were re-presentations within 48 hours
40 45 50
Source: NSW Ministry of Health, extracted from SAPHaRI, Centre for Epidemiology and Evidence (BHI analysis).
Views from the qualitative consultation
Different models of emergency department care are used in rural NSW:
“High re-presentation rates to rural EDs can be a reflection of the primary care role some perform. In some EDs, there are perverse incentives for re-presentations as GPs contracted to work in the ED are paid per consultation, increasing the likelihood that patients would be asked to return to the ED for check-ups or tests.” (Qualitative consultation respondent)
“Regional hospital A offers a ‘fast-track system’ in the ED, with a GP onsite. The GP often asks people to come back to the ED for test results rather than referring them on.” (Qualitative consultation respondent)
“The urgent care centre is staffed by local GPs. As the service is open 6am – 6pm, staff find that it is convenient for patients to use the urgent care centre for primary care, but re-presentation rates are low as the GPs in the urgent care centre refer patients back to GP practices in town for follow up.” (Qualitative consultation respondent)
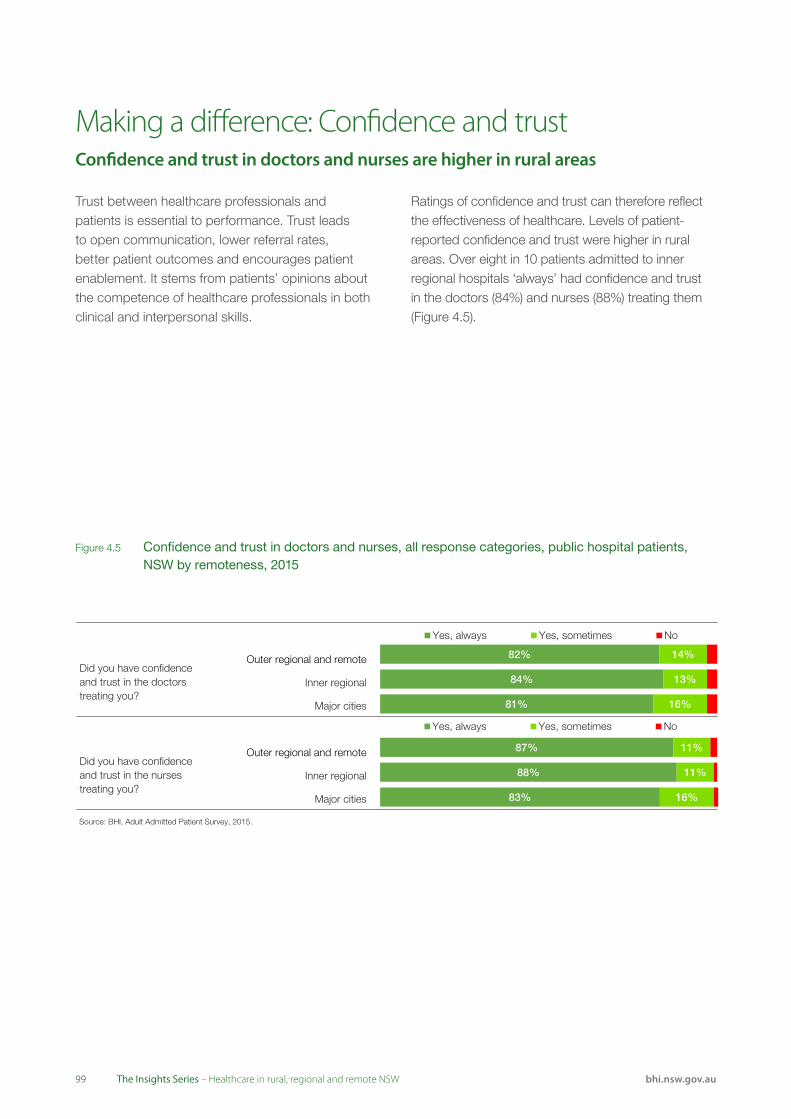
9999 bhi.nsw.gov.auThe Insights Series – Healthcare in rural, regional and remote NSW
Trust between healthcare professionals and patients is essential to performance. Trust leads to open communication, lower referral rates, better patient outcomes and encourages patient enablement. It stems from patients’ opinions about the competence of healthcare professionals in both clinical and interpersonal skills.
Ratings of confidence and trust can therefore reflect the effectiveness of healthcare. Levels of patient-reported confidence and trust were higher in rural areas. Over eight in 10 patients admitted to inner regional hospitals ‘always’ had confidence and trust in the doctors (84%) and nurses (88%) treating them (Figure 4.5).
Making a difference: Confidence and trust Confidence and trust in doctors and nurses are higher in rural areas
Figure 4.5 Confidence and trust in doctors and nurses, all response categories, public hospital patients, NSW by remoteness, 2015
Outer regional and remote
Inner regional
Major cities
Did you have confidenceand trust in the doctorstreating you?
Source: BHI, Adult Admitted Patient Survey, 2015.
81%
84%
82%
16%
13%
14%
Yes, always Yes, sometimes No
Outer regional and remote
Inner regional
Major cities
Did you have confidenceand trust in the nursestreating you?
Source: BHI, Adult Admitted Patient Survey, 2015.
83%
88%
87%
16%
11%
11%
Yes, always Yes, sometimes No

Effe
ctiv
enes
s
100bhi.nsw.gov.auThe Insights Series – Healthcare in rural, regional and remote NSW
Figure 4.6 Confidence and trust in doctors and nurses, percentage of patients who selected the most positive response category, NSW public hospitals by remoteness, 2015
Source: BHI, Adult Admitted Patient Survey, 2015.
82% 84%
81%
0 10 20 30 40 50 60 70 80 90 100
% of patients
Outer regionaland remote hospital
Inner regional Major cityhospital hospital Outer regional and remote Inner regional Major city
Did you have confidence and trust in the doctors treating you? (% answering'Yes, always')
Source: BHI, Adult Admitted Patient Survey, 2015.
87% 88%
83%
0 10 20 30 40 50 60 70 80 90 100
% of patients
Outer regionaland remote hospital
Inner regional Major cityhospital hospital Outer regional and remote Inner regional Major city
Did you have confidence and trust in the nurses treating you? (% answering 'Yes, always')
Views from the qualitative consultation
“My [clients] want to see me – they know me and trust me. I provide antenatal, child health, promotion and prevention. I do their antenatal and follow them all the way through. We have a 100% vaccination rate. We also have 100% attendance at our dental clinics. If I put them on the list, they will come.” (Qualitative consultation respondent)
There was variation at a hospital level however. For rural hospitals, the proportion of patients who said they ‘always’ had confidence and trust in doctors ranged from 75% to 91%; while in major city hospitals it ranged from 74% to 93% (Figure 4.6).
Similarly the proportion of patients in rural hospitals who said they ‘always’ had confidence and trust in nurses ranged from 81% to 94% while in major city hospitals it ranged from 76% to 94% (Figure 4.6).
There were only four rural hospitals where less than 80% of patients said they ‘always’ had confidence and trust in doctors and no rural hospitals where less than 80% of patients said they ‘always’ had confidence and trust in nurses (Figure 4.6).

101101 bhi.nsw.gov.auThe Insights Series – Healthcare in rural, regional and remote NSW
Outcomes of care: Mortality and readmissionsHospitals with higher than expected mortality and readmissions were located in rural and urban areas
Number of hospitals withlower than expected mortality
No differentthan expected
Number of hospitals withhigher than expected mortality
236
112
226
2811
308
91
Acute myocardial infarction
Source: NSW Ministry of Health, extracted from SAPHaRI, Centre for Epidemiology and Evidence (BHI analysis).Note: Includes A-C hospitals with more than 50 index admissions.
Ischaemic stroke
Congestive heart failure
Chronic obstructive pulmonary disease
Pneumonia
Hip fracture surgery
Major city hospitalInner regional hospitalOuter regional and remote hospital
27
22
30
28
26
21
Figure 4.7 Risk-standardised 30-day mortality rate, NSW public hospitals, by remoteness, July 2009 to June 2012
BHI has released a series of reports that measure unwarranted clinical variation in outcomes among NSW patients hospitalised for acute myocardial infarction (heart attacks), ischaemic stroke, haemorrhagic stroke, congestive heart failure, pneumonia, chronic obstructive pulmonary disease, and hip fracture surgery and joint replacement surgery.15,16
Results were reported for mortality in the 30 days following hospitalisation in terms of a risk-standardised mortality ratio (RSMR); and for unplanned readmissions in the 30 days following discharge from hospital in terms of a risk-standardised readmission ratio (RSRR).
For each individual hospital in NSW, statistical models were used to calculate an ‘expected’ rate of mortality and readmissions, given the characteristics of patients admitted to that hospital.
Results were expressed as ‘lower than expected’, ‘no different than expected’ or ‘higher than expected’. Detailed results for all NSW hospitals data are available on BHI’s interactive data portal at bhi.nsw.gov.au/healthcare_observer

Effe
ctiv
enes
s
102bhi.nsw.gov.auThe Insights Series – Healthcare in rural, regional and remote NSW
Acute myocardial infarction
Ischaemic stroke
Congestive heart failure
Chronic obstructive pulmonary disease
Pneumonia
Hip fracture surgery
Number of hospitals withlower than expected readmissions
No differentthan expected
Number of hospitals with higher than expected readmissions
162
132
277
2810
2910
151
Source: NSW Ministry of Health, extracted from SAPHaRI, Centre for Epidemiology and Evidence (BHI analysis).Note: Includes A-C hospitals with more than 50 index admissions.
Major city hospitalInner regional hospitalOuter regional and remote hospital
28
27
30
32
28
19
Figure 4.8 Risk-standardised 30-day readmission rate, NSW public hospitals, by remoteness, July 2009 to June 2012
Figures 4.7 and 4.8 display patterns of hospital results according to remoteness. For example, for acute myocardial infarction 30-day mortality, among the 65 hospitals that admitted acute patients there were 27 major city hospitals, 23 inner regional hospitals and six outer regional and remote hospitals that had RSMRs no different than expected. There were three hospitals with lower than expected RSMRs and all of these were sited in major cities. There were six hospitals with higher than expected RSMRs – two of these were major city hospitals and four were inner regional hospitals.
Looking across the suite of results, major city hospitals were more likely to achieve lower than expected mortality and readmissions. Hospitals with higher than expected mortality and readmissions were found across the remoteness categories.

103103 bhi.nsw.gov.auThe Insights Series – Healthcare in rural, regional and remote NSW
Complications of surgical or medical care are associated with hospital care but can also be influenced by the availability of primary care or community care. While rates serve as short-term indicators of performance, not all complications are avoidable and rates should be interpreted with caution. This is particularly true if results have not been adjusted for case mix, as is the case here.
In 2014–15, there were 15,139 hospitalisations in NSW public hospitals for which ‘complications of surgical or medical care’ was the principal diagnosis. Calculated as an age–sex standardised rate, complications were highest in major city hospitals (2,272 per 100,000 hospitalisations) and lowest in outer regional and remote hospitals (1,435 per 100,000) (Figure 4.9).
Patient survey data provide another perspective on complications. Among patients admitted to a public hospital in outer regional and remote NSW, 13% said they experienced a complication during or shortly after their hospital stay. This was a lower proportion than among patients hospitalised in inner regional (14%) or major city (16%) hospitals (Figure 4.10).
Infection was the most commonly reported complication. Across NSW, 4% of patients hospitalised in outer regional or remote hospitals and 5% of patients hospitalised in major city hospitals said they experienced an infection (Figure 4.11).
Complications and adverse eventsRural hospitals have lower rates of complications
Figure 4.9 Hospitalisations for complications of surgical and medical care, public hospitals in NSW by remoteness, 2014–15
Source: NSW Ministry of Health, extracted from SAPHaRI, Centre for Epidemiology and Evidence (BHI analysis).
Note: Select hospitalisations include overnight admissions for persons aged 15+ years, excluding maternity and newborn. These figures do not take account of case mix or complexity of patients seen and should be interpreted with caution.
1,435
2,084
2,272
0 500 1000 1500 2000 2500
Outer regional and remote
Inner regional
Major cities
Rate per 100,000 population select hospitalisations (age and sex standardised)

Effe
ctiv
enes
s
104bhi.nsw.gov.auThe Insights Series – Healthcare in rural, regional and remote NSW
Figure 4.10 Patient-reported complications, percentage of public hospital patients who experienced a complication, NSW by remoteness of hospital, 2015
Figure 4.11 Patient-reported complications, percentage of public hospital patients who experienced a complication by type, NSW by remoteness, 2015
Source: BHI, Adult Admitted Patient Survey, 2015.
13% Outer regional
& remote
14% Inner regional
16% Major cities
Outer regional and remote
1%
Pressure Inner regional 1% wound/bed sore
Major cities 1%
Outer regional and remote
4%
Infection Inner regional 5%
5% Major cities
Outer regional and remote
1%
Blood clot 1% Inner regional
2% Major cities
Outer regional and remote
2%
A fall 1% Inner regional
1% Major cities
0 5 10 15 20
% of patients
Source: BHI, Adult Admitted Patient Survey, 2015.
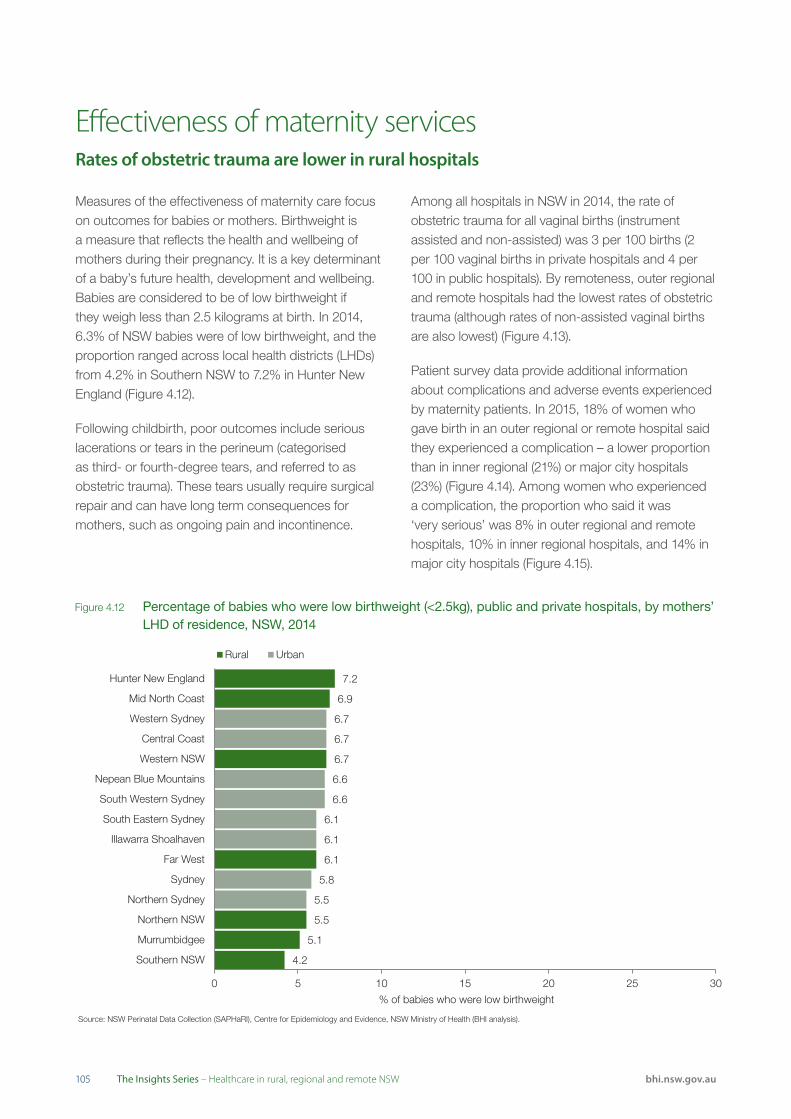
105105 bhi.nsw.gov.auThe Insights Series – Healthcare in rural, regional and remote NSW
Source: NSW Perinatal Data Collection (SAPHaRI), Centre for Epidemiology and Evidence, NSW Ministry of Health (BHI analysis).
7.2
6.9
6.7
6.1
5.5
5.1
4.2
6.7
6.7
6.6
6.6
6.1
6.1
5.8
5.5
0 5 10 15 20 25 30
Hunter New England
Mid North Coast
Western Sydney
Central Coast
Western NSW
Nepean Blue Mountains
South Western Sydney
South Eastern Sydney
Illawarra Shoalhaven
Far West
Sydney
Northern Sydney
Northern NSW
Murrumbidgee
Southern NSW
% of babies who were low birthweight
Rural Urban
Effectiveness of maternity servicesRates of obstetric trauma are lower in rural hospitals
Figure 4.12 Percentage of babies who were low birthweight (<2.5kg), public and private hospitals, by mothers’ LHD of residence, NSW, 2014
Measures of the effectiveness of maternity care focus on outcomes for babies or mothers. Birthweight is a measure that reflects the health and wellbeing of mothers during their pregnancy. It is a key determinant of a baby’s future health, development and wellbeing. Babies are considered to be of low birthweight if they weigh less than 2.5 kilograms at birth. In 2014, 6.3% of NSW babies were of low birthweight, and the proportion ranged across local health districts (LHDs) from 4.2% in Southern NSW to 7.2% in Hunter New England (Figure 4.12).
Following childbirth, poor outcomes include serious lacerations or tears in the perineum (categorised as third- or fourth-degree tears, and referred to as obstetric trauma). These tears usually require surgical repair and can have long term consequences for mothers, such as ongoing pain and incontinence.
Among all hospitals in NSW in 2014, the rate of obstetric trauma for all vaginal births (instrument assisted and non-assisted) was 3 per 100 births (2 per 100 vaginal births in private hospitals and 4 per 100 in public hospitals). By remoteness, outer regional and remote hospitals had the lowest rates of obstetric trauma (although rates of non-assisted vaginal births are also lowest) (Figure 4.13).
Patient survey data provide additional information about complications and adverse events experienced by maternity patients. In 2015, 18% of women who gave birth in an outer regional or remote hospital said they experienced a complication – a lower proportion than in inner regional (21%) or major city hospitals (23%) (Figure 4.14). Among women who experienced a complication, the proportion who said it was ‘very serious’ was 8% in outer regional and remote hospitals, 10% in inner regional hospitals, and 14% in major city hospitals (Figure 4.15).
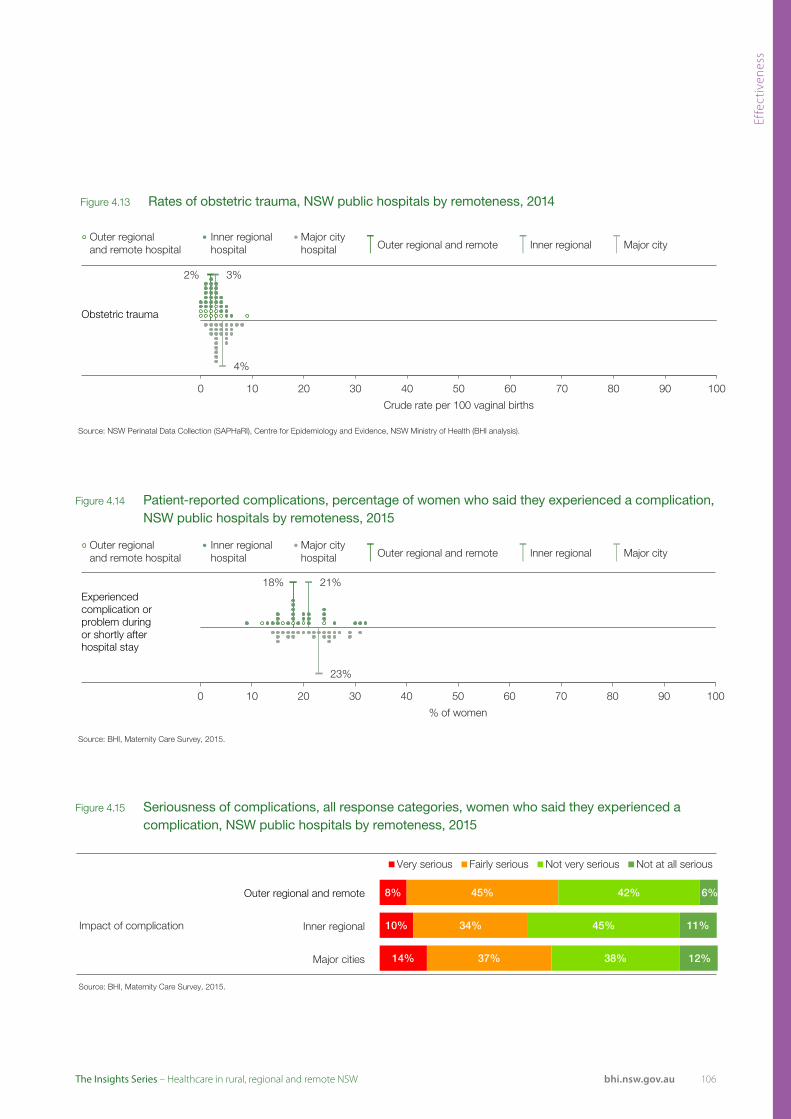
Effe
ctiv
enes
s
106bhi.nsw.gov.auThe Insights Series – Healthcare in rural, regional and remote NSW
Source: NSW Perinatal Data Collection (SAPHaRI), Centre for Epidemiology and Evidence, NSW Ministry of Health (BHI analysis).
2% 3%
4%
0 10 20 30 40 50 60 70 80 90 100
Crude rate per 100 vaginal births
Outer regionaland remote hospital
Inner regional Major cityhospital hospital Outer regional and remote Inner regional Major city
Obstetric trauma
Source: BHI, Maternity Care Survey, 2015.
18% 21%
23%
0 10 20 30 40 50 60 70 80 90 100
% of women
Outer regionaland remote hospital
Inner regional Major cityhospital hospital Outer regional and remote Inner regional Major city
Experienced complication or problem during or shortly after hospital stay
Figure 4.13 Rates of obstetric trauma, NSW public hospitals by remoteness, 2014
Figure 4.14 Patient-reported complications, percentage of women who said they experienced a complication, NSW public hospitals by remoteness, 2015
Figure 4.15 Seriousness of complications, all response categories, women who said they experienced a complication, NSW public hospitals by remoteness, 2015
Outer regional and remote
Inner regional
Major cities
Impact of complication
Source: BHI, Maternity Care Survey, 2015.
14%
10%
8%
37%
34%
45%
38%
45%
42%
12%
11%
6%
Very serious Fairly serious Not very serious Not at all serious
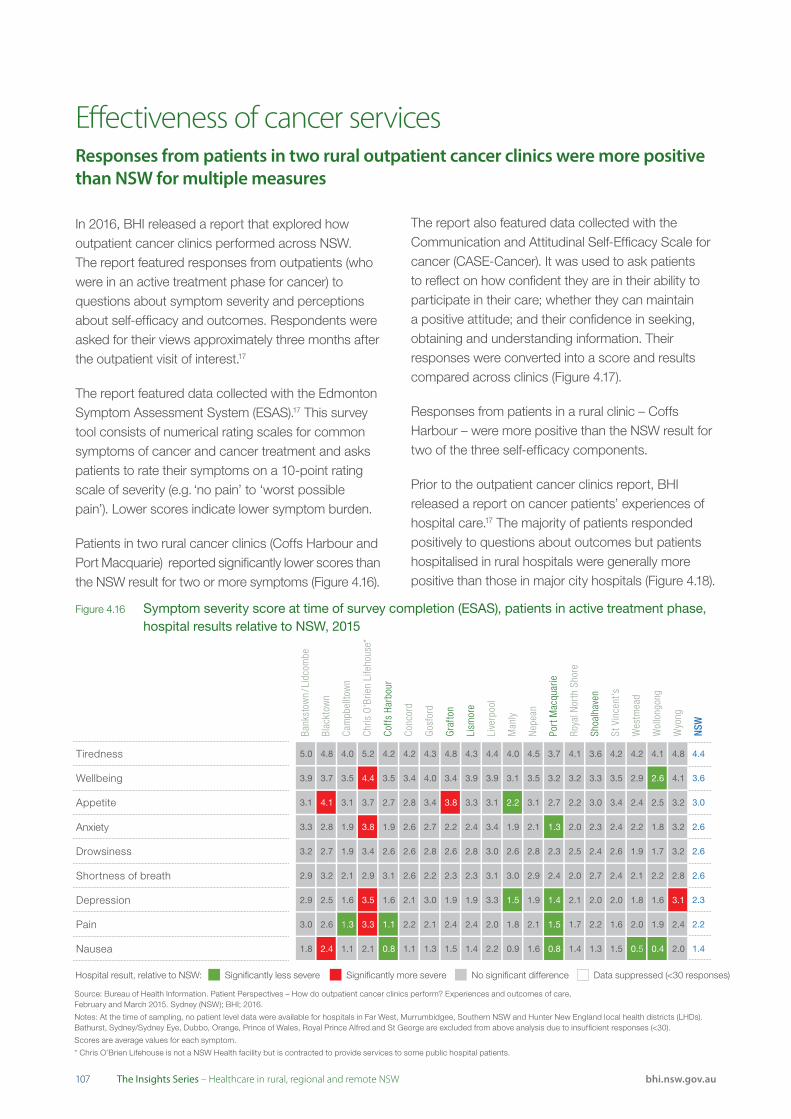
107107 bhi.nsw.gov.auThe Insights Series – Healthcare in rural, regional and remote NSW
Bank
stow
n / L
idco
mbe
Blac
ktow
n
Cam
pbel
ltow
n
Chris
O'B
rien
Life
hous
e*
Coff
s Ha
rbou
r
Conc
ord
Gos
ford
Gra
fton
Lism
ore
Live
rpoo
l
Man
ly
Nep
ean
Port
Mac
quar
ie
Roya
l Nor
th S
hore
Shoa
lhav
en
St V
ince
nt's
Wes
tmea
d
Wol
long
ong
Wyo
ng
NSW
Tiredness 5.0 4.8 4.0 5.2 4.2 4.2 4.3 4.8 4.3 4.4 4.0 4.5 3.7 4.1 3.6 4.2 4.2 4.1 4.8 4.4
Wellbeing 3.9 3.7 3.5 4.4 3.5 3.4 4.0 3.4 3.9 3.9 3.1 3.5 3.2 3.2 3.3 3.5 2.9 2.6 4.1 3.6
Appetite
Anxiety
3.1 4.1 3.1 3.7 2.7 2.8 3.4 3.8 3.3 3.1 2.2 3.1 2.7 2.2 3.0 3.4 2.4 2.5 3.2 3.0
3.3 2.8 1.9 3.8 1.9 2.6 2.7 2.2 2.4 3.4 1.9 2.1 1.3 2.0 2.3 2.4 2.2 1.8 3.2 2.6
Drowsiness 3.2 2.7 1.9 3.4 2.6 2.6 2.8 2.6 2.8 3.0 2.6 2.8 2.3 2.5 2.4 2.6 1.9 1.7 3.2 2.6
Shortness of breath 2.9 3.2 2.1 2.9 3.1 2.6 2.2 2.3 2.3 3.1 3.0 2.9 2.4 2.0 2.7 2.4 2.1 2.2 2.8 2.6
Depression 2.9 2.5 1.6 3.5 1.6 2.1 3.0 1.9 1.9 3.3 1.5 1.9 1.4 2.1 2.0 2.0 1.8 1.6 3.1 2.3
Pain 3.0 2.6 1.3 3.3 1.1 2.2 2.1 2.4 2.4 2.0 1.8 2.1 1.5 1.7 2.2 1.6 2.0 1.9 2.4 2.2
Nausea 1.8 2.4 1.1 2.1 0.8 1.1 1.3 1.5 1.4 2.2 0.9 1.6 0.8 1.4 1.3 1.5 0.5 0.4 2.0 1.4
In 2016, BHI released a report that explored how outpatient cancer clinics performed across NSW.
The report featured responses from outpatients (who were in an active treatment phase for cancer) to questions about symptom severity and perceptions about self-efficacy and outcomes. Respondents were asked for their views approximately three months after the outpatient visit of interest.17
The report featured data collected with the Edmonton Symptom Assessment System (ESAS).17 This survey tool consists of numerical rating scales for common symptoms of cancer and cancer treatment and asks patients to rate their symptoms on a 10-point rating scale of severity (e.g. ‘no pain’ to ‘worst possible pain’). Lower scores indicate lower symptom burden.
Patients in two rural cancer clinics (Coffs Harbour and Port Macquarie) reported significantly lower scores than the NSW result for two or more symptoms (Figure 4.16).
Effectiveness of cancer servicesResponses from patients in two rural outpatient cancer clinics were more positive than NSW for multiple measures
Figure 4.16 Symptom severity score at time of survey completion (ESAS), patients in active treatment phase, hospital results relative to NSW, 2015
Source: Bureau of Health Information. Patient Perspectives – How do outpatient cancer clinics perform? Experiences and outcomes of care, February and March 2015. Sydney (NSW); BHI; 2016.
Notes: At the time of sampling, no patient level data were available for hospitals in Far West, Murrumbidgee, Southern NSW and Hunter New England local health districts (LHDs). Bathurst, Sydney/Sydney Eye, Dubbo, Orange, Prince of Wales, Royal Prince Alfred and St George are excluded from above analysis due to insufficient responses (<30).
Scores are average values for each symptom.
* Chris O’Brien Lifehouse is not a NSW Health facility but is contracted to provide services to some public hospital patients.
Significantly less severe Significantly more severe No significant difference Data suppressed (<30 responses)Hospital result, relative to NSW:
The report also featured data collected with the Communication and Attitudinal Self-Efficacy Scale for cancer (CASE-Cancer). It was used to ask patients to reflect on how confident they are in their ability to participate in their care; whether they can maintain a positive attitude; and their confidence in seeking, obtaining and understanding information. Their responses were converted into a score and results compared across clinics (Figure 4.17).
Responses from patients in a rural clinic – Coffs Harbour – were more positive than the NSW result for two of the three self-efficacy components.
Prior to the outpatient cancer clinics report, BHI released a report on cancer patients’ experiences of hospital care.17 The majority of patients responded positively to questions about outcomes but patients hospitalised in rural hospitals were generally more positive than those in major city hospitals (Figure 4.18).

Effe
ctiv
enes
s
108bhi.nsw.gov.auThe Insights Series – Healthcare in rural, regional and remote NSW
Bank
stow
n / L
idco
mbe
Blac
ktow
n
Cam
pbel
ltow
n
Chris
O'B
rien
Life
hous
e*
Coff
s Ha
rbou
r
Conc
ord
Gos
ford
Gra
fton
Lism
ore
Live
rpoo
l
Man
ly
Nep
ean
Port
Mac
quar
ie
Roya
l Nor
th S
hore
Shoa
lhav
en
St V
ince
nt's
Wes
tmea
d
Wol
long
ong
Wyo
ng
NSW
Tiredness 5.0 4.8 4.0 5.2 4.2 4.2 4.3 4.8 4.3 4.4 4.0 4.5 3.7 4.1 3.6 4.2 4.2 4.1 4.8 4.4
Wellbeing 3.9 3.7 3.5 4.4 3.5 3.4 4.0 3.4 3.9 3.9 3.1 3.5 3.2 3.2 3.3 3.5 2.9 2.6 4.1 3.6
Appetite
Anxiety
3.1 4.1 3.1 3.7 2.7 2.8 3.4 3.8 3.3 3.1 2.2 3.1 2.7 2.2 3.0 3.4 2.4 2.5 3.2 3.0
3.3 2.8 1.9 3.8 1.9 2.6 2.7 2.2 2.4 3.4 1.9 2.1 1.3 2.0 2.3 2.4 2.2 1.8 3.2 2.6
Drowsiness 3.2 2.7 1.9 3.4 2.6 2.6 2.8 2.6 2.8 3.0 2.6 2.8 2.3 2.5 2.4 2.6 1.9 1.7 3.2 2.6
Shortness of breath 2.9 3.2 2.1 2.9 3.1 2.6 2.2 2.3 2.3 3.1 3.0 2.9 2.4 2.0 2.7 2.4 2.1 2.2 2.8 2.6
Depression 2.9 2.5 1.6 3.5 1.6 2.1 3.0 1.9 1.9 3.3 1.5 1.9 1.4 2.1 2.0 2.0 1.8 1.6 3.1 2.3
Pain 3.0 2.6 1.3 3.3 1.1 2.2 2.1 2.4 2.4 2.0 1.8 2.1 1.5 1.7 2.2 1.6 2.0 1.9 2.4 2.2
Nausea 1.8 2.4 1.1 2.1 0.8 1.1 1.3 1.5 1.4 2.2 0.9 1.6 0.8 1.4 1.3 1.5 0.5 0.4 2.0 1.4
Figure 4.17 Self-efficacy score at time of survey completion (CASE), patients in active treatment phase, public hospital results relative to NSW, 2015
Seeking and obtaining information 8.3 8.8 9.4 8.1 9.7 8.5 8.9 9.5 9.4 8.8 9.2 9.0 9.1 9.0 9.1 8.9 9.1 9.1 8.8 8.8
Understanding and participating in care 8.0 8.2 8.8 7.6 9.3 8.0 8.7 8.7 8.4 8.6 9.0 8.8 8.8 8.6 8.7 8.6 8.7 8.2 8.4
Maintaining a positive attitude 7.7 8.2 8.4 6.6 8.5 7.5 8.1 8.4 8.3 7.9 8.3 8.4 8.3 8.3 8.1 8.2 8.5 8.8 7.6 8.0
Bank
stow
n / L
idco
mbe
Blac
ktow
n
Cam
pbel
ltow
n
Chris
O'B
rien
Life
hous
e*
Coff
s Ha
rbou
r
Conc
ord
Gos
ford
Gra
fton
Lism
ore
Live
rpoo
l
Man
ly
Nep
ean
Port
Mac
quar
ie
Roya
l Nor
th S
hore
Shoa
lhav
en
St V
ince
nt's
Wes
tmea
d
Wol
long
ong
Wyo
ng
NSW
Source: Bureau of Health Information. Patient Perspectives – How do outpatient cancer clinics perform? Experiences and outcomes of care, February and March 2015. Sydney (NSW); BHI; 2016.
Note: At the time of sampling, no patient level data were available for hospitals in Far West, Murrumbidgee, Southern NSW and Hunter New England local health districts (LHDs). Western NSW LHD, Bathurst, Sydney/Sydney Eye, Dubbo, Orange, Prince of Wales, Royal Prince Alfred and St George hospitals are excluded due to insufficient responses (<30). Results are generated by scoring the four response options and averaging the scores by theme.
* Chris O’Brien Lifehouse is not a NSW Health facility but is contracted to provide services to some public hospital patients.
Significantly higher Significantly lower No significant difference Data suppressed (<30 responses)Hospital result, relative to NSW:
Figure 4.18 Patient-reported outcomes, percentage of cancer patients who selected the most positive response category, NSW public hospitals by remoteness, 2013–14
Source: BHI, Adult Admitted Patient Survey, 2013-14.
90% 87%
81%
0 10 20 30 40 50 60 70 80 90 100
% of patients
Outer regionaland remote hospital
Inner regional Major cityhospital hospital Outer regional and remote Inner regional Major city
Not including the reason you came to hospital,did you experienceany of the following complications or problems? (% answering 'No complication or problem')
Source: BHI, Adult Admitted Patient Survey, 2013-14.
92% 83%
83%
0 10 20 30 40 50 60 70 80 90 100
% of patients
Outer regionaland remote hospital
Inner regional Major cityhospital hospital Outer regional and remote Inner regional Major city
Did the care and treatment receivedin hospital help you? (% answering'Yes, definitely')
Source: BHI, Adult Admitted Patient Survey, 2013-14.
89% 74%
75%
0 10 20 30 40 50 60 70 80 90 100
% of patients
Outer regionaland remote hospital
Inner regional Major cityhospital hospital Outer regional and remote Inner regional Major city
Is the problem you went to hospital for…? (% answering'Much better')
Source: BHI, Adult Admitted Patient Survey, 2013-14.
68% 59%
47%
0 10 20 30 40 50 60 70 80 90 100
% of patients
Outer regionaland remote hospital
Inner regional Major cityhospital hospital Outer regional and remote Inner regional Major city
About one month after your discharge from hospital, how difficult was it for you to carry out your normal daily activities? (% answering 'Not atall difficult')

109109 bhi.nsw.gov.auThe Insights Series – Healthcare in rural, regional and remote NSW
BHI’s surveys make it possible to compare the experiences of patients in principal referral, major or district hospitals (often called peer groups A, B and C) and smaller hospitals (all other peer groups) across remoteness categories.
In terms of effectiveness measures, within most rural LHDs there was only a slight difference between small and large hospitals in the proportion of patients who said the care and treatment they received in hospital helped them; and who said they experienced a complication (Figure 4.19).
Hospital size and effectiveness measuresPatients admitted to rural hospitals were less likely to experience a complication
Figure 4.19 Patient-reported outcomes, percentage of patients who selected the most positive response category, adult admitted (larger hospitals) and small and rural public hospital surveys, LHDs, NSW, 2015
Within the small hospital survey however, there was variation in the proportion of patients who said care ‘definitely’ helped them – ranging from 63% of patients in a small outer regional and remote hospital to 93% in two hospitals, one outer regional and remote and one inner regional hospital (Figure 4.21).
The Small and Rural Facilities Survey also asked patients whether they had been readmitted or visited an emergency department (ED) in the month following their discharge (Figure 4.20).
0%
50%
100%
Far
Wes
t
Hun
ter N
ew E
ngla
nd
Mid
Nor
th C
oast
Mur
rum
bidg
ee
Nor
ther
n N
SW
Sou
ther
n N
SW
Wes
tern
NS
W
Cen
tral
Coa
st
Illaw
arra
Sho
alha
ven
Nep
ean
Blu
e M
ount
ains
Nor
ther
n S
ydne
y
Sou
th E
aste
rn S
ydne
y
Sou
th W
este
rn S
ydne
y
Syd
ney
Wes
tern
Syd
ney
Admitted Patient Survey 2015 Small and Rural Facilities Survey 2015
Did the care and treatment received in hospital help you? (% answering'Yes, definitely')
Rural LHDs Urban LHDs
Sources: BHI, Adult Admitted Patient Survey, 2015. BHI, Small and Rural Facilities Survey, 2015.
* Peer group A includes (very large) principal referral and specialist hospitals; peer group B includes (large) major hospitals and peer group C includes (medium and small)district hospitals.
0%
50%
100%
Far
Wes
t
Hun
ter N
ew E
ngla
nd
Mid
Nor
th C
oast
Mur
rum
bidg
ee
Nor
ther
n N
SW
Sou
ther
n N
SW
Wes
tern
NS
W
Cen
tral
Coa
st
Illaw
arra
Sho
alha
ven
Nep
ean
Blu
e M
ount
ains
Nor
ther
n S
ydne
y
Sou
th E
aste
rn S
ydne
y
Sou
th W
este
rn S
ydne
y
Syd
ney
Wes
tern
Syd
ney
Admitted Patient Survey 2015 Small and Rural Facilities Survey 2015
Experienced complication or problem during or shortly after hospital stay
Rural LHDs Urban LHDs

Effe
ctiv
enes
s
110bhi.nsw.gov.auThe Insights Series – Healthcare in rural, regional and remote NSW
Figure 4.20 Patient-reported outcomes, all response categories, small public hospitals in NSW by remoteness, 2015
Figure 4.21 Patient-reported outcomes, percentage of patients who selected the most positive response category, NSW small public hospitals by remoteness, 2015
Source: BHI, Small and Rural Facilities Survey, 2015.
78% 82%
0 10 20 30 40 50 60 70 80 90 100
% of patients
Outer regionaland remote hospital
Inner regionalhospital Outer regional and remote Inner regional
Did the care and treatment received in hospital help you? (% answering 'Yes, definitely')
Outer regional and remote
Inner regional
Major cities
In the month following your discharge, did you go toan emergency department because of complications that occurred duringyour recovery?
Source: BHI, Small and Rural Facilities Survey, 2015.
7%
5%
7%
93%
95%
93%
Yes No
Outer regional and remote
Inner regional
Major cities
In the month followingyour discharge, were you readmitted to any hospital because of complications that occurred duringyour recovery?
Source: BHI, Small and Rural Facilities Survey, 2015.
8%
5%
8%
92%
95%
92%
Yes No
Source: BHI, Small and Rural Facilities Survey, 2015.
12% 10%
0 10 20 30 40 50 60 70 80 90 100
% of patients
Outer regionaland remote hospital
Inner regionalhospital Outer regional and remote Inner regional
Experienced complicationor problem during or shortly after hospital stay
Full results are available on BHI’s interactive data portal, Healthcare Observer at: bhi.nsw.gov.au/healthcare_observer

111111 bhi.nsw.gov.auThe Insights Series – Healthcare in rural, regional and remote NSW
Not including the reason you came to hospital, during your stay, or soon afterwards, did you experience any of the following complications or problems?*
Did the care and treatment received in hospital help you?*
Is the problem you went to hospital for…?*
Effectiveness and AboriginalityDifferences in patient-reported outcomes by Aboriginality were seen in rural and urban hospitals
22%78%
16%84%
No complication/problem Had complication/problem
70% 25% 4%
77% 20%
Yes, definitely Yes, to some extent No, not at all
66% 18% 12%
73% 15% 10%
Much better A little better About the same A little worse Much worse
Aboriginal patients
Non-Aboriginal patients
Within the Adult Admitted Patient Survey of larger public hospitals, there were three questions that asked about outcomes of care. For all three of these self-reported outcome measures, Aboriginal patients were less positive than non-Aboriginal patients. There were differences in the percentage who said: they experienced a complication or problem (22% of Aboriginal patients and 16% of non-Aboriginal patients); care and treatment 'definitely' helped them (70% and 77%); and at the time of questionnaire completion (approximately three months after hospital discharge), the problem that prompted their hospital stay was 'much better' (66% and 73%) (Figure 4.22).
Across NSW, 22% of Aboriginal patients said they experienced a complication, compared with 16% of non-Aboriginal patients. Infections were more
often reported by Aboriginal patients (9%) than by non-Aboriginal patients (5%). Among those who reported a complication, Aboriginal patients were more likely to rate it as 'very serious' (29% and 19%) [data not shown].
Differences between Aboriginal and non-Aboriginal patient-reported outcomes were seen in rural (regional and remote) and urban (major city) hospitals (Figure 4.23).
Comparing Aboriginal patients’ responses across LHDs, the widest variation was in the question about whether patients were ‘definitely’ helped by the care they received which ranged from 52% to 91% (Figure 4.24).
Figure 4.22 Patient-reported outcomes, all response categories, Aboriginal and non-Aboriginal patients, NSW public hospitals, 2014
Aboriginal patients
Non-Aboriginal patients
Aboriginal patients
Non-Aboriginal patients
Source: Bureau of Health Information. Patient Perspectives. Hospital Care for Aboriginal People. Sydney (NSW); BHI; 2016.
* There was a significant difference in the proportion of Aboriginal and non-Aboriginal patients.
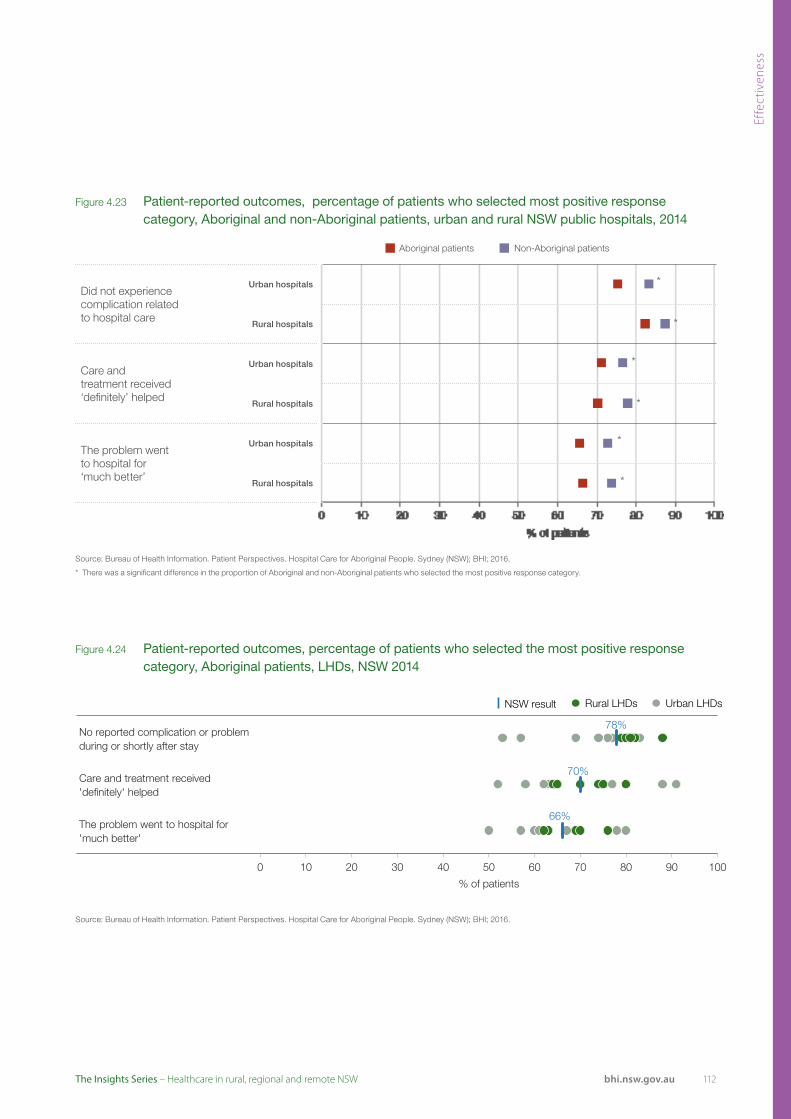
Effe
ctiv
enes
s
112bhi.nsw.gov.auThe Insights Series – Healthcare in rural, regional and remote NSW
Figure 4.24 Patient-reported outcomes, percentage of patients who selected the most positive response category, Aboriginal patients, LHDs, NSW 2014
Figure 4.23 Patient-reported outcomes, percentage of patients who selected most positive response category, Aboriginal and non-Aboriginal patients, urban and rural NSW public hospitals, 2014
Did not experience complication related to hospital care
Urban hospitals
Rural hospitals
Care and treatment received ‘definitely’ helped
Urban hospitals
Rural hospitals
The problem went to hospital for ‘much better’
Urban hospitals
Rural hospitals
*
*
*
*
*
*
Non-Aboriginal patientsAboriginal patients
Source: Bureau of Health Information. Patient Perspectives. Hospital Care for Aboriginal People. Sydney (NSW); BHI; 2016.
* There was a significant difference in the proportion of Aboriginal and non-Aboriginal patients who selected the most positive response category.
No reported complication or problem during or shortly after stay
Care and treatment received 'definitely' helped
The problem went to hospital for 'much better'
78%
70%
66%
0 10 20 30 40 50 60 70 80 90 100
% of patients
Rural LHDs Urban LHDs NSW result
Source: Bureau of Health Information. Patient Perspectives. Hospital Care for Aboriginal People. Sydney (NSW); BHI; 2016.

113 bhi.nsw.gov.auThe Insights Series – Healthcare in rural, regional and remote NSW

114bhi.nsw.gov.auThe Insights Series – Healthcare in rural, regional and remote NSW
Appendices
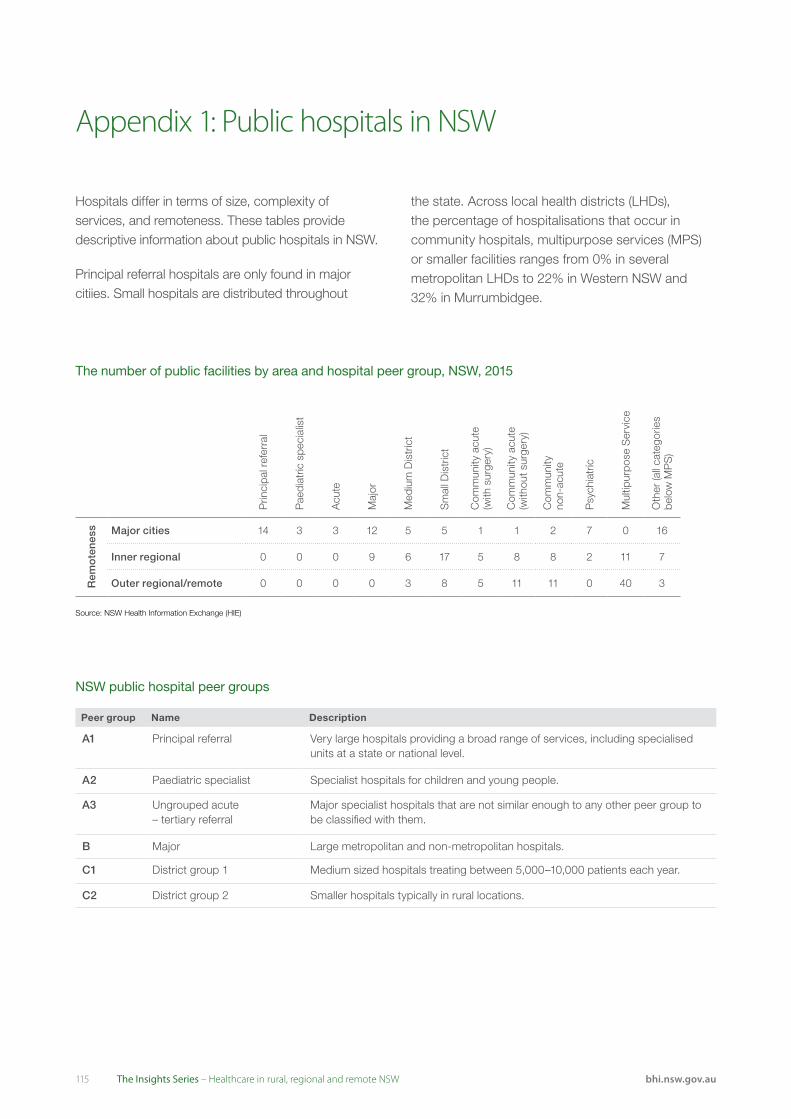
115 bhi.nsw.gov.auThe Insights Series – Healthcare in rural, regional and remote NSW
The number of public facilities by area and hospital peer group, NSW, 2015
NSW public hospital peer groups
Prin
cipa
l ref
erra
l
Pae
diat
ric s
peci
alis
t
Acu
te
Maj
or
Med
ium
Dis
tric
t
Sm
all D
istr
ict
Com
mun
ity a
cute
(w
ith s
urge
ry)
Com
mun
ity a
cute
(w
ithou
t sur
gery
)
Com
mun
ity
non-
acut
e
Psy
chia
tric
Mul
tipur
pose
Ser
vice
Oth
er (a
ll ca
tego
ries
belo
w M
PS
)
Rem
ote
nes
s Major cities 14 3 3 12 5 5 1 1 2 7 0 16
Inner regional 0 0 0 9 6 17 5 8 8 2 11 7
Outer regional/remote 0 0 0 0 3 8 5 11 11 0 40 3
Appendix 1: Public hospitals in NSW
Source: NSW Health Information Exchange (HIE)
Peer group Name Description
A1 Principal referral Very large hospitals providing a broad range of services, including specialised units at a state or national level.
A2 Paediatric specialist Specialist hospitals for children and young people.
A3 Ungrouped acute – tertiary referral
Major specialist hospitals that are not similar enough to any other peer group to be classified with them.
B Major Large metropolitan and non-metropolitan hospitals.
C1 District group 1 Medium sized hospitals treating between 5,000–10,000 patients each year.
C2 District group 2 Smaller hospitals typically in rural locations.
Hospitals differ in terms of size, complexity of services, and remoteness. These tables provide descriptive information about public hospitals in NSW.
Principal referral hospitals are only found in major citiies. Small hospitals are distributed throughout
the state. Across local health districts (LHDs), the percentage of hospitalisations that occur in community hospitals, multipurpose services (MPS) or smaller facilities ranges from 0% in several metropolitan LHDs to 22% in Western NSW and 32% in Murrumbidgee.
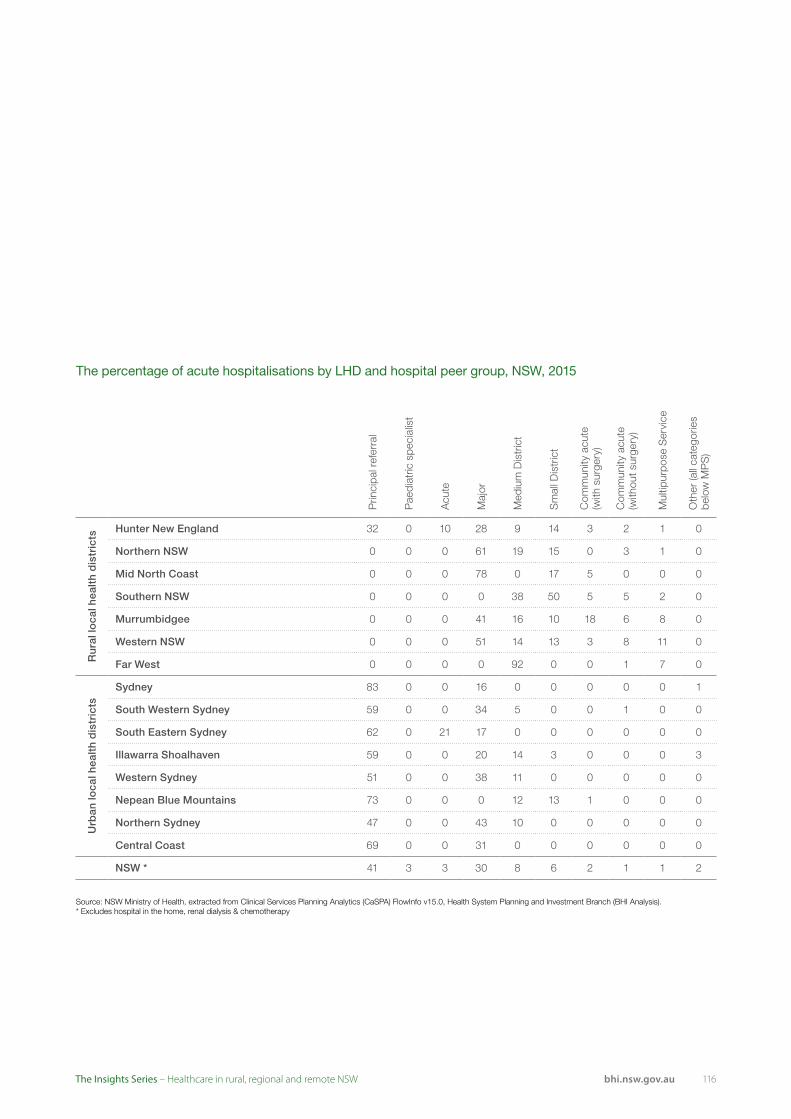
116bhi.nsw.gov.auThe Insights Series – Healthcare in rural, regional and remote NSW
The percentage of acute hospitalisations by LHD and hospital peer group, NSW, 2015
Source: NSW Ministry of Health, extracted from Clinical Services Planning Analytics (CaSPA) FlowInfo v15.0, Health System Planning and Investment Branch (BHI Analysis).* Excludes hospital in the home, renal dialysis & chemotherapy
Prin
cipa
l ref
erra
l
Pae
diat
ric s
peci
alis
t
Acu
te
Maj
or
Med
ium
Dis
tric
t
Sm
all D
istr
ict
Com
mun
ity a
cute
(w
ith s
urge
ry)
Com
mun
ity a
cute
(w
ithou
t sur
gery
)
Mul
tipur
pose
Ser
vice
Oth
er (a
ll ca
tego
ries
belo
w M
PS
)
Ru
ral l
oca
l hea
lth
dis
tric
ts
Hunter New England 32 0 10 28 9 14 3 2 1 0
Northern NSW 0 0 0 61 19 15 0 3 1 0
Mid North Coast 0 0 0 78 0 17 5 0 0 0
Southern NSW 0 0 0 0 38 50 5 5 2 0
Murrumbidgee 0 0 0 41 16 10 18 6 8 0
Western NSW 0 0 0 51 14 13 3 8 11 0
Far West 0 0 0 0 92 0 0 1 7 0
Urb
an lo
cal h
ealt
h d
istr
icts
Sydney 83 0 0 16 0 0 0 0 0 1
South Western Sydney 59 0 0 34 5 0 0 1 0 0
South Eastern Sydney 62 0 21 17 0 0 0 0 0 0
Illawarra Shoalhaven 59 0 0 20 14 3 0 0 0 3
Western Sydney 51 0 0 38 11 0 0 0 0 0
Nepean Blue Mountains 73 0 0 0 12 13 1 0 0 0
Northern Sydney 47 0 0 43 10 0 0 0 0 0
Central Coast 69 0 0 31 0 0 0 0 0 0
NSW * 41 3 3 30 8 6 2 1 1 2

117 bhi.nsw.gov.auThe Insights Series – Healthcare in rural, regional and remote NSW
Aspect of care Question NSW
Cent
ral C
oast
Hunt
er N
ew E
ngla
nd
Illaw
arra
Sho
alha
ven
Mid
Nor
th C
oast
Mur
rum
bidg
ee
Nepe
an B
lue
Mou
ntai
ns
North
ern
NSW
North
ern
Sydn
ey
Sout
h Ea
ster
n Sy
dney
Sout
h W
este
rn S
ydne
y
Sout
hern
NSW
St V
ince
nt's
Hea
lth N
etw
ork
Sydn
ey
Wes
tern
NSW
Wes
tern
Syd
ney
Would 'speak highly' of the hospital to friends and family 72 73 77 67 76 57 67 76 81 70 63 80 86 78 69 64
Overall, care in hospital was 'very good' 64 64 69 65 69 58 48 67 71 69 48 77 66 78 58 55
Time spent in the emergency department was ‘about right’ 62 64 69 48 68 45 70 73 38 50 76 71 53
Time waited to be admitted to hospital was ‘about right’ 69 67 71 48 67 58 77 74 70 79 53 56 73 70 83
Wards or rooms were 'very clean' 65 63 69 65 65 55 54 71 61 70 59 81 59 70 68 56
Toilets and bathrooms were 'very clean' 58 55 59 62 64 53 51 68 68 65 60 64 55 60 56 43
Given 'right amount' of information about condition or treatment during stay 78 76 82 71 85 66 81 83 81 83 69 79 88 87 76 67
'Completely' informed about medication side effects to watch for 55 47 61 47 73 52 50 63 59 55 46 60 62 51 37
Nurses ‘always' answered important questions in an understandable way 72 79 78 66 76 64 56 73 66 77 61 85 57 82 70 64
Doctors ‘always' answered important questions in an understandable way 66 57 68 60 69 53 51 78 66 85 59 68 53 71 71 60
Cultural or religious beliefs were ‘always’ respected 86 79 88 84 88 81 96 87 92 96 85 94 92 85 69
‘Always’ treated with respect and dignity 79 79 85 85 83 70 65 80 84 85 71 89 74 87 78 69
‘Always‘ given enough privacy when being examined or treated 80 84 86 78 86 67 62 84 74 89 76 93 74 66 82 67
‘Definitely' involved in decisions about care and treatment 58 50 64 51 58 47 37 61 71 61 56 73 61 64 60 47
‘Definitely’ involved in decisions about discharge 63 62 68 63 72 56 60 68 57 62 60 73 51 67 62 52
Given ‘completely' enough information to manage care at home 68 64 72 70 75 57 62 75 71 74 66 62 65 81 65 55
Nurses were 'always' kind and caring 80 77 83 86 80 77 58 84 87 84 74 86 72 87 76 78
Doctors were 'always' kind and caring 80 81 82 87 87 78 74 86 88 79 74 76 75 86 82 70
Staff 'completely' considered family and home situation when planning discharge 68 64 74 69 74 58 57 72 61 70 63 76 82 65 58
At discharge, ‘completely' adequate arrangements made for services needed 64 71 68 78 70 46 64 68 74 61 48 82 78 65 58
Told who to contact if worried about condition after discharge 83 86 87 86 81 74 81 84 86 89 79 93 86 92 79 73
‘Always’ got the opportunity to talk to a doctor when needed 53 45 58 41 61 45 41 60 61 69 35 59 46 59 57 40
Staff assisted within a reasonable timeframe ‘all of the time’ 45 42 50 48 50 34 29 49 60 51 34 54 20 47 46 40
Healthcare professionals 'completely' discussed worries or fears 37 39 35 26 49 27 36 32 45 38 30
‘Always’ saw nurses wash their hands or use clean gloves 66 66 69 76 70 59 57 71 71 65 57 87 41 65 64 60
'Always’ saw doctors wash their hands or use clean gloves 55 47 58 42 61 48 50 57 51 66 51 65 33 57 63 54
‘Always' had confidence and trust in nurses 78 79 84 74 82 69 64 80 84 82 70 92 61 87 75 74
‘Always' had confidence and trust in doctors 76 69 78 73 82 69 67 81 85 79 72 75 70 82 78 70
No reported complication or problem during or shortly after stay 78 74 81 82 80 79 77 82 57 76 69 88 53 83 81 74
Care and treatment received 'definitely' helped 70 65 74 74 80 64 58 75 91 77 63 70 52 88 65 62
Access and timeliness
Overall experience
Patient reported outcomes
Physical environment and comfort
Information provision
Responsive communication
Respectful practices
Engagement and participation
Comprehensive and whole-person care
Coordination and continuity
Assistance and responsiveness
Safety and hygiene
Trust and confidence
This Appendix summarises results at an LHD level for six NSW patient surveys. Each row corresponds to a survey question. Squares for which an LHD result was significantly higher than NSW are coloured green, while those with results significantly lower than NSW are coloured red.
Summarising survey results at an LHD level in this way reveals patterns of performance across aspects of care as well as across geographies.
While this report focuses on healthcare in rural NSW, metropolitan LHD results are provided for context.
Adult Admitted Patient Survey 2014: Aboriginal patients
Targeted oversampling allowed the survey to make comparisons among Aboriginal patients – assessing whether responses from hospitalised Aboriginal patients in each LHD were significantly different to those from NSW Aboriginal patients overall.
Significantly higherLHD result, relative to NSW: Significantly lower No significant difference
Appendix 2: LHD survey results at a glance

118bhi.nsw.gov.auThe Insights Series – Healthcare in rural, regional and remote NSW
Aspect of care Question NSW
Cent
ral C
oast
Far W
est
Hunt
er N
ew E
ngla
nd
Illaw
arra
Sho
alha
ven
Mid
Nor
th C
oast
Mur
rum
bidg
ee
Nepe
an B
lue
Mou
ntai
ns
North
ern
NSW
North
ern
Sydn
ey
Sout
h Ea
ster
n Sy
dney
Sout
h W
este
rn S
ydne
y
Sout
hern
NSW
St V
ince
nt's
Hea
lth N
etw
ork
Sydn
ey
Wes
tern
NSW
Wes
tern
Syd
ney
Overall, care in hospital was 'very good' 77 88 79 84 82 80 85 73
Would 'speak highly' of the hospital to friends and family 86 95 86 94 89 87 90 80
Time waited to be admitted to hospital was ‘about right’ 82 81 66 90 93 73 90
Time from arrival until taken to room/ward was 'about right' 92 95 92 87 92 90 93 94
Discharge was not delayed 93 93 94 97 95 95 93 94
Wards or rooms were ‘very clean’ 84 91 85 78 90 87 88 80
Toilets and bathrooms were ‘very clean’ 82 91 83 79 88 87 85 78
Doctors ‘always’ answered important questions in an understandable way 84 89 84 91 87 86 87 81
Given ‘right amount’ of information about condition or treatment during stay 90 94 90 95 91 89 93 87
'Completely' informed about medication side effects to watch for 58 64 62 59 58 58 62
‘Always’ given enough privacy when being examined or treated 91 96 91 87 94 91 93 89
Always’ treated with respect and dignity 92 98 93 96 94 91 94 89
'Definitely’ involved in decisions about care and treatment 71 81 75 81 73 69 78 68
'Completely’ involved in decisions about discharge 79 89 80 84 83 78 80 75
Comprehensive and whole-person care Health professionals were ‘always’ kind and caring 91 100 91 97 94 89 95 88
Health professionals worked together in 'very good' way 66 84 67 73 70 66 74 62
Told who to contact if worried about condition or treatment after discharge 90 97 92 95 91 90 90 86
Assistance and responsiveness Staff assisted within a reasonable timeframe ‘all of the time’ 59 74 62 68 63 64 62 55
‘Always’ saw nurses wash their hands or use clean gloves 68 71 67 62 71 69 72 67
'Always’ saw doctors wash their hands or use clean gloves 60 63 60 49 60 61 60 60
Trust and confidence 'Always’ had confidence and trust in health professionals 87 95 88 92 90 86 91 82
Did not experience any complication during or shortly after hospital stay 87 91 90 93 89 85 89 87
Care and treatment received ‘definitely’ helped 80 71 80 82 81 84 86 75
Overall experience
Communication and information
Respect and dignity
Patient reported outcomes
Access and timeliness
Physical environment and comfort
Engagement and participation
Safety and hygiene
Coordination and continuity
Small and Rural Hospitals Patient Survey 2015
Maternity Care Patient Survey 2015
Aspect of care Question NSW
Cent
ral C
oast
Far W
est
Hunt
er N
ew E
ngla
nd
Illaw
arra
Sho
alha
ven
Mid
Nor
th C
oast
Mur
rum
bidg
ee
Nepe
an B
lue
Mou
ntai
ns
North
ern
NSW
North
ern
Sydn
ey
Sout
h Ea
ster
n Sy
dney
Sout
h W
este
rn S
ydne
y
Sout
hern
NSW
Sydn
ey
Wes
tern
NSW
Wes
tern
Syd
ney
Overall, hospital care during labour and birth was 'very good' 74 75 77 75 75 74 76 77 80 79 63 84 74 78 69
Overall, hospital care after baby was born was 'very good' 56 63 58 51 64 60 53 67 65 61 47 74 49 63 49
Would 'speak highly' of maternity experience at the hospital to friends and family 79 88 75 77 79 80 81 83 90 83 68 87 80 79 77
Access and timeliness Length of stay in hospital was 'about right' 80 83 79 76 82 81 75 83 84 76 76 86 87 87 79
Wards or rooms used after birth of baby were 'very clean' 67 69 70 79 78 56 63 83 80 67 60 80 54 68 64
Toilets and bathrooms used after birth of baby were 'very clean' 64 55 61 77 80 54 58 83 79 59 56 82 57 64 63
'Always' treated with respect and dignity during labour and birth 88 89 88 88 89 91 91 87 90 91 82 91 87 90 88
'Always' given enough privacy in birth room or theatre 89 94 88 85 86 87 90 87 90 92 88 88 89 89 93
'Definitely' involved in decisions during labour and birth 71 69 75 70 70 67 77 71 72 70 66 76 71 77 71
'Definitely' involved in decisions about discharge from hospital 65 68 73 58 70 71 61 78 67 61 57 81 65 76 65
Comprehensive and whole-person care Midwives or doctors were 'always' kind and caring during labour and birth 85 80 87 87 85 86 87 89 88 90 77 89 83 89 87
Did not receive conflicting information from midwives or doctors during labour and birth 81 82 79 84 81 84 86 85 86 85 71 82 83 88 78
Did not receive conflicting information from health professionals after birth of baby 68 71 68 66 65 73 72 73 66 68 63 68 55 75 76
'Completely' informed about caring for myself and baby before leaving hospital 62 71 65 58 61 59 64 67 60 59 62 72 57 67 59
Told who to contact if worried about my or baby's health after discharge 93 96 95 96 93 93 96 92 95 95 87 97 91 93 88
Midwives or doctors 'definitely' did everything to help manage pain during labour and birth 76 83 79 75 81 72 81 77 78 77 66 78 81 81 76
'Always' able to get assistance from midwives or doctors when needed during labour and birth 80 86 80 80 82 80 83 81 84 84 71 83 81 82 81
Midwife or doctor 'completely' discussed worries or fears during labour and birth 60 62 56 56 56 55 69 54 65 54 55 63 67 66 67
'Always' able to get assistance or advice from health professionals when needed after birth of baby 66 70 64 63 65 69 70 68 72 68 59 80 61 72 63
Safety and hygiene 'Always' saw health professionals clean their hands 67 65 71 75 62 65 68 67 67 64 63 76 64 68 69
Trust and confidence 'Always' had confidence and trust in midwives or doctors during labour and birth 84 83 83 84 87 86 87 82 89 86 79 88 85 88 86
Complications Did not experience any complication or problem related to hospital care 78 72 75 82 80 74 70 78 76 82 80 78 78 82 77
Assistance and responsiveness
Overall experience
Physical environment and comfort
Respect and dignity
Engagement and participation
Coordination and continuity
Results for patients hospitalised in small facilities in rural LHDs are shown. Results that were significantly different to NSW results are highlighted.
Significantly higherLHD result, relative to NSW: Significantly lower No significant difference
Significantly higherLHD result, relative to NSW: Significantly lower No significant difference

119 bhi.nsw.gov.auThe Insights Series – Healthcare in rural, regional and remote NSW
Adult Admitted Patient Survey 2015
Aspect of care Question NSW
Cent
ral C
oast
Far W
est
Hunt
er N
ew E
ngla
nd
Illaw
arra
Sho
alha
ven
Mid
Nor
th C
oast
Mur
rum
bidg
ee
Nepe
an B
lue
Mou
ntai
ns
North
ern
NSW
North
ern
Sydn
ey
Sout
h Ea
ster
n Sy
dney
Sout
h W
este
rn S
ydne
y
Sout
hern
NSW
St V
ince
nt's
Hea
lth N
etw
ork
Sydn
ey
Wes
tern
NSW
Wes
tern
Syd
ney
Overall, care in hospital was 'very good' 65 66 60 70 65 74 68 63 72 69 65 57 73 68 63 72 55
Would 'speak highly' of the hospital to friends and family 78 80 73 78 74 83 77 73 82 79 79 74 83 86 82 81 72
Time from arrival until taken to room/ward was 'about right' 79 83 87 88 80 82 81 68 81 77 77 76 87 84 72 85 73
Time waiting (from first tried booking appointment with specialist) to be admitted was 'about right' 64 60 59 63 62 55 63 60 64 73 67 56 59 74 71 63 64
Discharge was not delayed 80 75 82 82 79 81 84 80 84 77 80 79 87 76 83 83 77
Wards or rooms were ‘very clean’ 68 73 61 73 71 78 63 62 77 71 62 64 74 75 64 76 56
Toilets and bathrooms were ‘very clean’ 60 61 59 66 66 72 59 51 71 63 56 53 70 69 53 70 49
Doctors ‘always’ answered important questions in an understandable way 76 72 70 77 73 79 73 74 78 80 76 73 82 82 78 79 70
Given 'right amount' of information about condition or treatment during stay 85 82 81 85 83 86 85 80 88 86 86 84 88 87 87 86 83
'Completely' informed about medication side effects to watch for 52 51 54 54 51 50 51 45 57 50 52 54 55 49 54 57 51
‘Always’ given enough privacy when being examined or treated 87 89 86 89 86 90 85 84 88 89 87 84 90 88 89 88 84
'Always’ treated with respect and dignity 87 88 84 88 86 92 87 86 89 89 87 84 91 90 87 89 81
'Definitely’ involved in decisions about care and treatment 60 59 60 63 58 64 60 56 67 61 60 58 66 62 61 65 53
'Completely’ involved in decisions about discharge 64 67 63 70 62 72 74 66 71 63 63 57 73 63 63 71 57
Doctors were 'always' kind and caring 87 86 83 86 84 90 86 85 87 89 88 87 90 88 89 89 84
Nurses were 'always' kind and caring 85 90 84 87 84 91 86 84 89 87 84 81 91 88 82 87 80
Health professionals worked together in 'very good' way 55 55 54 60 52 62 55 49 62 54 56 49 61 57 56 62 48
Told who to contact if worried about condition or treatment after discharge 86 83 87 88 86 88 87 84 89 85 86 86 89 82 88 86 84
Care was ‘very well organised’ 65 70 64 69 61 73 65 59 70 67 63 60 71 69 65 71 56
Staff assisted within a reasonable timeframe ‘all of the time’ 44 46 52 51 43 48 46 38 52 43 44 40 53 44 41 50 38
Staff 'definitely' did everything they could to help manage pain 77 76 73 80 74 82 77 72 82 79 78 73 82 78 79 79 72
‘Always’ saw nurses wash their hands or use clean gloves 59 59 61 62 61 64 61 56 62 51 59 61 62 59 62 64 54
'Always’ saw doctors wash their hands or use clean gloves 49 45 50 49 47 49 48 42 49 41 51 53 50 51 56 52 48
'Always' had confidence and trust in doctors 82 76 75 83 79 84 83 77 82 83 82 79 86 87 88 85 78
'Always' had confidence and trust in nurses 84 86 81 87 85 89 86 81 88 85 84 80 89 85 82 86 78
No reported complication or problem during or shortly after stay 85 84 84 85 83 86 86 84 84 86 84 84 86 81 86 87 85
Care and treatment received ‘definitely’ helped 78 78 69 78 75 79 75 75 78 79 80 77 80 81 80 80 76
Overall experience
Access and timeliness
Physical environment and comfort
Communication and information
Trust and confidence
Patient reported outcomes
Respect and dignity
Engagement and participation
Comprehensive and whole-person care
Coordination and continuity
Assistance and responsiveness
Safety and hygiene
Significantly higherLHD result, relative to NSW: Significantly lower No significant difference
Appendix 2: LHD survey results at a glance continued
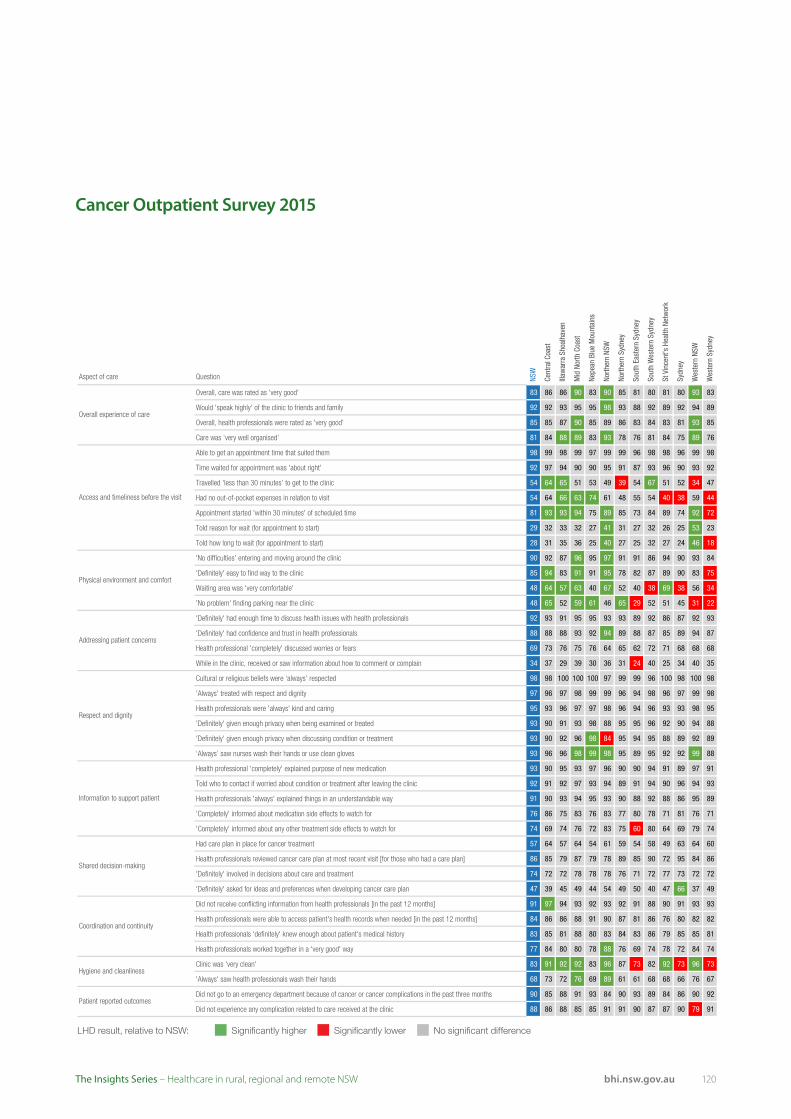
120bhi.nsw.gov.auThe Insights Series – Healthcare in rural, regional and remote NSW
Cancer Outpatient Survey 2015
Aspect of care Question NSW
Cent
ral C
oast
Illaw
arra
Sho
alha
ven
Mid
Nor
th C
oast
Nepe
an B
lue
Mou
ntai
ns
North
ern
NSW
North
ern
Sydn
ey
Sout
h Ea
ster
n Sy
dney
Sout
h W
este
rn S
ydne
y
St V
ince
nt's
Hea
lth N
etw
ork
Sydn
ey
Wes
tern
NSW
Wes
tern
Syd
ney
Overall, care was rated as 'very good' 83 86 86 90 83 90 85 81 80 81 80 93 83
Would 'speak highly' of the clinic to friends and family 92 92 93 95 95 98 93 88 92 89 92 94 89
Overall, health professionals were rated as 'very good' 85 85 87 90 85 89 86 83 84 83 81 93 85
Care was ‘very well organised’ 81 84 88 89 83 93 78 76 81 84 75 89 76
Able to get an appointment time that suited them 98 99 98 99 97 99 99 96 98 98 96 99 98
Time waited for appointment was 'about right' 92 97 94 90 90 95 91 87 93 96 90 93 92
Travelled 'less than 30 minutes' to get to the clinic 54 64 65 51 53 49 39 54 67 51 52 34 47
Had no out-of-pocket expenses in relation to visit 54 64 66 63 74 61 48 55 54 40 38 59 44
Appointment started 'within 30 minutes' of scheduled time 81 93 93 94 75 89 85 73 84 89 74 92 72
Told reason for wait (for appointment to start) 29 32 33 32 27 41 31 27 32 26 25 53 23
Told how long to wait (for appointment to start) 28 31 35 36 25 40 27 25 32 27 24 46 18
'No difficulties' entering and moving around the clinic 90 92 87 96 95 97 91 91 86 94 90 93 84
'Definitely' easy to find way to the clinic 85 94 83 91 91 95 78 82 87 89 90 83 75
Waiting area was 'very comfortable' 48 64 57 63 40 67 52 40 38 69 38 56 34
'No problem' finding parking near the clinic 48 65 52 59 61 46 65 29 52 51 45 31 22
'Definitely' had enough time to discuss health issues with health professionals 92 93 91 95 95 93 93 89 92 86 87 92 93
'Definitely' had confidence and trust in health professionals 88 88 88 93 92 94 89 88 87 85 89 94 87
Health professional 'completely' discussed worries or fears 69 73 76 75 76 64 65 62 72 71 68 68 68
While in the clinic, received or saw information about how to comment or complain 34 37 29 39 30 36 31 24 40 25 34 40 35
Cultural or religious beliefs were ‘always’ respected 98 98 100 100 100 97 99 99 96 100 98 100 98
'Always' treated with respect and dignity 97 96 97 98 99 99 96 94 98 96 97 99 98
Health professionals were 'always' kind and caring 95 93 96 97 97 98 96 94 96 93 93 98 95
'Definitely' given enough privacy when being examined or treated 93 90 91 93 98 88 95 95 96 92 90 94 88
'Definitely' given enough privacy when discussing condition or treatment 93 90 92 96 98 84 95 94 95 88 89 92 89
‘Always’ saw nurses wash their hands or use clean gloves 93 96 96 98 99 98 95 89 95 92 92 99 88
Health professional 'completely' explained purpose of new medication 93 90 95 93 97 96 90 90 94 91 89 97 91
Told who to contact if worried about condition or treatment after leaving the clinic 92 91 92 97 93 94 89 91 94 90 96 94 93
Health professionals 'always' explained things in an understandable way 91 90 93 94 95 93 90 88 92 88 86 95 89
'Completely' informed about medication side effects to watch for 76 86 75 83 76 83 77 80 78 71 81 76 71
'Completely' informed about any other treatment side effects to watch for 74 69 74 76 72 83 75 60 80 64 69 79 74
Had care plan in place for cancer treatment 57 64 57 64 54 61 59 54 58 49 63 64 60
Health professionals reviewed cancer care plan at most recent visit [for those who had a care plan] 86 85 79 87 79 78 89 85 90 72 95 84 86
'Definitely' involved in decisions about care and treatment 74 72 72 78 78 78 76 71 72 77 73 72 72
'Definitely' asked for ideas and preferences when developing cancer care plan 47 39 45 49 44 54 49 50 40 47 66 37 49
Did not receive conflicting information from health professionals [in the past 12 months] 91 97 94 93 92 93 92 91 88 90 91 93 93
Health professionals were able to access patient's health records when needed [in the past 12 months] 84 86 86 88 91 90 87 81 86 76 80 82 82
Health professionals 'definitely' knew enough about patient's medical history 83 85 81 88 80 83 84 83 86 79 85 85 81
Health professionals worked together in a 'very good' way 77 84 80 80 78 88 76 69 74 78 72 84 74
Clinic was 'very clean' 83 91 92 92 83 96 87 73 82 92 73 96 73
'Always' saw health professionals wash their hands 68 73 72 76 69 89 61 61 68 68 66 76 67
Did not go to an emergency department because of cancer or cancer complications in the past three months 90 85 88 91 93 84 90 93 89 84 86 90 92
Did not experience any complication related to care received at the clinic 88 86 88 85 85 91 91 90 87 87 90 79 91
Shared decision-making
Coordination and continuity
Hygiene and cleanliness
Patient reported outcomes
Overall experience of care
Access and timeliness before the visit
Physical environment and comfort
Addressing patient concerns
Respect and dignity
Information to support patient
Significantly higherLHD result, relative to NSW: Significantly lower No significant difference
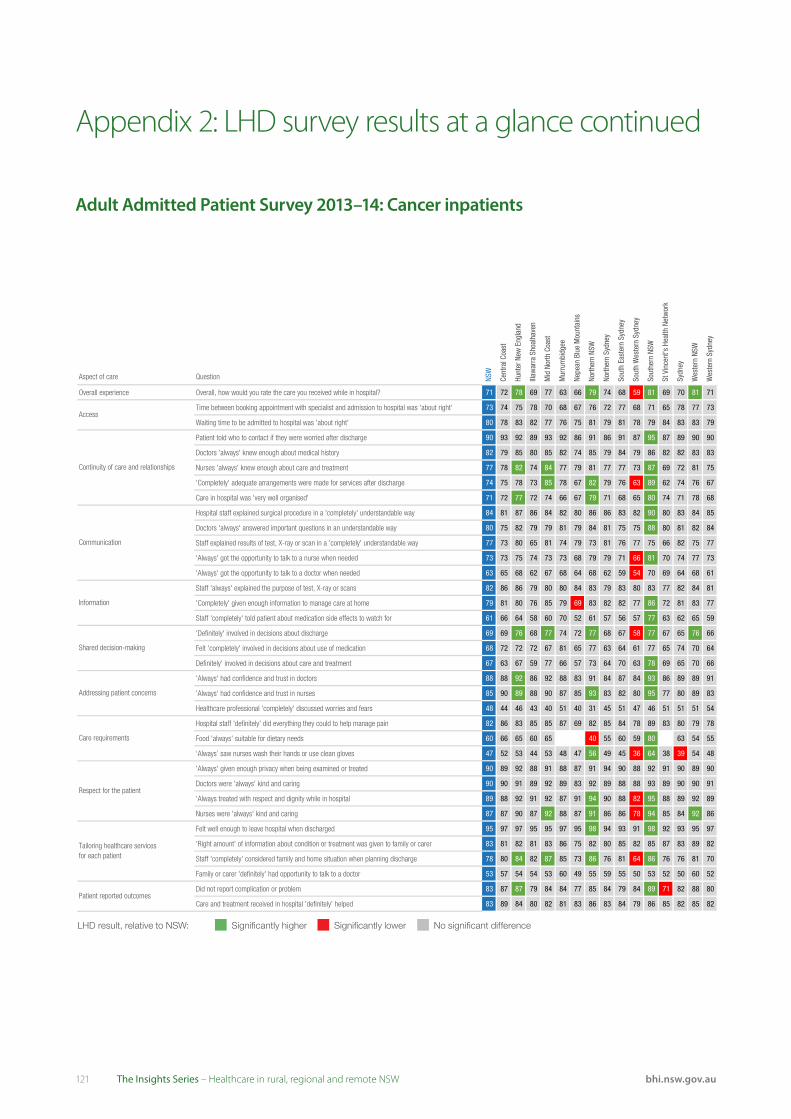
121 bhi.nsw.gov.auThe Insights Series – Healthcare in rural, regional and remote NSW
Adult Admitted Patient Survey 2013–14: Cancer inpatients
Aspect of care Question NSW
Cent
ral C
oast
Hunt
er N
ew E
ngla
nd
Illaw
arra
Sho
alha
ven
Mid
Nor
th C
oast
Mur
rum
bidg
ee
Nepe
an B
lue
Mou
ntai
ns
North
ern
NSW
North
ern
Sydn
ey
Sout
h Ea
ster
n Sy
dney
Sout
h W
este
rn S
ydne
y
Sout
hern
NSW
St V
ince
nt's
Hea
lth N
etw
ork
Sydn
ey
Wes
tern
NSW
Wes
tern
Syd
ney
Overall experience Overall, how would you rate the care you received while in hospital? 71 72 78 69 77 63 66 79 74 68 59 81 69 70 81 71
Time between booking appointment with specialist and admission to hospital was 'about right' 73 74 75 78 70 68 67 76 72 77 68 71 65 78 77 73
Waiting time to be admitted to hospital was 'about right' 80 78 83 82 77 76 75 81 79 81 78 79 84 83 83 79
Patient told who to contact if they were worried after discharge 90 93 92 89 93 92 86 91 86 91 87 95 87 89 90 90
Doctors 'always' knew enough about medical history 82 79 85 80 85 82 74 85 79 84 79 86 82 82 83 83
Nurses 'always' knew enough about care and treatment 77 78 82 74 84 77 79 81 77 77 73 87 69 72 81 75
'Completely' adequate arrangements were made for services after discharge 74 75 78 73 85 78 67 82 79 76 63 89 62 74 76 67
Care in hospital was 'very well organised' 71 72 77 72 74 66 67 79 71 68 65 80 74 71 78 68
Hospital staff explained surgical procedure in a 'completely' understandable way 84 81 87 86 84 82 80 86 86 83 82 90 80 83 84 85
Doctors 'always' answered important questions in an understandable way 80 75 82 79 79 81 79 84 81 75 75 88 80 81 82 84
Staff explained results of test, X-ray or scan in a 'completely' understandable way 77 73 80 65 81 74 79 73 81 76 77 75 66 82 75 77
'Always' got the opportunity to talk to a nurse when needed 73 73 75 74 73 73 68 79 79 71 66 81 70 74 77 73
'Always' got the opportunity to talk to a doctor when needed 63 65 68 62 67 68 64 68 62 59 54 70 69 64 68 61
Staff 'always' explained the purpose of test, X-ray or scans 82 86 86 79 80 80 84 83 79 83 80 83 77 82 84 81
'Completely' given enough information to manage care at home 79 81 80 76 85 79 69 83 82 82 77 86 72 81 83 77
Staff 'completely' told patient about medication side effects to watch for 61 66 64 58 60 70 52 61 57 56 57 77 63 62 65 59
'Definitely' involved in decisions about discharge 69 69 76 68 77 74 72 77 68 67 58 77 67 65 76 66
Felt 'completely' involved in decisions about use of medication 68 72 72 72 67 81 65 77 63 64 61 77 65 74 70 64
Definitely' involved in decisions about care and treatment 67 63 67 59 77 66 57 73 64 70 63 78 69 65 70 66
'Always' had confidence and trust in doctors 88 88 92 86 92 88 83 91 84 87 84 93 86 89 89 91
'Always' had confidence and trust in nurses 85 90 89 88 90 87 85 93 83 82 80 95 77 80 89 83
Healthcare professional 'completely' discussed worries and fears 48 44 46 43 40 51 40 31 45 51 47 46 51 51 51 54
Hospital staff 'definitely' did everything they could to help manage pain 82 86 83 85 85 87 69 82 85 84 78 89 83 80 79 78
Food 'always' suitable for dietary needs 60 66 65 60 65 40 55 60 59 80 63 54 55
‘Always’ saw nurses wash their hands or use clean gloves 47 52 53 44 53 48 47 56 49 45 36 64 38 39 54 48
'Always' given enough privacy when being examined or treated 90 89 92 88 91 88 87 91 94 90 88 92 91 90 89 90
Doctors were 'always' kind and caring 90 90 91 89 92 89 83 92 89 88 88 93 89 90 90 91
'Always treated with respect and dignity while in hospital 89 88 92 91 92 87 91 94 90 88 82 95 88 89 92 89
Nurses were 'always' kind and caring 87 87 90 87 92 88 87 91 86 86 78 94 85 84 92 86
Felt well enough to leave hospital when discharged 95 97 97 95 95 97 95 98 94 93 91 98 92 93 95 97
'Right amount' of information about condition or treatment was given to family or carer 83 81 82 81 83 86 75 82 80 85 82 85 87 83 89 82
Staff 'completely' considered family and home situation when planning discharge 78 80 84 82 87 85 73 86 76 81 64 86 76 76 81 70
Family or carer 'definitely' had opportunity to talk to a doctor 53 57 54 54 53 60 49 55 59 55 50 53 52 50 60 52
Did not report complication or problem 83 87 87 79 84 84 77 85 84 79 84 89 71 82 88 80
Care and treatment received in hospital 'definitely' helped 83 89 84 80 82 81 83 86 83 84 79 86 85 82 85 82Patient reported outcomes
Access
Continuity of care and relationships
Communication
Information
Shared decision-making
Addressing patient concerns
Care requirements
Respect for the patient
Tailoring healthcare servicesfor each patient
Significantly higherLHD result, relative to NSW: Significantly lower No significant difference
Appendix 2: LHD survey results at a glance continued
122bhi.nsw.gov.auThe Insights Series – Healthcare in rural, regional and remote NSW
References
Setting the scene
1. Centre for Epidemiology and Evidence. Health Statistics NSW. [online] [cited 4 November 2016]. Available from: http://www.healthstats.nsw.gov.au.
2. Australian Bureau of Statistics. General Social Survey: Summary Results, Australia, 2014. ABS cat. no 4159.0 Canberra: ABS, 2015.
3. Commonwealth of Australia. National strategic framework for rural and remote health. Canberra, 2012.
4. Australian Institute of Health and Welfare. Health expenditure Australia 2013–14. Health and welfare expenditure series no. 54. Cat. no. HWE 63. Canberra: AIHW, 2015.
5. NSW Ministry of Health. Role Delineation Levels of Emergency Medicine. Sydney: NSW Ministry of Health, January 2014.
6. Administrator, National Health Funding Pool. National Health Reform public hospital funding New South Wales report. Canberra, April 2016.
7. Schoo A, Lawn S, Carson D. Towards equity and sustainability of rural and remote health services access: supporting social capital and integrated organisational and professional development. BMC Health Services Research 2016;16.
8. Keegan AD. Hospital bed occupancy: more than queuing for a bed. MJA 2010;193:291–293.
9. Bureau of Health Information. Healthcare in Focus 2013: – How well does NSW measure up? Sydney (NSW); BHI; 2014.
10. NSW Ministry of Health. NSW Rural Health Plan: Towards 2021. Sydney: NSW Ministry of Health, 2014.
11. NSW Ministry of Health. NSW Health Professionals Workforce Plan: 2012-2022. Sydney: NSW Ministry of Health, 2015.
12. Bureau of Health Information. Healthcare in Focus 2015 – How does NSW Compare? Sydney (NSW); BHI; 2016.
13. Bureau of Health Information. Healthcare in Focus 2013: Spotlight on Measurement. Sydney (NSW); BHI; 2014.
Accessibility
1. Levesque JF, Harris M, Russell D. Patient-centred access to health care: conceptualising access at the interface of health systems and populations. International Journal for Equity in Health 2013;12:18
2. Bishop LM, Laverty MJ. Filling the gap: Disparities in oral health access and outcomes between metropolitan and remote and rural Australia. Canberra: Royal Flying Doctor Service of Australia, 2016.
3. Australian Institute of Health and Welfare. Chrisopoulos S, Harford JE, Ellershaw A. Oral health and dental care in Australia: key facts and figures 2015. Cat. no. DEN 229. Canberra: AIHW, 2016.
4. Commonwealth of Australia. National strategic framework for rural and remote health. Canberra, 2012.
5. Meadows GN, Enticott JC, Inder B, Russell GM, Gurr R. Better access to mental health care and the failure of the Medicare principle of universality. Med J Aust 2015;Apr 6;202(6):297.
6. Saurman E, Lyle D, Perkins D, Roberts R. Successful provision of emergency mental health care to rural and remote NSW - an evaluation of the Mental Health Emergency Care-Rural Access Program, Australian Health Review, 2013;38(1):58-64.
7. Lopez D, Katzenellenbogen JM, Sanfilippo FM et al. Transfers to metropolitan hospitals and coronary angiography for rural Aboriginal and non-Aboriginal patients with acute ischaemic heart disease in Western Australia. BMC Cardiovascular Disorders 2014;14:58
8. Australian Institute of Health and Welfare. Admitted patient care 2014–15: Australian hospital statistics. Health services series no. 68. Cat. no. HSE 172. Canberra: AIHW, 2016.
9. 9. Bureau of Health Information. Healthcare in Focus 2015 – How does NSW Compare? Sydney (NSW); BHI; 2016.
10. Fung CS, Wong CK, Fong DY, Lee A, Lam CL. Having a family doctor was associated with lower utilization of hospital-based health services. BMC Health Serv Res 2015;Jan 28;15:42
123 bhi.nsw.gov.auThe Insights Series – Healthcare in rural, regional and remote NSW
11. McDonald J, Lane R, Kearns R, Ward B, Powell DG, Fuller J et al. Emerging models of integrated primary health care centres: How they optimise access and integration and what influences this. Brief for the Australian Primary Health Care Research Institute 2015.
12. Bureau of Health Information. Hospital Quarterly – Activity and performance in NSW public hospitals, April to June 2016. Sydney (NSW); BHI; 2016.
13. NSW Health, Kids and Families. Maternity - Towards Normal Birth in NSW. Sydney: NSW Ministry of Health, 2010.
14. Fox P, Boyce A. Cancer health inequality persists in regional and remote Australia. Medical Journal of Australia 2014;8:445-446.
15. Cancer Institute NSW. NSW Cancer Plan. Sydney: Cancer Institute NSW, 2016.
16. NSW Ministry of Health. NSW Rural Health Plan: Towards 2021. Sydney: NSW Ministry of Health, 2014.
17. NSW Department of Health, NSW Health Radiotherapy Services in NSW, Strategic Plan to 2016. Sydney: NSW Department of Health, 2010.
18. Centre for Epidemiology and Evidence. The health of Aboriginal people of NSW: Report of the Chief Health Officer, 2012. Sydney: NSW Ministry of Health, 2012.
19. Wilson LS, Maeder AJ. Recent Directions in Telemedicine: Review of Trends in Research and Practice. Healthcare Informatics Research 2015;21(4):213-222.
20. NSW Ministry of Health. NSW Health Telehealth Framework and Implementation Strategy: 2016–2021. Sydney: NSW Ministry of Health, 2016.
21. NSW Ministry of Health. NSW State Health Plan: Towards 2021. Sydney: NSW Ministry of Health, 2014.
22. HealthShare NSW. A Blueprint for eHealth in NSW. Sydney: NSW Ministry of Health, 2013.
23. NSW Ministry of Health. NSW Health Integrated Care Strategy: 2014-2017. Sydney: NSW Ministry of Health, 2014.
24. Nous Group. Strategic review of telehealth in NSW: Final report. Sydney: NSW Ministry of Health, 2015.
Appropriateness
1. Paul CL, Piterman L, Shaw JE, Kirby C, Barker D, Robinson J et al. Patterns of type 2 diabetes monitoring in rural towns: How does frequency of HbA1c and lipid testing compare with existing guidelines? Australian Journal of Rural Health 2016 April;24(2).
2. Tracey E, McCaughan B, Badgery-Parker et al. Patients with localized non-small cell lung cancer miss out on curative surgery with distance from specialist care. Aust N Z J Surg 2014; 85: 658-663.
3. Barrett E, Salem L, Wilson S, O’Neill C, Davis K, Bagnulo S. Chronic kidney disease in an Aboriginal population: A nurse practitioner-led approach to management. Aust J Rural Health 2015 Dec;23(6):318-21.
4. Kirby S, Moore M, McGarron T, Johnstone P, Perkins D, Lyle D. People living in remote communities can have best-practice diabetes care. Rural and Remote Health 2015;15(3):3203.
5. Sav AS, King MA, Kelly F, McMillan SS Kendall E et al. Self-management of chronic conditions in a rural and remote context. Australian Journal of Primary Health 2015;21(1):90-95.
6. Valery PC, Whop LJ, Morseu-Diop N, Garvey G, Masters IB, Chang AB. Carers’ perspectives on an effective Indigenous health model for childhood asthma in the Torres Strait. Australian Journal of Rural Health 2016 June;24(3): 170–175.
7. Hinde YR, Pennington R, Nott ML. Time to surgery for hip fracture patients in a ruralorthopaedic referral hospital. Aust J Rural Health 2015 April;
8. Koifman J, Hall R, Li S, Stamplecoski M, Fang J, Saltman AP, Kapral MK.The association between rural residence and stroke care and outcomes. J Neurol Sci 2016 April;15(363):16-20.
9. Allenby A, Kinsman L, Tham R, Symons J, Jones M, Campbell S.The quality of cardiovascular disease prevention in rural primary care Australian Journal of Rural Health 2016 April;24(2):92-98.
10. Swain L, Barclay L. Medication reviews are useful, but the model needs to be changed: Perspectives of Aboriginal Health Service health professionals on Home Medicines Reviews. BMC Health Services Research 2015;15:366.
References continued

124bhi.nsw.gov.auThe Insights Series – Healthcare in rural, regional and remote NSW
11. Jensen H, Logiudice D, Smith K, Lindeman MA, Flicker L, Atkinson D. Pathways to care for Indigenous people with dementia in Central Australia. Services for Australian Rural and Remote Allied Health (SARRAH), Launceston, 20–23 Sept 2012.
12. Centre for Epidemiology and Evidence. Health Statistics NSW. [online] [cited 4 November 2016]. Available from: http://www.healthstats.nsw.gov.au.
13. Bureau of Health Information. Healthcare in Focus 2015 – How does NSW Compare? Sydney (NSW); BHI; 2016.
14. Australian Institute of Health and Welfare. National Bowel Cancer Screening Program: monitoring report 2016. Cancer series no. 98. Cat. no. CAN 97. Canberra: AIHW, 2016.
15. Australian Institute of Health and Welfare. BreastScreen Australia monitoring report 2013– 2014. Cancer series no. 100. Cat. no. CAN 99. Canberra: AIHW, 2016.
16. Australian Institute of Health and Welfare. Cervical screening in Australia 2013–2014. Cancer series no. 97. Cat. no. CAN 95. Canberra: AIHW, 2016.
17. Agency for Clinical Innovation. Minimum Standards for the Management of Hip Fracture in the Older Person. Chatswood: ACI, 2014.
18. Mak JCS, Cameron ID, March LM. Evidence based guidelines for the management of hip fractures in older persons: an update. Med J Aust 2010;192(1):37-41.
19. Osborn R, Squires D. International perspectives on patient engagement: results from the 2011 Commonwealth Fund Survey. J Ambul Care Manage. 2012 April–June;35(2):118–28.
20. McDonald KM, Sundaram V, Bravata DM, Lewis R, Lin N, Kraft S et al. Closing the Quality Gap: A Critical Analysis of Quality Improvement Strategies. AHRQ Publication No. 04(07)-0051-7. Rockville, MD: Agency for Healthcare Research and Quality, June 2007.
21. NSW Health, Kids and Families. Having a baby. Sydney: NSW Ministry of Health, 2012.
22. World Health Organization. Standards for maternal and neonatal care. [online] [cited 4 November 2016]. Available from http://www.who.int/reproductivehealth/publications/maternal_perinatal_health/a91272/en/
23. Australian Institute of Health and Welfare. Australia’s mothers and babies 2013—in brief. Perinatal statistics series no. 31. Cat. no. PER 72.Canberra: AIHW, 2015.
24. D’Alton M, Hehir M. Cesarean Delivery Rates: Revisiting a 3-Decades-Old Dogma. JAMA 2015;314(21):2238-2240.
25. Molina G, Weiser T, Lipsitz S, Esquivel M, Uribe-Leitz T, Azad T et al. Relationship Between Cesarean Delivery Rate and Maternal and Neonatal Mortality. JAMA 2015;314(21):2263-2270.
26. Bureau of Health Information. Patient Perspectives – Hospital care for people with cancer. Sydney (NSW); BHI; 2015.
27. Bureau of Health Information. Patient Perspectives – How do outpatient cancer clinics perform? Experiences and outcomes of care, February and March 2015. Sydney (NSW); BHI; 2016.
28. Bureau of Health Information. Healthcare Observer. Patient survey data. [online] [cited 4 November 2016]. Available from http://www.bhi.nsw.gov.au/healthcare_observer/_nocache.

125 bhi.nsw.gov.auThe Insights Series – Healthcare in rural, regional and remote NSW
Effectiveness
1. Chondur R, Li SQ, Guthridge S, Lawton P Does relative remoteness affect chronic disease outcomes? Geographic variation in chronic disease mortality in Australia, 2002–2006. Australian and New Zealand Journal of Public Health, 2014 April; 38(2): 117-21.
2. Centre for Epidemiology and Evidence. Health Statistics NSW. [online] [cited 4 November 2016]. Available from: http://www.healthstats.nsw.gov.au.
3. Reilly R, Evans K, Gomersall J, Gorham G, Peters MD, Warren S. Effectiveness, cost effectiveness, acceptability and implementation barriers/enablers of chronic kidney disease management programs for Indigenous people in Australia, New Zealand and Canada: a systematic review of mixed evidence. BMC Health Serv Res 2016 April;16(1):119.
4. Berry N, Lobban F, Emsley R, Bucci S. Acceptability of Interventions Delivered Online and Through Mobile Phones for People Who Experience Severe Mental Health Problems: A Systematic Review. J Med Internet Res 2016;18(5):e121.
5. 5. Sinclair C, Holloway K, Riley G, Auret K. Online Mental Health Resources in Rural Australia: Clinician Perceptions of Acceptability. J Med Internet Res 2013;15(9):e193
6. Reeve C, Banfield S, Thomas A, Reeve D, Davis S. Community outreach midwifery-led model improves antenatal access in a disadvantaged population. Aust J Rural Health 2016 June;24(3):200-6.
7. Chan BA, Larkins SL, Evans R, Watt K, Sabesan S. Do teleoncology models of care enable safe delivery of chemotherapy in rural towns? Med J Aust 2015 Nov;203(10):406-6.e6.
8. Sabesan S, Roberts LJ, Aiken P, Joshi A, Larkins S. Timely access to specialist medical oncology services closer to home for rural patients: experience from the Townsville Teleoncology Model. Aust J Rural Health 2014 Aug;22(4):156-9.
9. Nehme Z, Andrew E, Cameron PA, Bray JE, Bernard SA, Meredith IT et al. Population density predicts outcome from out-of hospital cardiac arrest in Victoria. Australia. Med J Aust 2014;200 (8):471-475.
10. Beckmann KR, Bennett A, Young GP, Cole SR, Joshi R, Adams J et al. Sociodemographic disparities in survival from colorectal cancer in South Australia: A population-wide data linkage study. BMC Health Services Research 2016;16:24.
11. Kirby SE, Dennis SM, Jayasinghe UW, Harris MF. Unplanned return visits to emergency in a regional hospital. Australian Health Review 2012;36(3):336–341.
12. Lesjak M, Boreland F, Lyle D, Sidford J, Fletcher J, Flecknoe-Brown S. Screening for Abdominal Aortic Aneurysm: does it affect men’s quality of life? Australian Journal of Primary Health 2012; 18(4):284–288.
13. Tideman PA, Tirimacco R, Senior DP, Setchell JJ, Huynh LT, Tavella R et al. Impact of a regionalised clinical cardiac support network on mortality among rural patients with myocardial infarction. Medical Journal of Australia 2014;200(3):157–160.
14. Osborn R, Squires D. International perspectives on patient engagement: results from the 2011 Commonwealth Fund Survey. J Ambul Care Manage 2012 April–June;35(2):118–28.
15. Bureau of Health Information. The Insights Series: Return to acute care following hospitalisation, Insights into readmissions, NSW public hospitals, July 2009 – June 2012 Sydney (NSW); BHI; 2015.
16. Bureau of Health Information. The Insights Series: 30-day mortality following hospitalisation, five clinical conditions, NSW, July 2009 – June 2012. Sydney (NSW); BHI; 2013.
17. Bureau of Health Information. Patient Perspectives – How do outpatient cancer clinics perform? Experiences and outcomes of care, February and March 2015. Sydney (NSW); BHI; 2016.
References continued
126bhi.nsw.gov.auThe Insights Series – Healthcare in rural, regional and remote NSW
Acknowledgements
The Bureau of Health Information (BHI) is the main source of information for the people of NSW about the performance of their public healthcare system. A NSW board-governed organisation, BHI is led by Acting Chairperson Mary Elizabeth Rummery AM and Chief Executive Jean-Frédéric Lévesque MD, PhD.
We would like to thank colleagues from the NSW Ministry of Health and pillar organisations, our expert advisors, reviewers and staff who contributed to the report.
External Advisors and Reviewers
Brad Astill NSW Ministry of Health
Kim Browne BHI Rural Advisory Committee Convener
Margaret Crowley Health Education and Training Institute
Michael Dirienzo Hunter New England LHD
Lyn Fragar University of Sydney
Patrick Frances Consumer Representative
David Hutton Northern NSW LHD
Jill Ludford Murrumbidgee LHD
Ms Jenny Preece Agency for Clinical Innovation
Brian Shimadry NSW Ministry of Health
Christina Summerhayes NSW Ministry of Health
Bureau of Health Information Project Team
Research
Lilian Daly
Ariana Dobrovic
Kim Sutherland
Major Analytics
Huei-Yang (Tom) Chen
Anna Do
Roger Jiang
Support Analytics
Lisa Corscadden
Carolynn Fredericks
Diane Hindmarsh
Jill Kaldor
Behnoosh Khalaj
Sadaf Marashi-Pour
Design
Ed Bury
Adam Myatt
Efren Sampaga
Mark Williams
Communications and Stakeholder Engagement
Rohan Lindeman
Karen Perini
Stephanie Watson
127 bhi.nsw.gov.auThe Insights Series – Healthcare in rural, regional and remote NSW
The Bureau of Health Information (BHI) is a board-governed organisation that provides independent information about the performance of the NSW public healthcare system.
BHI was established in 2009 to provide system-wide support through transparent reporting.
BHI supports the accountability of the healthcare system by providing regular and detailed information to the community, government and healthcare professionals. This in turn supports quality improvement by highlighting how well the healthcare system is functioning and where there are opportunities to improve.
BHI manages the NSW Patient Survey Program, gathering information from patients about their experiences in public hospitals and other healthcare facilities.
About the Bureau of Health Information
BHI publishes a range of reports and tools that provide relevant, accurate and impartial information about how the health system is measuring up in terms of:
• Accessibility – healthcare when and where needed
• Appropriateness – the right healthcare, the right way
• Effectiveness – making a difference for patients
• Efficiency – value for money
• Equity – health for all, healthcare that’s fair
• Sustainability – caring for the future.
BHI’s work relies on the efforts of a wide range of healthcare, data and policy experts. All of our assessment efforts leverage the work of hospital coders, analysts, technicians and healthcare providers who gather, codify and report data. Our public reporting of performance information is enabled and enhanced by the infrastructure, expertise and stewardship provided by colleagues from NSW Health and its pillar organisations.
bhi.nsw.gov.au