healthcare operations management © 2008 health administration press. all rights reserved. 1
TRANSCRIPT

Healthcare Operations Management© 2008 Health Administration Press. All rights reserved.
1

Chapter 12
Scheduling

Healthcare Operations Management© 2008 Health Administration Press. All rights reserved.
3
Scheduling and Capacity Management
• Staff Scheduling• Job/Operation Scheduling and Sequencing
Rules• Appointment Scheduling Schemes• Advanced Access Scheduling
– Operating and Market Advantage– Implementing Advanced Access– Metrics for Advanced Access
• Using Arena® to Model Scheduling

Healthcare Operations Management© 2008 Health Administration Press. All rights reserved.
4
Staff Scheduling
• Optimization/mathematical programming (Chapter 6)
• Simulation (Chapter 11)

Healthcare Operations Management© 2008 Health Administration Press. All rights reserved.
5
Riverview Clinic Urgent Care Staffing Using Linear
Programming (LP)Objective: Minimize salary and benefit expenses while satisfying nurses• Five consecutive days, with two days off every seven days• Schedules chosen by seniority
Sun Mon Tues Wed Thurs Fri Sat
Nurses Needed/Day 5 4 3 3 3 4 6Salary and Benefits/Nurse-Day ($/day)
320 240 240 240 240 240 320
Healthcare Operations Management© 2008 Health Administration Press. All rights reserved.
6
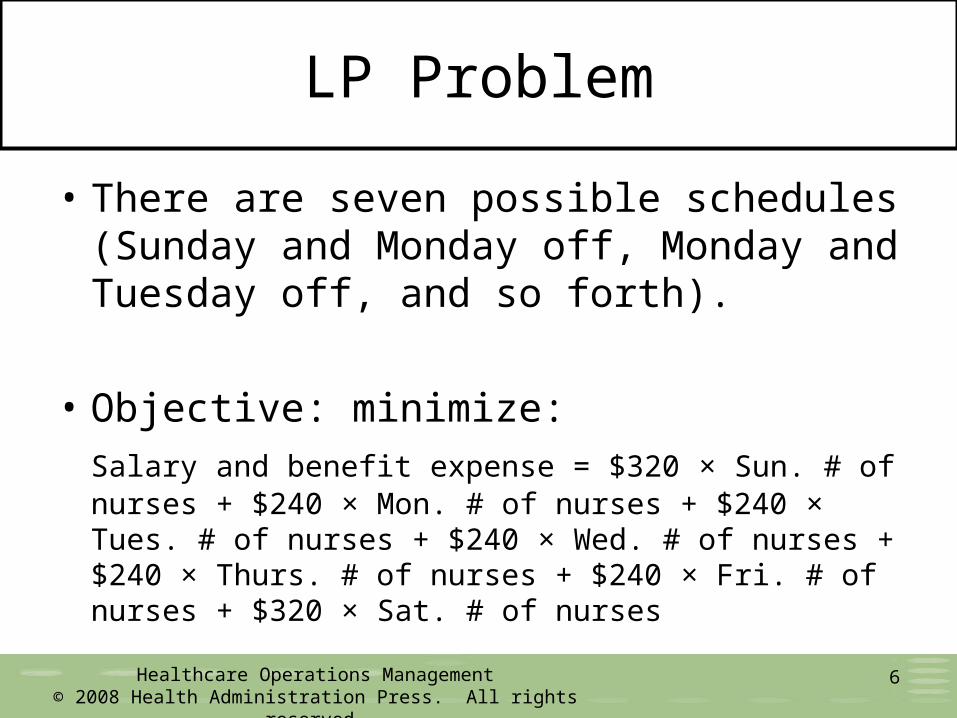
LP Problem
• There are seven possible schedules (Sunday and Monday off, Monday and Tuesday off, and so forth).
• Objective: minimize:Salary and benefit expense = $320 × Sun. # of nurses + $240 × Mon. # of nurses + $240 × Tues. # of nurses + $240 × Wed. # of nurses + $240 × Thurs. # of nurses + $240 × Fri. # of nurses + $320 × Sat. # of nurses

Healthcare Operations Management© 2008 Health Administration Press. All rights reserved.
7
LP Problem
Subject to:• The number of nurses scheduled each day must
be greater than the number of nurses needed each day.– Sun. # of nurses 5 – Mon. # of nurses 4
• The number of nurses assigned to each schedule must be greater than 0 and an integer.– # A (B, C, D, E, F, or G) nurses 0– # A (B, C, D, E, F, or G) nurses = integer

Healthcare Operations Management© 2008 Health Administration Press. All rights reserved.
8
Excel Solver SetupMinimize Salary and Benefit
Expense

Healthcare Operations Management© 2008 Health Administration Press. All rights reserved.
9
Excel Solver Solution

Healthcare Operations Management© 2008 Health Administration Press. All rights reserved.
10
Excel Solver SetupMaximize Nurse Satisfaction

Healthcare Operations Management© 2008 Health Administration Press. All rights reserved.
11
Excel Solver SolutionMaximize Nurse Satisfaction
Healthcare Operations Management© 2008 Health Administration Press. All rights reserved.
12
Job/Operation Scheduling and Sequencing Rules
• First Come, First Served (FCFS)
• Earliest Due Date (EDD)
• Earliest Operation Due Date (ODD)
• Shortest Process Time (SPT)
• Critical Ratio (CR)

Healthcare Operations Management© 2008 Health Administration Press. All rights reserved.
13
Sequencing Rule Example
A 50 100
B 100 160
C 20 50
D 80 120
E 60 80
How many possible sequences for five jobs?
Processing Due CriticalJob Time Date Slack Ratio
Healthcare Operations Management© 2008 Health Administration Press. All rights reserved.
14
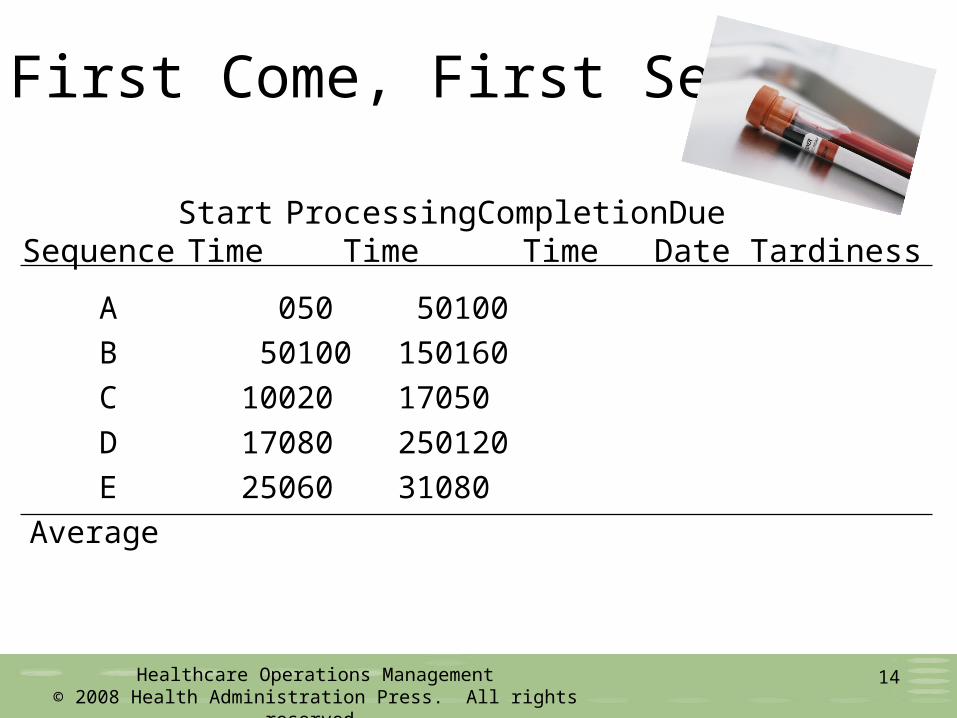
First Come, First Served
A 0 50 50 100
B 50 100 150 160
C 100 20 170 50
D 170 80 250 120
E 250 60 310 80
Average
Start Processing Completion DueSequence Time Time Time Date Tardiness

Healthcare Operations Management© 2008 Health Administration Press. All rights reserved.
15
First Come, First Served
A 0 50 50 100 0
B 50 100 150 160 0
C 100 20 170 50 120
D 170 80 250 120 130
E 250 60 310 80 230
Average 186 96
Start Processing Completion DueSequence Time Time Time Date Tardiness

Healthcare Operations Management© 2008 Health Administration Press. All rights reserved.
16
Shortest Processing Time
C 0 20 20 50 0
A 20 50 70 100 0
E 70 60 130 80 50
D 130 80 210 120 90
B 210 100 310 160 150
Average 148 58
Start Processing Completion DueSequence Time Time Time Date Tardiness
Healthcare Operations Management© 2008 Health Administration Press. All rights reserved.
17
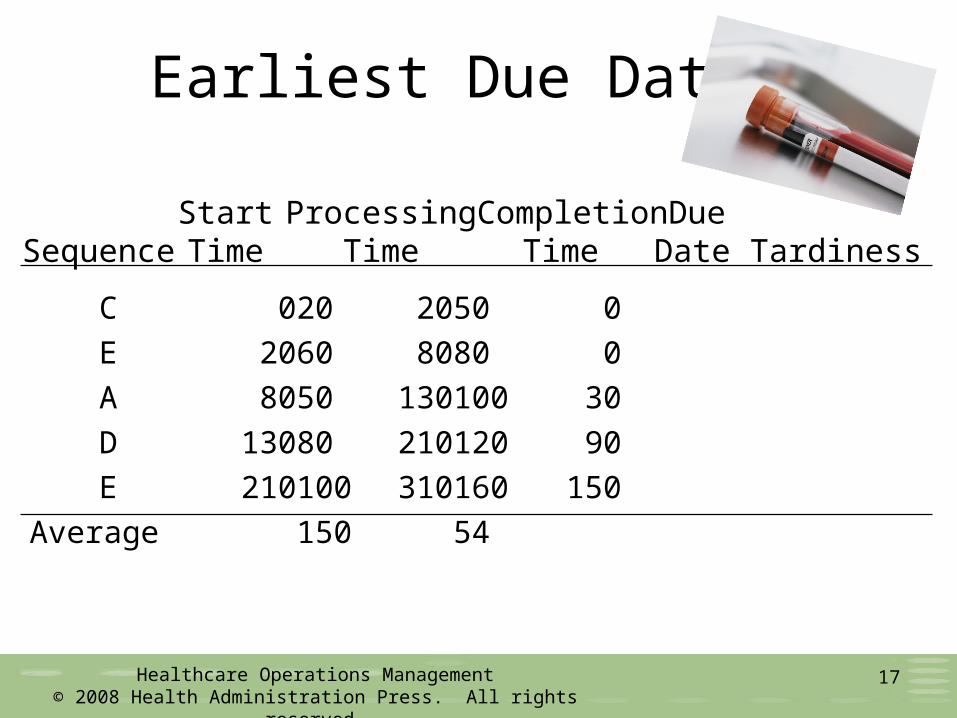
Earliest Due Date
C 0 20 20 50 0
E 20 60 80 80 0
A 80 50 130 100 30
D 130 80 210 120 90
E 210 100 310 160 150
Average 150 54
Start Processing Completion DueSequence Time Time Time Date Tardiness

Healthcare Operations Management© 2008 Health Administration Press. All rights reserved.
18
Sequencing Rule Example
A 50 100 100 − 50 = 50 100/50 = 2.00B 100 160 160 − 100 = 60 160/100 = 1.60C 20 50 50 − 20 = 30 50/20 = 2.50D 80 120 120 − 80 = 40 120/80 = 1.50E 60 80 80 − 60 = 20 80/60 = 1.25
120 possible sequences for five jobs
Processing Due CriticalJob Time Date Slack Ratio
Healthcare Operations Management© 2008 Health Administration Press. All rights reserved.
19
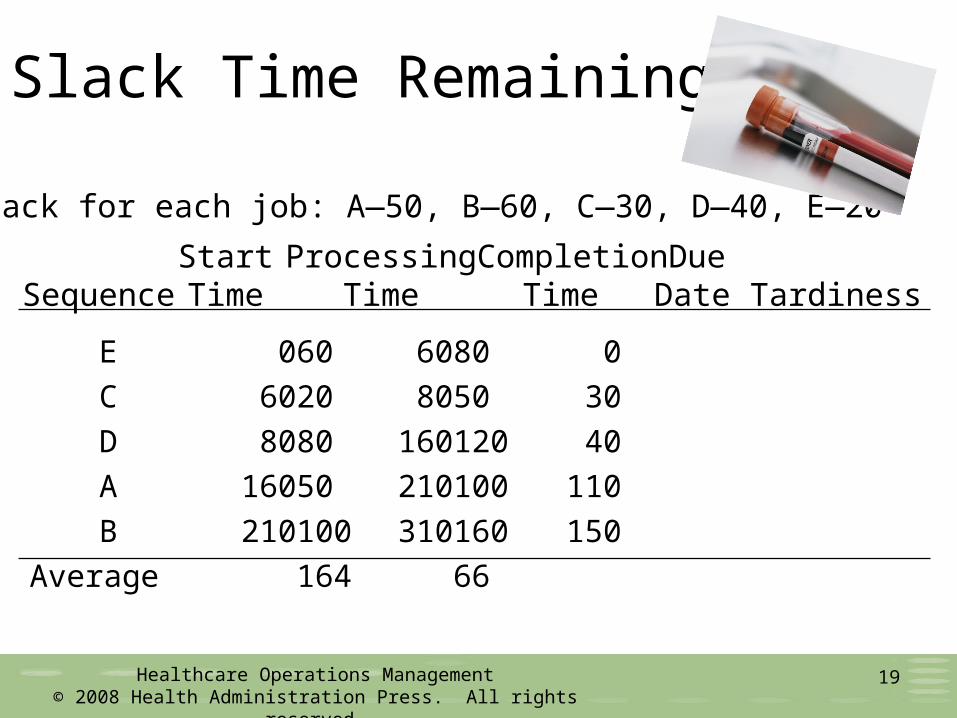
Slack Time Remaining
E 0 60 60 80 0
C 60 20 80 50 30
D 80 80 160 120 40
A 160 50 210 100 110
B 210 100 310 160 150
Average 164 66
Start Processing Completion DueSequence Time Time Time Date Tardiness
Slack for each job: A—50, B—60, C—30, D—40, E—20

Healthcare Operations Management© 2008 Health Administration Press. All rights reserved.
20
Critical Ratio (CR)
E 0 60 60 80 0
D 60 80 140 120 20
B 140 100 240 160 80
A 240 50 290 100 190
C 290 20 310 50 260
Average 208 110
Start Processing Completion DueSequence Time Time Time Date Tardiness
CR for each job: A—2.00, B—1.60, C—2.50, D—1.50, E—1.25

Healthcare Operations Management© 2008 Health Administration Press. All rights reserved.
21
Summary
FCFS 186 96 3* 230SPT 148* 58* 3* 150*EDD 150 54* 3* 150*SLACK 164 66 4 150*CR 208 110 4 260
*Best values
Average Average No. of MaximumRule Completion Time Tardiness Jobs Tardy Tardiness

Healthcare Operations Management© 2008 Health Administration Press. All rights reserved.
22
Guidelines for Selecting a Sequencing Rule
1. SPT is most useful for a very busy resource.• Some jobs may never be completed.• SPT often is used with another rule.
2. Use EDD when only small tardiness values can be tolerated.
3. Use FCFS when there is excess capacity.

Healthcare Operations Management© 2008 Health Administration Press. All rights reserved.
23
Appointment Scheduling Schemes
Purpose is to balance the competing goals of: • Maximizing resource utilization• Minimizing waiting time
Four types:• Block appointment• Individual appointment• Mixed block-individual appointment• Combinations

Healthcare Operations Management© 2008 Health Administration Press. All rights reserved.
24
Bailey-Welch Schedule
Individual Appointment Bailey-Welch
Time # Scheduled
0:00 1
0:20 1
0:40 1
1:00 1
1:20 1
Time # Scheduled
0:00 2
0:20 1
0:40 1
1:00 1
1:20 0

Healthcare Operations Management© 2008 Health Administration Press. All rights reserved.
25
Appointment Scheduling Schemes
Optimal Outpatient Appointment Scheduling Tool

Healthcare Operations Management© 2008 Health Administration Press. All rights reserved.
26
Advanced Access
• Traditional scheduling systems– Long times until next appointment– High no-show rates– Double/triple booking—queues form
• Advanced access– Patients seen same day as request– Reduces no-show rate– Better continuity of care
Healthcare Operations Management© 2008 Health Administration Press. All rights reserved.
27
Implementing Advanced Access
• Obtain buy-in• Predict demand• Predict capacity
– Little’s law (Chapter 11)– Standardize and minimize types of visit times
• Assess operations• Work down backlog• Go live

Healthcare Operations Management© 2008 Health Administration Press. All rights reserved.
28
Advanced Access Metrics
• PCP match: percentage of same-day patients who see their PCP
• PCP coverage: percentage of same-day patients seen by any physician
• Wait time for next appointment (or third next available appointment)
• Good backlog: appointments scheduled in advance because of patient preference
• Bad backlog: appointments waiting because of lack of slots
Healthcare Operations Management© 2008 Health Administration Press. All rights reserved.
29
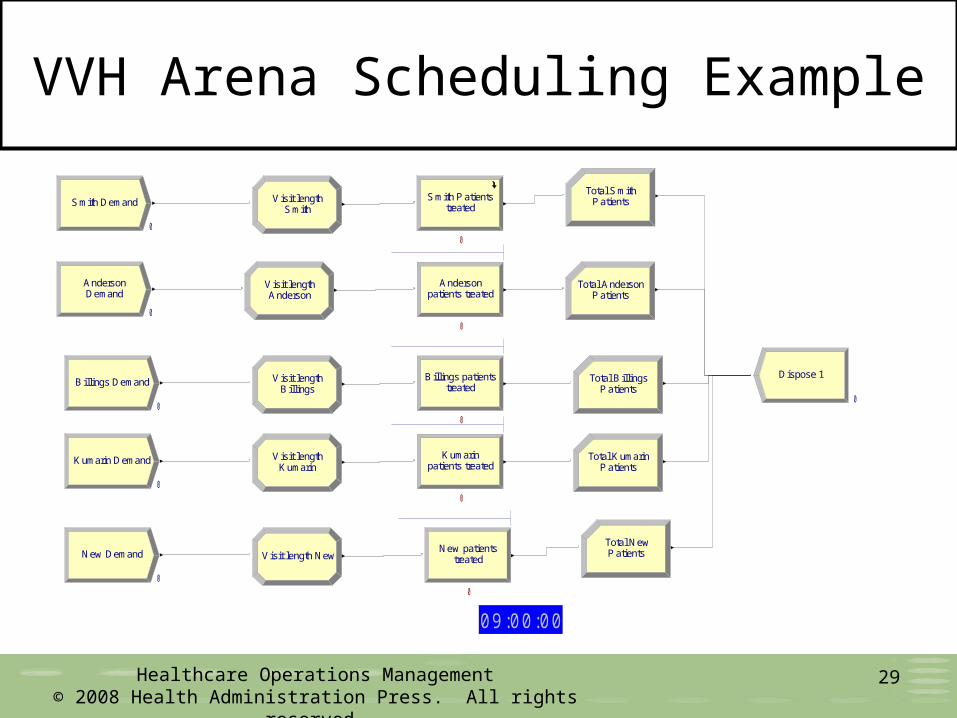
VVH Arena Scheduling Example
Smith DemandSmith
V isit length
DemandAnderson
Billings Demand
Kumarin Demand
New Demand
treatedSmith Patients
patients treatedAnderson
treatedBillings patients
patients treatedKumarin
treatedNew patients
PatientsTotal Anderson
PatientsTotal B illings
PatientsTotal Kumarin
Dispose 1
PatientsTotal New
AndersonVisit length
B illingsV isit length
KumarinV isit length
V isit length New
PatientsTotal Smith
0
0
0
0
0
0
0
0
0
0
0
0 9 :0 0 :0 0
Healthcare Operations Management© 2008 Health Administration Press. All rights reserved.
30
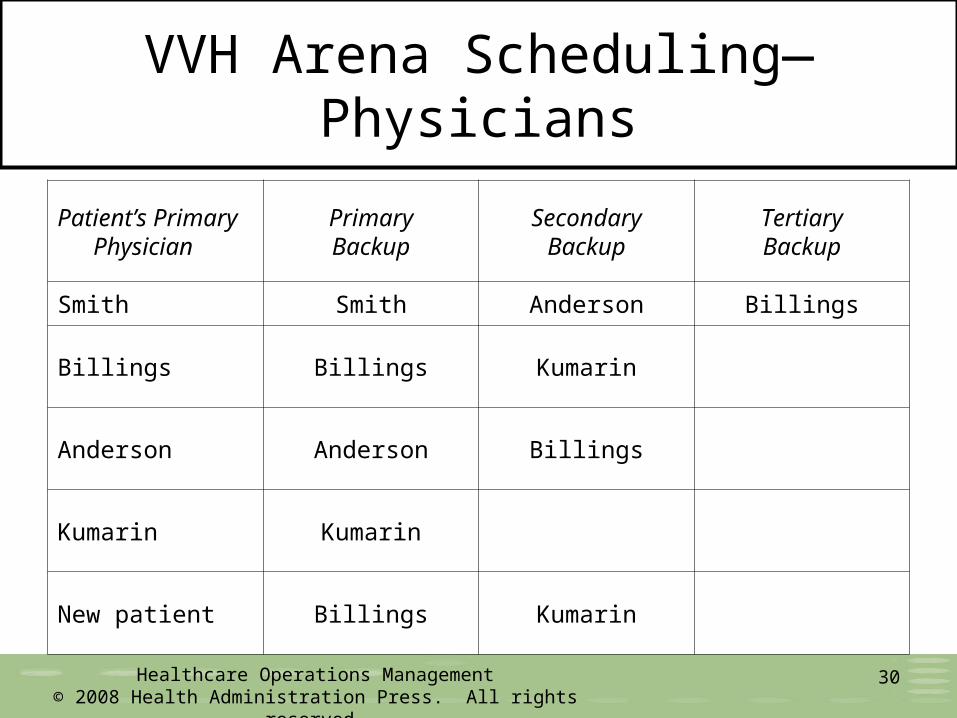
VVH Arena Scheduling—Physicians
Patient’s Primary Physician
PrimaryBackup
SecondaryBackup
TertiaryBackup
Smith Smith Anderson Billings
Billings Billings Kumarin
Anderson Anderson Billings
Kumarin Kumarin
New patient Billings Kumarin

Healthcare Operations Management© 2008 Health Administration Press. All rights reserved.
31
VVH Scheduling—Physician Schedule
Monday Hours Tuesday Hours
Physician 1 2 3 4 5 6 7 8 1 2 3 4 5 6 7 8
Anderson 1 1 1 1 1 1 1 1 1
Billings 1 1 1 1 1 1 1 1 1
Kumarin 1 1 1 1 1 1 1 1 1 1 1 1
Smith 1 1 1 1 1 1 1 1 1
Wednesday Hours Thursday Hours
1 2 3 4 5 6 7 8 1 2 3 4 5 6 7 8
Anderson 1 1 1 1 1 1 1
Billings 1 1 1 1 1 1 1 1
Kumarin 1 1 1 1 1 1 1 1 1 1 1 1 1 1
Smith 1 1 1 1 1 1
Friday
1 2 3 4 5 6 7 8 Total Weekly Hours
Anderson 1 1 1 1 20
Billings 1 1 1 1 21
Kumarin 1 1 1 1 1 1 32
Smith 15
All 88

Healthcare Operations Management© 2008 Health Administration Press. All rights reserved.
32
VVH Scheduling Probability Distributions
Physician Arrival RateExponential Distribution
Mean (Hours)
Triangular Distribution of Service Time: Minimum, Mode, Maximum
(Hours)
Smith 1.0 0.15, 0.50, 0.80
Billings 1.2 0.10, 0.20, 0.60
Anderson 1.0 0.10, 0.20, 0.60
Kumarin 2.0 0.15, 0.50, 0.80
New patient 0.8 0.25, 0.50, 1.00

Healthcare Operations Management© 2008 Health Administration Press. All rights reserved.
33
VVH Arena Scheduling Sub-Model
STATE(Smit h) == -1
Else
S mith available? PatientSmith sees Smith
A nderson A vailable ?
STATE(Anderson) == -1
Else
Smith patientAnderson sees
Smith patientBil l ings sees
by AndersonSmith patient seen
by SmithSmith patient seem
by Bil lingsSmith patient seen
Smith Anderson Billings Kumarin
B illings available?
STATE(Billings) == -1
Else
0
0
0
Healthcare Operations Management© 2008 Health Administration Press. All rights reserved.
34
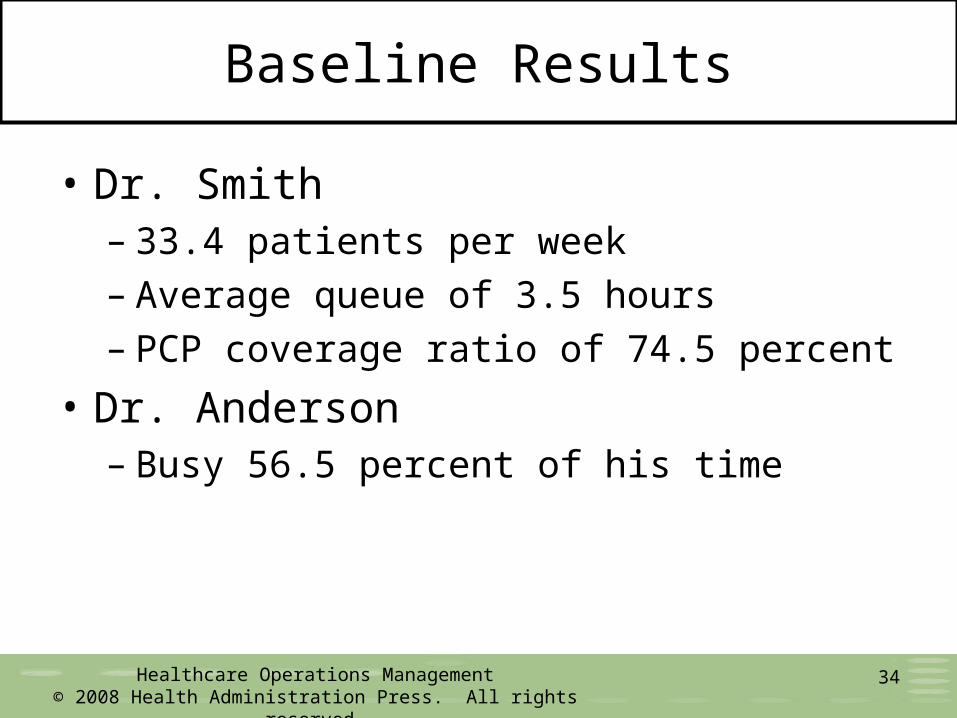
Baseline Results
• Dr. Smith– 33.4 patients per week– Average queue of 3.5 hours– PCP coverage ratio of 74.5 percent
• Dr. Anderson– Busy 56.5 percent of his time
Healthcare Operations Management© 2008 Health Administration Press. All rights reserved.
35
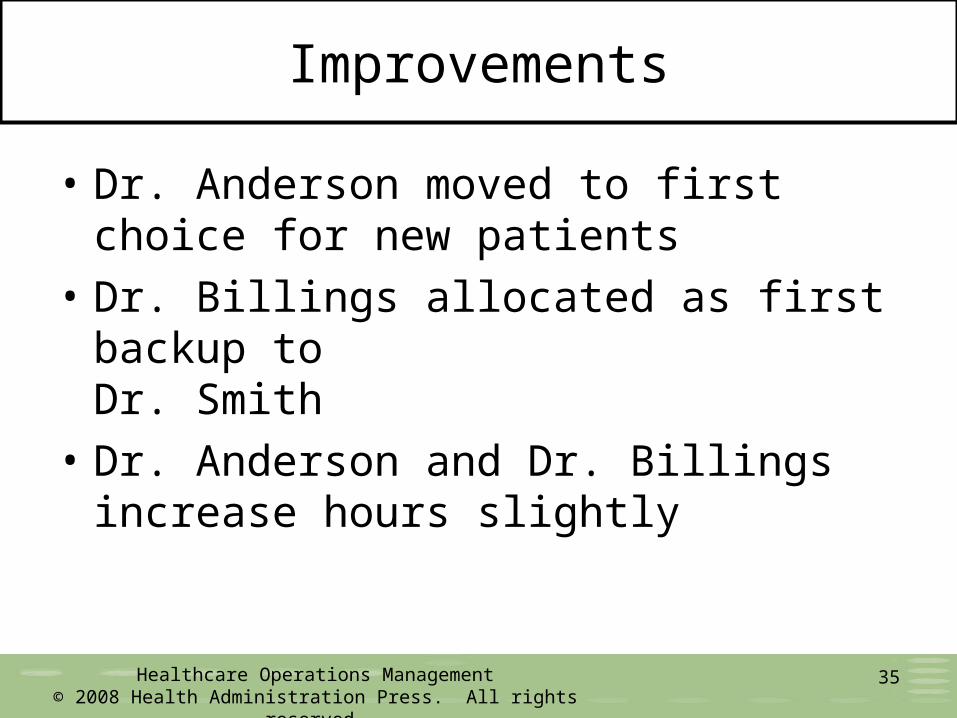
Improvements
• Dr. Anderson moved to first choice for new patients
• Dr. Billings allocated as first backup to Dr. Smith
• Dr. Anderson and Dr. Billings increase hours slightly
Healthcare Operations Management© 2008 Health Administration Press. All rights reserved.
36
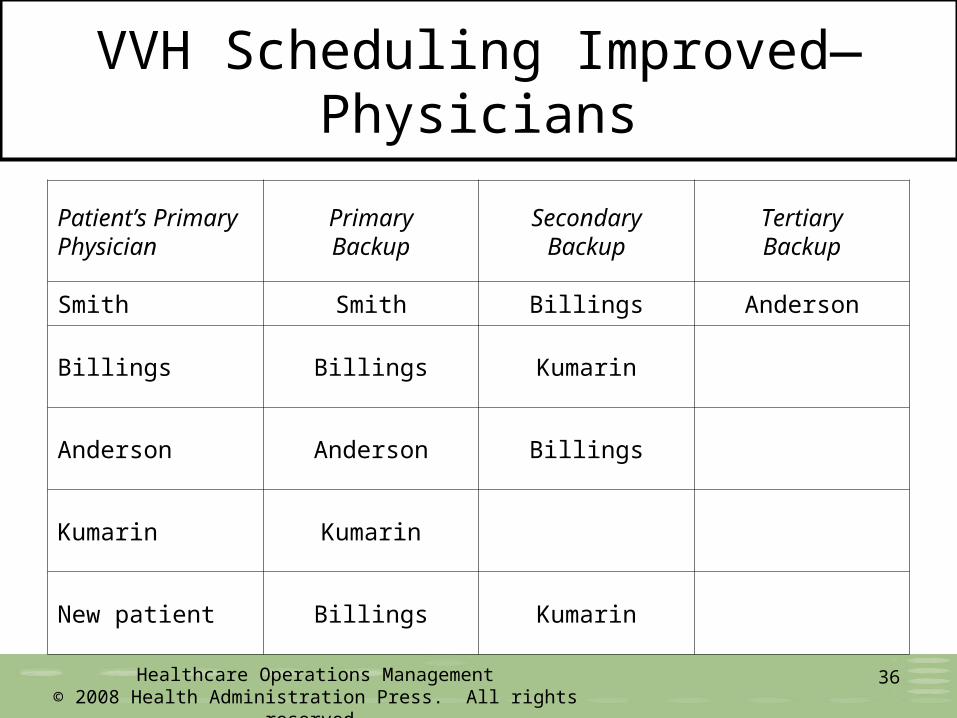
VVH Scheduling Improved—Physicians
Patient’s Primary Physician
PrimaryBackup
SecondaryBackup
TertiaryBackup
Smith Smith Billings Anderson
Billings Billings Kumarin
Anderson Anderson Billings
Kumarin Kumarin
New patient Billings Kumarin

Healthcare Operations Management© 2008 Health Administration Press. All rights reserved.
37
VVH Scheduling ImprovedMonday Hours Tuesday Hours
Physician 1 2 3 4 5 6 7 8 1 2 3 4 5 6 7 8
Anderson 1 1 1 1 1 1 1 1 1 1 1
Billings 1 1 1 1 1 1 1 1 1
Kumarin 1 1 1 1 1 1 1 1 1
Smith 1 1 1 1 1 1 1 1 1
Wednesday Hours Thursday Hours
1 2 3 4 5 6 7 8 1 2 3 4 5 6 7 8
Anderson 1 1 1 1 1 1 1 1 1
Billings 1 1 1 1 1 1 1 1
Kumarin 1 1 1 1 1 1 1 1 1 1 1 1 1 1
Smith 1 1 1 1 1 1
Friday
1 2 3 4 5 6 7 8 Total Weekly Hours
Anderson 1 1 1 1 24
Billings 1 1 1 1 1 1 1 24
Kumarin 1 1 1 1 1 1 32
Smith 15
All 95

Healthcare Operations Management© 2008 Health Administration Press. All rights reserved.
38
Improvement Results
• Dr. Smith sees 28.6 patients/week—decreased backlog.
• Utilization of staff is more balanced—no one is over 91 percent utilization.
• Dr. Billings now gets Friday afternoon off.

End of Chapter 12