healthcare sector update - december 2015
TRANSCRIPT

Duff & Phelps
Healthcare Sector UpdateDecember 2015
SPOTLIGHT SECTOR SUMMARY
The S&P 500 rose 4.6% over the last three months although the S&P Healthcare Services Index and Pharmaceuticals, Biotechnology & Life Sciences Index lagged rising only 2.6% and 0.2%, respectively. Within Pharmaceuticals, Biotechnology & Life Sciences, the Diagnostic Imaging Devices sector significantly outperformed over the period rising 26%. The sector benefited from the CMS decision to cover new methods of mammography such as 3D which are reported to be significantly more accurate than current methods. As hospitals add 3D scanning systems to attract patients seeking a more reliable diagnosis, the backlog and installed base for this sector is likely to grow.
The Diagnostic Imaging Devices sector is also benefiting from increases in capital expenditures by hospitals needing to accommodate higher patient volumes driven by greater insurance coverage from the Affordable Care Act. The U.S. Census Bureau cited uninsured
Americans fell to 33 million in 2014 from 42 million in 2013. Higher capital expenditures drive increases in Diagnostic Imaging Devices company backlogs, as greater patient volumes increase instrument usage and maintenance requirements.
The Diagnostic Imaging Devices sector does face challenges. The U.S. Preventive Services Task Force re-affirmed its recommendation for mammography screening every two years instead of annually for women age 50 to 74. Should this change the frequency of screens, the industry would likely suffer from reductions in scan volumes. Patient deductibles and coinsurance are rising, which also puts pressure on patient volumes and demand for imaging devices.
Hospital consolidation may create pricing pressure that could reduce margins in the sector and lead some Diagnostic Imaging Devices companies to explore M&A activity or pursue aggressive cost cutting programs.

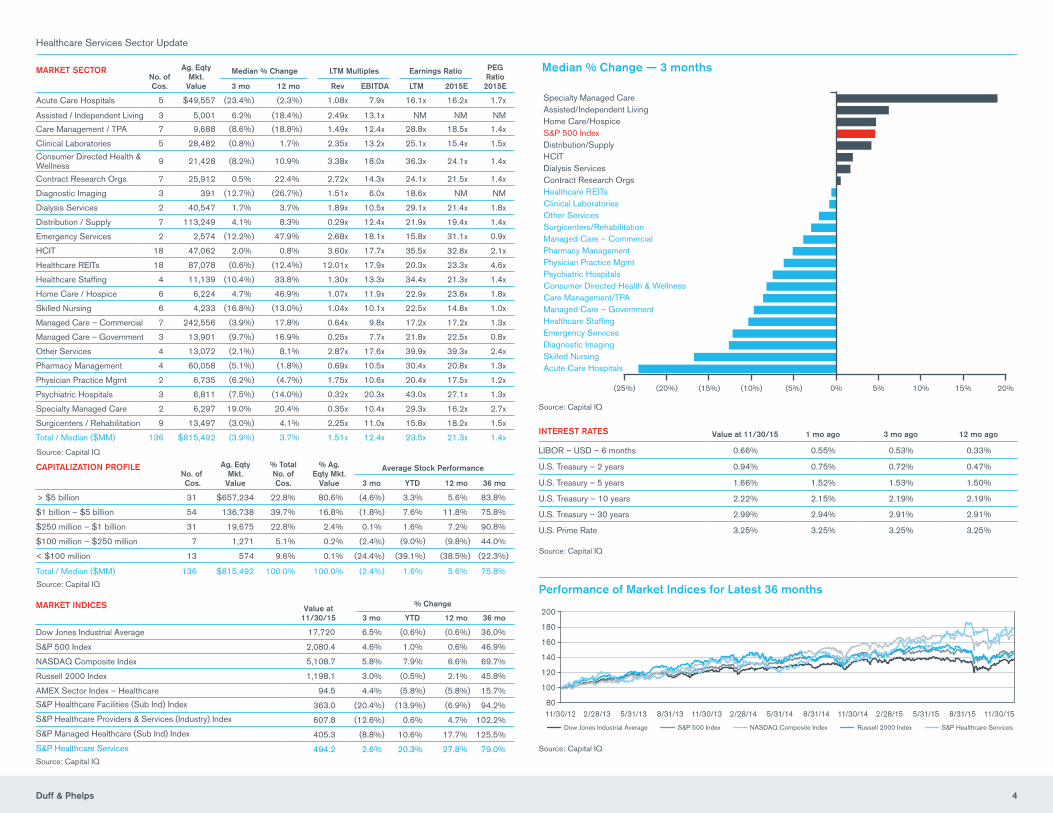
By the Numbers: Healthcare ServicesThe S&P Healthcare Services Index has increased 2.6% over the last three months, performing worse than the S&P 500, which increased 4.6% over the same period.
Over the past three months:
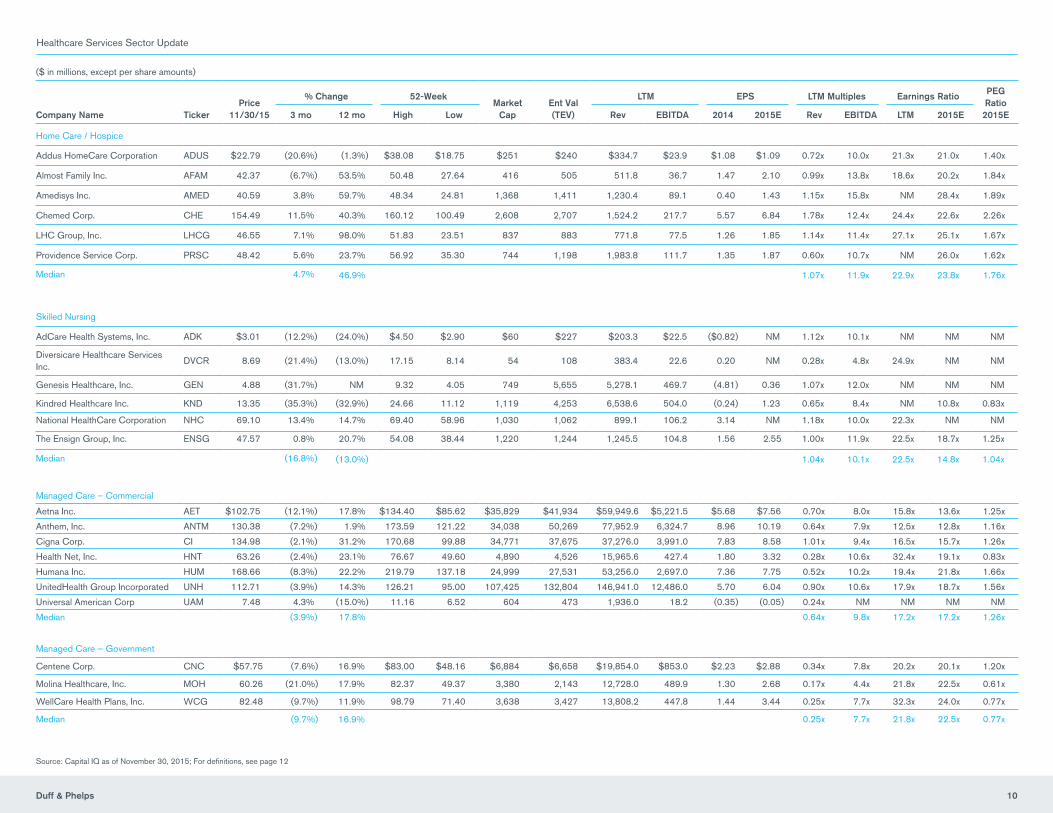
• The best performing sectors were Specialty Managed Care (up 19.0%), Assisted / Independent Living (up 6.2%), and Home Care / Hospice (up 4.7%)
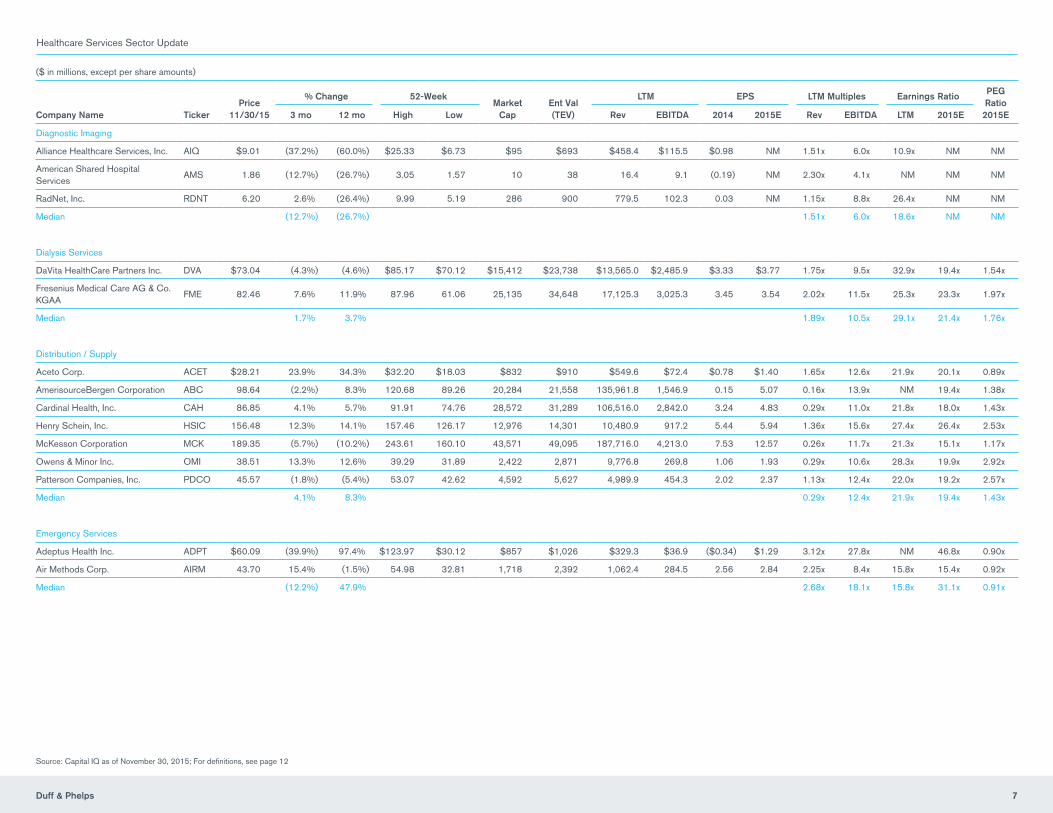
• The worst performing sectors were Acute Care Hospitals (down 23.4%), Skilled Nursing (down 16.8%) and Diagnostic Imaging (down 12.7%)
The current median LTM revenue and LTM EBITDA multiples for the Healthcare Services industry overall are 1.51x and 12.4x, respectively.
The sectors with the highest valuation multiples include:
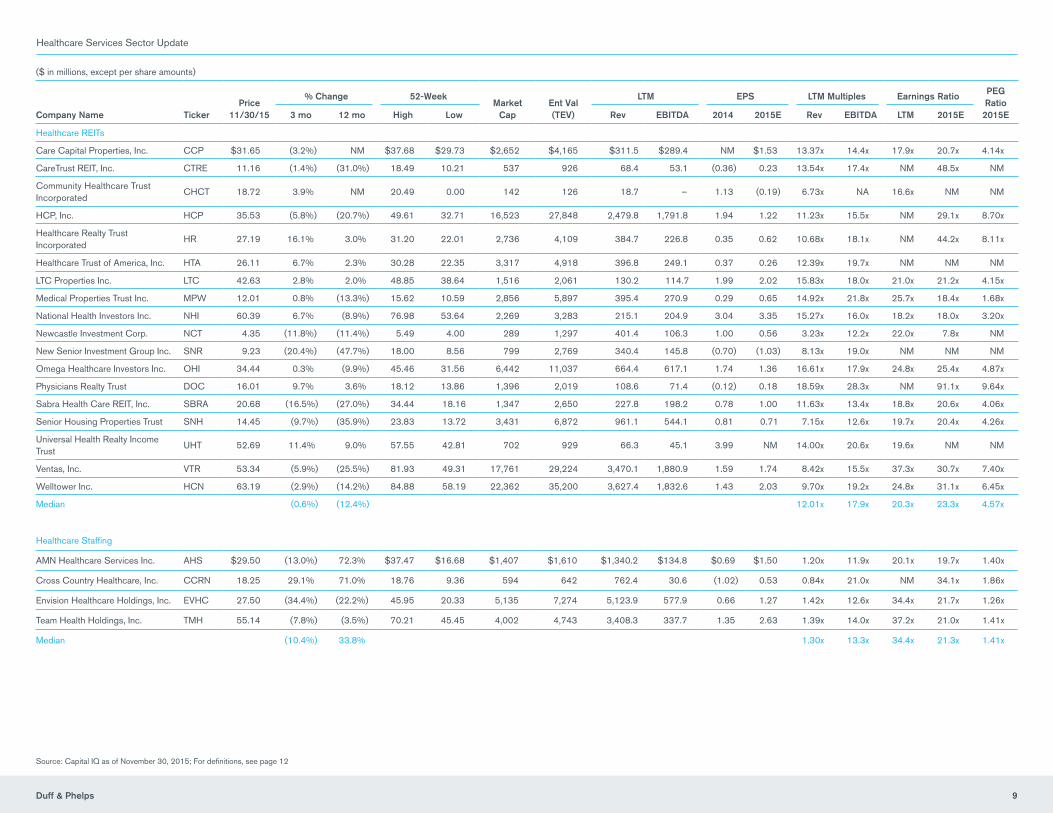
• Healthcare REITs (12.0x LTM Revenue, 17.9x LTM EBITDA)
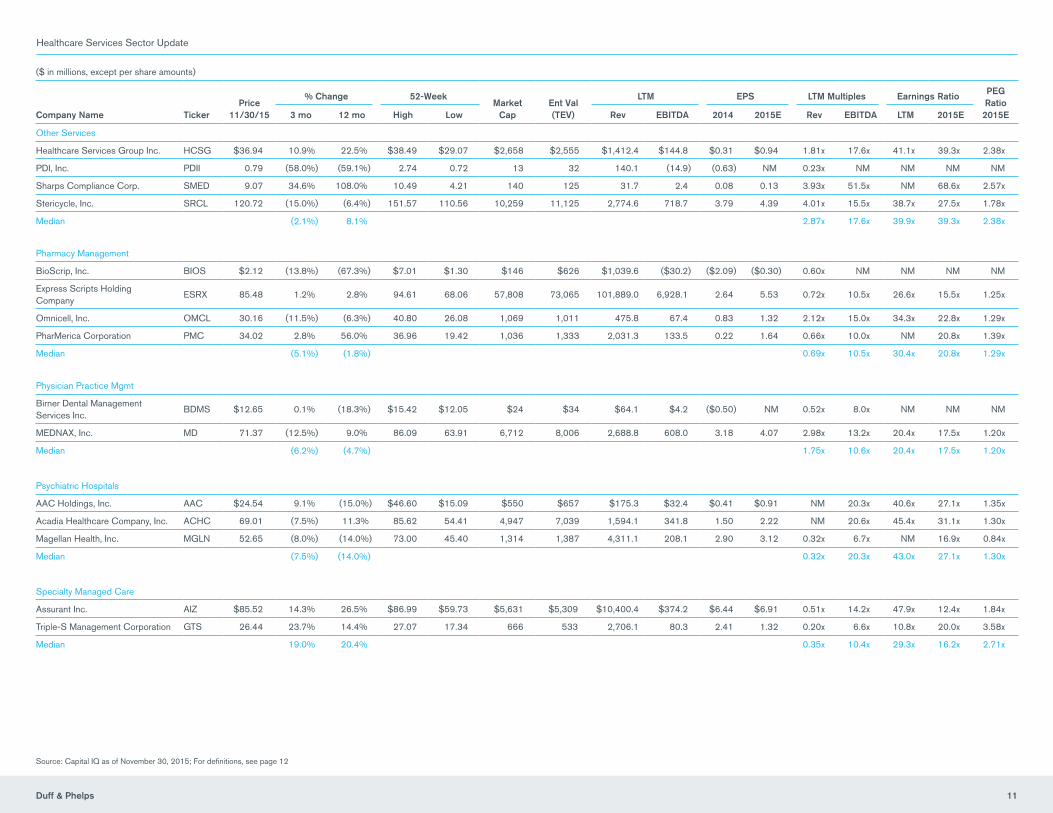
• Psychiatric Hospitals (0.3x LTM Revenue, 20.3x LTM EBITDA)
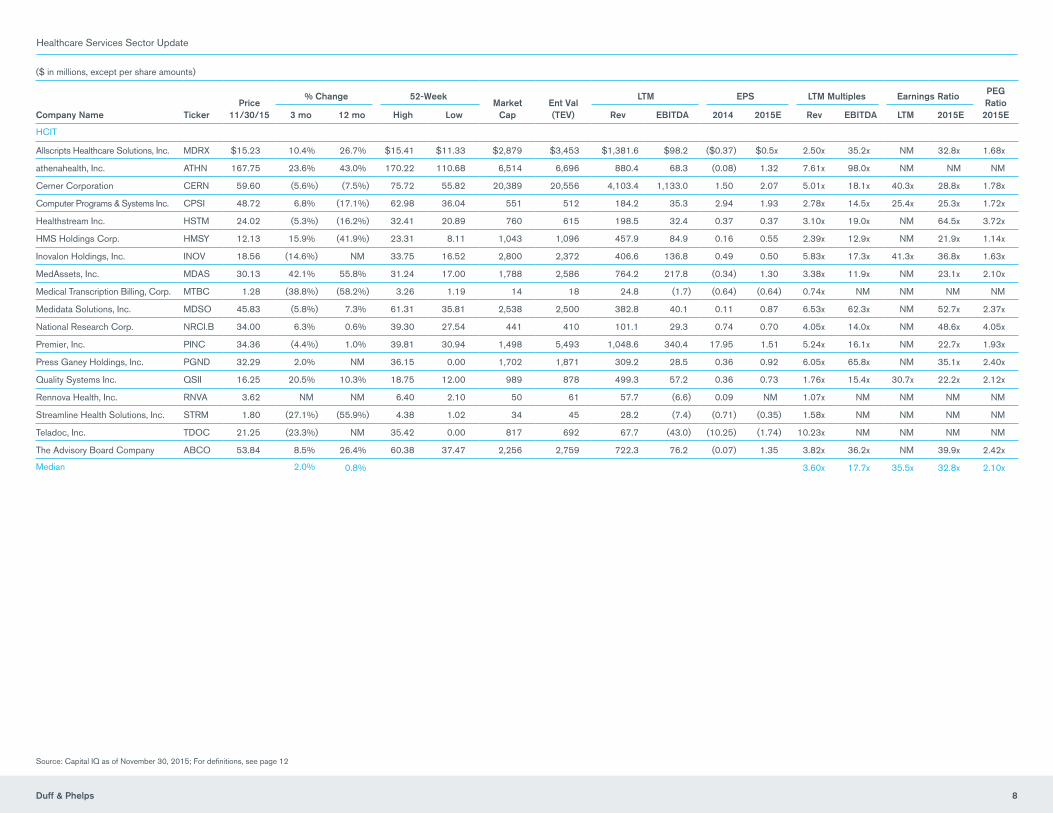
• HCIT (3.6x LTM Revenue, 17.7x LTM EBITDA)
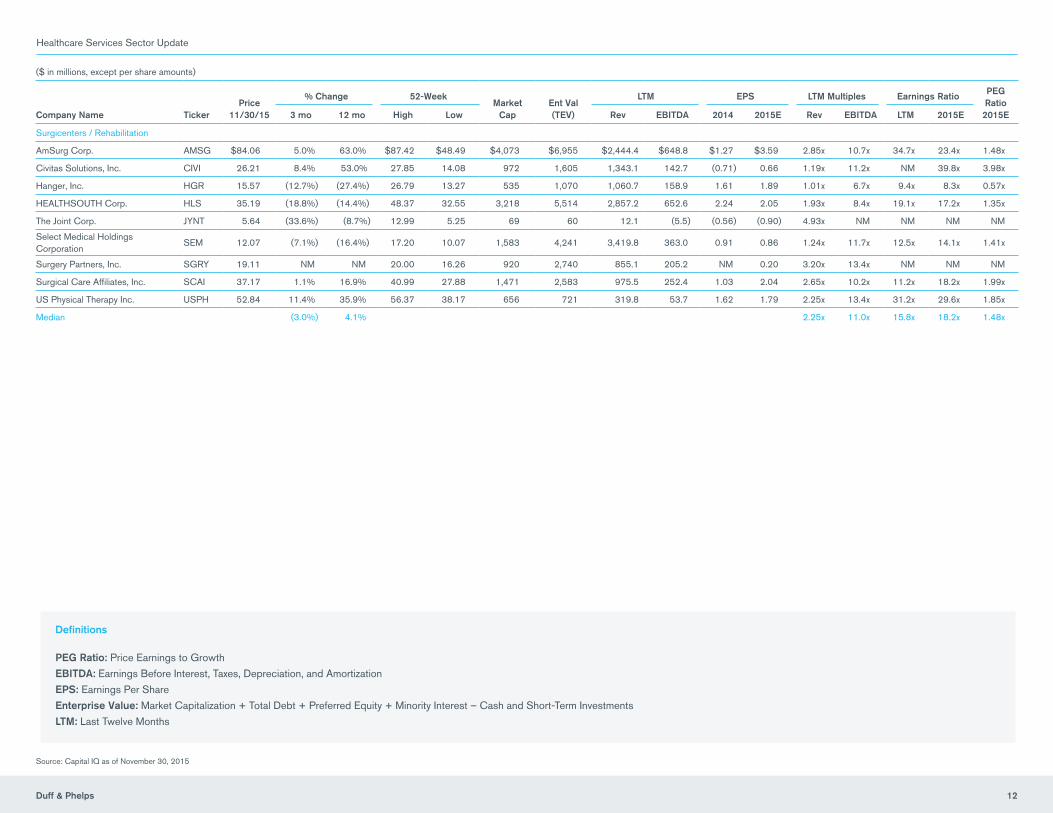
• Emergency Services (2.7x LTM Revenue, 18.1x LTM EBITDA)
By the Numbers: Pharmaceutical, Medical Devices and Life SciencesThe S&P 500 – Pharmaceuticals, Biotechnology & Life Sciences Index has declined 0.2% over the last three months, performing worse than the S&P 500, which has increased 4.6% over the same period.
Over the past three months:
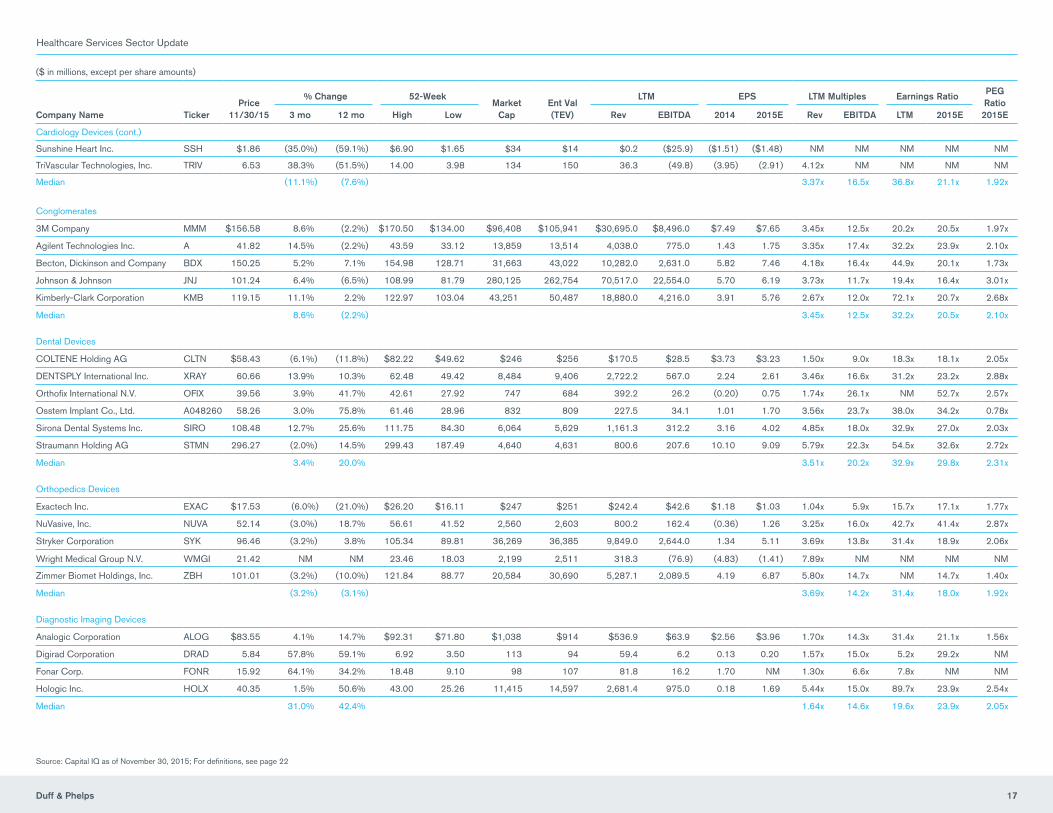
• The best performing sectors were Diagnostic Imaging Devices (up 31.0%) and Infection Prevention Devices (up 29.9%).
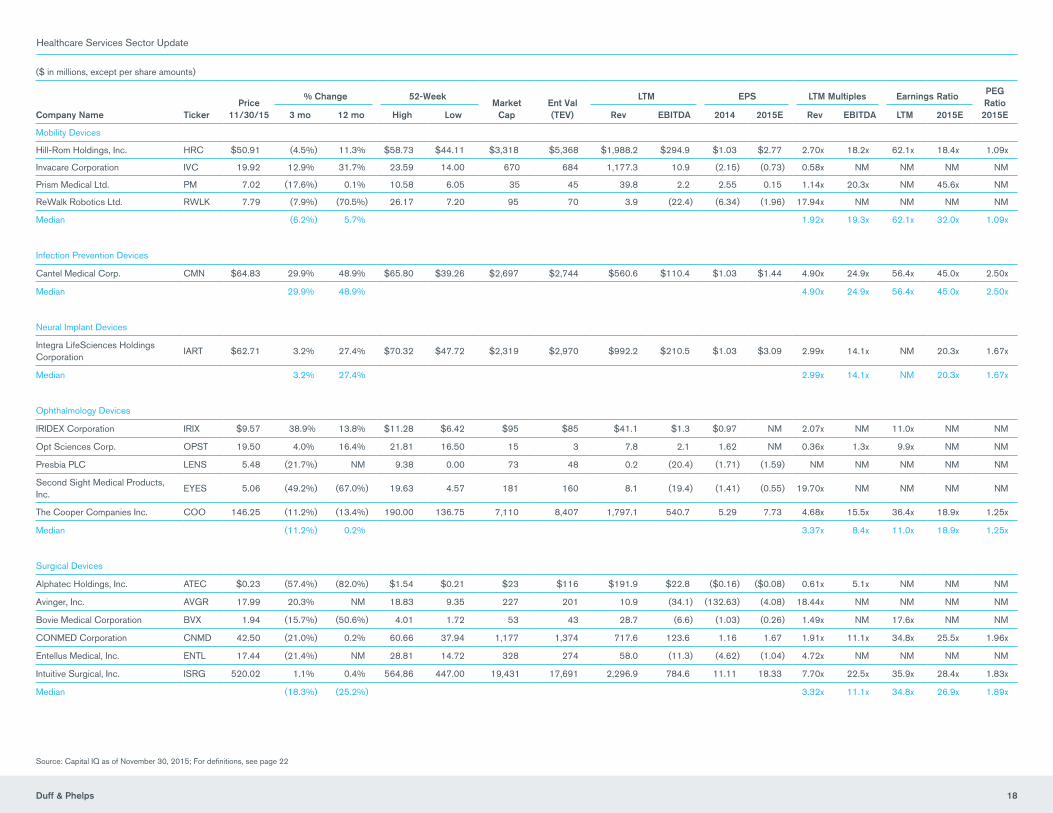
• The worst performing sectors were Surgical Devices (down 18.3%), Ophthalmology Devices (down 11.2%) and Cardiology Devices (down 11.1%).
The current median LTM revenue and LTM EBITDA multiples for the Pharmaceutical / Medical Device / Life Science industry overall are 3.5x and 14.8x, respectively.
The sectors with the highest valuation multiples include:
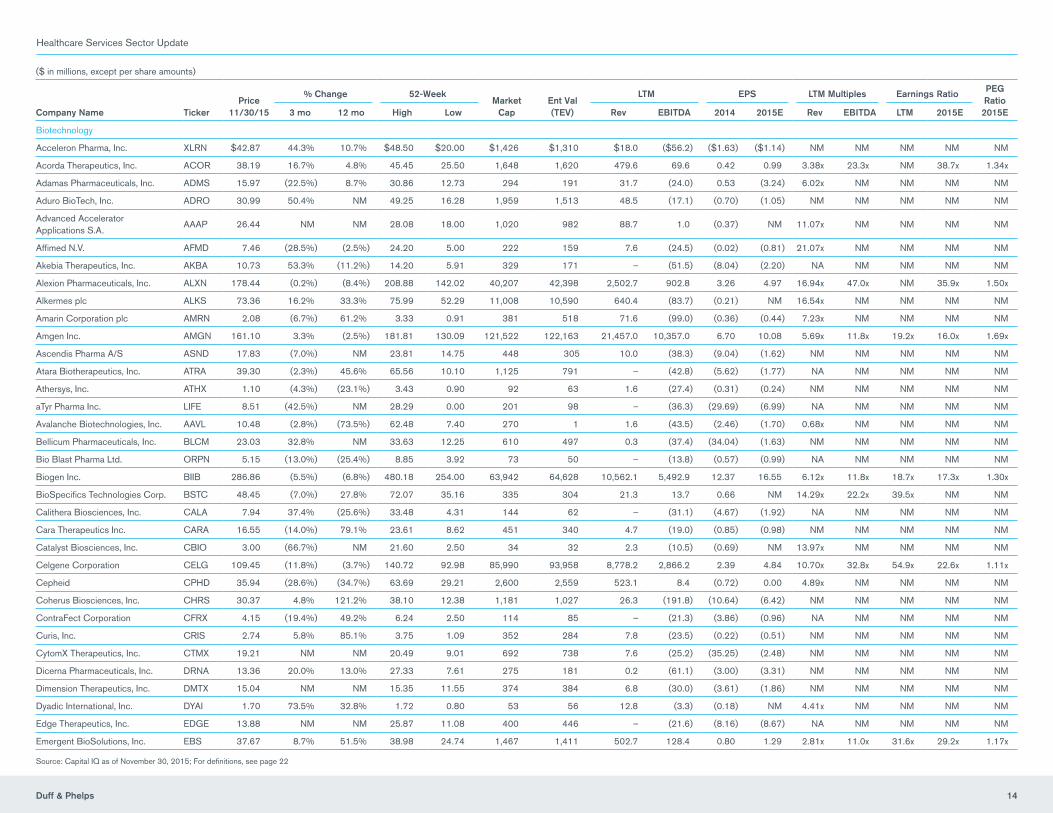
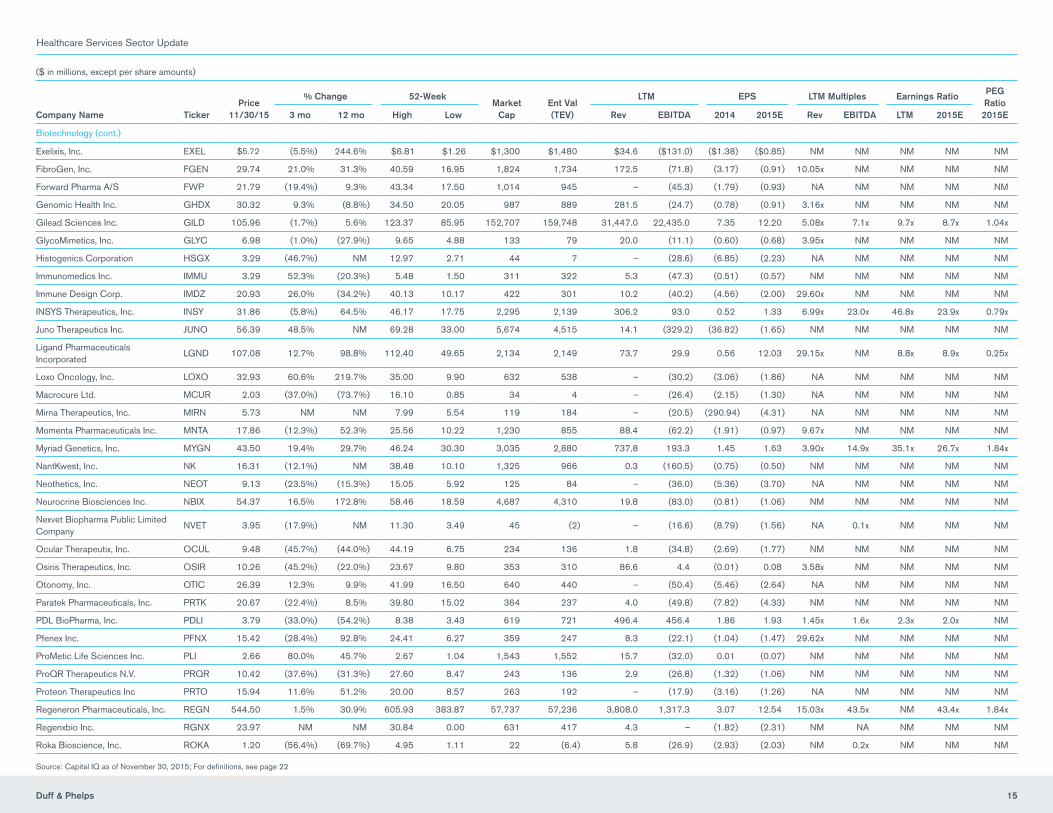
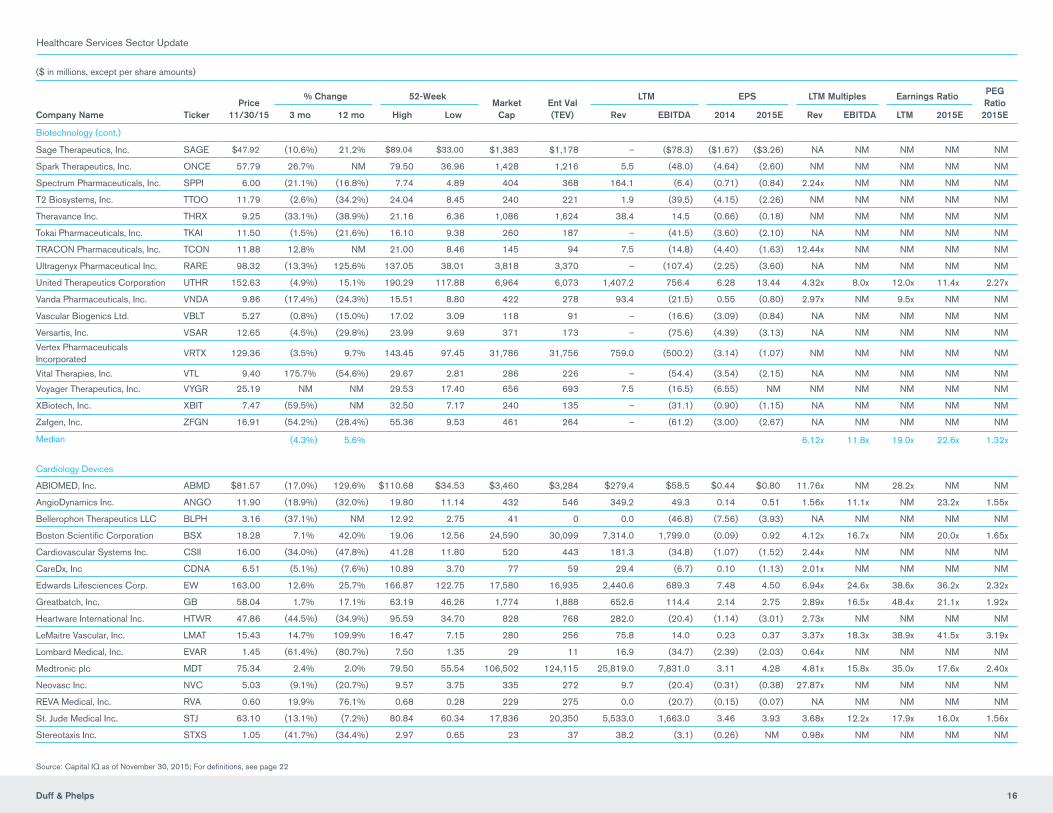
• Biotechnology (6.1x LTM Revenue, 11.8x LTM EBITDA)
• Infection Prevention Devices (4.9x LTM Revenue, 24.9x LTM EBITDA)
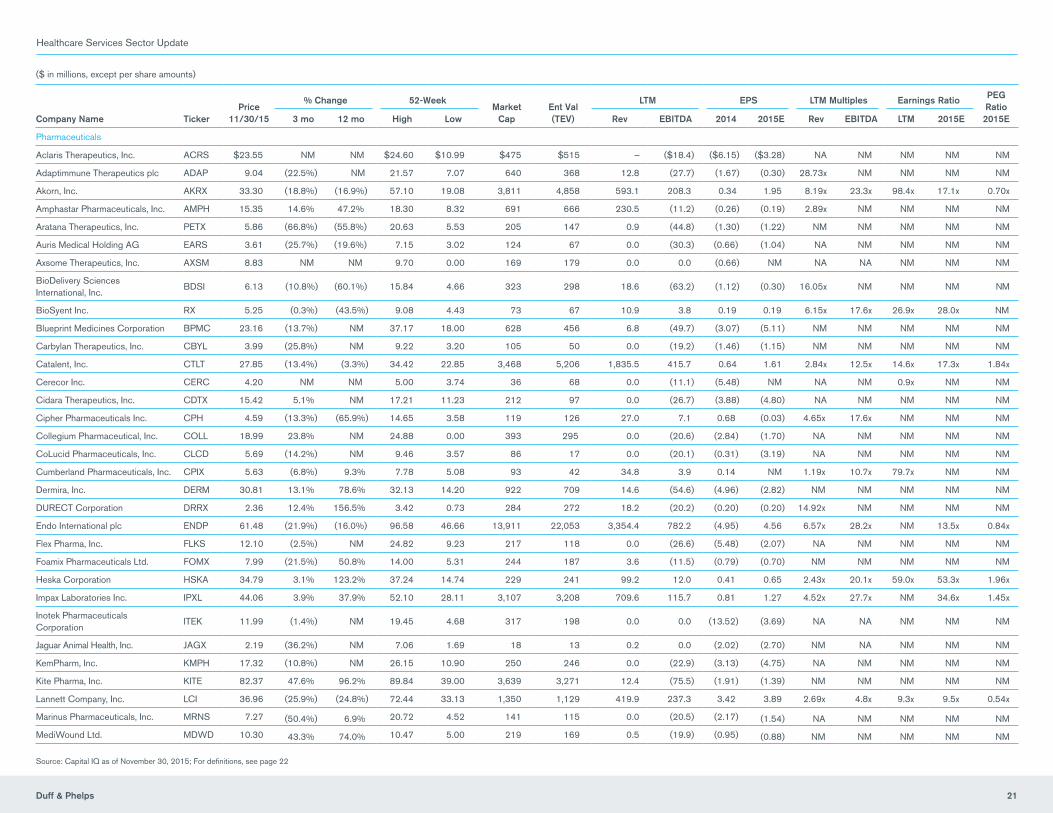
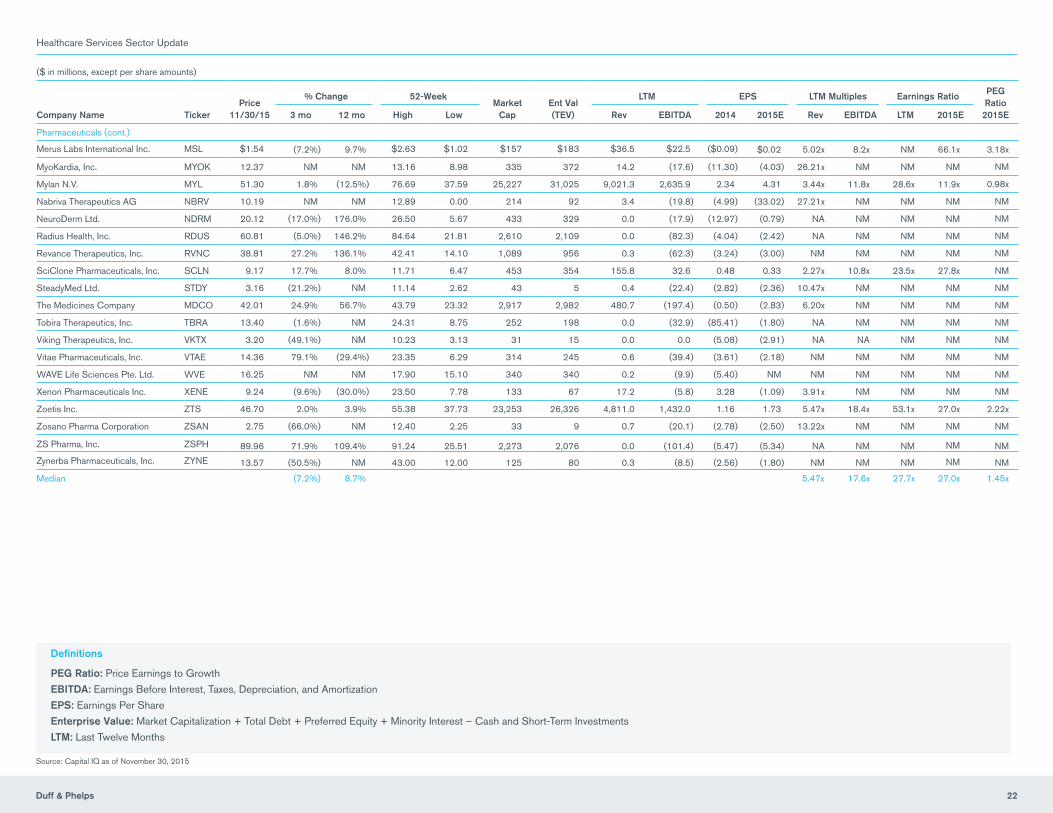
• Pharmaceuticals (5.9x LTM Revenue, 17.6x LTM EBITDA)
• Dental Devices (3.5x LTM Revenue, 20.2x LTM EBITDA)
Healthcare Services Sector Update
Duff & Phelps 2
Powering Sound Decisions for Companies, Boards and Investors Worldwide
#1 Announced Fairness Opinions in the U.S. Over the Past Five Years
#3 U.S. Middle-Market M&A Advisor Over the Past Three Years
Top 10 U.S. Restructuring Advisor
Source: Fairness opinion rankings calculated by number of deals from Thomson Financial Securities full years 2010 through 2014. M&A rankings calculated by number of deals from Thomson Financial Securities full years 2012 through 2014. Middle-market M&A deals < $200 million. Bankruptcy case ranking provided by The Deal Q4 2014 league table.
Duff & Phelps is the premier global valuation and corporate finance advisor with expertise in complex valuation, dispute and legal management consulting, M&A, restructuring, and compliance and regulatory consulting. The firm’s more than 2,000 employees serve a diverse range of clients from offices around the world. For more information, visit www.duffandphelps.com.
Healthcare Services Sector Update
Median % Change — 3 monthsMARKET SECTORNo. of Cos.
Ag. Eqty Mkt.
Value
Median % Change LTM Multiples Earnings Ratio PEG Ratio 2015E3 mo 12 mo Rev EBITDA LTM 2015E
Acute Care Hospitals 5 $49,557 (23.4%) (2.3%) 1.08x 7.9x 16.1x 16.2x 1.7x
Assisted / Independent Living 3 5,001 6.2% (18.4%) 2.49x 13.1x NM NM NM
Care Management / TPA 7 9,688 (8.6%) (18.8%) 1.49x 12.4x 28.8x 18.5x 1.4x
Clinical Laboratories 5 28,482 (0.8%) 1.7% 2.35x 13.2x 25.1x 15.4x 1.5x
Consumer Directed Health & Wellness 9 21,428 (8.2%) 10.9% 3.38x 18.0x 36.3x 24.1x 1.4x
Contract Research Orgs 7 25,912 0.5% 22.4% 2.72x 14.3x 24.1x 21.5x 1.4x
Diagnostic Imaging 3 391 (12.7%) (26.7%) 1.51x 6.0x 18.6x NM NM
Dialysis Services 2 40,547 1.7% 3.7% 1.89x 10.5x 29.1x 21.4x 1.8x
Distribution / Supply 7 113,249 4.1% 8.3% 0.29x 12.4x 21.9x 19.4x 1.4x
Emergency Services 2 2,574 (12.2%) 47.9% 2.68x 18.1x 15.8x 31.1x 0.9x
HCIT 18 47,062 2.0% 0.8% 3.60x 17.7x 35.5x 32.8x 2.1x
Healthcare REITs 18 87,078 (0.6%) (12.4%) 12.01x 17.9x 20.3x 23.3x 4.6x
Healthcare Staffing 4 11,139 (10.4%) 33.8% 1.30x 13.3x 34.4x 21.3x 1.4x
Home Care / Hospice 6 6,224 4.7% 46.9% 1.07x 11.9x 22.9x 23.8x 1.8x
Skilled Nursing 6 4,233 (16.8%) (13.0%) 1.04x 10.1x 22.5x 14.8x 1.0x
Managed Care – Commercial 7 242,556 (3.9%) 17.8% 0.64x 9.8x 17.2x 17.2x 1.3x
Managed Care – Government 3 13,901 (9.7%) 16.9% 0.25x 7.7x 21.8x 22.5x 0.8x
Other Services 4 13,072 (2.1%) 8.1% 2.87x 17.6x 39.9x 39.3x 2.4x
Pharmacy Management 4 60,058 (5.1%) (1.8%) 0.69x 10.5x 30.4x 20.8x 1.3x
Physician Practice Mgmt 2 6,735 (6.2%) (4.7%) 1.75x 10.6x 20.4x 17.5x 1.2x
Psychiatric Hospitals 3 6,811 (7.5%) (14.0%) 0.32x 20.3x 43.0x 27.1x 1.3x
Specialty Managed Care 2 6,297 19.0% 20.4% 0.35x 10.4x 29.3x 16.2x 2.7x
Surgicenters / Rehabilitation 9 13,497 (3.0%) 4.1% 2.25x 11.0x 15.8x 18.2x 1.5x
Total / Median ($MM) 136 $815,492 (3.9%) 3.7% 1.51x 12.4x 23.5x 21.3x 1.4x
Source: Capital IQ
CAPITALIZATION PROFILENo. of Cos.
Ag. Eqty Mkt.
Value
% Total No. of Cos.
% Ag. Eqty Mkt.
Value
Average Stock Performance
3 mo YTD 12 mo 36 mo
> $5 billion 31 $657,234 22.8% 80.6% (4.6%) 3.3% 5.6% 83.8%
$1 billion – $5 billion 54 136,738 39.7% 16.8% (1.8%) 7.6% 11.8% 75.8%
$250 million – $1 billion 31 19,675 22.8% 2.4% 0.1% 1.6% 7.2% 90.8%
$100 million – $250 million 7 1,271 5.1% 0.2% (2.4%) (9.0%) (9.8%) 44.0%
< $100 million 13 574 9.6% 0.1% (24.4%) (39.1%) (38.5%) (22.3%)
Total / Median ($MM) 136 $815,492 100.0% 100.0% (2.4%) 1.6% 5.6% 75.8%
Source: Capital IQ
MARKET INDICES Value at 11/30/15
% Change
3 mo YTD 12 mo 36 mo
Dow Jones Industrial Average 17,720 6.5% (0.6%) (0.6%) 36.0%
S&P 500 Index 2,080.4 4.6% 1.0% 0.6% 46.9%
NASDAQ Composite Index 5,108.7 5.8% 7.9% 6.6% 69.7%
Russell 2000 Index 1,198.1 3.0% (0.5%) 2.1% 45.8%
AMEX Sector Index – Healthcare 94.5 4.4% (5.8%) (5.8%) 15.7%
S&P Healthcare Facilities (Sub Ind) Index 363.0 (20.4%) (13.9%) (6.9%) 94.2%
S&P Healthcare Providers & Services (Industry) Index 607.8 (12.6%) 0.6% 4.7% 102.2%
S&P Managed Healthcare (Sub Ind) Index 405.3 (8.8%) 10.6% 17.7% 125.5%
S&P Healthcare Services 494.2 2.6% 20.3% 27.8% 79.0% Source: Capital IQ
Performance of Market Indices for Latest 36 months
11/30/12 2/28/13 5/31/13 8/31/13 11/30/13 2/28/14 5/31/14 8/31/14 11/30/14 2/28/15 5/31/15 8/31/15 11/30/15
S&P 500 Index NASDAQ Composite Index Russell 2000 Index S&P Healthcare Services Dow Jones Industrial Average
80
100
120
140
160
200
180
INTEREST RATES Value at 11/30/15 1 mo ago 3 mo ago 12 mo ago
LIBOR – USD – 6 months 0.66% 0.55% 0.53% 0.33%
U.S. Treasury – 2 years 0.94% 0.75% 0.72% 0.47%
U.S. Treasury – 5 years 1.66% 1.52% 1.53% 1.50%
U.S. Treasury – 10 years 2.22% 2.15% 2.19% 2.19%
U.S. Treasury – 30 years 2.99% 2.94% 2.91% 2.91%
U.S. Prime Rate 3.25% 3.25% 3.25% 3.25%
Acute Care HospitalsSkilled NursingDiagnostic ImagingEmergency ServicesHealthcare StaffingManaged Care – GovernmentCare Management/TPAConsumer Directed Health & WellnessPsychiatric HospitalsPhysician Practice MgmtPharmacy ManagementManaged Care – CommercialSurgicenters/RehabilitationOther ServicesClinical LaboratoriesHealthcare REITsContract Research OrgsDialysis ServicesHCITDistribution/SupplyS&P 500 IndexHome Care/HospiceAssisted/Independent LivingSpecialty Managed Care
(25%) (20%) (15%) (10%) (5%) 0% 5% 10% 15% 20%
Source: Capital IQ
Duff & Phelps 4
Source: Capital IQ
Source: Capital IQ
($ in millions, except per share amounts)
Company Name TickerPrice
11/30/15
% Change 52-WeekMarket
CapEnt Val (TEV)
LTM EPS LTM Multiples Earnings Ratio PEG Ratio 2015E3 mo 12 mo High Low Rev EBITDA 2014 2015E Rev EBITDA LTM 2015E
Acute Care Hospitals
Community Health Systems, Inc. CYH $28.94 (47.4%) (38.5%) $65.00 $25.36 $3,420 $20,827 $19,557.0 $2,806.0 $1.32 $3.49 1.06x 7.4x 8.4x 8.3x 0.73x
HCA Holdings, Inc. HCA 68.06 (23.4%) (2.3%) 95.49 43.91 27,746 58,494 39,065.0 7,691.0 4.16 5.22 1.50x 7.6x 14.2x 13.0x 1.23x
LifePoint Health, Inc. LPNT 71.61 (10.6%) 3.5% 88.18 58.61 3,117 5,154 5,106.5 649.9 2.69 4.02 1.01x 7.9x 21.9x 17.8x 2.28x
Tenet Healthcare Corp. THC 33.19 (34.0%) (30.9%) 60.93 26.62 3,308 19,510 18,085.0 2,270.0 0.34 2.05 1.08x 8.6x NM 16.2x 1.94x
Universal Health Services Inc. UHS 121.52 (13.4%) 16.2% 148.57 101.20 11,966 15,336 8,764.7 1,653.7 5.42 6.87 1.75x 9.3x 18.1x 17.7x 1.72x
Median (23.4%) (2.3%) 1.08x 7.9x 16.1x 16.2x 1.72x
Assisted / Independent Living
Brookdale Senior Living Inc. BKD $22.48 (18.9%) (36.5%) $39.89 $20.27 $4,148 $10,563 $4,239.8 $809.3 ($1.01) ($1.27) 2.49x 13.1x NM NM NM
Capital Senior Living Corp. CSU 22.92 8.5% (9.9%) 27.75 19.20 677 1,394 404.1 71.4 (0.83) 0.05 3.45x 19.5x NM NM NM
Five Star Quality Care Inc. FVE 3.59 6.2% (18.4%) 5.07 2.74 176 221 1,117.8 19.5 (1.65) (0.04) 0.20x 11.3x NM NM NM
Median 6.2% (18.4%) 2.49x 13.1x NM NM NM
Care Management / TPA
Alere Inc. ALR $41.27 (21.8%) 3.5% $55.99 $35.81 $3,560 $7,293 $2,496.4 $552.0 ($2.38) $2.23 2.92x 13.2x NM 18.5x 1.01x
Care.com, Inc. CRCM 6.90 17.5% (18.8%) 8.50 4.89 222 162 143.2 (19.7) (2.77) (0.57) 1.13x NM NM NM NM
CorVel Corporation CRVL 38.75 25.4% 11.8% 39.87 29.27 763 738 495.9 63.2 1.49 NM 1.49x 11.7x 28.8x NM NM
Crawford & Company CRD.B 5.98 (8.8%) (33.3%) 11.00 4.86 316 529 1,171.0 83.1 0.55 0.38 0.45x 6.4x 35.1x 15.9x 1.59x
ExamWorks Group, Inc. EXAM 26.42 (26.7%) (32.9%) 44.33 21.98 1,109 1,520 813.2 111.7 0.25 0.08 1.87x 13.6x NM NM NM
Hooper Holmes Inc. HH 0.13 (7.5%) (76.5%) 0.63 0.11 10 14 29.3 (6.1) (0.08) NM 0.47x NM NM NM NM
MAXIMUS, Inc. MMS 56.75 (8.6%) 8.3% 70.00 47.95 3,708 3,847 2,099.8 310.9 2.25 2.24 1.83x 12.4x 24.1x 25.4x 1.42x
Median (8.6%) (18.8%) 1.49x 12.4x 28.8x 18.5x 1.42x
Healthcare Services Sector Update
Duff & Phelps 5
Source: Capital IQ as of November 30, 2015; For definitions, see page 12
Healthcare Services Sector Update
($ in millions, except per share amounts)
Company Name TickerPrice
11/30/15
% Change 52-WeekMarket
CapEnt Val (TEV)
LTM EPS LTM Multiples Earnings Ratio PEG Ratio 2015E3 mo 12 mo High Low Rev EBITDA 2014 2015E Rev EBITDA LTM 2015E
Clinical Laboratories
Invitae Corporation NVTA $7.69 (29.3%) NM $22.35 $6.46 $246 $107 $6.1 ($76.0) ($56.14) ($3.11) 17.51x NM NM NM NM
Laboratory Corp. of America Holdings
LH 121.54 1.6% 16.2% 131.19 99.89 12,300 18,284 7,773.6 1,567.3 5.91 7.89 2.35x 11.7x 26.5x 15.4x 1.33x
Psychemedics Corp. PMD 11.60 4.5% (23.1%) 17.83 9.50 63 67 27.6 3.5 0.60 NM 2.44x 19.5x 31.2x NM NM
Quest Diagnostics Inc. DGX 68.32 (0.8%) 4.6% 89.00 60.07 9,794 13,503 7,527.0 1,489.0 3.78 4.76 1.79x 9.1x 14.1x 14.4x 1.51x
Sonic Healthcare Limited SHL 14.71 (1.4%) (1.1%) 17.18 12.37 6,080 7,548 3,232.8 514.8 0.77 0.74 2.33x 14.7x 23.6x 20.0x 2.08x
Median (0.8%) 1.7% 2.35x 13.2x 25.1x 15.4x 1.51x
Consumer Directed Health & Wellness
Benefitfocus, Inc. BNFT $40.52 11.5% 49.6% $47.49 $19.58 $1,181 $1,146 $171.0 ($47.0) ($2.51) ($1.93) 6.70x NM NM NM NM
Castlight Health, Inc. CSLT 4.00 (27.3%) (67.8%) 13.44 3.59 379 231 68.5 (79.1) (1.16) (0.70) 3.38x NM NM NM NM
Connecture, Inc. CNXR 3.57 (48.5%) NM 14.39 3.35 78 120 94.5 4.8 (10.27) (0.26) 1.27x 24.9x NM NM NM
Everyday Health, Inc. EVDY 6.15 (36.0%) (52.5%) 15.21 5.34 199 276 213.3 19.9 0.17 0.69 1.29x 13.9x NM 9.0x 0.60x
Fitbit Inc. FIT 28.72 (15.0%) NM 51.90 26.46 6,439 5,863 1,516.6 319.4 0.63 0.97 3.87x 18.4x 48.3x 29.6x 0.95x
HealthEquity, Inc. HQY 33.00 11.8% 32.9% 35.78 16.11 1,888 1,739 115.8 31.3 0.21 0.30 15.02x 55.7x NM NM NM
Healthways Inc. HWAY 13.27 11.0% (14.8%) 23.30 9.93 478 730 783.5 51.8 (0.16) 0.11 0.93x 14.1x NM NM NM
IMS Health Holdings, Inc. IMS 27.72 (8.2%) 10.9% 33.52 24.47 9,109 13,003 2,787.0 723.0 (0.59) 1.47 4.67x 18.0x 23.6x 18.9x 1.86x
WebMD Health Corp. WBMD 45.49 9.5% 24.5% 48.91 36.31 1,678 1,868 607.0 128.6 0.97 1.56 3.08x 14.5x 36.3x 29.3x 2.34x
Median (8.2%) 10.9% 3.38x 18.0x 36.3x 24.1x 1.40x
Contract Research Orgs
Albany Molecular Research Inc. AMRI $19.92 (3.3%) 22.4% $22.48 $13.73 $707 $987 $362.5 $44.3 ($0.10) $0.93 2.72x 22.3x NM 21.5x 1.40x
Charles River Laboratories International, Inc.
CRL 76.57 8.8% 18.3% 84.69 59.99 3,570 4,362 1,339.0 305.9 2.70 3.71 3.26x 14.3x 25.0x 20.6x 1.81x
ICON Public Limited Company ICLR 74.33 (4.7%) 33.8% 84.14 49.75 4,254 4,287 1,561.7 323.5 2.73 3.94 2.75x 13.3x 20.8x 18.9x 1.13x
INC Research Holdings, Inc. INCR 47.30 12.6% 93.9% 51.69 22.17 2,672 3,011 887.1 198.3 (0.51) 1.94 3.39x 15.2x NM 24.3x 0.82x
PAREXEL International Corporation
PRXL 67.85 0.5% 16.0% 76.17 52.19 3,612 3,937 2,036.4 301.3 2.67 2.87 1.93x 13.1x 27.9x 23.7x 1.35x
PRA Health Sciences, Inc. PRAH 45.28 19.9% 107.3% 46.41 21.01 2,727 3,609 1,337.3 215.1 (0.83) 1.91 2.70x 16.8x NM 23.7x 1.04x
Quintiles Transnational Holdings Inc. Q 67.99 (9.6%) 17.6% 80.45 56.12 8,369 10,001 4,261.9 781.5 2.72 3.31 2.35x 12.8x 23.2x 20.6x 1.63x
Median 0.5% 22.4% 2.72x 14.3x 24.1x 21.5x 1.35x
Duff & Phelps 6
Source: Capital IQ as of November 30, 2015; For definitions, see page 12
($ in millions, except per share amounts)
Company Name TickerPrice
11/30/15
% Change 52-WeekMarket
CapEnt Val (TEV)
LTM EPS LTM Multiples Earnings Ratio PEG Ratio 2015E3 mo 12 mo High Low Rev EBITDA 2014 2015E Rev EBITDA LTM 2015E
Diagnostic Imaging
Alliance Healthcare Services, Inc. AIQ $9.01 (37.2%) (60.0%) $25.33 $6.73 $95 $693 $458.4 $115.5 $0.98 NM 1.51x 6.0x 10.9x NM NM
American Shared Hospital Services
AMS 1.86 (12.7%) (26.7%) 3.05 1.57 10 38 16.4 9.1 (0.19) NM 2.30x 4.1x NM NM NM
RadNet, Inc. RDNT 6.20 2.6% (26.4%) 9.99 5.19 286 900 779.5 102.3 0.03 NM 1.15x 8.8x 26.4x NM NM
Median (12.7%) (26.7%) 1.51x 6.0x 18.6x NM NM
Dialysis Services
DaVita HealthCare Partners Inc. DVA $73.04 (4.3%) (4.6%) $85.17 $70.12 $15,412 $23,738 $13,565.0 $2,485.9 $3.33 $3.77 1.75x 9.5x 32.9x 19.4x 1.54x
Fresenius Medical Care AG & Co. KGAA
FME 82.46 7.6% 11.9% 87.96 61.06 25,135 34,648 17,125.3 3,025.3 3.45 3.54 2.02x 11.5x 25.3x 23.3x 1.97x
Median 1.7% 3.7% 1.89x 10.5x 29.1x 21.4x 1.76x
Distribution / Supply
Aceto Corp. ACET $28.21 23.9% 34.3% $32.20 $18.03 $832 $910 $549.6 $72.4 $0.78 $1.40 1.65x 12.6x 21.9x 20.1x 0.89x
AmerisourceBergen Corporation ABC 98.64 (2.2%) 8.3% 120.68 89.26 20,284 21,558 135,961.8 1,546.9 0.15 5.07 0.16x 13.9x NM 19.4x 1.38x
Cardinal Health, Inc. CAH 86.85 4.1% 5.7% 91.91 74.76 28,572 31,289 106,516.0 2,842.0 3.24 4.83 0.29x 11.0x 21.8x 18.0x 1.43x
Henry Schein, Inc. HSIC 156.48 12.3% 14.1% 157.46 126.17 12,976 14,301 10,480.9 917.2 5.44 5.94 1.36x 15.6x 27.4x 26.4x 2.53x
McKesson Corporation MCK 189.35 (5.7%) (10.2%) 243.61 160.10 43,571 49,095 187,716.0 4,213.0 7.53 12.57 0.26x 11.7x 21.3x 15.1x 1.17x
Owens & Minor Inc. OMI 38.51 13.3% 12.6% 39.29 31.89 2,422 2,871 9,776.8 269.8 1.06 1.93 0.29x 10.6x 28.3x 19.9x 2.92x
Patterson Companies, Inc. PDCO 45.57 (1.8%) (5.4%) 53.07 42.62 4,592 5,627 4,989.9 454.3 2.02 2.37 1.13x 12.4x 22.0x 19.2x 2.57x
Median 4.1% 8.3% 0.29x 12.4x 21.9x 19.4x 1.43x
Emergency Services
Adeptus Health Inc. ADPT $60.09 (39.9%) 97.4% $123.97 $30.12 $857 $1,026 $329.3 $36.9 ($0.34) $1.29 3.12x 27.8x NM 46.8x 0.90x
Air Methods Corp. AIRM 43.70 15.4% (1.5%) 54.98 32.81 1,718 2,392 1,062.4 284.5 2.56 2.84 2.25x 8.4x 15.8x 15.4x 0.92x
Median (12.2%) 47.9% 2.68x 18.1x 15.8x 31.1x 0.91x
Healthcare Services Sector Update
Duff & Phelps 7
Source: Capital IQ as of November 30, 2015; For definitions, see page 12
($ in millions, except per share amounts)
Company Name TickerPrice
11/30/15
% Change 52-WeekMarket
CapEnt Val (TEV)
LTM EPS LTM Multiples Earnings Ratio PEG Ratio 2015E3 mo 12 mo High Low Rev EBITDA 2014 2015E Rev EBITDA LTM 2015E
HCIT
Allscripts Healthcare Solutions, Inc. MDRX $15.23 10.4% 26.7% $15.41 $11.33 $2,879 $3,453 $1,381.6 $98.2 ($0.37) $0.5x 2.50x 35.2x NM 32.8x 1.68x
athenahealth, Inc. ATHN 167.75 23.6% 43.0% 170.22 110.68 6,514 6,696 880.4 68.3 (0.08) 1.32 7.61x 98.0x NM NM NM
Cerner Corporation CERN 59.60 (5.6%) (7.5%) 75.72 55.82 20,389 20,556 4,103.4 1,133.0 1.50 2.07 5.01x 18.1x 40.3x 28.8x 1.78x
Computer Programs & Systems Inc. CPSI 48.72 6.8% (17.1%) 62.98 36.04 551 512 184.2 35.3 2.94 1.93 2.78x 14.5x 25.4x 25.3x 1.72x
Healthstream Inc. HSTM 24.02 (5.3%) (16.2%) 32.41 20.89 760 615 198.5 32.4 0.37 0.37 3.10x 19.0x NM 64.5x 3.72x
HMS Holdings Corp. HMSY 12.13 15.9% (41.9%) 23.31 8.11 1,043 1,096 457.9 84.9 0.16 0.55 2.39x 12.9x NM 21.9x 1.14x
Inovalon Holdings, Inc. INOV 18.56 (14.6%) NM 33.75 16.52 2,800 2,372 406.6 136.8 0.49 0.50 5.83x 17.3x 41.3x 36.8x 1.63x
MedAssets, Inc. MDAS 30.13 42.1% 55.8% 31.24 17.00 1,788 2,586 764.2 217.8 (0.34) 1.30 3.38x 11.9x NM 23.1x 2.10x
Medical Transcription Billing, Corp. MTBC 1.28 (38.8%) (58.2%) 3.26 1.19 14 18 24.8 (1.7) (0.64) (0.64) 0.74x NM NM NM NM
Medidata Solutions, Inc. MDSO 45.83 (5.8%) 7.3% 61.31 35.81 2,538 2,500 382.8 40.1 0.11 0.87 6.53x 62.3x NM 52.7x 2.37x
National Research Corp. NRCI.B 34.00 6.3% 0.6% 39.30 27.54 441 410 101.1 29.3 0.74 0.70 4.05x 14.0x NM 48.6x 4.05x
Premier, Inc. PINC 34.36 (4.4%) 1.0% 39.81 30.94 1,498 5,493 1,048.6 340.4 17.95 1.51 5.24x 16.1x NM 22.7x 1.93x
Press Ganey Holdings, Inc. PGND 32.29 2.0% NM 36.15 0.00 1,702 1,871 309.2 28.5 0.36 0.92 6.05x 65.8x NM 35.1x 2.40x
Quality Systems Inc. QSII 16.25 20.5% 10.3% 18.75 12.00 989 878 499.3 57.2 0.36 0.73 1.76x 15.4x 30.7x 22.2x 2.12x
Rennova Health, Inc. RNVA 3.62 NM NM 6.40 2.10 50 61 57.7 (6.6) 0.09 NM 1.07x NM NM NM NM
Streamline Health Solutions, Inc. STRM 1.80 (27.1%) (55.9%) 4.38 1.02 34 45 28.2 (7.4) (0.71) (0.35) 1.58x NM NM NM NM
Teladoc, Inc. TDOC 21.25 (23.3%) NM 35.42 0.00 817 692 67.7 (43.0) (10.25) (1.74) 10.23x NM NM NM NM
The Advisory Board Company ABCO 53.84 8.5% 26.4% 60.38 37.47 2,256 2,759 722.3 76.2 (0.07) 1.35 3.82x 36.2x NM 39.9x 2.42x
Median 2.0% 0.8% 3.60x 17.7x 35.5x 32.8x 2.10x
Healthcare Services Sector Update
Duff & Phelps 8
Source: Capital IQ as of November 30, 2015; For definitions, see page 12
($ in millions, except per share amounts)
Company Name TickerPrice
11/30/15
% Change 52-WeekMarket
CapEnt Val (TEV)
LTM EPS LTM Multiples Earnings Ratio PEG Ratio 2015E3 mo 12 mo High Low Rev EBITDA 2014 2015E Rev EBITDA LTM 2015E
Healthcare REITs
Care Capital Properties, Inc. CCP $31.65 (3.2%) NM $37.68 $29.73 $2,652 $4,165 $311.5 $289.4 NM $1.53 13.37x 14.4x 17.9x 20.7x 4.14x
CareTrust REIT, Inc. CTRE 11.16 (1.4%) (31.0%) 18.49 10.21 537 926 68.4 53.1 (0.36) 0.23 13.54x 17.4x NM 48.5x NM
Community Healthcare Trust Incorporated
CHCT 18.72 3.9% NM 20.49 0.00 142 126 18.7 – 1.13 (0.19) 6.73x NA 16.6x NM NM
HCP, Inc. HCP 35.53 (5.8%) (20.7%) 49.61 32.71 16,523 27,848 2,479.8 1,791.8 1.94 1.22 11.23x 15.5x NM 29.1x 8.70x
Healthcare Realty Trust Incorporated
HR 27.19 16.1% 3.0% 31.20 22.01 2,736 4,109 384.7 226.8 0.35 0.62 10.68x 18.1x NM 44.2x 8.11x
Healthcare Trust of America, Inc. HTA 26.11 6.7% 2.3% 30.28 22.35 3,317 4,918 396.8 249.1 0.37 0.26 12.39x 19.7x NM NM NM
LTC Properties Inc. LTC 42.63 2.8% 2.0% 48.85 38.64 1,516 2,061 130.2 114.7 1.99 2.02 15.83x 18.0x 21.0x 21.2x 4.15x
Medical Properties Trust Inc. MPW 12.01 0.8% (13.3%) 15.62 10.59 2,856 5,897 395.4 270.9 0.29 0.65 14.92x 21.8x 25.7x 18.4x 1.68x
National Health Investors Inc. NHI 60.39 6.7% (8.9%) 76.98 53.64 2,269 3,283 215.1 204.9 3.04 3.35 15.27x 16.0x 18.2x 18.0x 3.20x
Newcastle Investment Corp. NCT 4.35 (11.8%) (11.4%) 5.49 4.00 289 1,297 401.4 106.3 1.00 0.56 3.23x 12.2x 22.0x 7.8x NM
New Senior Investment Group Inc. SNR 9.23 (20.4%) (47.7%) 18.00 8.56 799 2,769 340.4 145.8 (0.70) (1.03) 8.13x 19.0x NM NM NM
Omega Healthcare Investors Inc. OHI 34.44 0.3% (9.9%) 45.46 31.56 6,442 11,037 664.4 617.1 1.74 1.36 16.61x 17.9x 24.8x 25.4x 4.87x
Physicians Realty Trust DOC 16.01 9.7% 3.6% 18.12 13.86 1,396 2,019 108.6 71.4 (0.12) 0.18 18.59x 28.3x NM 91.1x 9.64x
Sabra Health Care REIT, Inc. SBRA 20.68 (16.5%) (27.0%) 34.44 18.16 1,347 2,650 227.8 198.2 0.78 1.00 11.63x 13.4x 18.8x 20.6x 4.06x
Senior Housing Properties Trust SNH 14.45 (9.7%) (35.9%) 23.83 13.72 3,431 6,872 961.1 544.1 0.81 0.71 7.15x 12.6x 19.7x 20.4x 4.26x
Universal Health Realty Income Trust
UHT 52.69 11.4% 9.0% 57.55 42.81 702 929 66.3 45.1 3.99 NM 14.00x 20.6x 19.6x NM NM
Ventas, Inc. VTR 53.34 (5.9%) (25.5%) 81.93 49.31 17,761 29,224 3,470.1 1,880.9 1.59 1.74 8.42x 15.5x 37.3x 30.7x 7.40x
Welltower Inc. HCN 63.19 (2.9%) (14.2%) 84.88 58.19 22,362 35,200 3,627.4 1,832.6 1.43 2.03 9.70x 19.2x 24.8x 31.1x 6.45x
Median (0.6%) (12.4%) 12.01x 17.9x 20.3x 23.3x 4.57x
Healthcare Staffing
AMN Healthcare Services Inc. AHS $29.50 (13.0%) 72.3% $37.47 $16.68 $1,407 $1,610 $1,340.2 $134.8 $0.69 $1.50 1.20x 11.9x 20.1x 19.7x 1.40x
Cross Country Healthcare, Inc. CCRN 18.25 29.1% 71.0% 18.76 9.36 594 642 762.4 30.6 (1.02) 0.53 0.84x 21.0x NM 34.1x 1.86x
Envision Healthcare Holdings, Inc. EVHC 27.50 (34.4%) (22.2%) 45.95 20.33 5,135 7,274 5,123.9 577.9 0.66 1.27 1.42x 12.6x 34.4x 21.7x 1.26x
Team Health Holdings, Inc. TMH 55.14 (7.8%) (3.5%) 70.21 45.45 4,002 4,743 3,408.3 337.7 1.35 2.63 1.39x 14.0x 37.2x 21.0x 1.41x
Median (10.4%) 33.8% 1.30x 13.3x 34.4x 21.3x 1.41x
Healthcare Services Sector Update
Duff & Phelps 9
Source: Capital IQ as of November 30, 2015; For definitions, see page 12
($ in millions, except per share amounts)
Company Name TickerPrice
11/30/15
% Change 52-WeekMarket
CapEnt Val (TEV)
LTM EPS LTM Multiples Earnings Ratio PEG Ratio 2015E3 mo 12 mo High Low Rev EBITDA 2014 2015E Rev EBITDA LTM 2015E
Home Care / Hospice
Addus HomeCare Corporation ADUS $22.79 (20.6%) (1.3%) $38.08 $18.75 $251 $240 $334.7 $23.9 $1.08 $1.09 0.72x 10.0x 21.3x 21.0x 1.40x
Almost Family Inc. AFAM 42.37 (6.7%) 53.5% 50.48 27.64 416 505 511.8 36.7 1.47 2.10 0.99x 13.8x 18.6x 20.2x 1.84x
Amedisys Inc. AMED 40.59 3.8% 59.7% 48.34 24.81 1,368 1,411 1,230.4 89.1 0.40 1.43 1.15x 15.8x NM 28.4x 1.89x
Chemed Corp. CHE 154.49 11.5% 40.3% 160.12 100.49 2,608 2,707 1,524.2 217.7 5.57 6.84 1.78x 12.4x 24.4x 22.6x 2.26x
LHC Group, Inc. LHCG 46.55 7.1% 98.0% 51.83 23.51 837 883 771.8 77.5 1.26 1.85 1.14x 11.4x 27.1x 25.1x 1.67x
Providence Service Corp. PRSC 48.42 5.6% 23.7% 56.92 35.30 744 1,198 1,983.8 111.7 1.35 1.87 0.60x 10.7x NM 26.0x 1.62x
Median 4.7% 46.9% 1.07x 11.9x 22.9x 23.8x 1.76x
Skilled Nursing
AdCare Health Systems, Inc. ADK $3.01 (12.2%) (24.0%) $4.50 $2.90 $60 $227 $203.3 $22.5 ($0.82) NM 1.12x 10.1x NM NM NM
Diversicare Healthcare Services Inc.
DVCR 8.69 (21.4%) (13.0%) 17.15 8.14 54 108 383.4 22.6 0.20 NM 0.28x 4.8x 24.9x NM NM
Genesis Healthcare, Inc. GEN 4.88 (31.7%) NM 9.32 4.05 749 5,655 5,278.1 469.7 (4.81) 0.36 1.07x 12.0x NM NM NM
Kindred Healthcare Inc. KND 13.35 (35.3%) (32.9%) 24.66 11.12 1,119 4,253 6,538.6 504.0 (0.24) 1.23 0.65x 8.4x NM 10.8x 0.83x
National HealthCare Corporation NHC 69.10 13.4% 14.7% 69.40 58.96 1,030 1,062 899.1 106.2 3.14 NM 1.18x 10.0x 22.3x NM NM
The Ensign Group, Inc. ENSG 47.57 0.8% 20.7% 54.08 38.44 1,220 1,244 1,245.5 104.8 1.56 2.55 1.00x 11.9x 22.5x 18.7x 1.25x
Median (16.8%) (13.0%) 1.04x 10.1x 22.5x 14.8x 1.04x
Managed Care – Commercial
Aetna Inc. AET $102.75 (12.1%) 17.8% $134.40 $85.62 $35,829 $41,934 $59,949.6 $5,221.5 $5.68 $7.56 0.70x 8.0x 15.8x 13.6x 1.25x
Anthem, Inc. ANTM 130.38 (7.2%) 1.9% 173.59 121.22 34,038 50,269 77,952.9 6,324.7 8.96 10.19 0.64x 7.9x 12.5x 12.8x 1.16x
Cigna Corp. CI 134.98 (2.1%) 31.2% 170.68 99.88 34,771 37,675 37,276.0 3,991.0 7.83 8.58 1.01x 9.4x 16.5x 15.7x 1.26x
Health Net, Inc. HNT 63.26 (2.4%) 23.1% 76.67 49.60 4,890 4,526 15,965.6 427.4 1.80 3.32 0.28x 10.6x 32.4x 19.1x 0.83x
Humana Inc. HUM 168.66 (8.3%) 22.2% 219.79 137.18 24,999 27,531 53,256.0 2,697.0 7.36 7.75 0.52x 10.2x 19.4x 21.8x 1.66x
UnitedHealth Group Incorporated UNH 112.71 (3.9%) 14.3% 126.21 95.00 107,425 132,804 146,941.0 12,486.0 5.70 6.04 0.90x 10.6x 17.9x 18.7x 1.56x
Universal American Corp UAM 7.48 4.3% (15.0%) 11.16 6.52 604 473 1,936.0 18.2 (0.35) (0.05) 0.24x NM NM NM NM
Median (3.9%) 17.8% 0.64x 9.8x 17.2x 17.2x 1.26x
Managed Care – Government
Centene Corp. CNC $57.75 (7.6%) 16.9% $83.00 $48.16 $6,884 $6,658 $19,854.0 $853.0 $2.23 $2.88 0.34x 7.8x 20.2x 20.1x 1.20x
Molina Healthcare, Inc. MOH 60.26 (21.0%) 17.9% 82.37 49.37 3,380 2,143 12,728.0 489.9 1.30 2.68 0.17x 4.4x 21.8x 22.5x 0.61x
WellCare Health Plans, Inc. WCG 82.48 (9.7%) 11.9% 98.79 71.40 3,638 3,427 13,808.2 447.8 1.44 3.44 0.25x 7.7x 32.3x 24.0x 0.77x
Median (9.7%) 16.9% 0.25x 7.7x 21.8x 22.5x 0.77x
Healthcare Services Sector Update
Duff & Phelps 10
Source: Capital IQ as of November 30, 2015; For definitions, see page 12
Duff & Phelps 11
Source: Capital IQ as of November 30, 2015; For definitions, see page 12
($ in millions, except per share amounts)
Company Name TickerPrice
11/30/15
% Change 52-WeekMarket
CapEnt Val (TEV)
LTM EPS LTM Multiples Earnings Ratio PEG Ratio 2015E3 mo 12 mo High Low Rev EBITDA 2014 2015E Rev EBITDA LTM 2015E
Other Services
Healthcare Services Group Inc. HCSG $36.94 10.9% 22.5% $38.49 $29.07 $2,658 $2,555 $1,412.4 $144.8 $0.31 $0.94 1.81x 17.6x 41.1x 39.3x 2.38x
PDI, Inc. PDII 0.79 (58.0%) (59.1%) 2.74 0.72 13 32 140.1 (14.9) (0.63) NM 0.23x NM NM NM NM
Sharps Compliance Corp. SMED 9.07 34.6% 108.0% 10.49 4.21 140 125 31.7 2.4 0.08 0.13 3.93x 51.5x NM 68.6x 2.57x
Stericycle, Inc. SRCL 120.72 (15.0%) (6.4%) 151.57 110.56 10,259 11,125 2,774.6 718.7 3.79 4.39 4.01x 15.5x 38.7x 27.5x 1.78x
Median (2.1%) 8.1% 2.87x 17.6x 39.9x 39.3x 2.38x
Pharmacy Management
BioScrip, Inc. BIOS $2.12 (13.8%) (67.3%) $7.01 $1.30 $146 $626 $1,039.6 ($30.2) ($2.09) ($0.30) 0.60x NM NM NM NM
Express Scripts Holding Company
ESRX 85.48 1.2% 2.8% 94.61 68.06 57,808 73,065 101,889.0 6,928.1 2.64 5.53 0.72x 10.5x 26.6x 15.5x 1.25x
Omnicell, Inc. OMCL 30.16 (11.5%) (6.3%) 40.80 26.08 1,069 1,011 475.8 67.4 0.83 1.32 2.12x 15.0x 34.3x 22.8x 1.29x
PharMerica Corporation PMC 34.02 2.8% 56.0% 36.96 19.42 1,036 1,333 2,031.3 133.5 0.22 1.64 0.66x 10.0x NM 20.8x 1.39x
Median (5.1%) (1.8%) 0.69x 10.5x 30.4x 20.8x 1.29x
Physician Practice Mgmt
Birner Dental Management Services Inc.
BDMS $12.65 0.1% (18.3%) $15.42 $12.05 $24 $34 $64.1 $4.2 ($0.50) NM 0.52x 8.0x NM NM NM
MEDNAX, Inc. MD 71.37 (12.5%) 9.0% 86.09 63.91 6,712 8,006 2,688.8 608.0 3.18 4.07 2.98x 13.2x 20.4x 17.5x 1.20x
Median (6.2%) (4.7%) 1.75x 10.6x 20.4x 17.5x 1.20x
Psychiatric Hospitals
AAC Holdings, Inc. AAC $24.54 9.1% (15.0%) $46.60 $15.09 $550 $657 $175.3 $32.4 $0.41 $0.91 NM 20.3x 40.6x 27.1x 1.35x
Acadia Healthcare Company, Inc. ACHC 69.01 (7.5%) 11.3% 85.62 54.41 4,947 7,039 1,594.1 341.8 1.50 2.22 NM 20.6x 45.4x 31.1x 1.30x
Magellan Health, Inc. MGLN 52.65 (8.0%) (14.0%) 73.00 45.40 1,314 1,387 4,311.1 208.1 2.90 3.12 0.32x 6.7x NM 16.9x 0.84x
Median (7.5%) (14.0%) 0.32x 20.3x 43.0x 27.1x 1.30x
Specialty Managed Care
Assurant Inc. AIZ $85.52 14.3% 26.5% $86.99 $59.73 $5,631 $5,309 $10,400.4 $374.2 $6.44 $6.91 0.51x 14.2x 47.9x 12.4x 1.84x
Triple-S Management Corporation GTS 26.44 23.7% 14.4% 27.07 17.34 666 533 2,706.1 80.3 2.41 1.32 0.20x 6.6x 10.8x 20.0x 3.58x
Median 19.0% 20.4% 0.35x 10.4x 29.3x 16.2x 2.71x
Healthcare Services Sector Update
Definitions
PEG Ratio: Price Earnings to Growth
EBITDA: Earnings Before Interest, Taxes, Depreciation, and Amortization
EPS: Earnings Per Share
Enterprise Value: Market Capitalization + Total Debt + Preferred Equity + Minority Interest – Cash and Short-Term Investments
LTM: Last Twelve Months
Duff & Phelps 12
Source: Capital IQ as of November 30, 2015
($ in millions, except per share amounts)
Company Name TickerPrice
11/30/15
% Change 52-WeekMarket
CapEnt Val (TEV)
LTM EPS LTM Multiples Earnings Ratio PEG Ratio 2015E3 mo 12 mo High Low Rev EBITDA 2014 2015E Rev EBITDA LTM 2015E
Surgicenters / Rehabilitation
AmSurg Corp. AMSG $84.06 5.0% 63.0% $87.42 $48.49 $4,073 $6,955 $2,444.4 $648.8 $1.27 $3.59 2.85x 10.7x 34.7x 23.4x 1.48x
Civitas Solutions, Inc. CIVI 26.21 8.4% 53.0% 27.85 14.08 972 1,605 1,343.1 142.7 (0.71) 0.66 1.19x 11.2x NM 39.8x 3.98x
Hanger, Inc. HGR 15.57 (12.7%) (27.4%) 26.79 13.27 535 1,070 1,060.7 158.9 1.61 1.89 1.01x 6.7x 9.4x 8.3x 0.57x
HEALTHSOUTH Corp. HLS 35.19 (18.8%) (14.4%) 48.37 32.55 3,218 5,514 2,857.2 652.6 2.24 2.05 1.93x 8.4x 19.1x 17.2x 1.35x
The Joint Corp. JYNT 5.64 (33.6%) (8.7%) 12.99 5.25 69 60 12.1 (5.5) (0.56) (0.90) 4.93x NM NM NM NM
Select Medical Holdings Corporation
SEM 12.07 (7.1%) (16.4%) 17.20 10.07 1,583 4,241 3,419.8 363.0 0.91 0.86 1.24x 11.7x 12.5x 14.1x 1.41x
Surgery Partners, Inc. SGRY 19.11 NM NM 20.00 16.26 920 2,740 855.1 205.2 NM 0.20 3.20x 13.4x NM NM NM
Surgical Care Affiliates, Inc. SCAI 37.17 1.1% 16.9% 40.99 27.88 1,471 2,583 975.5 252.4 1.03 2.04 2.65x 10.2x 11.2x 18.2x 1.99x
US Physical Therapy Inc. USPH 52.84 11.4% 35.9% 56.37 38.17 656 721 319.8 53.7 1.62 1.79 2.25x 13.4x 31.2x 29.6x 1.85x
Median (3.0%) 4.1% 2.25x 11.0x 15.8x 18.2x 1.48x
Healthcare Services Sector Update

Median % Change — 3 months
Performance of Market Indices for Latest 36 months
2/28/13 5/31/13 8/31/13 2/28/1411/30/13 5/31/14 8/31/14 11/30/14 2/28/15 5/31/15 8/31/15 11/30/15
Dow Jones Industrial Average S&P 500 Index Russell 2000 Index
S&P 500 – Pharmaceuticals, Biotechnology & Life Sciences (Industry Group)
80
100
120
140
160
180
200
10/30/12
NASDAQ Composite Index
INTEREST RATES Value at 11/30/15 1 mo ago 3 mo ago 12 mo ago
LIBOR – USD – 6 months 0.66% 0.55% 0.53% 0.33%
U.S. Treasury – 2 years 0.94% 0.75% 0.72% 0.47%
U.S. Treasury – 5 years 1.66% 1.52% 1.53% 1.50%
U.S. Treasury – 10 years 2.22% 2.15% 2.19% 2.19%
U.S. Treasury – 30 years 2.99% 2.94% 2.91% 2.91%
U.S. Prime Rate 3.25% 3.25% 3.25% 3.25%
CAPITALIZATION PROFILENo. of Cos.
Ag. Eqty Mkt.
Value
% Total No. of Cos.
% Ag. Eqty Mkt.
Value
Average Stock Performance
3 mo YTD 12 mo 36 mo
> $5 billion 46 $2,226,849 19.7% 93.6% 1.1% 5.0% 3.9% 92.9%
$1 billion – $5 billion 52 116,551 22.2% 4.9% 7.5% 43.8% 50.3% 228.6%
$250 million – $1 billion 61 28,629 26.1% 1.2% 3.1% 10.3% 18.2% 63.9%
$100 million – $250 million 36 6,379 15.4% 0.3% (11.6%) (11.9%) (4.2%) 85.7%
< $100 million 39 1,924 16.7% 0.1% (21.5%) (29.6%) (32.1%) 49.0%
Total / Median ($MM) 234 $2,380,332 100.0% 100.0% 1.1% 5.0% 3.9% 85.7%
Source: Capital IQ
MARKET SECTORNo. of Cos.
Ag. Eqty Mkt.
Value
Median % Change LTM Multiples Earnings Ratio PEG Ratio 2015E3 mo 12 mo Rev EBITDA LTM 2015E
Biotechnology 84 $634,394 (4.3%) 5.6% 6.12x 11.8x 19.0x 22.6x 1.3x
Cardiology Devices 18 174,703 (11.1%) (7.6%) 3.37x 16.5x 36.8x 21.1x 1.9x
Conglomerates 5 465,307 8.6% (2.2%) 3.45x 12.5x 32.2x 20.5x 2.1x
Dental Devices 6 21,014 3.4% 20.0% 3.51x 20.2x 32.9x 29.8x 2.3x
Diagnostic Imaging Devices 4 12,665 31.0% 42.4% 1.64x 14.6x 19.6x 23.9x 2.1x
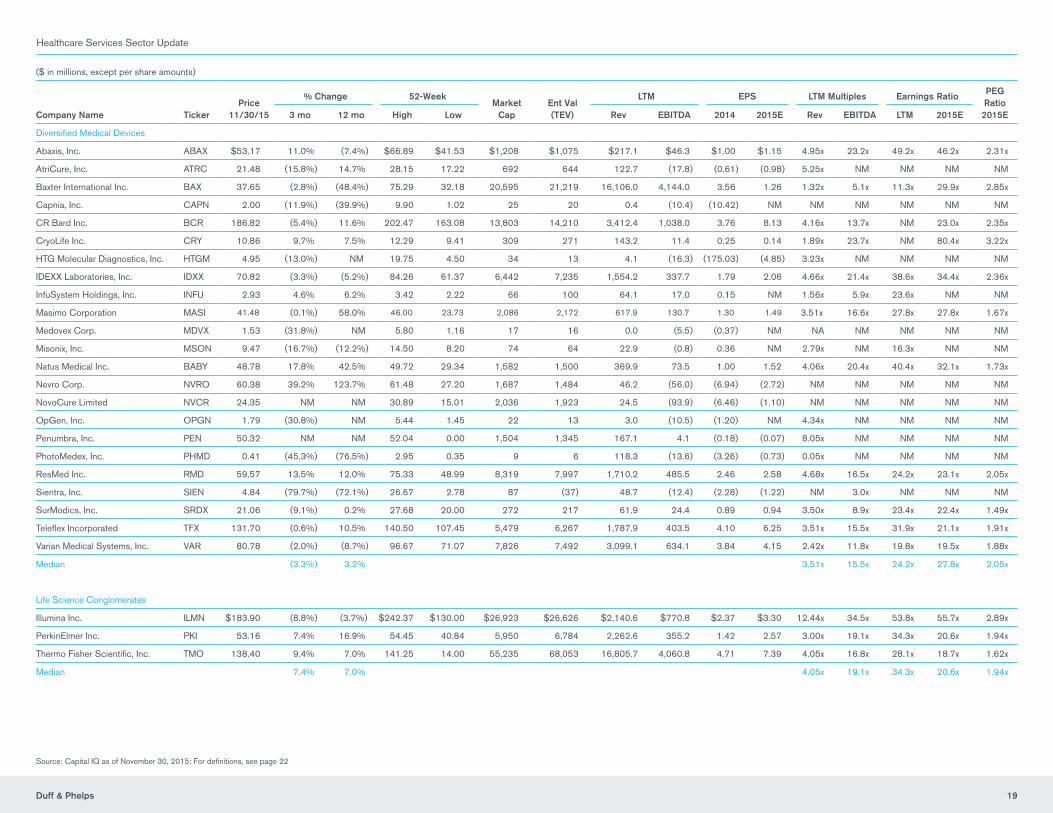
Diversified Medical Devices 23 74,176 (3.3%) 3.2% 3.51x 15.5x 24.2x 27.8x 2.0x
Infection Prevention Devices 1 2,697 29.9% 48.9% 4.90x 24.9x 56.4x 45.0x 2.5x
Lab Equipment 2 9,424 9.0% 7.8% 2.26x 13.1x 21.2x 26.6x 2.0x
Lab Instrumentation & Devices 4 14,797 (9.8%) (10.5%) 3.60x 16.7x 40.9x 23.5x 2.3x
Large-Cap Pharmaceuticals 6 674,951 (2.8%) (3.5%) 5.00x 12.9x 35.4x 15.0x 1.6x
Life Science Conglomerates 3 88,108 7.4% 7.0% 4.05x 19.1x 34.3x 20.6x 1.9x
Life Science Consumables 6 14,358 0.6% 10.0% 2.73x 15.0x 28.7x 26.2x 1.8x
Mobility Devices 4 4,117 (6.2%) 5.7% 1.92x 19.3x 62.1x 32.0x 1.1x
Neural Implant Devices 1 2,319 3.2% 27.4% 2.99x 14.1x NM 20.3x 1.7x
Ophthalmology Devices 5 7,475 (11.2%) 0.2% 3.37x 8.4x 11.0x 18.9x 1.2x
Orthopedics Devices 5 61,858 (3.2%) (3.1%) 3.69x 14.2x 31.4x 18.0x 1.9x
Pharmaceuticals 51 96,730 (7.2%) 8.7% 5.47x 17.6x 27.7x 27.0x 1.5x
Surgical Devices 6 21,239 (18.3%) (25.2%) 3.32x 11.1x 34.8x 26.9x 1.9x
Total / Median ($MM) 234 $2,380,332 (3.0%) 5.6% 3.48x 14.8x 32.2x 23.7x 1.9x
Surgical Devices
Ophthalmology Devices
Cardiology Devices
Lab Instrumentation & Devices
Pharmaceuticals
Mobility Devices
Biotechnology
Diversified Medical Devices
Orthopedics Devices
Large-Cap Pharmaceuticals
Life Science Consumables
Neural Implant Devices
Dental Devices
S&P 500 Index
Life Science Conglomerates
Conglomerates
Lab Equipment
Infection Prevention Devices
Diagnostic Imaging Devices
(20%) (15%) (10%) (5%) 0% 5% 10% 15% 20% 25% 30% 35%Source: Capital IQ
MARKET INDICES Value at 11/30/15
% Change
3 mo YTD 12 mo 36 mo
Dow Jones Industrial Average 17,719.9 6.5% (0.6%) (0.6%) 36.0%
S&P 500 Index 2,080.4 4.6% 1.0% 0.6% 46.9%
NASDAQ Composite Index 5,108.7 5.8% 7.9% 6.6% 69.7%
Russell 2000 Index 1,198.1 3.0% (0.5%) 2.1% 45.8%
S&P Life Science Tools & Services (Industry) Index 330.2 10.4% 11.3% 7.6% 87.7%
S&P 500 Pharmaceuticals (Industry) Index 598.2 0.9% 2.6% (0.0%) 58.7%
Dow Jones U.S. Pharmaceuticals & Biotechnology Index 701.2 (1.8%) 2.7% 0.4% 78.6%
S&P 500 Biotechnology (Industry) Index 3,830.3 (3.1%) 3.0% 1.1% 133.7%
Dow Jones U.S. Medical Equipment Index 982.7 1.4% 6.3% 6.0% 76.0%
S&P 500 – Pharmaceuticals, Biotechnology & Life Sciences (Industry Group)
785.3 (0.2%) 2.8% 0.4% 76.3%
Source: Capital IQ
Healthcare Services Sector Update
Duff & Phelps 13
Source: Capital IQ
Source: Capital IQ Source: Capital IQ
($ in millions, except per share amounts)
Company Name TickerPrice
11/30/15
% Change 52-WeekMarket
CapEnt Val (TEV)
LTM EPS LTM Multiples Earnings Ratio PEG Ratio 2015E3 mo 12 mo High Low Rev EBITDA 2014 2015E Rev EBITDA LTM 2015E
Biotechnology
Acceleron Pharma, Inc. XLRN $42.87 44.3% 10.7% $48.50 $20.00 $1,426 $1,310 $18.0 ($56.2) ($1.63) ($1.14) NM NM NM NM NM
Acorda Therapeutics, Inc. ACOR 38.19 16.7% 4.8% 45.45 25.50 1,648 1,620 479.6 69.6 0.42 0.99 3.38x 23.3x NM 38.7x 1.34x
Adamas Pharmaceuticals, Inc. ADMS 15.97 (22.5%) 8.7% 30.86 12.73 294 191 31.7 (24.0) 0.53 (3.24) 6.02x NM NM NM NM
Aduro BioTech, Inc. ADRO 30.99 50.4% NM 49.25 16.28 1,959 1,513 48.5 (17.1) (0.70) (1.05) NM NM NM NM NM
Advanced Accelerator Applications S.A.
AAAP 26.44 NM NM 28.08 18.00 1,020 982 88.7 1.0 (0.37) NM 11.07x NM NM NM NM
Affimed N.V. AFMD 7.46 (28.5%) (2.5%) 24.20 5.00 222 159 7.6 (24.5) (0.02) (0.81) 21.07x NM NM NM NM
Akebia Therapeutics, Inc. AKBA 10.73 53.3% (11.2%) 14.20 5.91 329 171 – (51.5) (8.04) (2.20) NA NM NM NM NM
Alexion Pharmaceuticals, Inc. ALXN 178.44 (0.2%) (8.4%) 208.88 142.02 40,207 42,398 2,502.7 902.8 3.26 4.97 16.94x 47.0x NM 35.9x 1.50x
Alkermes plc ALKS 73.36 16.2% 33.3% 75.99 52.29 11,008 10,590 640.4 (83.7) (0.21) NM 16.54x NM NM NM NM
Amarin Corporation plc AMRN 2.08 (6.7%) 61.2% 3.33 0.91 381 518 71.6 (99.0) (0.36) (0.44) 7.23x NM NM NM NM
Amgen Inc. AMGN 161.10 3.3% (2.5%) 181.81 130.09 121,522 122,163 21,457.0 10,357.0 6.70 10.08 5.69x 11.8x 19.2x 16.0x 1.69x
Ascendis Pharma A/S ASND 17.83 (7.0%) NM 23.81 14.75 448 305 10.0 (38.3) (9.04) (1.62) NM NM NM NM NM
Atara Biotherapeutics, Inc. ATRA 39.30 (2.3%) 45.6% 65.56 10.10 1,125 791 – (42.8) (5.62) (1.77) NA NM NM NM NM
Athersys, Inc. ATHX 1.10 (4.3%) (23.1%) 3.43 0.90 92 63 1.6 (27.4) (0.31) (0.24) NM NM NM NM NM
aTyr Pharma Inc. LIFE 8.51 (42.5%) NM 28.29 0.00 201 98 – (36.3) (29.69) (6.99) NA NM NM NM NM
Avalanche Biotechnologies, Inc. AAVL 10.48 (2.8%) (73.5%) 62.48 7.40 270 1 1.6 (43.5) (2.46) (1.70) 0.68x NM NM NM NM
Bellicum Pharmaceuticals, Inc. BLCM 23.03 32.8% NM 33.63 12.25 610 497 0.3 (37.4) (34.04) (1.63) NM NM NM NM NM
Bio Blast Pharma Ltd. ORPN 5.15 (13.0%) (25.4%) 8.85 3.92 73 50 – (13.8) (0.57) (0.99) NA NM NM NM NM
Biogen Inc. BIIB 286.86 (5.5%) (6.8%) 480.18 254.00 63,942 64,628 10,562.1 5,492.9 12.37 16.55 6.12x 11.8x 18.7x 17.3x 1.30x
BioSpecifics Technologies Corp. BSTC 48.45 (7.0%) 27.8% 72.07 35.16 335 304 21.3 13.7 0.66 NM 14.29x 22.2x 39.5x NM NM
Calithera Biosciences, Inc. CALA 7.94 37.4% (25.6%) 33.48 4.31 144 62 – (31.1) (4.67) (1.92) NA NM NM NM NM
Cara Therapeutics Inc. CARA 16.55 (14.0%) 79.1% 23.61 8.62 451 340 4.7 (19.0) (0.85) (0.98) NM NM NM NM NM
Catalyst Biosciences, Inc. CBIO 3.00 (66.7%) NM 21.60 2.50 34 32 2.3 (10.5) (0.69) NM 13.97x NM NM NM NM
Celgene Corporation CELG 109.45 (11.8%) (3.7%) 140.72 92.98 85,990 93,958 8,778.2 2,866.2 2.39 4.84 10.70x 32.8x 54.9x 22.6x 1.11x
Cepheid CPHD 35.94 (28.6%) (34.7%) 63.69 29.21 2,600 2,559 523.1 8.4 (0.72) 0.00 4.89x NM NM NM NM
Coherus Biosciences, Inc. CHRS 30.37 4.8% 121.2% 38.10 12.38 1,181 1,027 26.3 (191.8) (10.64) (6.42) NM NM NM NM NM
ContraFect Corporation CFRX 4.15 (19.4%) 49.2% 6.24 2.50 114 85 – (21.3) (3.86) (0.96) NA NM NM NM NM
Curis, Inc. CRIS 2.74 5.8% 85.1% 3.75 1.09 352 284 7.8 (23.5) (0.22) (0.51) NM NM NM NM NM
CytomX Therapeutics, Inc. CTMX 19.21 NM NM 20.49 9.01 692 738 7.6 (25.2) (35.25) (2.48) NM NM NM NM NM
Dicerna Pharmaceuticals, Inc. DRNA 13.36 20.0% 13.0% 27.33 7.61 275 181 0.2 (61.1) (3.00) (3.31) NM NM NM NM NM
Dimension Therapeutics, Inc. DMTX 15.04 NM NM 15.35 11.55 374 384 6.8 (30.0) (3.61) (1.86) NM NM NM NM NM
Dyadic International, Inc. DYAI 1.70 73.5% 32.8% 1.72 0.80 53 56 12.8 (3.3) (0.18) NM 4.41x NM NM NM NM
Edge Therapeutics, Inc. EDGE 13.88 NM NM 25.87 11.08 400 446 – (21.6) (8.16) (8.67) NA NM NM NM NM
Emergent BioSolutions, Inc. EBS 37.67 8.7% 51.5% 38.98 24.74 1,467 1,411 502.7 128.4 0.80 1.29 2.81x 11.0x 31.6x 29.2x 1.17x
Healthcare Services Sector Update
Duff & Phelps 14
Source: Capital IQ as of November 30, 2015; For definitions, see page 22
($ in millions, except per share amounts)
Company Name TickerPrice
11/30/15
% Change 52-WeekMarket
CapEnt Val (TEV)
LTM EPS LTM Multiples Earnings Ratio PEG Ratio 2015E3 mo 12 mo High Low Rev EBITDA 2014 2015E Rev EBITDA LTM 2015E
Biotechnology (cont.)
Exelixis, Inc. EXEL $5.72 (5.5%) 244.6% $6.81 $1.26 $1,300 $1,480 $34.6 ($131.0) ($1.38) ($0.85) NM NM NM NM NM
FibroGen, Inc. FGEN 29.74 21.0% 31.3% 40.59 16.95 1,824 1,734 172.5 (71.8) (3.17) (0.91) 10.05x NM NM NM NM
Forward Pharma A/S FWP 21.79 (19.4%) 9.3% 43.34 17.50 1,014 945 – (45.3) (1.79) (0.93) NA NM NM NM NM
Genomic Health Inc. GHDX 30.32 9.3% (8.8%) 34.50 20.05 987 889 281.5 (24.7) (0.78) (0.91) 3.16x NM NM NM NM
Gilead Sciences Inc. GILD 105.96 (1.7%) 5.6% 123.37 85.95 152,707 159,748 31,447.0 22,435.0 7.35 12.20 5.08x 7.1x 9.7x 8.7x 1.04x
GlycoMimetics, Inc. GLYC 6.98 (1.0%) (27.9%) 9.65 4.88 133 79 20.0 (11.1) (0.60) (0.68) 3.95x NM NM NM NM
Histogenics Corporation HSGX 3.29 (46.7%) NM 12.97 2.71 44 7 – (28.6) (6.85) (2.23) NA NM NM NM NM
Immunomedics Inc. IMMU 3.29 52.3% (20.3%) 5.48 1.50 311 322 5.3 (47.3) (0.51) (0.57) NM NM NM NM NM
Immune Design Corp. IMDZ 20.93 26.0% (34.2%) 40.13 10.17 422 301 10.2 (40.2) (4.56) (2.00) 29.60x NM NM NM NM
INSYS Therapeutics, Inc. INSY 31.86 (5.8%) 64.5% 46.17 17.75 2,295 2,139 306.2 93.0 0.52 1.33 6.99x 23.0x 46.8x 23.9x 0.79x
Juno Therapeutics Inc. JUNO 56.39 48.5% NM 69.28 33.00 5,674 4,515 14.1 (329.2) (36.82) (1.65) NM NM NM NM NM
Ligand Pharmaceuticals Incorporated
LGND 107.08 12.7% 98.8% 112.40 49.65 2,134 2,149 73.7 29.9 0.56 12.03 29.15x NM 8.8x 8.9x 0.25x
Loxo Oncology, Inc. LOXO 32.93 60.6% 219.7% 35.00 9.90 632 538 – (30.2) (3.06) (1.86) NA NM NM NM NM
Macrocure Ltd. MCUR 2.03 (37.0%) (73.7%) 16.10 0.85 34 4 – (26.4) (2.15) (1.30) NA NM NM NM NM
Mirna Therapeutics, Inc. MIRN 5.73 NM NM 7.99 5.54 119 184 – (20.5) (290.94) (4.31) NA NM NM NM NM
Momenta Pharmaceuticals Inc. MNTA 17.86 (12.3%) 52.3% 25.56 10.22 1,230 855 88.4 (62.2) (1.91) (0.97) 9.67x NM NM NM NM
Myriad Genetics, Inc. MYGN 43.50 19.4% 29.7% 46.24 30.30 3,035 2,880 737.8 193.3 1.45 1.63 3.90x 14.9x 35.1x 26.7x 1.84x
NantKwest, Inc. NK 16.31 (12.1%) NM 38.48 10.10 1,325 966 0.3 (160.5) (0.75) (0.50) NM NM NM NM NM
Neothetics, Inc. NEOT 9.13 (23.5%) (15.3%) 15.05 5.92 125 84 – (36.0) (5.36) (3.70) NA NM NM NM NM
Neurocrine Biosciences Inc. NBIX 54.37 16.5% 172.8% 58.46 18.59 4,687 4,310 19.8 (83.0) (0.81) (1.06) NM NM NM NM NM
Nexvet Biopharma Public Limited Company
NVET 3.95 (17.9%) NM 11.30 3.49 45 (2) – (16.6) (8.79) (1.56) NA 0.1x NM NM NM
Ocular Therapeutix, Inc. OCUL 9.48 (45.7%) (44.0%) 44.19 6.75 234 136 1.8 (34.8) (2.69) (1.77) NM NM NM NM NM
Osiris Therapeutics, Inc. OSIR 10.26 (45.2%) (22.0%) 23.67 9.80 353 310 86.6 4.4 (0.01) 0.08 3.58x NM NM NM NM
Otonomy, Inc. OTIC 26.39 12.3% 9.9% 41.99 16.50 640 440 – (50.4) (5.46) (2.64) NA NM NM NM NM
Paratek Pharmaceuticals, Inc. PRTK 20.67 (22.4%) 8.5% 39.80 15.02 364 237 4.0 (49.8) (7.82) (4.33) NM NM NM NM NM
PDL BioPharma, Inc. PDLI 3.79 (33.0%) (54.2%) 8.38 3.43 619 721 496.4 456.4 1.86 1.93 1.45x 1.6x 2.3x 2.0x NM
Pfenex Inc. PFNX 15.42 (28.4%) 92.8% 24.41 6.27 359 247 8.3 (22.1) (1.04) (1.47) 29.62x NM NM NM NM
ProMetic Life Sciences Inc. PLI 2.66 80.0% 45.7% 2.67 1.04 1,543 1,552 15.7 (32.0) 0.01 (0.07) NM NM NM NM NM
ProQR Therapeutics N.V. PRQR 10.42 (37.6%) (31.3%) 27.60 8.47 243 136 2.9 (26.8) (1.32) (1.06) NM NM NM NM NM
Proteon Therapeutics Inc PRTO 15.94 11.6% 51.2% 20.00 8.57 263 192 – (17.9) (3.16) (1.26) NA NM NM NM NM
Regeneron Pharmaceuticals, Inc. REGN 544.50 1.5% 30.9% 605.93 383.87 57,737 57,236 3,808.0 1,317.3 3.07 12.54 15.03x 43.5x NM 43.4x 1.84x
Regenxbio Inc. RGNX 23.97 NM NM 30.84 0.00 631 417 4.3 – (1.82) (2.31) NM NA NM NM NM
Roka Bioscience, Inc. ROKA 1.20 (56.4%) (69.7%) 4.95 1.11 22 (6.4) 5.8 (26.9) (2.93) (2.03) NM 0.2x NM NM NM
Healthcare Services Sector Update
Duff & Phelps 15
Source: Capital IQ as of November 30, 2015; For definitions, see page 22
($ in millions, except per share amounts)
Company Name TickerPrice
11/30/15
% Change 52-WeekMarket
CapEnt Val (TEV)
LTM EPS LTM Multiples Earnings Ratio PEG Ratio 2015E3 mo 12 mo High Low Rev EBITDA 2014 2015E Rev EBITDA LTM 2015E
Biotechnology (cont.)
Sage Therapeutics, Inc. SAGE $47.92 (10.6%) 21.2% $89.04 $33.00 $1,383 $1,178 – ($78.3) ($1.67) ($3.26) NA NM NM NM NM
Spark Therapeutics, Inc. ONCE 57.79 26.7% NM 79.50 36.96 1,428 1,216 5.5 (48.0) (4.64) (2.60) NM NM NM NM NM
Spectrum Pharmaceuticals, Inc. SPPI 6.00 (21.1%) (16.8%) 7.74 4.89 404 368 164.1 (6.4) (0.71) (0.84) 2.24x NM NM NM NM
T2 Biosystems, Inc. TTOO 11.79 (2.6%) (34.2%) 24.04 8.45 240 221 1.9 (39.5) (4.15) (2.26) NM NM NM NM NM
Theravance Inc. THRX 9.25 (33.1%) (38.9%) 21.16 6.36 1,086 1,624 38.4 14.5 (0.66) (0.18) NM NM NM NM NM
Tokai Pharmaceuticals, Inc. TKAI 11.50 (1.5%) (21.6%) 16.10 9.38 260 187 – (41.5) (3.60) (2.10) NA NM NM NM NM
TRACON Pharmaceuticals, Inc. TCON 11.88 12.8% NM 21.00 8.46 145 94 7.5 (14.8) (4.40) (1.63) 12.44x NM NM NM NM
Ultragenyx Pharmaceutical Inc. RARE 98.32 (13.3%) 125.6% 137.05 38.01 3,818 3,370 – (107.4) (2.25) (3.60) NA NM NM NM NM
United Therapeutics Corporation UTHR 152.63 (4.9%) 15.1% 190.29 117.88 6,964 6,073 1,407.2 756.4 6.28 13.44 4.32x 8.0x 12.0x 11.4x 2.27x
Vanda Pharmaceuticals, Inc. VNDA 9.86 (17.4%) (24.3%) 15.51 8.80 422 278 93.4 (21.5) 0.55 (0.80) 2.97x NM 9.5x NM NM
Vascular Biogenics Ltd. VBLT 5.27 (0.8%) (15.0%) 17.02 3.09 118 91 – (16.6) (3.09) (0.84) NA NM NM NM NM
Versartis, Inc. VSAR 12.65 (4.5%) (29.8%) 23.99 9.69 371 173 – (75.6) (4.39) (3.13) NA NM NM NM NM
Vertex Pharmaceuticals Incorporated
VRTX 129.36 (3.5%) 9.7% 143.45 97.45 31,786 31,756 759.0 (500.2) (3.14) (1.07) NM NM NM NM NM
Vital Therapies, Inc. VTL 9.40 175.7% (54.6%) 29.67 2.81 286 226 – (54.4) (3.54) (2.15) NA NM NM NM NM
Voyager Therapeutics, Inc. VYGR 25.19 NM NM 29.53 17.40 656 693 7.5 (16.5) (6.55) NM NM NM NM NM NM
XBiotech, Inc. XBIT 7.47 (59.5%) NM 32.50 7.17 240 135 – (31.1) (0.90) (1.15) NA NM NM NM NM
Zafgen, Inc. ZFGN 16.91 (54.2%) (28.4%) 55.36 9.53 461 264 – (61.2) (3.00) (2.67) NA NM NM NM NM
Median (4.3%) 5.6% 6.12x 11.8x 19.0x 22.6x 1.32x
Cardiology Devices
ABIOMED, Inc. ABMD $81.57 (17.0%) 129.6% $110.68 $34.53 $3,460 $3,284 $279.4 $58.5 $0.44 $0.80 11.76x NM 28.2x NM NM
AngioDynamics Inc. ANGO 11.90 (18.9%) (32.0%) 19.80 11.14 432 546 349.2 49.3 0.14 0.51 1.56x 11.1x NM 23.2x 1.55x
Bellerophon Therapeutics LLC BLPH 3.16 (37.1%) NM 12.92 2.75 41 0 0.0 (46.8) (7.56) (3.93) NA NM NM NM NM
Boston Scientific Corporation BSX 18.28 7.1% 42.0% 19.06 12.56 24,590 30,099 7,314.0 1,799.0 (0.09) 0.92 4.12x 16.7x NM 20.0x 1.65x
Cardiovascular Systems Inc. CSII 16.00 (34.0%) (47.8%) 41.28 11.80 520 443 181.3 (34.8) (1.07) (1.52) 2.44x NM NM NM NM
CareDx, Inc CDNA 6.51 (5.1%) (7.6%) 10.89 3.70 77 59 29.4 (6.7) 0.10 (1.13) 2.01x NM NM NM NM
Edwards Lifesciences Corp. EW 163.00 12.6% 25.7% 166.87 122.75 17,580 16,935 2,440.6 689.3 7.48 4.50 6.94x 24.6x 38.6x 36.2x 2.32x
Greatbatch, Inc. GB 58.04 1.7% 17.1% 63.19 46.26 1,774 1,888 652.6 114.4 2.14 2.75 2.89x 16.5x 48.4x 21.1x 1.92x
Heartware International Inc. HTWR 47.86 (44.5%) (34.9%) 95.59 34.70 828 768 282.0 (20.4) (1.14) (3.01) 2.73x NM NM NM NM
LeMaitre Vascular, Inc. LMAT 15.43 14.7% 109.9% 16.47 7.15 280 256 75.8 14.0 0.23 0.37 3.37x 18.3x 38.9x 41.5x 3.19x
Lombard Medical, Inc. EVAR 1.45 (61.4%) (80.7%) 7.50 1.35 29 11 16.9 (34.7) (2.39) (2.03) 0.64x NM NM NM NM
Medtronic plc MDT 75.34 2.4% 2.0% 79.50 55.54 106,502 124,115 25,819.0 7,831.0 3.11 4.28 4.81x 15.8x 35.0x 17.6x 2.40x
Neovasc Inc. NVC 5.03 (9.1%) (20.7%) 9.57 3.75 335 272 9.7 (20.4) (0.31) (0.38) 27.87x NM NM NM NM
REVA Medical, Inc. RVA 0.60 19.9% 76.1% 0.68 0.28 229 275 0.0 (20.7) (0.15) (0.07) NA NM NM NM NM
St. Jude Medical Inc. STJ 63.10 (13.1%) (7.2%) 80.84 60.34 17,836 20,350 5,533.0 1,663.0 3.46 3.93 3.68x 12.2x 17.9x 16.0x 1.56x
Stereotaxis Inc. STXS 1.05 (41.7%) (34.4%) 2.97 0.65 23 37 38.2 (3.1) (0.26) NM 0.98x NM NM NM NM
Healthcare Services Sector Update
Duff & Phelps 16
Source: Capital IQ as of November 30, 2015; For definitions, see page 22
($ in millions, except per share amounts)
Company Name TickerPrice
11/30/15
% Change 52-WeekMarket
CapEnt Val (TEV)
LTM EPS LTM Multiples Earnings Ratio PEG Ratio 2015E3 mo 12 mo High Low Rev EBITDA 2014 2015E Rev EBITDA LTM 2015E
Cardiology Devices (cont.)
Sunshine Heart Inc. SSH $1.86 (35.0%) (59.1%) $6.90 $1.65 $34 $14 $0.2 ($25.9) ($1.51) ($1.48) NM NM NM NM NM
TriVascular Technologies, Inc. TRIV 6.53 38.3% (51.5%) 14.00 3.98 134 150 36.3 (49.8) (3.95) (2.91) 4.12x NM NM NM NM
Median (11.1%) (7.6%) 3.37x 16.5x 36.8x 21.1x 1.92x
Conglomerates
3M Company MMM $156.58 8.6% (2.2%) $170.50 $134.00 $96,408 $105,941 $30,695.0 $8,496.0 $7.49 $7.65 3.45x 12.5x 20.2x 20.5x 1.97x
Agilent Technologies Inc. A 41.82 14.5% (2.2%) 43.59 33.12 13,859 13,514 4,038.0 775.0 1.43 1.75 3.35x 17.4x 32.2x 23.9x 2.10x
Becton, Dickinson and Company BDX 150.25 5.2% 7.1% 154.98 128.71 31,663 43,022 10,282.0 2,631.0 5.82 7.46 4.18x 16.4x 44.9x 20.1x 1.73x
Johnson & Johnson JNJ 101.24 6.4% (6.5%) 108.99 81.79 280,125 262,754 70,517.0 22,554.0 5.70 6.19 3.73x 11.7x 19.4x 16.4x 3.01x
Kimberly-Clark Corporation KMB 119.15 11.1% 2.2% 122.97 103.04 43,251 50,487 18,880.0 4,216.0 3.91 5.76 2.67x 12.0x 72.1x 20.7x 2.68x
Median 8.6% (2.2%) 3.45x 12.5x 32.2x 20.5x 2.10x
Dental Devices
COLTENE Holding AG CLTN $58.43 (6.1%) (11.8%) $82.22 $49.62 $246 $256 $170.5 $28.5 $3.73 $3.23 1.50x 9.0x 18.3x 18.1x 2.05x
DENTSPLY International Inc. XRAY 60.66 13.9% 10.3% 62.48 49.42 8,484 9,406 2,722.2 567.0 2.24 2.61 3.46x 16.6x 31.2x 23.2x 2.88x
Orthofix International N.V. OFIX 39.56 3.9% 41.7% 42.61 27.92 747 684 392.2 26.2 (0.20) 0.75 1.74x 26.1x NM 52.7x 2.57x
Osstem Implant Co., Ltd. A048260 58.26 3.0% 75.8% 61.46 28.96 832 809 227.5 34.1 1.01 1.70 3.56x 23.7x 38.0x 34.2x 0.78x
Sirona Dental Systems Inc. SIRO 108.48 12.7% 25.6% 111.75 84.30 6,064 5,629 1,161.3 312.2 3.16 4.02 4.85x 18.0x 32.9x 27.0x 2.03x
Straumann Holding AG STMN 296.27 (2.0%) 14.5% 299.43 187.49 4,640 4,631 800.6 207.6 10.10 9.09 5.79x 22.3x 54.5x 32.6x 2.72x
Median 3.4% 20.0% 3.51x 20.2x 32.9x 29.8x 2.31x
Orthopedics Devices
Exactech Inc. EXAC $17.53 (6.0%) (21.0%) $26.20 $16.11 $247 $251 $242.4 $42.6 $1.18 $1.03 1.04x 5.9x 15.7x 17.1x 1.77x
NuVasive, Inc. NUVA 52.14 (3.0%) 18.7% 56.61 41.52 2,560 2,603 800.2 162.4 (0.36) 1.26 3.25x 16.0x 42.7x 41.4x 2.87x
Stryker Corporation SYK 96.46 (3.2%) 3.8% 105.34 89.81 36,269 36,385 9,849.0 2,644.0 1.34 5.11 3.69x 13.8x 31.4x 18.9x 2.06x
Wright Medical Group N.V. WMGI 21.42 NM NM 23.46 18.03 2,199 2,511 318.3 (76.9) (4.83) (1.41) 7.89x NM NM NM NM
Zimmer Biomet Holdings, Inc. ZBH 101.01 (3.2%) (10.0%) 121.84 88.77 20,584 30,690 5,287.1 2,089.5 4.19 6.87 5.80x 14.7x NM 14.7x 1.40x
Median (3.2%) (3.1%) 3.69x 14.2x 31.4x 18.0x 1.92x
Diagnostic Imaging Devices
Analogic Corporation ALOG $83.55 4.1% 14.7% $92.31 $71.80 $1,038 $914 $536.9 $63.9 $2.56 $3.96 1.70x 14.3x 31.4x 21.1x 1.56x
Digirad Corporation DRAD 5.84 57.8% 59.1% 6.92 3.50 113 94 59.4 6.2 0.13 0.20 1.57x 15.0x 5.2x 29.2x NM
Fonar Corp. FONR 15.92 64.1% 34.2% 18.48 9.10 98 107 81.8 16.2 1.70 NM 1.30x 6.6x 7.8x NM NM
Hologic Inc. HOLX 40.35 1.5% 50.6% 43.00 25.26 11,415 14,597 2,681.4 975.0 0.18 1.69 5.44x 15.0x 89.7x 23.9x 2.54x
Median 31.0% 42.4% 1.64x 14.6x 19.6x 23.9x 2.05x
Healthcare Services Sector Update
Duff & Phelps 17
Source: Capital IQ as of November 30, 2015; For definitions, see page 22
Duff & Phelps 18
Source: Capital IQ as of November 30, 2015; For definitions, see page 22
Healthcare Services Sector Update
($ in millions, except per share amounts)
Company Name TickerPrice
11/30/15
% Change 52-WeekMarket
CapEnt Val (TEV)
LTM EPS LTM Multiples Earnings Ratio PEG Ratio 2015E3 mo 12 mo High Low Rev EBITDA 2014 2015E Rev EBITDA LTM 2015E
Mobility Devices
Hill-Rom Holdings, Inc. HRC $50.91 (4.5%) 11.3% $58.73 $44.11 $3,318 $5,368 $1,988.2 $294.9 $1.03 $2.77 2.70x 18.2x 62.1x 18.4x 1.09x
Invacare Corporation IVC 19.92 12.9% 31.7% 23.59 14.00 670 684 1,177.3 10.9 (2.15) (0.73) 0.58x NM NM NM NM
Prism Medical Ltd. PM 7.02 (17.6%) 0.1% 10.58 6.05 35 45 39.8 2.2 2.55 0.15 1.14x 20.3x NM 45.6x NM
ReWalk Robotics Ltd. RWLK 7.79 (7.9%) (70.5%) 26.17 7.20 95 70 3.9 (22.4) (6.34) (1.96) 17.94x NM NM NM NM
Median (6.2%) 5.7% 1.92x 19.3x 62.1x 32.0x 1.09x
Infection Prevention Devices
Cantel Medical Corp. CMN $64.83 29.9% 48.9% $65.80 $39.26 $2,697 $2,744 $560.6 $110.4 $1.03 $1.44 4.90x 24.9x 56.4x 45.0x 2.50x
Median 29.9% 48.9% 4.90x 24.9x 56.4x 45.0x 2.50x
Neural Implant Devices
Integra LifeSciences Holdings Corporation
IART $62.71 3.2% 27.4% $70.32 $47.72 $2,319 $2,970 $992.2 $210.5 $1.03 $3.09 2.99x 14.1x NM 20.3x 1.67x
Median 3.2% 27.4% 2.99x 14.1x NM 20.3x 1.67x
Ophthalmology Devices
IRIDEX Corporation IRIX $9.57 38.9% 13.8% $11.28 $6.42 $95 $85 $41.1 $1.3 $0.97 NM 2.07x NM 11.0x NM NM
Opt Sciences Corp. OPST 19.50 4.0% 16.4% 21.81 16.50 15 3 7.8 2.1 1.62 NM 0.36x 1.3x 9.9x NM NM
Presbia PLC LENS 5.48 (21.7%) NM 9.38 0.00 73 48 0.2 (20.4) (1.71) (1.59) NM NM NM NM NM
Second Sight Medical Products, Inc.
EYES 5.06 (49.2%) (67.0%) 19.63 4.57 181 160 8.1 (19.4) (1.41) (0.55) 19.70x NM NM NM NM
The Cooper Companies Inc. COO 146.25 (11.2%) (13.4%) 190.00 136.75 7,110 8,407 1,797.1 540.7 5.29 7.73 4.68x 15.5x 36.4x 18.9x 1.25x
Median (11.2%) 0.2% 3.37x 8.4x 11.0x 18.9x 1.25x
Surgical Devices
Alphatec Holdings, Inc. ATEC $0.23 (57.4%) (82.0%) $1.54 $0.21 $23 $116 $191.9 $22.8 ($0.16) ($0.08) 0.61x 5.1x NM NM NM
Avinger, Inc. AVGR 17.99 20.3% NM 18.83 9.35 227 201 10.9 (34.1) (132.63) (4.08) 18.44x NM NM NM NM
Bovie Medical Corporation BVX 1.94 (15.7%) (50.6%) 4.01 1.72 53 43 28.7 (6.6) (1.03) (0.26) 1.49x NM 17.6x NM NM
CONMED Corporation CNMD 42.50 (21.0%) 0.2% 60.66 37.94 1,177 1,374 717.6 123.6 1.16 1.67 1.91x 11.1x 34.8x 25.5x 1.96x
Entellus Medical, Inc. ENTL 17.44 (21.4%) NM 28.81 14.72 328 274 58.0 (11.3) (4.62) (1.04) 4.72x NM NM NM NM
Intuitive Surgical, Inc. ISRG 520.02 1.1% 0.4% 564.86 447.00 19,431 17,691 2,296.9 784.6 11.11 18.33 7.70x 22.5x 35.9x 28.4x 1.83x
Median (18.3%) (25.2%) 3.32x 11.1x 34.8x 26.9x 1.89x
($ in millions, except per share amounts)
Company Name TickerPrice
11/30/15
% Change 52-WeekMarket
CapEnt Val (TEV)
LTM EPS LTM Multiples Earnings Ratio PEG Ratio 2015E3 mo 12 mo High Low Rev EBITDA 2014 2015E Rev EBITDA LTM 2015E
Diversified Medical Devices
Abaxis, Inc. ABAX $53.17 11.0% (7.4%) $66.89 $41.53 $1,208 $1,075 $217.1 $46.3 $1.00 $1.15 4.95x 23.2x 49.2x 46.2x 2.31x
AtriCure, Inc. ATRC 21.48 (15.8%) 14.7% 28.15 17.22 692 644 122.7 (17.8) (0.61) (0.98) 5.25x NM NM NM NM
Baxter International Inc. BAX 37.65 (2.8%) (48.4%) 75.29 32.18 20,595 21,219 16,106.0 4,144.0 3.56 1.26 1.32x 5.1x 11.3x 29.9x 2.85x
Capnia, Inc. CAPN 2.00 (11.9%) (39.9%) 9.90 1.02 25 20 0.4 (10.4) (10.42) NM NM NM NM NM NM
CR Bard Inc. BCR 186.82 (5.4%) 11.6% 202.47 163.08 13,803 14,210 3,412.4 1,038.0 3.76 8.13 4.16x 13.7x NM 23.0x 2.35x
CryoLife Inc. CRY 10.86 9.7% 7.5% 12.29 9.41 309 271 143.2 11.4 0.25 0.14 1.89x 23.7x NM 80.4x 3.22x
HTG Molecular Diagnostics, Inc. HTGM 4.95 (13.0%) NM 19.75 4.50 34 13 4.1 (16.3) (175.03) (4.85) 3.23x NM NM NM NM
IDEXX Laboratories, Inc. IDXX 70.82 (3.3%) (5.2%) 84.26 61.37 6,442 7,235 1,554.2 337.7 1.79 2.06 4.66x 21.4x 38.6x 34.4x 2.36x
InfuSystem Holdings, Inc. INFU 2.93 4.6% 6.2% 3.42 2.22 66 100 64.1 17.0 0.15 NM 1.56x 5.9x 23.6x NM NM
Masimo Corporation MASI 41.48 (0.1%) 58.0% 46.00 23.73 2,086 2,172 617.9 130.7 1.30 1.49 3.51x 16.6x 27.8x 27.8x 1.67x
Medovex Corp. MDVX 1.53 (31.8%) NM 5.80 1.16 17 16 0.0 (5.5) (0.37) NM NA NM NM NM NM
Misonix, Inc. MSON 9.47 (16.7%) (12.2%) 14.50 8.20 74 64 22.9 (0.8) 0.36 NM 2.79x NM 16.3x NM NM
Natus Medical Inc. BABY 48.78 17.8% 42.5% 49.72 29.34 1,582 1,500 369.9 73.5 1.00 1.52 4.06x 20.4x 40.4x 32.1x 1.73x
Nevro Corp. NVRO 60.38 39.2% 123.7% 61.48 27.20 1,687 1,484 46.2 (56.0) (6.94) (2.72) NM NM NM NM NM
NovoCure Limited NVCR 24.35 NM NM 30.89 15.01 2,036 1,923 24.5 (93.9) (6.46) (1.10) NM NM NM NM NM
OpGen, Inc. OPGN 1.79 (30.8%) NM 5.44 1.45 22 13 3.0 (10.5) (1.20) NM 4.34x NM NM NM NM
Penumbra, Inc. PEN 50.32 NM NM 52.04 0.00 1,504 1,345 167.1 4.1 (0.18) (0.07) 8.05x NM NM NM NM
PhotoMedex, Inc. PHMD 0.41 (45.3%) (76.5%) 2.95 0.35 9 6 118.3 (13.6) (3.26) (0.73) 0.05x NM NM NM NM
ResMed Inc. RMD 59.57 13.5% 12.0% 75.33 48.99 8,319 7,997 1,710.2 485.5 2.46 2.58 4.68x 16.5x 24.2x 23.1x 2.05x
Sientra, Inc. SIEN 4.84 (79.7%) (72.1%) 26.67 2.78 87 (37) 48.7 (12.4) (2.28) (1.22) NM 3.0x NM NM NM
SurModics, Inc. SRDX 21.06 (9.1%) 0.2% 27.68 20.00 272 217 61.9 24.4 0.89 0.94 3.50x 8.9x 23.4x 22.4x 1.49x
Teleflex Incorporated TFX 131.70 (0.6%) 10.5% 140.50 107.45 5,479 6,267 1,787.9 403.5 4.10 6.25 3.51x 15.5x 31.9x 21.1x 1.91x
Varian Medical Systems, Inc. VAR 80.78 (2.0%) (8.7%) 96.67 71.07 7,826 7,492 3,099.1 634.1 3.84 4.15 2.42x 11.8x 19.8x 19.5x 1.88x
Median (3.3%) 3.2% 3.51x 15.5x 24.2x 27.8x 2.05x
Life Science Conglomerates
Illumina Inc. ILMN $183.90 (8.8%) (3.7%) $242.37 $130.00 $26,923 $26,626 $2,140.6 $770.8 $2.37 $3.30 12.44x 34.5x 53.8x 55.7x 2.89x
PerkinElmer Inc. PKI 53.16 7.4% 16.9% 54.45 40.84 5,950 6,784 2,262.6 355.2 1.42 2.57 3.00x 19.1x 34.3x 20.6x 1.94x
Thermo Fisher Scientific, Inc. TMO 138.40 9.4% 7.0% 141.25 14.00 55,235 68,053 16,805.7 4,060.8 4.71 7.39 4.05x 16.8x 28.1x 18.7x 1.62x
Median 7.4% 7.0% 4.05x 19.1x 34.3x 20.6x 1.94x
Healthcare Services Sector Update
Duff & Phelps 19
Source: Capital IQ as of November 30, 2015; For definitions, see page 22

($ in millions, except per share amounts)
Company Name TickerPrice
11/30/15
% Change 52-WeekMarket
CapEnt Val (TEV)
LTM EPS LTM Multiples Earnings Ratio PEG Ratio 2015E3 mo 12 mo High Low Rev EBITDA 2014 2015E Rev EBITDA LTM 2015E
Lab Instrumentation & Devices
Bruker Corporation BRKR $22.64 21.9% 18.0% $22.95 $15.78 $3,801 $3,648 $1,653.6 $217.8 $0.33 $0.78 2.21x 16.7x 58.0x 29.1x 2.24x
Great Basin Scientific, Inc. GBSN 0.22 (39.2%) (94.3%) 9.08 0.05 42 38 2.0 (17.7) (17.32) (3.21) 19.03x NM NM NM NM
Harvard Bioscience Inc. HBIO 3.17 (25.9%) (35.6%) 6.84 2.73 108 122 110.7 5.0 0.07 0.14 1.10x 24.2x NM 23.5x NM
Waters Corporation WAT 132.82 6.4% 14.6% 137.39 110.70 10,847 10,166 2,039.6 664.9 5.07 5.88 4.98x 15.3x 23.7x 22.6x 2.36x
Median (9.8%) (10.5%) 3.60x 16.7x 40.9x 23.5x 2.30x
Lab Equipment
Kewaunee Scientific Corp. KEQU $17.44 3.9% (1.4%) $19.00 $15.30 $47 $53 $120.2 $6.8 $1.47 NM 0.44x 7.8x 14.4x NM NM
Mettler-Toledo International Inc. MTD 342.78 14.2% 16.9% 350.11 269.26 9,377 9,877 2,419.3 535.5 11.44 12.87 4.08x 18.4x 27.9x 26.6x 1.98x
Median 9.0% 7.8% 2.26x 13.1x 21.2x 26.6x 1.98x
Life Science Consumables
Affymetrix Inc. AFFX $9.47 (0.1%) 3.7% $13.11 $8.28 $757 $745 $357.7 $46.6 ($0.05) $0.41 2.08x 16.0x 70.8x 23.1x 1.66x
Bio-Rad Laboratories, Inc. BIO 139.72 0.1% 17.6% 152.38 112.51 4,086 3,736 2,047.1 310.0 3.05 3.57 1.83x 12.1x 39.9x 39.1x 3.91x
Cambrex Corporation. CBM 53.63 12.1% 135.7% 55.60 21.12 1,691 1,661 406.5 111.0 1.84 2.14 4.09x 15.0x 25.6x 25.1x 1.42x
Luminex Corporation LMNX 21.52 16.6% 16.3% 22.07 15.05 927 795 235.4 53.0 0.93 0.65 3.38x 15.0x 23.2x 33.3x 1.90x
Bio-Techne Corp. TECH 91.21 (5.0%) (0.4%) 114.56 83.90 3,392 3,473 455.6 180.0 3.12 3.34 7.62x 19.3x 31.9x 27.3x 2.18x
VWR Corporation VWR 26.68 1.1% (0.5%) 28.83 20.60 3,505 5,435 4,307.9 448.4 2.49 1.46 1.26x 12.1x 23.5x 18.3x 1.56x
Median 0.6% 10.0% 2.73x 15.0x 28.7x 26.2x 1.78x
Large-Cap Pharmaceuticals
AbbVie Inc. ABBV $58.15 (9.1%) (16.0%) $71.60 $45.45 $95,061 $117,883 $21,911.0 $8,564.0 $1.10 $4.29 5.38x 13.8x 33.7x 13.6x 0.90x
Bristol-Myers Squibb Company BMY 67.01 10.6% 13.5% 70.54 51.82 111,792 113,856 16,531.0 4,465.0 1.20 1.91 6.89x 25.5x 63.1x 35.1x 1.60x
Eli Lilly and Company LLY 82.04 (1.4%) 20.4% 92.85 67.60 87,014 90,793 19,704.4 5,307.6 2.23 3.44 4.61x 17.1x 37.0x 23.9x 1.66x
Merck & Co. Inc. MRK 53.01 (4.3%) (12.2%) 63.62 45.69 148,086 162,755 39,765.0 14,566.0 4.07 3.57 4.09x 11.2x 14.1x 14.9x 1.99x
Pfizer Inc. PFE 32.77 0.3% 5.2% 36.30 28.47 202,306 221,014 47,922.0 19,478.0 1.41 2.18 4.61x 11.3x 24.6x 15.1x 1.85x
Valeant Pharmaceuticals International, Inc.
VRX 89.96 (61.9%) (38.2%) 263.81 69.33 30,694 60,263 9,984.1 4,971.6 2.67 11.21 6.04x 12.1x 51.7x 8.0x 0.37x
Median (2.8%) (3.5%) 5.00x 12.9x 35.4x 15.0x 1.63x
Healthcare Services Sector Update
Duff & Phelps 20
Source: Capital IQ as of November 30, 2015; For definitions, see page 22
($ in millions, except per share amounts)
Company Name TickerPrice
11/30/15
% Change 52-WeekMarket
CapEnt Val (TEV)
LTM EPS LTM Multiples Earnings Ratio PEG Ratio 2015E3 mo 12 mo High Low Rev EBITDA 2014 2015E Rev EBITDA LTM 2015E
Pharmaceuticals
Aclaris Therapeutics, Inc. ACRS $23.55 NM NM $24.60 $10.99 $475 $515 – ($18.4) ($6.15) ($3.28) NA NM NM NM NM
Adaptimmune Therapeutics plc ADAP 9.04 (22.5%) NM 21.57 7.07 640 368 12.8 (27.7) (1.67) (0.30) 28.73x NM NM NM NM
Akorn, Inc. AKRX 33.30 (18.8%) (16.9%) 57.10 19.08 3,811 4,858 593.1 208.3 0.34 1.95 8.19x 23.3x 98.4x 17.1x 0.70x
Amphastar Pharmaceuticals, Inc. AMPH 15.35 14.6% 47.2% 18.30 8.32 691 666 230.5 (11.2) (0.26) (0.19) 2.89x NM NM NM NM
Aratana Therapeutics, Inc. PETX 5.86 (66.8%) (55.8%) 20.63 5.53 205 147 0.9 (44.8) (1.30) (1.22) NM NM NM NM NM
Auris Medical Holding AG EARS 3.61 (25.7%) (19.6%) 7.15 3.02 124 67 0.0 (30.3) (0.66) (1.04) NA NM NM NM NM
Axsome Therapeutics, Inc. AXSM 8.83 NM NM 9.70 0.00 169 179 0.0 0.0 (0.66) NM NA NA NM NM NM
BioDelivery Sciences International, Inc.
BDSI 6.13 (10.8%) (60.1%) 15.84 4.66 323 298 18.6 (63.2) (1.12) (0.30) 16.05x NM NM NM NM
BioSyent Inc. RX 5.25 (0.3%) (43.5%) 9.08 4.43 73 67 10.9 3.8 0.19 0.19 6.15x 17.6x 26.9x 28.0x NM
Blueprint Medicines Corporation BPMC 23.16 (13.7%) NM 37.17 18.00 628 456 6.8 (49.7) (3.07) (5.11) NM NM NM NM NM
Carbylan Therapeutics, Inc. CBYL 3.99 (25.8%) NM 9.22 3.20 105 50 0.0 (19.2) (1.46) (1.15) NM NM NM NM NM
Catalent, Inc. CTLT 27.85 (13.4%) (3.3%) 34.42 22.85 3,468 5,206 1,835.5 415.7 0.64 1.61 2.84x 12.5x 14.6x 17.3x 1.84x
Cerecor Inc. CERC 4.20 NM NM 5.00 3.74 36 68 0.0 (11.1) (5.48) NM NA NM 0.9x NM NM
Cidara Therapeutics, Inc. CDTX 15.42 5.1% NM 17.21 11.23 212 97 0.0 (26.7) (3.88) (4.80) NA NM NM NM NM
Cipher Pharmaceuticals Inc. CPH 4.59 (13.3%) (65.9%) 14.65 3.58 119 126 27.0 7.1 0.68 (0.03) 4.65x 17.6x NM NM NM
Collegium Pharmaceutical, Inc. COLL 18.99 23.8% NM 24.88 0.00 393 295 0.0 (20.6) (2.84) (1.70) NA NM NM NM NM
CoLucid Pharmaceuticals, Inc. CLCD 5.69 (14.2%) NM 9.46 3.57 86 17 0.0 (20.1) (0.31) (3.19) NA NM NM NM NM
Cumberland Pharmaceuticals, Inc. CPIX 5.63 (6.8%) 9.3% 7.78 5.08 93 42 34.8 3.9 0.14 NM 1.19x 10.7x 79.7x NM NM
Dermira, Inc. DERM 30.81 13.1% 78.6% 32.13 14.20 922 709 14.6 (54.6) (4.96) (2.82) NM NM NM NM NM
DURECT Corporation DRRX 2.36 12.4% 156.5% 3.42 0.73 284 272 18.2 (20.2) (0.20) (0.20) 14.92x NM NM NM NM
Endo International plc ENDP 61.48 (21.9%) (16.0%) 96.58 46.66 13,911 22,053 3,354.4 782.2 (4.95) 4.56 6.57x 28.2x NM 13.5x 0.84x
Flex Pharma, Inc. FLKS 12.10 (2.5%) NM 24.82 9.23 217 118 0.0 (26.6) (5.48) (2.07) NA NM NM NM NM
Foamix Pharmaceuticals Ltd. FOMX 7.99 (21.5%) 50.8% 14.00 5.31 244 187 3.6 (11.5) (0.79) (0.70) NM NM NM NM NM
Heska Corporation HSKA 34.79 3.1% 123.2% 37.24 14.74 229 241 99.2 12.0 0.41 0.65 2.43x 20.1x 59.0x 53.3x 1.96x
Impax Laboratories Inc. IPXL 44.06 3.9% 37.9% 52.10 28.11 3,107 3,208 709.6 115.7 0.81 1.27 4.52x 27.7x NM 34.6x 1.45x
Inotek Pharmaceuticals Corporation
ITEK 11.99 (1.4%) NM 19.45 4.68 317 198 0.0 0.0 (13.52) (3.69) NA NA NM NM NM
Jaguar Animal Health, Inc. JAGX 2.19 (36.2%) NM 7.06 1.69 18 13 0.2 0.0 (2.02) (2.70) NM NA NM NM NM
KemPharm, Inc. KMPH 17.32 (10.8%) NM 26.15 10.90 250 246 0.0 (22.9) (3.13) (4.75) NA NM NM NM NM
Kite Pharma, Inc. KITE 82.37 47.6% 96.2% 89.84 39.00 3,639 3,271 12.4 (75.5) (1.91) (1.39) NM NM NM NM NM
Lannett Company, Inc. LCI 36.96 (25.9%) (24.8%) 72.44 33.13 1,350 1,129 419.9 237.3 3.42 3.89 2.69x 4.8x 9.3x 9.5x 0.54x
Marinus Pharmaceuticals, Inc. MRNS 7.27 (50.4%) 6.9% 20.72 4.52 141 115 0.0 (20.5) (2.17) (1.54) NA NM NM NM NM
MediWound Ltd. MDWD 10.30 43.3% 74.0% 10.47 5.00 219 169 0.5 (19.9) (0.95) (0.88) NM NM NM NM NM
Healthcare Services Sector Update
Duff & Phelps 21
Source: Capital IQ as of November 30, 2015; For definitions, see page 22
($ in millions, except per share amounts)
Company Name TickerPrice
11/30/15
% Change 52-WeekMarket
CapEnt Val (TEV)
LTM EPS LTM Multiples Earnings Ratio PEG Ratio 2015E3 mo 12 mo High Low Rev EBITDA 2014 2015E Rev EBITDA LTM 2015E
Pharmaceuticals (cont.)
Merus Labs International Inc. MSL $1.54 (7.2%) 9.7% $2.63 $1.02 $157 $183 $36.5 $22.5 ($0.09) $0.02 5.02x 8.2x NM 66.1x 3.18x
MyoKardia, Inc. MYOK 12.37 NM NM 13.16 8.98 335 372 14.2 (17.6) (11.30) (4.03) 26.21x NM NM NM NM
Mylan N.V. MYL 51.30 1.8% (12.5%) 76.69 37.59 25,227 31,025 9,021.3 2,635.9 2.34 4.31 3.44x 11.8x 28.6x 11.9x 0.98x
Nabriva Therapeutics AG NBRV 10.19 NM NM 12.89 0.00 214 92 3.4 (19.8) (4.99) (33.02) 27.21x NM NM NM NM
NeuroDerm Ltd. NDRM 20.12 (17.0%) 176.0% 26.50 5.67 433 329 0.0 (17.9) (12.97) (0.79) NA NM NM NM NM
Radius Health, Inc. RDUS 60.81 (5.0%) 146.2% 84.64 21.81 2,610 2,109 0.0 (82.3) (4.04) (2.42) NA NM NM NM NM
Revance Therapeutics, Inc. RVNC 38.81 27.2% 136.1% 42.41 14.10 1,089 956 0.3 (62.3) (3.24) (3.00) NM NM NM NM NM
SciClone Pharmaceuticals, Inc. SCLN 9.17 17.7% 8.0% 11.71 6.47 453 354 155.8 32.6 0.48 0.33 2.27x 10.8x 23.5x 27.8x NM
SteadyMed Ltd. STDY 3.16 (21.2%) NM 11.14 2.62 43 5 0.4 (22.4) (2.82) (2.36) 10.47x NM NM NM NM
The Medicines Company MDCO 42.01 24.9% 56.7% 43.79 23.32 2,917 2,982 480.7 (197.4) (0.50) (2.83) 6.20x NM NM NM NM
Tobira Therapeutics, Inc. TBRA 13.40 (1.6%) NM 24.31 8.75 252 198 0.0 (32.9) (85.41) (1.80) NA NM NM NM NM
Viking Therapeutics, Inc. VKTX 3.20 (49.1%) NM 10.23 3.13 31 15 0.0 0.0 (5.08) (2.91) NA NA NM NM NM
Vitae Pharmaceuticals, Inc. VTAE 14.36 79.1% (29.4%) 23.35 6.29 314 245 0.6 (39.4) (3.61) (2.18) NM NM NM NM NM
WAVE Life Sciences Pte. Ltd. WVE 16.25 NM NM 17.90 15.10 340 340 0.2 (9.9) (5.40) NM NM NM NM NM NM
Xenon Pharmaceuticals Inc. XENE 9.24 (9.6%) (30.0%) 23.50 7.78 133 67 17.2 (5.8) 3.28 (1.09) 3.91x NM NM NM NM
Zoetis Inc. ZTS 46.70 2.0% 3.9% 55.38 37.73 23,253 26,326 4,811.0 1,432.0 1.16 1.73 5.47x 18.4x 53.1x 27.0x 2.22x
Zosano Pharma Corporation ZSAN 2.75 (66.0%) NM 12.40 2.25 33 9 0.7 (20.1) (2.78) (2.50) 13.22x NM NM NM NM
ZS Pharma, Inc. ZSPH 89.96 71.9% 109.4% 91.24 25.51 2,273 2,076 0.0 (101.4) (5.47) (5.34) NA NM NM NM NM
Zynerba Pharmaceuticals, Inc. ZYNE 13.57 (50.5%) NM 43.00 12.00 125 80 0.3 (8.5) (2.56) (1.80) NM NM NM NM NM
Median (7.2%) 8.7% 5.47x 17.6x 27.7x 27.0x 1.45x
Healthcare Services Sector Update
Duff & Phelps 22
Definitions
PEG Ratio: Price Earnings to Growth
EBITDA: Earnings Before Interest, Taxes, Depreciation, and Amortization
EPS: Earnings Per Share
Enterprise Value: Market Capitalization + Total Debt + Preferred Equity + Minority Interest – Cash and Short-Term Investments
LTM: Last Twelve Months
Source: Capital IQ as of November 30, 2015

Duff & Phelps Copyright © 2013 Duff & Phelps LLC. All rights reserved. DPXXXXXX
For more information, visit www.duffandphelps.com
About Duff & Phelps
Duff & Phelps is the premier global valuation and corporate finance advisor with expertise in complex valuation, dispute and legal management consulting, M&A, restructuring, and compliance and regulatory consulting. The firm’s more than 2,000 employees serve a diverse range of clients from offices around the world.
M&A advisory and capital raising services in the United States are provided by Duff & Phelps Securities, LLC. Member FINRA/SIPC. Pagemill Partners is a Division of Duff & Phelps Securities, LLC. M&A advisory and capital raising services in the United Kingdom and Germany are provided by Duff & Phelps Securities Ltd., which is authorized and regulated by the Financial Conduct Authority.
Duff & Phelps Copyright © 2015 Duff & Phelps LLC. All rights reserved.
Brooks DexterHead of Healthcare M&AT: +1 424 249 164610100 Santa Monica Boulevard Suite 1100 Los Angeles, CA [email protected]
Laca Wong-HammondManaging DirectorT: +1 212 871 391555 East 52nd Street Floor 31 New York, NY [email protected]
West ClarkVice PresidentT: +1 212 871 973955 East 52 Street 31 Floor New York, NY [email protected]
Jordan LamposVice PresidentT: +1 424 249 166810100 Santa Monica Boulevard Suite 1100 Los Angeles, CA [email protected]
Contact Us: