healthy cities lancet
DESCRIPTION
Shaping cities for health: complexity and the planning ofurban environments in the 21st centuryTRANSCRIPT
The Lancet Commissions
www.thelancet.com Vol 379 June 2, 2012 2079
Lancet 2012; 379: 2079–108
Published OnlineMay 30, 2012DOI:10.1016/S0140-6736(12)60435-8
This online publication has been corrected. The corrected version fi rst appeared at thelancet.com on June 27, 2012
See Editorial page 2023
University College London, London, UK (Prof Y Rydin PhD, A Bleahu MA, Prof M Davies PhD, J D Dávila PhD, Prof S Friel PhD, G De Grandis PhD, Prof N Groce PhD, I Hamilton MSc, K-M Lai PhD, Prof C J Lim AA Dipl, J Martins MA, D Osrin MRCP, I Scott PhD, M Taylor MSc, J Wilson PhD); The Australian National University, Canberra, Australia (Prof S Friel); Federal University of Pelotas, Pelotas, Brazil (P C Hallal PhD); University of Otago, Wellington, New Zealand (Prof P Howden-Chapman PhD); Royal Melbourne Institute of Technology, Melbourne, VIC, Australia (I Ridley PhD); and The London School of Hygiene and Tropical Medicine, London, UK (P Wilkinson FRCP)
Correspondence to:Prof Yvonne Rydin, Bartlett School of Planning, UCL, Wates House, 22 Gordon Street, London WC1H 0QB, [email protected]
Shaping cities for health: complexity and the planning of urban environments in the 21st centuryYvonne Rydin, Ana Bleahu, Michael Davies, Julio D Dávila, Sharon Friel, Giovanni De Grandis, Nora Groce, Pedro C Hallal, Ian Hamilton, Philippa Howden-Chapman, Ka-Man Lai, C J Lim, Juliana Martins, David Osrin, Ian Ridley, Ian Scott, Myfanwy Taylor, Paul Wilkinson, James Wilson
Executive summaryThe Healthy Cities movement has been in process for almost 30 years, and the features needed to transform a city into a healthy one are becoming increasingly understood. What is less well understood, however, is how to deliver the potential health benefi ts and how to ensure that they reach all citizens in urban areas across the world. This task is becoming increasingly important because most of the world’s population already live in cities, and, with high rates of urbanisation, many millions more will soon do so in the coming decades.
The Commission met during November, 2009, to June, 2011, to provide an analysis of how health outcomes can be improved through modifi cation of the physical fabric of towns and cities and to discuss the role that urban planning can have in the delivering of health improvements. The Commission began from the premise that cities are complex systems, with urban health outcomes dependent on many interactions and feedback loops, so that prediction within the planning process is fraught with diffi culties and unintended consequences are common.
Although health outcomes are, on average, better in higher-income than in lower-income countries, urban health outcomes in specifi c cities cannot be assumed to improve with economic growth and demographic change. The so-called urban advantage—a term that encapsulates the health benefi ts of living in urban as opposed to rural areas—has to be actively created and maintained through policy interventions. Furthermore, average levels of health hide the eff ect of socioeconomic inequality within urban areas. Rich and poor people live in very diff erent epidemiological worlds, even within the same city. And such disparity occurs in both high-income and low-income countries.
Through case studies of sanitation and wastewater management, urban mobility, building standards and indoor air quality, the urban heat island eff ect (the diff erence in average temperatures between city centres and the surrounding countryside), and urban
agriculture, we draw attention to the complexities involved in the achievement of urban health improve-ment through urban planning policies. Complexity thinking stresses that the development of a plan that anticipates all future change for these issues will not be possible. Instead, incremental attempts to reach a goal need to be tried and tested. Such thinking suggests a new approach to planning for urban health—one with three main components.
First, there needs to be an emphasis on the promotion of experimentation through diverse projects and the use of trial and error to increase the understanding of how best to improve urban health outcomes in specifi c contexts. Localised projects can be sensitive to local circumstances and might use the resources of local communities and organisations to eff ectively deliver their goals. Urban planners need to be actively looking for windows of opportunity to promote such projects.
Second, this emphasis on learning from projects in turn suggests the need for strengthened assessment. However, a diff erent kind of assessment is needed to
Key messages
• Cities are complex systems, so urban health outcomes are dependent on many interactions
• The so-called urban advantage—whereby urban populations are, on average, at an advantage compared with rural populations in terms of health outcomes—has to be actively promoted and maintained
• Inequalities in health outcomes should be recognised at the urban scale
• A linear or cyclical planning approach is insuffi cient in conditions of complexity
• Urban planning for health needs should focus on experimentation through projects
• Dialogue between stakeholders is needed, enabling them to assess and critically analyse their working practices and learn how to change their patterns of decision making
The Lancet Commissions
2080 www.thelancet.com Vol 379 June 2, 2012
that usually used for public health interventions. In line with ideas of social learning, such assessment should be based on dialogue, deliberation, and discussion between key stakeholders rather than a technical exercise done by external experts. It would also call on a wide range of sources of knowledge, combining statistical data with the insights of tacit and experiential knowledge held by practitioners and the lay knowledge and experience of local communities. The aim is to create a community of practice of all stakeholders around the incorporation of health concerns into urban development and regeneration to support hands-on learning. Available measures of assessment might prove useful, but only if they are used to support dialogue between stakeholders.
Third, consideration of the value-laden nature of policy interventions and the creation of forums to debate the moral and ethical dimensions of diff erent approaches to urban health and city environments are essential. In-depth consultation, mediation, and deliberation are all processes that can be used to engage stakeholders in detailed and problem-orientated argumentation on potential solutions. They can also support the promotion of the urban health agenda itself, an agenda that often falls victim to powerful vested interests and, as a result, the needs of more vulnerable groups in urban societies are often forgotten. If health equity concerns are to be addressed, inclusion of the full range of community representatives within such deliberation and debate is essential.
The Commission’s fi ve key recommendations• City governments should work with a wide range of
stakeholders to build a political alliance for urban health. In particular, urban planners and those responsible for public health should be in com-munication with each other.
• Attention to health inequalities within urban areas should be a key focus when planning the urban environment, necessitating community rep re sen-tation in arenas of policy making and planning.
• Action needs to be taken at the urban scale to create and maintain the urban advantage in health outcomes through changes to the urban environment, providing a new focus for urban planning policies.
• Policy makers at national and urban scales would benefi t from undertaking a complexity analysis to understand the many overlapping relations aff ecting urban health outcomes. Policy makers should be alert to the unintended consequences of their policies.
• Progress towards eff ective action on urban health will be best achieved through local experimentation in a range of projects, supported by assessment of their practices and decision-making processes by prac titioners. Such eff orts should include prac-titioners and communities in active dialogue and mutual learning.
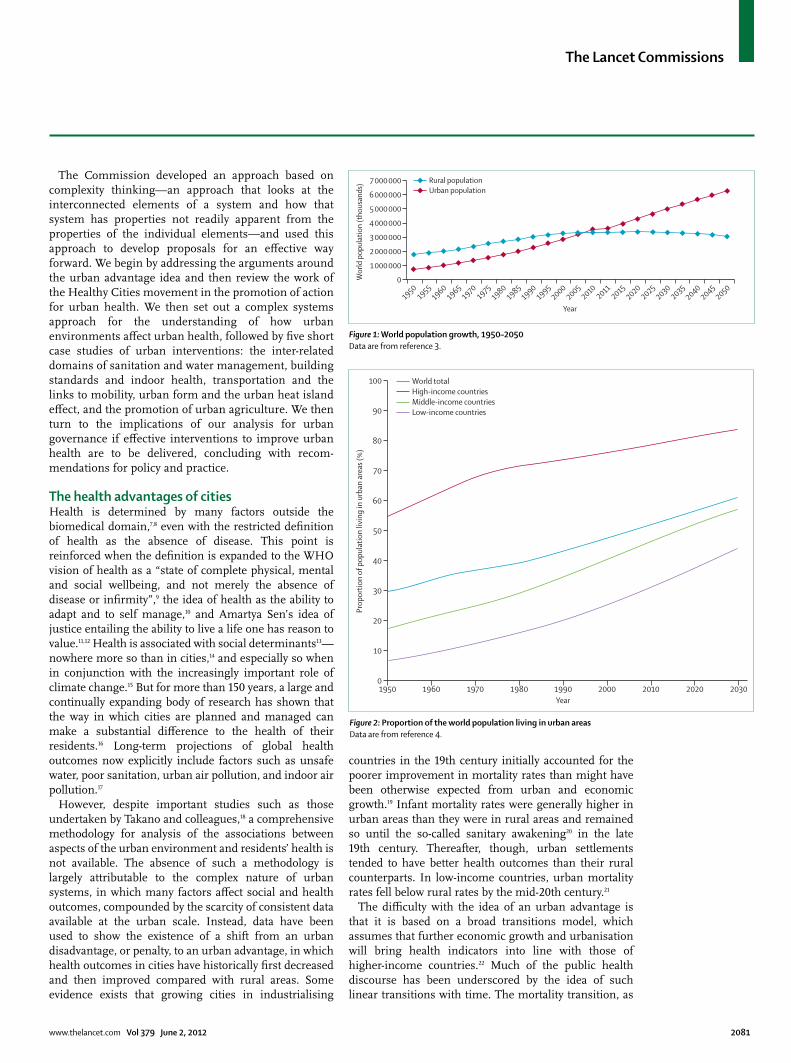
Introduction3·4 billion people—about half the world’s population––live in urban areas, and this number might rise to 6·3 billion by 2050.1 The proportion of the global population living in cities will be 60% by 2030,2 a 72% increase in 30 years (fi gures 1 and 2). Urban growth will be greatest in Africa and Asia, followed by Latin America and Oceania.5 Even in long-established urban areas in Europe, urban population growth during that period will reach almost 5%.5 This growth will not only result in more megacities (cities of more than 10 million people), increasingly concentrated in Asia, but also in more medium-sized cities, especially in Africa. UN estimates are that about 1 billion people, nearly a sixth of the global population, live in slum-like conditions. With the worldwide population predicted to expand to 9 billion by 2030, the number of people living in slum-like conditions could reach 2 billion.5
The understanding of how urban environments aff ect health outcomes and can produce health benefi ts is therefore an urgent priority, as recognised by WHO in their declaration of 2010 as the Year of Urban Health. From this perspective, there are reasons to be optimistic. The idea of the so-called urban advantage encapsulates the health benefi ts of living in urban as opposed to rural areas. However, factors such as economic growth and associated urban expansion cannot be relied on to drive improvements in health outcomes. Health improvements need to be actively planned for. The Healthy Cities movement has appreciated this fact and generated much action. Assessments have, however, pointed to a gap between aspirations and outcomes and limitations in the coherence of the models behind action.
In response to this problem, the UCL Lancet Commission met from November, 2009, to June, 2011, bringing together an interdisciplinary team of experts to under stand how better health outcomes can be delivered through inter-ventions in the urban environment in cities across the world, and to generate policy recommendations. We began with the defi nition of health as both the absence of ill health and the presence of mental and physical wellbeing,6 and the urban environment as the physical context within which urban activities take place, including the material fabric of buildings and infrastructure and their spatial organisation. The Commission focused on the potential for shaping the urban environment for better health outcomes; we explicitly did not address the issue of health-service provision within cities, but acknowledge that this is a key component of urban policy. We undertook expert-led reviews of available studies and desk-top research into the connection between urban planning and health in more than a dozen cities, with additional information provided by Commission members who have experience of working in many of these cities. The work informed discussions at monthly meetings with experts in public health, planning, architecture, building physics, engineering, development studies, anthropology, and philosophy.
The Lancet Commissions
www.thelancet.com Vol 379 June 2, 2012 2081
The Commission developed an approach based on complexity thinking—an approach that looks at the interconnected elements of a system and how that system has properties not readily apparent from the properties of the individual elements—and used this approach to develop proposals for an eff ective way forward. We begin by addressing the arguments around the urban advantage idea and then review the work of the Healthy Cities movement in the promotion of action for urban health. We then set out a complex systems approach for the understanding of how urban environments aff ect urban health, followed by fi ve short case studies of urban interventions: the inter-related domains of sanitation and water management, building standards and indoor health, transportation and the links to mobility, urban form and the urban heat island eff ect, and the promotion of urban agriculture. We then turn to the implications of our analysis for urban governance if eff ective interventions to improve urban health are to be delivered, concluding with recom-mendations for policy and practice.
The health advantages of citiesHealth is determined by many factors outside the biomedical domain,7,8 even with the restricted defi nition of health as the absence of disease. This point is rein forced when the defi nition is expanded to the WHO vision of health as a “state of complete physical, mental and social wellbeing, and not merely the absence of disease or infi rmity”,9 the idea of health as the ability to adapt and to self manage,10 and Amartya Sen’s idea of justice entailing the ability to live a life one has reason to value.11,12 Health is associated with social determinants13—nowhere more so than in cities,14 and especially so when in conjunction with the increasingly important role of climate change.15 But for more than 150 years, a large and continually expanding body of research has shown that the way in which cities are planned and managed can make a substantial diff erence to the health of their residents.16 Long-term projections of global health outcomes now explicitly include factors such as unsafe water, poor sanitation, urban air pollution, and indoor air pollution.17
However, despite important studies such as those undertaken by Takano and colleagues,18 a comprehensive methodology for analysis of the associations between aspects of the urban environment and residents’ health is not available. The absence of such a methodology is largely attributable to the complex nature of urban systems, in which many factors aff ect social and health outcomes, compounded by the scarcity of consistent data available at the urban scale. Instead, data have been used to show the existence of a shift from an urban disadvantage, or penalty, to an urban advantage, in which health outcomes in cities have historically fi rst decreased and then improved compared with rural areas. Some evidence exists that growing cities in industrialising
countries in the 19th century initially accounted for the poorer improvement in mortality rates than might have been otherwise expected from urban and economic growth.19 Infant mortality rates were generally higher in urban areas than they were in rural areas and remained so until the so-called sanitary awakening20 in the late 19th century. Thereafter, though, urban settlements tended to have better health outcomes than their rural counterparts. In low-income countries, urban mortality rates fell below rural rates by the mid-20th century.21
The diffi culty with the idea of an urban advantage is that it is based on a broad transitions model, which assumes that further economic growth and urbanisation will bring health indicators into line with those of higher-income countries.22 Much of the public health discourse has been underscored by the idea of such linear transitions with time. The mortality transition, as
19501955
19601965
19701975
19801985
19901995
20002005
20102011
20152020
20252030
20352040
20452050
0
1 000 000
2 000 000
3 000 000
4 000 000
5 000 000
6 000 000
7 000 000
Wor
ld p
opul
atio
n (t
hous
ands
)
Year
Rural populationUrban population
Figure 1: World population growth, 1950–2050Data are from reference 3.
1950 1960 1970 1980 1990 2000 2010 2020 20300
10
20
30
40
50
60
70
80
90
100
Prop
ortio
n of
pop
ulat
ion
livin
g in
urb
an a
reas
(%)
Year
World totalHigh-income countriesMiddle-income countriesLow-income countries
Figure 2: Proportion of the world population living in urban areasData are from reference 4.
The Lancet Commissions
2082 www.thelancet.com Vol 379 June 2, 2012
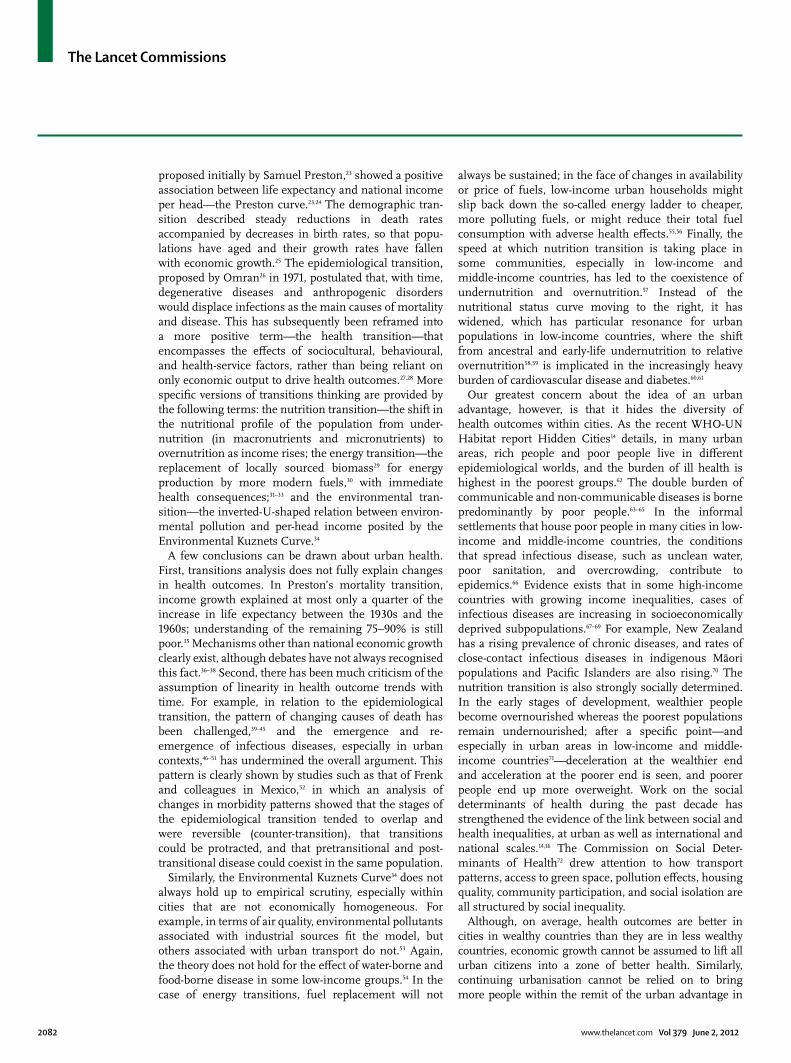
proposed initially by Samuel Preston,23 showed a positive association between life expectancy and national income per head—the Preston curve.23,24 The demographic tran-sition described steady reductions in death rates accompanied by decreases in birth rates, so that popu-lations have aged and their growth rates have fallen with economic growth.25 The epidemiological transition, proposed by Omran26 in 1971, postulated that, with time, degenerative diseases and anthropogenic disorders would displace infections as the main causes of mortality and disease. This has subsequently been reframed into a more positive term—the health transition—that encompasses the eff ects of sociocultural, behavioural, and health-service factors, rather than being reliant on only economic output to drive health outcomes.27,28 More specifi c versions of transitions thinking are provided by the following terms: the nutrition transition—the shift in the nutritional profi le of the population from under-nutrition (in macronutrients and micronutrients) to overnutrition as income rises; the energy transition—the replacement of locally sourced biomass29 for energy production by more modern fuels,30 with immediate health consequences;31–33 and the environmental tran-sition—the inverted-U-shaped relation between environ-mental pollution and per-head income posited by the Environmental Kuznets Curve.34
A few conclusions can be drawn about urban health. First, transitions analysis does not fully explain changes in health outcomes. In Preston’s mortality transition, income growth explained at most only a quarter of the increase in life expectancy between the 1930s and the 1960s; understanding of the remaining 75–90% is still poor.35 Mechanisms other than national economic growth clearly exist, although debates have not always recognised this fact.36–38 Second, there has been much criticism of the assumption of linearity in health out come trends with time. For example, in relation to the epidemiological transition, the pattern of changing causes of death has been challenged,39–45 and the emergence and re-emergence of infectious diseases, especially in urban contexts,46–51 has undermined the overall argument. This pattern is clearly shown by studies such as that of Frenk and colleagues in Mexico,52 in which an analysis of changes in morbidity patterns showed that the stages of the epidemiological transition tended to overlap and were reversible (counter-transition), that transitions could be protracted, and that pretran sitional and post-transitional disease could coexist in the same population.
Similarly, the Environmental Kuznets Curve34 does not always hold up to empirical scrutiny, especially within cities that are not economically homogeneous. For example, in terms of air quality, environmental pollutants associated with industrial sources fi t the model, but others associated with urban transport do not.53 Again, the theory does not hold for the eff ect of water-borne and food-borne disease in some low-income groups.54 In the case of energy transitions, fuel replace ment will not
always be sustained; in the face of changes in availability or price of fuels, low-income urban households might slip back down the so-called energy ladder to cheaper, more polluting fuels, or might reduce their total fuel consumption with adverse health eff ects.55,56 Finally, the speed at which nutrition transition is taking place in some communities, especially in low-income and middle-income countries, has led to the coexistence of undernutrition and overnutrition.57 Instead of the nutritional status curve moving to the right, it has widened, which has particular resonance for urban populations in low-income countries, where the shift from ancestral and early-life undernutrition to relative overnutrition58,59 is implicated in the increasingly heavy burden of cardiovascular disease and diabetes.60,61
Our greatest concern about the idea of an urban advantage, however, is that it hides the diversity of health outcomes within cities. As the recent WHO-UN Habitat report Hidden Cities14 details, in many urban areas, rich people and poor people live in diff erent epidemiological worlds, and the burden of ill health is highest in the poorest groups.62 The double burden of communicable and non-communicable diseases is borne predominantly by poor people.63–65 In the informal settlements that house poor people in many cities in low-income and middle-income countries, the conditions that spread infectious disease, such as unclean water, poor sanitation, and overcrowding, con tribute to epidemics.66 Evidence exists that in some high-income countries with growing income inequalities, cases of infectious diseases are increasing in socio economically deprived subpopulations.67–69 For example, New Zealand has a rising prevalence of chronic diseases, and rates of close-contact infectious diseases in indigenous Māori populations and Pacifi c Islanders are also rising.70 The nutrition transition is also strongly socially determined. In the early stages of development, wealthier people become overnourished whereas the poorest populations remain undernourished; after a specifi c point—and especially in urban areas in low-income and middle-income countries71—deceleration at the wealthier end and acceleration at the poorer end is seen, and poorer people end up more overweight. Work on the social determinants of health during the past decade has strengthened the evidence of the link between social and health inequalities, at urban as well as international and national scales.14,16 The Commission on Social Deter-minants of Health72 drew attention to how transport patterns, access to green space, pollution eff ects, housing quality, community participation, and social isolation are all structured by social inequality.
Although, on average, health outcomes are better in cities in wealthy countries than they are in less wealthy countries, economic growth cannot be assumed to lift all urban citizens into a zone of better health. Similarly, continuing urbanisation cannot be relied on to bring more people within the remit of the urban advantage in
The Lancet Commissions
www.thelancet.com Vol 379 June 2, 2012 2083
terms of improved health outcomes within cities. We need to be aware of the continual eff ect on health inequalities of social inequalities and diversity within cities. Low-income populations in cities might face an urban penalty of poorer health and wellbeing compared with their rural counterparts, even as their richer, urban neighbours are benefi ting from an urban advantage.73 Any understanding of these associations, therefore, needs to combine the recognition that, on average, urban populations in high-income countries fare better than those in low-income countries and better than rural populations, with the acknow ledgment of the persistence of intra-country and intra-urban inequality. Unfortunately for much of the world, information about intra-urban health diff erentials is scarce and the available statistics are aggregated at too high a level to draw conclusions about local patterns.74
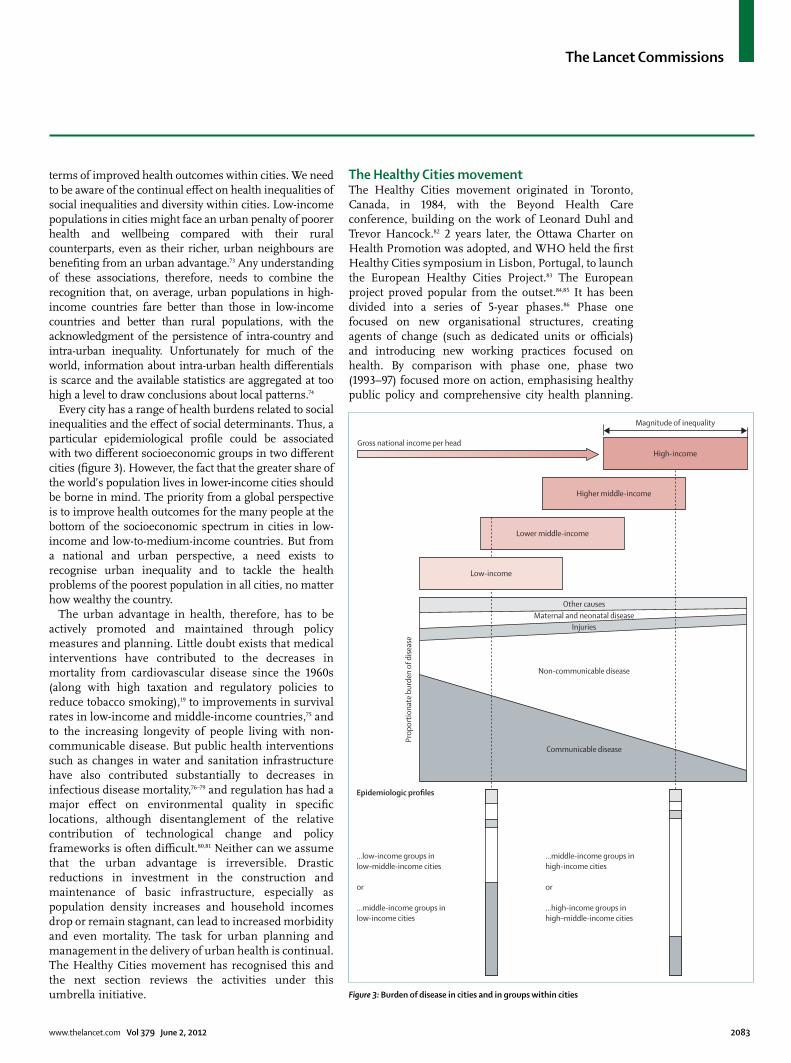
Every city has a range of health burdens related to social inequalities and the eff ect of social determinants. Thus, a particular epidemiological profi le could be associated with two diff erent socioeconomic groups in two diff erent cities (fi gure 3). However, the fact that the greater share of the world’s population lives in lower-income cities should be borne in mind. The priority from a global perspective is to improve health outcomes for the many people at the bottom of the socioeconomic spectrum in cities in low-income and low-to-medium-income countries. But from a national and urban perspective, a need exists to recognise urban inequality and to tackle the health problems of the poorest population in all cities, no matter how wealthy the country.
The urban advantage in health, therefore, has to be actively promoted and maintained through policy measures and planning. Little doubt exists that medical interventions have contributed to the decreases in mortality from cardiovascular disease since the 1960s (along with high taxation and regulatory policies to reduce tobacco smoking),19 to improvements in survival rates in low-income and middle-income countries,75 and to the increasing longevity of people living with non-commu nicable disease. But public health interventions such as changes in water and sanitation infrastructure have also contributed substantially to decreases in infectious disease mortality,76–79 and regulation has had a major eff ect on environmental quality in specifi c locations, although disentanglement of the relative contribution of technological change and policy frameworks is often diffi cult.80,81 Neither can we assume that the urban advantage is irreversible. Drastic reductions in investment in the construction and maintenance of basic infrastructure, especially as population density increases and household incomes drop or remain stagnant, can lead to increased morbidity and even mortality. The task for urban planning and management in the delivery of urban health is continual. The Healthy Cities movement has recognised this and the next section reviews the activities under this umbrella initiative.
The Healthy Cities movementThe Healthy Cities movement originated in Toronto, Canada, in 1984, with the Beyond Health Care conference, building on the work of Leonard Duhl and Trevor Hancock.82 2 years later, the Ottawa Charter on Health Promotion was adopted, and WHO held the fi rst Healthy Cities symposium in Lisbon, Portugal, to launch the European Healthy Cities Project.83 The European project proved popular from the outset.84,85 It has been divided into a series of 5-year phases.86 Phase one focused on new organisational structures, creating agents of change (such as dedicated units or offi cials) and introducing new working practices focused on health. By comparison with phase one, phase two (1993–97) focused more on action, emphasising healthy public policy and comprehensive city health planning.
Figure 3: Burden of disease in cities and in groups within cities
Gross national income per headHigh-income
Magnitude of inequality
Higher middle-income
Lower middle-income
Prop
ortio
nate
bur
den
of d
iseas
e
Other causesMaternal and neonatal disease
Injuries
Non-communicable disease
Communicable disease
Low-income
Epidemiologic profiles
...low-income groups in low–middle-income cities
or
...middle-income groups inlow-income cities
...middle-income groups in high-income cities
or
...high-income groups inhigh–middle-income cities
The Lancet Commissions
2084 www.thelancet.com Vol 379 June 2, 2012
Phase three (1998–2002) brought in cities that had been developing healthy-city projects outside its scope—there was also more of a focus on meeting fi xed criteria and on the development of a systematic approach to monitoring and assessment. Phase four (2003–07) promoted partnership working and intersectoral cooper ation, and WHO strengthened networking between cities.87 Phase fi ve (2008–12) makes strong links to the report by the Commission on Social Determinants of Health (2008) and has seen further substantial growth in the number of cities involved.88 By 2003, 1300 cities in 29 countries in Europe had signed up.87
WHO has also initiated Healthy City projects in North America, and, in 1991, selected several cities in low-income countries to help spread the initiative more widely, including Accra in Ghana, Johannesburg in South Africa, and São Paulo in Brazil; this eff ort was followed by a larger, second phase in 1995 and subsequent growth managed through WHO regional offi ces.89 A 2003 WHO report enumerated 16 participating countries in the Americas (including more than 200 communities in the USA and about the same number in Canada, and building on the Healthy Municipalities movement in Latin America), 100 cities in the Western Pacifi c region, 40 in southeast Asia, and the capital cities of 46 countries in Africa; some penetration has also been recorded in the Eastern Mediter ranean.87 The movement’s greatest concentration is in its areas of origin—namely, the European region and North America, although developments such as the Alliance for Healthy Cities, based in southeast Asia and Australia, are rapidly increasing its presence in those regions. This distribution shows the Healthy Cities movement’s origins in the concerns of European and North American cities as opposed to the public health concerns of lower-income countries, a challenge that the broader urban health domain has also faced in seeking to begin dialogue with all cities across income divides.
The Healthy Cities movement has taken a grounded and relational view of health, leading to an emphasis on community participation, empowerment, and institution building. As a result it has avoided specifying particular actions that should be taken, in favour of an approach that emphasises continuous improvement, as stated in the WHO’s Health Promotion Glossary: “a healthy city is one that is continually creating and improving those physical and social environments and expanding those community resources which enable people to mutually support each other in performing all the functions of life and developing to their maximum potential”.90 This approach resonates with the approach to human rights, which comes out of the International Covenant for Economic, Social and Cultural Rights (ICESCR),91 and stipulates that there is a minimum set of core obligations that should be met and, beyond this, an obligation to progressively realise the right in question—eg, the right to health.
The movement thus has a strong emphasis on process, with three main parts. The fi rst is the building of political commitment and common vision locally, with a view to the movement of health up the urban policy and political agenda. Second, there is involvement of a wide range of stakeholders including local communities, fi tting within the ethos of Local Agenda 21 (the community-level movement for sustainable development set out at the Rio Summit 1992) and moving away from an expert-led health agenda towards one that emphasises community empowerment and participation.85,92,93 Third, strategy development within local government is expected—in the form of a city health plan—based on intersectoral partnerships and the aforementioned stakeholder engagement. Such strategy development goes along with the development of health information systems, the integration of health into a range of other urban policy and planning documents, and the use of procedures to assess eff ects.
This emphasis on process has extended into the assessment of the Healthy Cities movement and has led to some criticism that the discernment of on-the-ground eff ects is diffi cult. Ritsatakis’ 2009 assessment of phase three of the Europe region pointed to “an undeniable shift from rhetoric to action in at least half of the cities” but also stated that “few cities had moved to tackle the intermediate determinants of health”.94 The phase four assessment showed that 94% of cities had agreed on partnership between organisations and that 76% of cities were implementing collaborative plans, projects, or programmes with greater cross-sector involvement. City health profi les, city health development plans, and a healthy ageing profi le were common; health-eff ect assessment less so. According to the WHO, two-thirds of healthy city coordinators were “actively involved with urban planners and infl uential in shaping planning programmes”.95 Three levels of integration were distinguished: focus on essential provisions such as shelter, food, clean water, clean air, and eff ective sewerage; integration of specifi c measures into urban environments to encourage, among other things, mobil-ity and social cohesion; and a holistic approach in which health is fully integrated into urban planning. Most cities were struggling with the holistic approach. According to de Leeuw and Skovaard, individual case studies have also shown that “implementing these intersectoral policies has proved more diffi cult than expected”.96 All these diffi culties were compounded in the case of cities in lower-income countries.97 Overall, assessments of all who signed up to the Healthy Cities movement have repeatedly drawn attention to the limitations in the scale of action compared with original aspirations.96,98–102
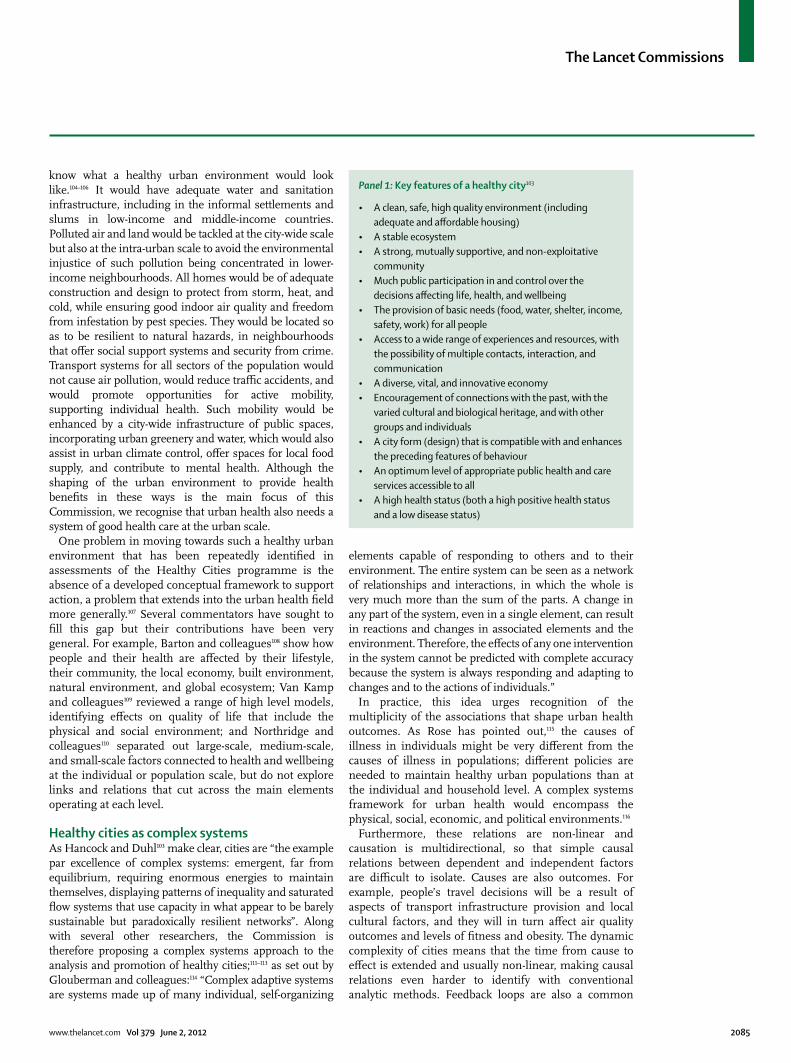
These aspirations were indeed ambitious (panel 1). Our focus was more restricted, concentrating on how urban planning could shape the physical aspects of an urban environment to promote health. The review of research undertaken by our Commission showed that many people
The Lancet Commissions
www.thelancet.com Vol 379 June 2, 2012 2085
know what a healthy urban environment would look like.104–106 It would have adequate water and sanitation infrastructure, including in the informal settlements and slums in low-income and middle-income countries. Polluted air and land would be tackled at the city-wide scale but also at the intra-urban scale to avoid the environmental injustice of such pollution being concentrated in lower-income neighbourhoods. All homes would be of adequate construction and design to protect from storm, heat, and cold, while ensuring good indoor air quality and freedom from infestation by pest species. They would be located so as to be resilient to natural hazards, in neighbourhoods that off er social support systems and security from crime. Transport systems for all sectors of the population would not cause air pollution, would reduce traffi c accidents, and would promote opportunities for active mobility, supporting individual health. Such mobility would be enhanced by a city-wide infrastructure of public spaces, incorporating urban greenery and water, which would also assist in urban climate control, off er spaces for local food supply, and contribute to mental health. Although the shaping of the urban environment to provide health benefi ts in these ways is the main focus of this Commission, we recognise that urban health also needs a system of good health care at the urban scale.
One problem in moving towards such a healthy urban environment that has been repeatedly identifi ed in assessments of the Healthy Cities programme is the absence of a developed conceptual framework to support action, a problem that extends into the urban health fi eld more generally.107 Several commentators have sought to fi ll this gap but their contributions have been very general. For example, Barton and colleagues108 show how people and their health are aff ected by their lifestyle, their community, the local economy, built en vironment, natural environment, and global eco system; Van Kamp and colleagues109 reviewed a range of high level models, identifying eff ects on quality of life that include the physical and social environment; and Northridge and colleagues110 separated out large-scale, medium-scale, and small-scale factors connected to health and wellbeing at the individual or population scale, but do not explore links and relations that cut across the main elements operating at each level.
Healthy cities as complex systemsAs Hancock and Duhl103 make clear, cities are “the example par excellence of complex systems: emergent, far from equilibrium, requiring enormous energies to maintain themselves, displaying patterns of inequality and saturated fl ow systems that use capacity in what appear to be barely sustainable but paradoxically resilient networks”. Along with several other researchers, the Commission is therefore proposing a complex systems approach to the analysis and promotion of healthy cities;111–113 as set out by Glouberman and colleagues:114 “Complex adaptive systems are systems made up of many individual, self-organizing
elements capable of responding to others and to their environment. The entire system can be seen as a network of relationships and interactions, in which the whole is very much more than the sum of the parts. A change in any part of the system, even in a single element, can result in reactions and changes in associated elements and the environment. Therefore, the eff ects of any one intervention in the system cannot be predicted with complete accuracy because the system is always responding and adapting to changes and to the actions of individuals.”
In practice, this idea urges recognition of the multiplicity of the associations that shape urban health outcomes. As Rose has pointed out,115 the causes of illness in individuals might be very diff erent from the causes of illness in populations; diff erent policies are needed to maintain healthy urban populations than at the individual and household level. A complex systems framework for urban health would encompass the physical, social, economic, and political environ ments.116
Furthermore, these relations are non-linear and causation is multidirectional, so that simple causal relations between dependent and independent factors are diffi cult to isolate. Causes are also outcomes. For example, people’s travel decisions will be a result of aspects of transport infrastructure provision and local cultural factors, and they will in turn aff ect air quality outcomes and levels of fi tness and obesity. The dynamic complexity of cities means that the time from cause to eff ect is extended and usually non-linear, making causal relations even harder to identify with conventional analytic methods. Feedback loops are also a common
Panel 1: Key features of a healthy city103
• A clean, safe, high quality environment (including adequate and aff ordable housing)
• A stable ecosystem• A strong, mutually supportive, and non-exploitative
community• Much public participation in and control over the
decisions aff ecting life, health, and wellbeing• The provision of basic needs (food, water, shelter, income,
safety, work) for all people• Access to a wide range of experiences and resources, with
the possibility of multiple contacts, interaction, and communication
• A diverse, vital, and innovative economy• Encouragement of connections with the past, with the
varied cultural and biological heritage, and with other groups and individuals
• A city form (design) that is compatible with and enhances the preceding features of behaviour
• An optimum level of appropriate public health and care services accessible to all
• A high health status (both a high positive health status and a low disease status)
The Lancet Commissions
2086 www.thelancet.com Vol 379 June 2, 2012
feature of complex systems: as well as travel behaviour being a result of the operation of public transport systems, the levels and patterns of public transport use aff ect its viability. Negative feedback loops help to maintain equilibrium. For example, fare subsidies can maintain the viability of public transport. Positive feedback loops support irreversible unstable expansions, such as the growth of new suburbs, which tend to evolve with new motorways.116 As a result of these aspects, interventions in urban systems are prone to unintended consequences and much uncertainty exists in the prediction of their eff ects.
Cities can therefore be thought of as networks with emergent properties. For example, the city can be seen from an ecological perspective, providing the context (or habitat) for health and operating as a networked system that is dependent on the functioning of its parts and connections.117 However, this notion should not lead to an assumption of progress towards any steady state. A city’s ability to cope with breakdowns (eg, economic crises, natural disasters, or social unrest) and modify itself and change to meet the always emerging, changing require ments for life is crucial, although some solutions, such as gated communities for the very wealthy, might increase health inequalities. Prigogine and Nicolis119 drew attention to the fact that new “fl oats in disorder”, so-called dissipative structures, can arise in times of disorder. Such dissipative structures are characterised by fl ows in and out of the system, which maintains a degree of stability, even though the system is not at equilibrium. Although the Healthy Cities movement was built on an ecological metaphor of the city, which encompasses many of these aspects, that insight has not been fully drawn on in the analysis of specifi c cases or devel opment of broader recom-mendations for planning processes.119,120
Diversity is another key aspect of this complexity. Intra-urban diversity means that cities are a patchwork of
communities, both those that are geographically located and those that are not. The social complexity of plural stakeholders with diff ering and often confl icting interests compounds this aspect.121 The interests of car owners, who are more likely to have higher incomes than those who do not own cars, often confl ict with those who walk or cycle as their main mode of transport. Business interests, whose activities rely on car use, might demand parking provision and sites in out-of-centre locations, making viable and aff ordable public transport (largely used by low-income residents) more diffi cult to sustain. Such focus on diversity within a particular city shows how urban systems operate with a high level of specifi city so that understanding of the particular patterns in each location and among particular populations is important.
The complexity of urban health systems varies with scale. Most existing models analyse systems very generally and do not consider diff erent levels and the details of interconnectedness. For example, the healthy-cities framework devised by Barton and Grant108 regards global ecosystems, the natural environment, the built environment, activities, the local economy, community, lifestyles, and people as successive layers, with healthy people at the centre; by contrast with this approach, a complex systems approach emphasises the intercon-nectedness that exists across layers. Northridge and colleagues110 built some more interconnections and some feedback loops, but they fundamentally see each level (large-scale, medium-scale, and small-scale factors) aff ecting the ones below and above, rather than tracing more complex linkages.
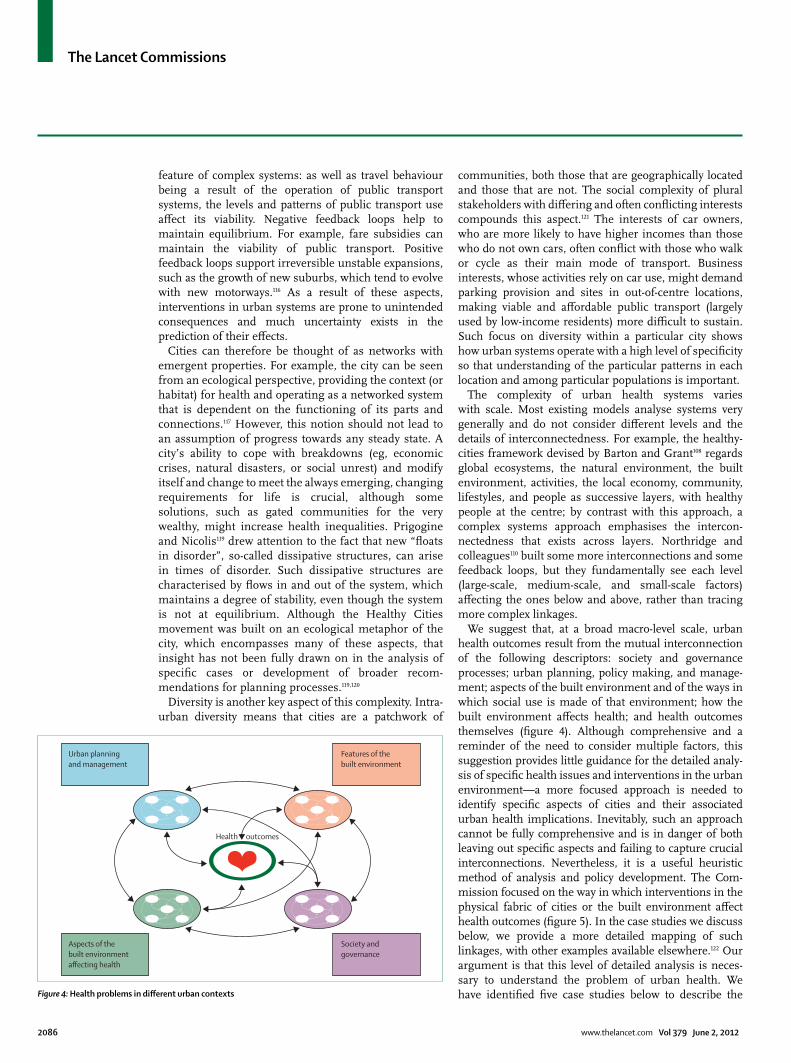
We suggest that, at a broad macro-level scale, urban health outcomes result from the mutual interconnection of the following descriptors: society and governance processes; urban planning, policy making, and manage-ment; aspects of the built environment and of the ways in which social use is made of that environment; how the built environment aff ects health; and health outcomes themselves (fi gure 4). Although comprehensive and a reminder of the need to consider multiple factors, this suggestion provides little guidance for the detailed analy-sis of specifi c health issues and interventions in the urban environment—a more focused approach is needed to identify specifi c aspects of cities and their associated urban health implications. Inevitably, such an approach cannot be fully comprehensive and is in danger of both leaving out specifi c aspects and failing to capture crucial interconnections. Nevertheless, it is a useful heuristic method of analysis and policy development. The Com-mission focused on the way in which interventions in the physical fabric of cities or the built environment aff ect health outcomes (fi gure 5). In the case studies we discuss below, we provide a more detailed mapping of such linkages, with other examples available elsewhere.122 Our argument is that this level of detailed analysis is neces-sary to understand the problem of urban health. We have identifi ed fi ve case studies below to describe the Figure 4: Health problems in diff erent urban contexts
Urban planning and management
Features of thebuilt environment
Health outcomes
Aspects of thebuilt environmentaffecting health
Society andgovernance
❤

The Lancet Commissions
www.thelancet.com Vol 379 June 2, 2012 2087
argument of complexity in greater depth: sanitation and the management of wastewater, building standards and indoor air quality, urban transportation and mobility, measures to deal with the urban heat island, and urban agriculture initiatives. These case studies are not intended as best-practice examples. Rather, they are used to explore some of the complexities of urban systems and to understand some of the factors that shape the tenuous connections between a particular urban planning policy and better health outcomes.
Sanitation and wastewater managementBackgroundIn high-income countries, any household can expect to have potable water supplied regularly to internal bathrooms and kitchens, a fl ushing toilet, and storm drainage to prevent fl ooding. In low-income and middle-income countries, this set of standards is often seen in only the wealthiest neighbourhoods and in well managed and comparatively wealthy municipalities. Water and sanitation services, however, are consistently and notori-ously absent in badly managed cities and in the poorest parts of many cities. Research has focused on the scarcity of these resources in informal settlements,123 but the problem is not confi ned to such settlements.
SanitationInvestment into infrastructure to supply water tends to be seen as indisputably desirable by politicians and citizens alike, whereas, in political and cultural terms, the disposal of human excreta is comparatively neglected. Because isolation of individual risk-factors in the faecal-oral infection route is not methodologically possible, research and policy making resorts to a composite risk factor of water, sanitation, and hygiene.124 Diseases related to poor water, sanitation, and hygiene in urban areas include
diarrhoeal diseases, other gastrointestinal infections, trachoma, schistosomiasis, and helminthiasis.125 The links between sanitation, disease, and dignity have spurred some to argue that access to adequate sanitation—defi ned here as the disposal of human excreta to prevent disease and safeguard privacy and dignity126—should be thought of as a basic human right.127
Access to sanitation exists at diff erent levels, ranging from open defecation, to unimproved, shared, and improved facilities. Progress, for example, towards the UN Millennium Development Goals, is often measured in terms of increased access to improved facilities—defi ned as provision of hygienic separation of human excreta from human contact, as is the case with piped sewer systems, pit latrines, and composting toilets. But many systems that might be classifi ed as improved are, in practice, well below the standard needed to reduce the risk of human contact with faeces. Such is the case in dense urban informal settlements, where the quality of construction and maintenance of individual facilities might be inadequate, waste from pit latrines is sometimes dumped near sources of drinking water, or fees for the use of toilets might be set too high for some users.126,128 Even with low standards, an estimated 2·6 billion people do not have access to improved sanitation, the largest proportion being in south Asia, followed by eastern Asia and sub-Saharan Africa.127
Urban areas generally fare better than rural areas, suggesting a potential for the creation of a greater urban advantage. However, methodological diffi culties exist in the accurate assessment of the numbers and proportions of people with access to water and sanitation services in urban areas. Statistics are usually derived from household surveys, population censuses, or local utilities. Quite apart from the fact that criteria for the defi nition of urban and rural vary substantially across
Figure 5: Health outcomes and the urban environment: connections
Population
Energy
Water
Sanitation
Solid waste
Food
Service demandand supply
Social cohesion
Morphology andland use
Crime
Urban climate
Heat and coldChronic disease
Air quality
Physical activity
Water quality
Land contamination
Disease vectors and pests
Mental health
Injury and violence
Infectious disease
Transport (mode or distance)
Quality of urban environment
Infrastructure
NoiseBuildings
The Lancet Commissions
2088 www.thelancet.com Vol 379 June 2, 2012
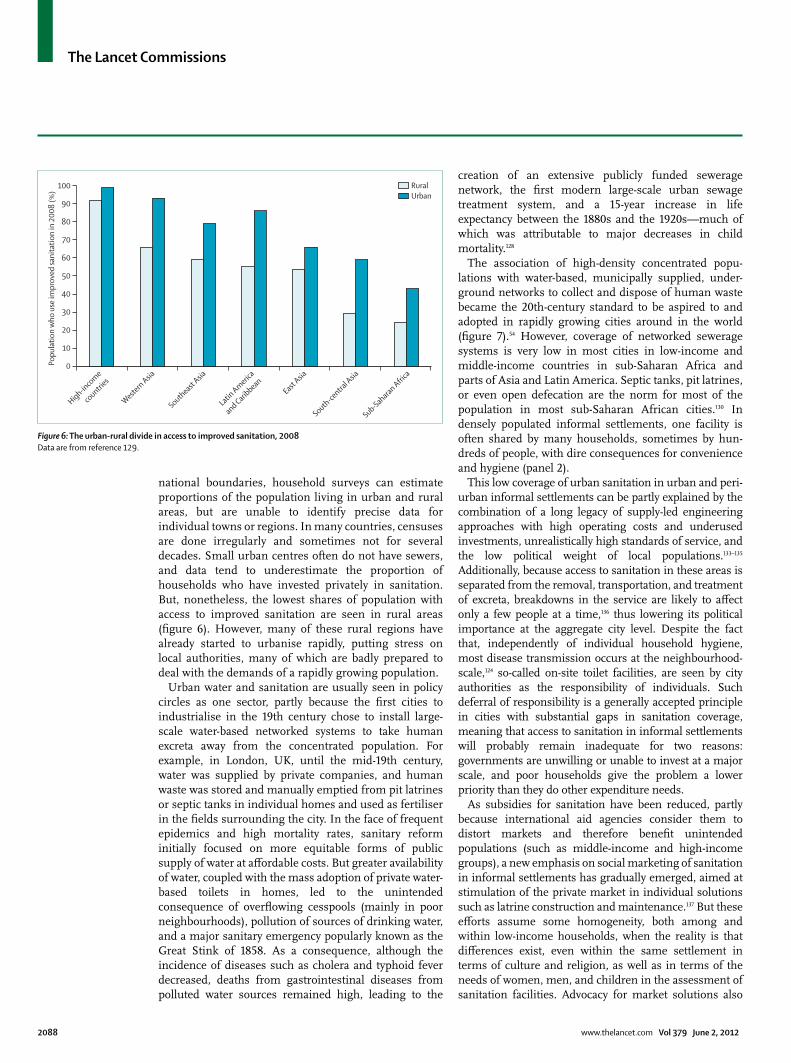
national boundaries, household surveys can estimate proportions of the popu lation living in urban and rural areas, but are unable to identify precise data for individual towns or regions. In many countries, censuses are done irregularly and some times not for several decades. Small urban centres often do not have sewers, and data tend to underestimate the proportion of households who have invested privately in sanitation. But, nonetheless, the lowest shares of population with access to improved sanitation are seen in rural areas (fi gure 6). However, many of these rural regions have already started to urbanise rapidly, putting stress on local authorities, many of which are badly prepared to deal with the demands of a rapidly growing population.
Urban water and sanitation are usually seen in policy circles as one sector, partly because the fi rst cities to industrialise in the 19th century chose to install large-scale water-based networked systems to take human excreta away from the concentrated population. For example, in London, UK, until the mid-19th century, water was supplied by private companies, and human waste was stored and manually emptied from pit latrines or septic tanks in individual homes and used as fertiliser in the fi elds surrounding the city. In the face of frequent epidemics and high mortality rates, sanitary reform initially focused on more equitable forms of public supply of water at aff ordable costs. But greater availability of water, coupled with the mass adoption of private water-based toilets in homes, led to the unintended consequence of overfl owing cesspools (mainly in poor neighbourhoods), pollution of sources of drinking water, and a major sanitary emergency popularly known as the Great Stink of 1858. As a consequence, although the incidence of diseases such as cholera and typhoid fever decreased, deaths from gastrointestinal diseases from polluted water sources remained high, leading to the
creation of an extensive publicly funded sewerage network, the fi rst modern large-scale urban sewage treatment system, and a 15-year increase in life expectancy between the 1880s and the 1920s—much of which was attributable to major decreases in child mortality.128
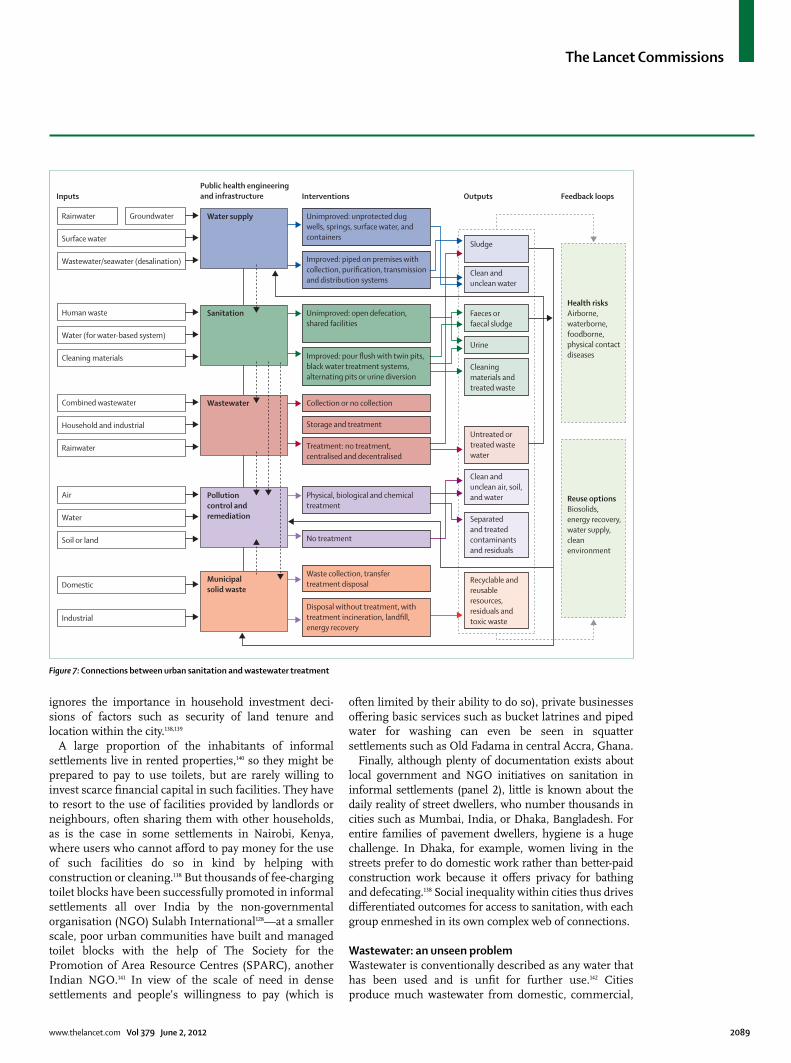
The association of high-density concentrated popu-lations with water-based, municipally supplied, under-ground networks to collect and dispose of human waste became the 20th-century standard to be aspired to and adopted in rapidly growing cities around in the world (fi gure 7).54 However, coverage of networked sewerage systems is very low in most cities in low-income and middle-income countries in sub-Saharan Africa and parts of Asia and Latin America. Septic tanks, pit latrines, or even open defecation are the norm for most of the population in most sub-Saharan African cities.130 In densely populated informal settlements, one facility is often shared by many households, sometimes by hun-dreds of people, with dire consequences for convenience and hygiene (panel 2).
This low coverage of urban sanitation in urban and peri-urban informal settlements can be partly explained by the combination of a long legacy of supply-led engineering approaches with high operating costs and underused investments, unrealistically high standards of service, and the low political weight of local popul ations.133–135 Additionally, because access to sanitation in these areas is separated from the removal, transportation, and treatment of excreta, breakdowns in the service are likely to aff ect only a few people at a time,136 thus lowering its political importance at the aggregate city level. Despite the fact that, independently of individual household hygiene, most disease trans mission occurs at the neighbourhood-scale,124 so-called on-site toilet facilities, are seen by city authorities as the responsibility of individuals. Such deferral of respon sibility is a generally accepted principle in cities with substantial gaps in sanitation coverage, meaning that access to sanitation in informal settlements will probably remain inadequate for two reasons: governments are unwilling or unable to invest at a major scale, and poor households give the problem a lower priority than they do other expenditure needs.
As subsidies for sanitation have been reduced, partly because international aid agencies consider them to distort markets and therefore benefi t unintended populations (such as middle-income and high-income groups), a new emphasis on social marketing of sanitation in informal settlements has gradually emerged, aimed at stimulation of the private market in individual solutions such as latrine construction and maintenance.137 But these eff orts assume some homogeneity, both among and within low-income households, when the reality is that diff er ences exist, even within the same settlement in terms of culture and religion, as well as in terms of the needs of women, men, and children in the assessment of sanitation facilities. Advocacy for market solutions also
Figure 6: The urban-rural divide in access to improved sanitation, 2008Data are from reference 129.
High-inco
me
countri
es
Western Asia
Southeast Asia
Latin Americ
a
and Caribbean
East Asia
South-centra
l Asia
Sub-Saharan Africa
0
10
20
30
40
50
70
90
60
80
100
Popu
latio
n w
ho u
se im
prov
ed sa
nita
tion
in 2
008
(%)
RuralUrban
The Lancet Commissions
www.thelancet.com Vol 379 June 2, 2012 2089
ignores the importance in household investment deci-sions of factors such as security of land tenure and location within the city.138,139
A large proportion of the inhabitants of informal settlements live in rented properties,140 so they might be prepared to pay to use toilets, but are rarely willing to invest scarce fi nancial capital in such facilities. They have to resort to the use of facilities provided by landlords or neighbours, often sharing them with other households, as is the case in some settlements in Nairobi, Kenya, where users who cannot aff ord to pay money for the use of such facilities do so in kind by helping with construction or cleaning.138 But thousands of fee-charging toilet blocks have been successfully promoted in informal settlements all over India by the non-governmental organisation (NGO) Sulabh International128—at a smaller scale, poor urban communities have built and managed toilet blocks with the help of The Society for the Promotion of Area Resource Centres (SPARC), another Indian NGO.141 In view of the scale of need in dense settlements and people’s willingness to pay (which is
often limited by their ability to do so), private businesses off ering basic services such as bucket latrines and piped water for washing can even be seen in squatter settlements such as Old Fadama in central Accra, Ghana.
Finally, although plenty of documentation exists about local government and NGO initiatives on sanitation in informal settlements (panel 2), little is known about the daily reality of street dwellers, who number thousands in cities such as Mumbai, India, or Dhaka, Bangladesh. For entire families of pavement dwellers, hygiene is a huge challenge. In Dhaka, for example, women living in the streets prefer to do domestic work rather than better-paid construction work because it off ers privacy for bathing and defecating.138 Social inequality within cities thus drives diff erentiated outcomes for access to sanitation, with each group enmeshed in its own complex web of connections.
Wastewater: an unseen problemWastewater is conventionally described as any water that has been used and is unfi t for further use.142 Cities produce much wastewater from domestic, commercial,
Figure 7: Connections between urban sanitation and wastewater treatment
Physical, biological and chemical treatment
Inputs Interventions Outputs Feedback loops
Health risksAirborne, waterborne, foodborne,physical contact diseases
Reuse optionsBiosolids,energy recovery, water supply,clean environment
Public health engineeringand infrastructure
Rainwater
Surface water
Wastewater/seawater (desalination)
Groundwater Water supply Unimproved: unprotected dug wells, springs, surface water, and containers
Improved: piped on premises with collection, purification, transmissionand distribution systems
Human waste
Water (for water-based system)
Cleaning materials
Sanitation Unimproved: open defecation, shared facilities
Improved: pour flush with twin pits,black water treatment systems, alternating pits or urine diversion
Sludge
Clean andunclean water
Faeces or faecal sludge
Urine
Cleaning materials andtreated waste
Combined wastewater
Household and industrial
Rainwater
Wastewater Collection or no collection
Storage and treatment
Treatment: no treatment, centralised and decentralised
Untreated or treated wastewater
Air
Water
Soil or land
Pollution control and remediation
No treatment
Clean and unclean air, soil,and water
Separated and treated contaminants and residuals
Waste collection, transfer treatment disposalDomestic
Industrial
Municipal solid waste
Disposal without treatment, withtreatment incineration, landfill, energy recovery
Recyclable and reusable resources, residuals and toxic waste
The Lancet Commissions
2090 www.thelancet.com Vol 379 June 2, 2012
and industrial sources, as well as stormwater and effl uents from urban and periurban agriculture.143 Untreated urban waste water contains high concentrations of organic material, pathogens, and toxic compounds, ranging from heavy metals to newly emerging contam-inants such as endocrine disrupting substances and pharmaceutical products,144 a trend that is especially alarming when discharges occur into sources of drinking water.145 The volume and level of pollution of wastewater in a city depend on a range of factors, such as a city’s economic structure, income levels, and patterns of pro-duction and consumption. Middle-income cities with a high presence of manufacturing industries, for instance, are likely to have a broader range of chemicals in their wastewater than would a high-income city with little or no presence of manufacturing industries.
The management, treatment, and disposal of waste-water are thus crucial to avoid human and environmental exposure to potential hazards. Additionally, faced with water scarcity in many regions, water reuse is increasingly being advocated. Yet wastewater treatment, if it exists, is often scarcely available or functions poorly;146 an average
of 35% of total wastewater in Asia is treated, with the proportion decreasing to 14% in Latin America and the Caribbean, and to zero in sub-Saharan Africa.147 In middle-income countries, city sewerage systems have been growing faster than have wastewater treatment systems, which draws attention to the fact that even in such countries, budgets for infrastructure can come from diff erent departments so that replacement and maintenance might not be synchronised.
Wastewater treatment is planned, engineered, and managed to remove, treat, and dispose of waste in the liquid medium from human and environmental contact (fi gure 7). Successful wastewater treatment should provide a point of waste collection, waste conveyance, treatment, and storage, and fi nal discharge and disposal of the treated waste, which means that wider planning, social, and engineering issues need to be considered. In the Slum Sanitation Programme in Mumbai, India,148 25% of the new toilet blocks built did not have a water connection to fl ush the toilets and about 70% of the toilet blocks were not connected to sewerage (panel 2). The consequence is that this project, which was sponsored by the World Bank, will not receive a full return on its investment—in terms of improvement of the living conditions in slums—because of this disconnect in the infrastructure system.
In another project, the Mumbai Sewage Disposal Project, sewerage was successfully connected to the sewage treatment plant, but the huge amount of sludge that was produced shifted the problem of original sanitation and wastewater problem to solid waste disposal. The project might have to stop because the civil administration did not anticipate this consequence and does not know how to deal with the amount of solid waste. An estimated 1500 metric tonnes of sludge would be generated daily from 2300 million L of water. Sludge treatment is a major cost in a sewage treatment plant—up to 50% of the total cost of wastewater treatment.149 From a public and environmental health point of view, although this sludge can be treated, it cannot be disposed of within the local environment. Sludge concentrates the pollutants from the sewage and if not disposed of properly can pose a new environmental threat—eg, by contaminating land and clean water sources.
The problem of sanitation and wastewater provision is not unique to low-income countries. In a high-income urban area such as London, UK, the sanitation system is mostly water-based and wastewater treatment is crucially important to protect the health of the city. The combined sewer network funnels both sewage and rain water to the sewage treatment plant. At times of heavy rainfall, untreated raw sewage overfl ows directly into the River Thames and, with a growing population living and working in the city and a potentially increasing frequency of heavy rainfall with climate change, this issue is becoming a major public health and environmental concern. As a result, Thames Water, the Environment
Panel 2: The Slum Sanitation Programme in Mumbai, India
Mumbai’s fi rst sanitary sewer system was built in the 1860s. In 1979, a 25-year sewerage system masterplan was launched, establishing an infrastructure development strategy that consisted of a system of seven zones, each operating independently of one another. This plan was completed in 2004 and now encompasses more than 1500 km of sewers, with a total capacity of 2530 million L per day. The World-Bank-funded Mumbai Sewage Disposal Project is one of several projects launched under the plan.
Half of Mumbai’s population of 11·2 million live in areas classifi ed as slums (covering only 8% of the land area), most of which has poor access or no access at all to wastewater systems so that their residents have to use public toilets or defecate in the open. In these slums, the use of conventional water-based sewer-system infrastructure is ruled out by tenure insecurity, restricted space, and aff ordability considerations. Thus, an important component of the Sewage Disposal Project is the Slum Sanitation Programme (SSP). The largest programme of its kind in India, it seeks to provide access to adequate sanitation (one toilet per 50 people), by 2025, to one million people who were living in slums on municipal land in 1995.131 The scheme is demand-driven and premised on participation, partnership, and cost recovery, the fi rst of which was a prerequisite for World Bank funding (matched by the State Government). It builds on the idea that a sense of ownership encourages communities to maintain the toilet blocks more eff ectively than would the state.132
Construction of the toilet blocks was allocated to two private construction fi rms and one large local non-governmental organisation through competitive bidding. By mid-2005, the SSP had built 328 two-storey and three-storey toilet blocks with more than 5000 toilets, reaching an estimated 400 000 slum dwellers. Blocks are administered by local community organisations charging either monthly family fees or single-use fees. Fees cover regular maintenance, including water and electricity costs, with minor repairs done by the community, and the local authority undertaking major repairs. Some toilet blocks have also become community centres, providing space for teaching and meetings. Fees have allowed high standards of care to be maintained, but evidence exists that in some of the poorer settlements, only the wealthier families are able to pay the fees, with the remaining population still having to resort to open defecation.132
The Lancet Commissions
www.thelancet.com Vol 379 June 2, 2012 2091
Agency, the Port of London Authority, and the Greater London Authority have proposed the construction of the Thames Tunnel, running under the river to capture and store sewage that would otherwise be discharged and return it to sewage works for treatment. Construction of this tunnel is a major investment to deal with the unintended consequences of a historic decision to have a combined sewer network in conditions of unanticipated urban growth and climate change.
Not all societies treat wastewater as waste. With separation of household wastewater into black water (from toilets), grey water (from showers and sinks), brown water (containing faecal matter), and yellow water (containing urine), diff erent waste streams can be treated and reused. Increasingly, urban planning and building design are regarding the recycling of wastewater as an integral part of sustainable buildings and developments. At a city-wide scale, energy can be generated through anaerobic digestion of sludge or wastewater recycled back for reuse in gardening or, after further purifi cation, to produce a potable water supply, as happens in Singapore and is proposed in Australia. Where urban and periurban agriculture is present, there is the potential for wastewater to complement other sources of irrigation and to potentially help recycle plant nutrients such as nitrogen and phosphorus, thus providing an eff ective replacement for chemical fertilisers.143,150 The main challenge here is the short environmental cycle to treat pathogens and hazardous chemicals in the wastewater so that innovative technologies and vigilant practices are essential to secure the safe use of this resource.151,152 Moreover, as a city’s economy and house-hold con sumption patterns shift towards more manu-facturing-intensive processes and products (eg, as seen in some of China’s rapidly industrialising cities) the presence of chemical pollutants in wastewater might increase substantially, thus rendering it unusable for irrigation. The challenge for public health practitioners, engineers, and planners is to balance the health risks and the social, economic, and environmental benefi ts of wastewater reuse.153
Building standards, thermal comfort, and indoor air qualityBackgroundBuilding design provides an excellent example of the potential co-benefi ts of urban health and other social and economic policy goals, such as development goals and climate protection through reduction in greenhouse gas emissions. A WHO report154 draws attention to the fact that although costs are incurred in the reduction of carbon in buildings and in household use of energy, the potential benefi ts for health are substantial, particularly for low-income households. However, this issue also draws attention to the complexities and tensions that can arise and how the policy approaches need to vary dependent on context.
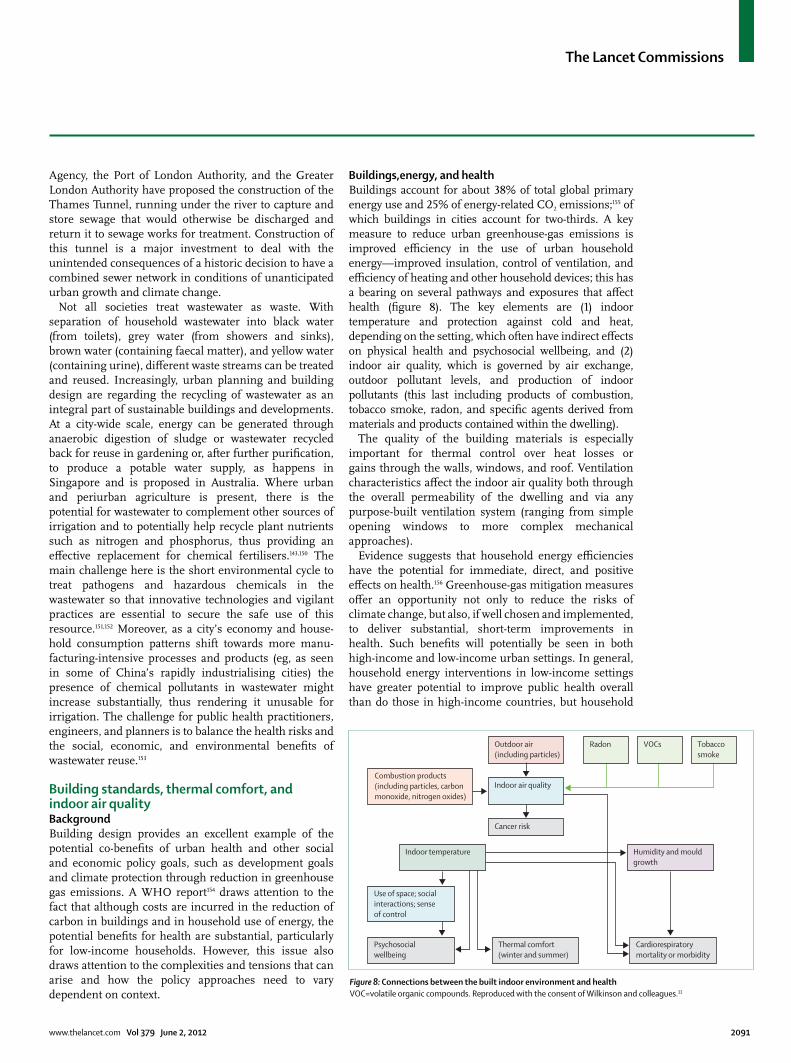
Buildings,energy, and healthBuildings account for about 38% of total global primary energy use and 25% of energy-related CO2 emissions;155 of which buildings in cities account for two-thirds. A key measure to reduce urban greenhouse-gas emissions is improved effi ciency in the use of urban household energy—improved insulation, control of ventilation, and effi ciency of heating and other household devices; this has a bearing on several pathways and exposures that aff ect health (fi gure 8). The key elements are (1) indoor temperature and protection against cold and heat, depending on the setting, which often have indirect eff ects on physical health and psychosocial wellbeing, and (2) indoor air quality, which is governed by air exchange, outdoor pollutant levels, and production of indoor pollutants (this last including products of combustion, tobacco smoke, radon, and specifi c agents derived from materials and products contained within the dwelling).
The quality of the building materials is especially important for thermal control over heat losses or gains through the walls, windows, and roof. Ventilation characteristics aff ect the indoor air quality both through the overall permeability of the dwelling and via any purpose-built ventilation system (ranging from simple opening windows to more complex mechanical approaches).
Evidence suggests that household energy effi ciencies have the potential for immediate, direct, and positive eff ects on health.156 Greenhouse-gas mitigation measures off er an oppor tunity not only to reduce the risks of climate change, but also, if well chosen and implemented, to deliver substantial, short-term improvements in health. Such benefi ts will potentially be seen in both high-income and low-income urban settings. In general, household energy inter ventions in low-income settings have greater potential to improve public health overall than do those in high-income countries, but household
Figure 8: Connections between the built indoor environment and healthVOC=volatile organic compounds. Reproduced with the consent of Wilkinson and colleagues.33
Combustion products(including particles, carbon monoxide, nitrogen oxides)
Indoor air quality
Indoor temperature
Use of space; social interactions; sense of control
Psychosocialwellbeing
Thermal comfort(winter and summer)
Cardiorespiratory mortality or morbidity
Outdoor air (including particles)
Cancer risk
Humidity and mouldgrowth
Radon VOCs Tobaccosmoke
The Lancet Commissions
2092 www.thelancet.com Vol 379 June 2, 2012
energy interventions in high-income settings have the larger potential for greenhouse-gas reduction because of higher energy use per person.157 In settings such as India, for example, there are substantial disease burdens associated with exposure to indoor air pollution from the ineffi cient and inadequately ventilated combustion of biomass for cooking and heating. Thus, a strategy to deploy, at low cost, cleaner stove technology could yield very substantial health gains and also contribute to global greenhouse-gas reductions.156
There are also important health benefi ts from access to energy, especially electricity, which underpins so many of the functions taken for granted in high-income settings—eg, facilities for refrigeration, and therefore safer storage of food, and street lighting for more secure mobility. Restricted access to aff ordable energy is an underlying factor of poor health in low-income settings,158–161 but is also an issue in higher-income countries. In England and Wales, for example, during the winter of 2007–08, more than 25 000 excess deaths occurred compared with the average for the rest of the year, many due to a combination of inadequate heating and underlying health problems in elderly and immobile populations, which are dis proportionately concentrated in urban areas.162 In the stated desire for improvement of energy effi ciency, a need exists in many settings to increase aff ordable access to energy—a tension that needs to be overcome in urban policy.
Within cities in low-income countries, building quality and indoor environments can vary substantially, but many households live in substandard conditions.163 In such countries, the internal environment typically has a greater eff ect on health than it does in high-income settings, resulting from poorly built dwellings that increase exposure to heat and cold and to the highly polluting fuels for heating, cooking, and lighting released into the living space. The direct eff ects of living in poor quality housing in terms of exposure to cold and mortality are less clear, although studies have drawn attention to seasonal eff ects in health, especially in children,164 which might be reduced with better quality housing.
WHO estimates, however, suggest that compared with outdoor air quality, indoor air pollution carries a greater burden of ill health globally as a result of cooking and heating practices, coupled with inadequate ventilation. Estimates suggest that about 1·5 million people die as a result of indoor air pollution from the use of unclean fuels,159 and switching to a cleaner fuel in low-income and middle-income urban settings could substantially reduce mortality. Furthermore, women will typically spend a greater amount of time indoors than will men, because they are responsible for food preparation and cooking and the care of infants and young children, and therefore have more severe exposure to pollutants.165 Children exposed to high pollution levels have acute infections of the lower respiratory tract, 166 and women are at high risk of chronic obstructive pulmonary disease and lung
cancer. Respiratory disorders are a leading cause of death, especially in children, in urban as well as rural households in the low-income and middle-income countries.
Building standardsThe standards by which buildings are constructed off er an opportunity for improved building performance in both environmental and energy terms. However, the extent to which structure and form can be determined by authorities—through such measures as building regulation and codes—varies enormously from setting to setting. In informal settlements in many low-income urban areas, there is almost no appropriate control over even the most basic regulations for building form and quality. But inhabitants of such dwellings are also among those who would benefi t most from simple measures to reduce exposures. Methods to engage with and assist inhabitants in such communities will need a process very diff erent from those of formal regulation and standard setting. Despite such challenges, there is much potential for low-income and middle-income countries to build more effi cient buildings that would have a substantial eff ect on public health with direct eff ects on respiratory and circulatory symptoms and, at the same time, on future energy demand, a conclusion supported in a UN report on the green economy.167
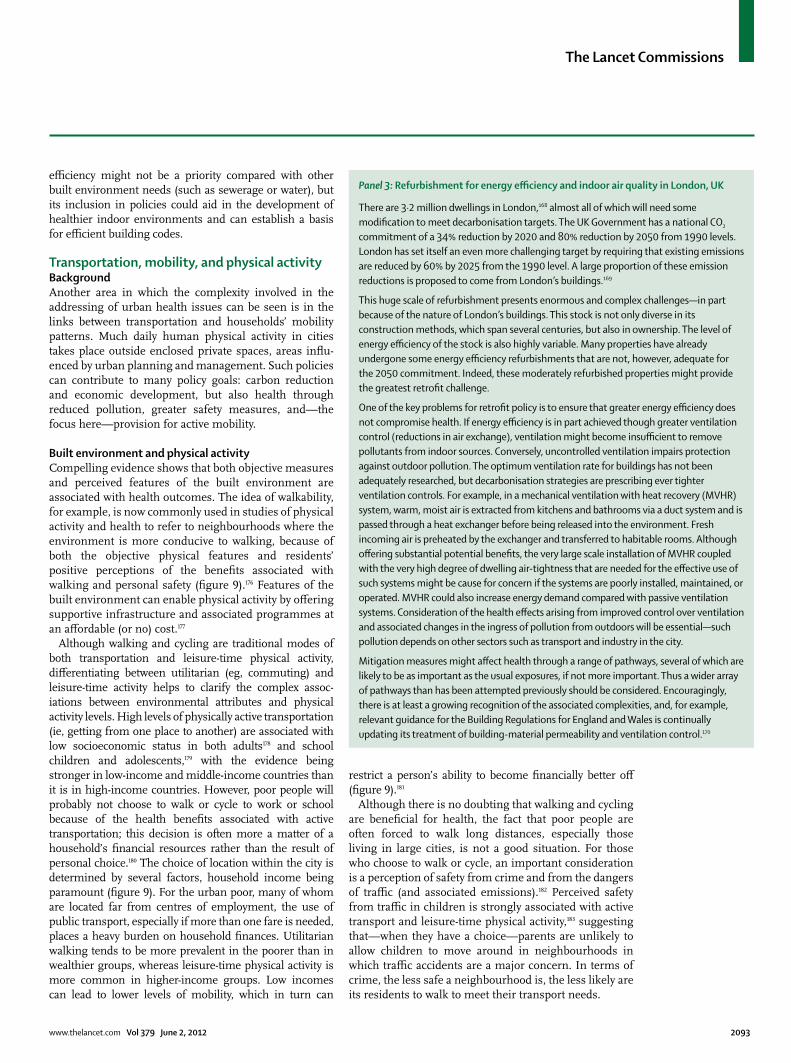
In high-income countries, building regulations and development controls are used in an attempt to ensure adequate indoor environmental quality, and large-scale research-based refurbishment programmes have begun, driven largely by the decarbonisation agenda. These programmes could have a large positive eff ect on health at the population level, provided they take account of the relevant complexities and are carefully implemented to combine improved thermal performance with adequate ventilation (panel 3). Policies have also been developed to target households in the lowest socioeconomic classes, for example, to target fuel poverty—the label applied to individuals who have to spend more than 10% of their income on fuel to heat their home satisfactorily171—which has been associated with cold-related health risks, mental illness, and asthma.171–174 Strategies to tackle fuel poverty and inadequate access to energy use have included subsidy of winter fuel costs, and energy effi ciency measures for vulnerable households to im prove the quality of the home.175
In view of the potential health benefi ts of energy effi ciency, city-level policies for energy effi ciency and energy systems can be an important catalyst to improve health. Trillions of US dollars are expected to be invested into the decarbonisation of the built environ ment and to address the energy supply infrastructure worldwide during the next three decades. In high-income cities and in high-income neighbourhoods in many other urban areas, improved building energy effi ciency is ex pected to make a major contribution to the achieve ment of decarbonisation targets; in low-income and middle-income cities, energy
The Lancet Commissions
www.thelancet.com Vol 379 June 2, 2012 2093
effi ciency might not be a priority compared with other built environment needs (such as sewerage or water), but its inclusion in policies could aid in the development of healthier indoor environments and can establish a basis for effi cient building codes.
Transportation, mobility, and physical activityBackground Another area in which the complexity involved in the addressing of urban health issues can be seen is in the links between transportation and households’ mobility patterns. Much daily human physical activity in cities takes place outside enclosed private spaces, areas infl u-enced by urban planning and management. Such policies can contribute to many policy goals: carbon reduction and economic development, but also health through reduced pollution, greater safety measures, and—the focus here—provision for active mobility.
Built environment and physical activityCompelling evidence shows that both objective measures and perceived features of the built environment are associated with health outcomes. The idea of walkability, for example, is now commonly used in studies of physical activity and health to refer to neighbourhoods where the environment is more conducive to walking, because of both the objective physical features and residents’ positive perceptions of the benefi ts associated with walking and personal safety (fi gure 9).176 Features of the built environment can enable physical activity by off ering supportive infrastructure and associated programmes at an aff ordable (or no) cost.177
Although walking and cycling are traditional modes of both transportation and leisure-time physical activity, diff erentiating between utilitarian (eg, commuting) and leisure-time activity helps to clarify the complex assoc-iations between environmental attributes and physical activity levels. High levels of physically active transportation (ie, getting from one place to another) are associated with low socioeconomic status in both adults178 and school children and adolescents,179 with the evidence being stronger in low-income and middle-income countries than it is in high-income countries. However, poor people will probably not choose to walk or cycle to work or school because of the health benefi ts associated with active transportation; this decision is often more a matter of a household’s fi nancial resources rather than the result of personal choice.180 The choice of location within the city is determined by several factors, household income being paramount (fi gure 9). For the urban poor, many of whom are located far from centres of employment, the use of public transport, especially if more than one fare is needed, places a heavy burden on household fi nances. Utilitarian walking tends to be more prevalent in the poorer than in wealthier groups, whereas leisure-time physical activity is more common in higher-income groups. Low incomes can lead to lower levels of mobility, which in turn can
restrict a person’s ability to become fi nancially better off (fi gure 9).181
Although there is no doubting that walking and cycling are benefi cial for health, the fact that poor people are often forced to walk long distances, especially those living in large cities, is not a good situation. For those who choose to walk or cycle, an important consideration is a perception of safety from crime and from the dangers of traffi c (and associated emissions).182 Perceived safety from traffi c in children is strongly associated with active transport and leisure-time physical activity,183 suggesting that—when they have a choice—parents are unlikely to allow children to move around in neighbourhoods in which traffi c accidents are a major concern. In terms of crime, the less safe a neighbourhood is, the less likely are its residents to walk to meet their transport needs.
Panel 3: Refurbishment for energy effi ciency and indoor air quality in London, UK
There are 3·2 million dwellings in London,168 almost all of which will need some modifi cation to meet decarbonisation targets. The UK Government has a national CO2 commitment of a 34% reduction by 2020 and 80% reduction by 2050 from 1990 levels. London has set itself an even more challenging target by requiring that existing emissions are reduced by 60% by 2025 from the 1990 level. A large proportion of these emission reductions is proposed to come from London’s buildings.169
This huge scale of refurbishment presents enormous and complex challenges—in part because of the nature of London’s buildings. This stock is not only diverse in its construction methods, which span several centuries, but also in ownership. The level of energy effi ciency of the stock is also highly variable. Many properties have already undergone some energy effi ciency refurbishments that are not, however, adequate for the 2050 commitment. Indeed, these moderately refurbished properties might provide the greatest retrofi t challenge.
One of the key problems for retrofi t policy is to ensure that greater energy effi ciency does not compromise health. If energy effi ciency is in part achieved though greater ventilation control (reductions in air exchange), ventilation might become insuffi cient to remove pollutants from indoor sources. Conversely, uncontrolled ventilation impairs protection against outdoor pollution. The optimum ventilation rate for buildings has not been adequately researched, but decarbonisation strategies are prescribing ever tighter ventilation controls. For example, in a mechanical ventilation with heat recovery (MVHR) system, warm, moist air is extracted from kitchens and bathrooms via a duct system and is passed through a heat exchanger before being released into the environment. Fresh incoming air is preheated by the exchanger and transferred to habitable rooms. Although off ering substantial potential benefi ts, the very large scale installation of MVHR coupled with the very high degree of dwelling air-tightness that are needed for the eff ective use of such systems might be cause for concern if the systems are poorly installed, maintained, or operated. MVHR could also increase energy demand compared with passive ventilation systems. Consideration of the health eff ects arising from improved control over ventilation and associated changes in the ingress of pollution from outdoors will be essential—such pollution depends on other sectors such as transport and industry in the city.
Mitigation measures might aff ect health through a range of pathways, several of which are likely to be as important as the usual exposures, if not more important. Thus a wider array of pathways than has been attempted previously should be considered. Encouragingly, there is at least a growing recognition of the associated complexities, and, for example, relevant guidance for the Building Regulations for England and Wales is continually updating its treatment of building-material permeability and ventilation control.170
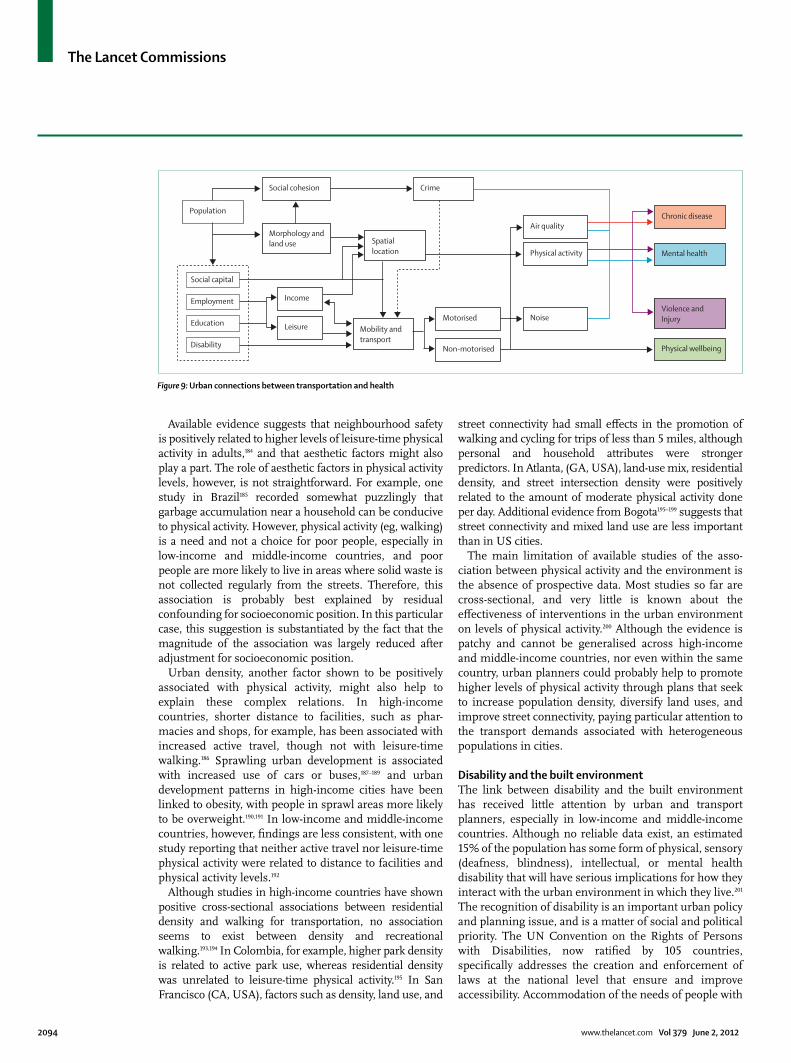
The Lancet Commissions
2094 www.thelancet.com Vol 379 June 2, 2012
Available evidence suggests that neighbourhood safety is positively related to higher levels of leisure-time physical activity in adults,184 and that aesthetic factors might also play a part. The role of aesthetic factors in physical activity levels, however, is not straightforward. For example, one study in Brazil185 recorded somewhat puzzlingly that garbage accumulation near a household can be conducive to physical activity. However, physical activity (eg, walking) is a need and not a choice for poor people, especially in low-income and middle-income countries, and poor people are more likely to live in areas where solid waste is not collected regularly from the streets. Therefore, this association is probably best explained by residual confounding for socioeconomic position. In this particular case, this suggestion is substantiated by the fact that the magnitude of the association was largely reduced after adjustment for socioeconomic position.
Urban density, another factor shown to be positively associated with physical activity, might also help to explain these complex relations. In high-income countries, shorter distance to facilities, such as phar-macies and shops, for example, has been associated with increased active travel, though not with leisure-time walking.186 Sprawling urban development is associated with increased use of cars or buses,187–189 and urban development patterns in high-income cities have been linked to obesity, with people in sprawl areas more likely to be overweight.190,191 In low-income and middle-income countries, however, fi ndings are less consistent, with one study reporting that neither active travel nor leisure-time physical activity were related to distance to facilities and physical activity levels.192
Although studies in high-income countries have shown positive cross-sectional associations between residential density and walking for transportation, no association seems to exist between density and recreational walking.193,194 In Colombia, for example, higher park density is related to active park use, whereas residential density was unrelated to leisure-time physical activity.195 In San Francisco (CA, USA), factors such as density, land use, and
street connectivity had small eff ects in the promotion of walking and cycling for trips of less than 5 miles, although personal and household attributes were stronger predictors. In Atlanta, (GA, USA), land-use mix, residential density, and street intersection density were positively related to the amount of moderate physical activity done per day. Additional evidence from Bogota195–199 suggests that street connectivity and mixed land use are less important than in US cities.
The main limitation of available studies of the asso-ciation between physical activity and the environment is the absence of prospective data. Most studies so far are cross-sectional, and very little is known about the eff ectiveness of interventions in the urban environment on levels of physical activity.200 Although the evidence is patchy and cannot be gener alised across high-income and middle-income countries, nor even within the same country, urban planners could probably help to promote higher levels of physical activity through plans that seek to increase population density, diversify land uses, and improve street connectivity, paying particular attention to the transport demands associated with heterogeneous populations in cities.
Disability and the built environmentThe link between disability and the built environment has received little attention by urban and transport planners, especially in low-income and middle-income countries. Although no reliable data exist, an estimated 15% of the population has some form of physical, sensory (deafness, blindness), intellectual, or mental health disability that will have serious implications for how they interact with the urban environment in which they live.201 The recognition of disability is an important urban policy and planning issue, and is a matter of social and political priority. The UN Convention on the Rights of Persons with Disabilities, now ratifi ed by 105 countries, specifi cally addresses the creation and enforcement of laws at the national level that ensure and improve accessibility. Accommodation of the needs of people with
Figure 9: Urban connections between transportation and health
Population
Social capital
Employment
Education
Disability
Social cohesion
Morphology andland use
Crime
Spatiallocation
Chronic disease
Non-motorised
Motorised
Mental health
Violence andInjury
Physical wellbeing
Mobility andtransport
NoiseLeisure
Income
Air quality
Physical activity
The Lancet Commissions
www.thelancet.com Vol 379 June 2, 2012 2095
disabilities in the design of a city usually needs changes to the urban fabric. Retrofi tting housing (ie, making changes to existing structures, rather than complete replacement), transportation systems, and public places to take into account the needs of people with disabilities can be expensive when infrastructure is often decades old and substantial changes such as ramps and widened entry-ways are needed for wheelchair users. However, newly designed or adapted transport systems, housing, roads, pavements, and urban public spaces off er an opportunity to provide more inclusive environments and, when properly planned and designed, additional costs are minimal (<3% of the total costs without these special measures).
The fact that much of the world’s urban growth is taking place in low-income and middle-income countries is an opportunity to plan and design urban environments that provide disabled populations with greater opportunities for mobility and leisure. But because much urban growth is informal, and laws and regulations that should guarantee accessibility are poorly enforced, true accessibility for people with disabilities will continue to be an important issue for years to come. The health implications for such people are substantial—good and accessible built or retrofi tted environments allow people with disabilities to access the surrounding urban environment for employ ment, leisure, or access to health facilities, or to buy food and goods, socialise, and participate in activities in the surrounding communities. Inaccessible environments, by contrast, limit or completely restrict people with disabilities from participating in such activities and place additional (and unnecessary) burdens on members of their households and social support systems.
Interventions and physical activityCity governments are especially relevant to people’s daily lives in the public realm because they plan and manage infrastructure and services that directly aff ect people’s quality of life and their sense of order and security.202 As has been widely documented,203 the lack of an eff ective planning framework, coupled with poor or non-existent basic infrastructure services (including paved streets and public transport), can have negative consequences for people’s health, particularly poor and disabled people in urban areas. In most low-income and in many middle-income countries, local governments do not have the human and fi nancial resources to fulfi l these respon sibilities, which are done by central govern-ment agencies or not done at all. A consequence is that much new development takes place spon taneously, with individual households or private developers building and extending the city alongside roads, with little or no infrastructure to sustain dense populations of people. Such spontaneous development characterises slum areas and other informal settlements, some of which house a substantial propor tion of a city’s population, as
has happened in Mumbai, India (panel 2). However, the example of Bogota suggests that there are valuable instances of city governments that have been able to
Panel 4: Governance and the built environment in Bogota, Colombia
Bogota, the capital city of Colombia, off ers an interesting case of a city where the built environment has been actively transformed in an attempt to reduce car dependency and promote more physical activity among its residents. Throughout the 1990s and early 2000s, the city underwent substantial institutional and urban transformations that have caught the imagination of urban planners and managers in many low-income and middle-income countries.204,205 A succession of city administrations led by charismatic mayors helped to strengthen city fi nances and introduced a series of measures to, among other things, reduce the use of private vehicles and promote use of public transport, cycling, and walking. Such measures—in a city with more than 7 million people and a high density of construction, few open spaces, substantial socioeconomic inequalities, high rates of both violence and fatal traffi c accidents, and woefully inadequate fi nances—have been regarded as successful. However, these measures have fallen short of the needs of a population that has continued to grow, especially in view of the fact that the increase in the number of private vehicles (including motorcycles) far exceeds population growth, which is a good example of a positive feedback loop whereby growth of private vehicles has led to instability in the public transport system. And despite improvements, most of the adult population remains inactive, with only 44·7% meeting guidelines for physical activity, suggesting that more needs to be done.206 An initiative launched in 1974, predating these administrations, is the Ciclovía Recreativa (traffi c-free streets; fi gure 10), whereby street closures to motorised traffi c for fi xed periods on Sundays and public holidays are put in place.207 This initiative has been associated with increased physical activity (eg, walking, cycling), although this activity tends to be more common in young middle-income and high-income men than it is in other social groups. Bogota’s Ciclovía normally shuts 97 km of its streets, more than any other city in the Americas, at an annual cost of US$1·7 million to the city’s fi nances. Between 600 000 people and 1·4 million people regularly use it to exercise, with 41% of adults participating for more than 3 h at a time. Every $1 invested (both by the city and by individuals) leads to an estimated net annual saving in health costs of between $3·23 and $4·26 per person.205 Although associated with reduced emissions, these reductions have not been quantifi ed, nor have their economic implications, which are likely to be positive.
Other measures have included urban and transport improvements associated with Transmilenio (fi gure 11), a mass-transit system that uses Bus Rapid Transit technology introduced in 2000, with dedicated lanes and fi xed bus stations.208 Covering 25% of daily public transport trips in 2010,209 this system has not only reduced car use and average commuting times of its users, but has also prompted users to walk longer distances to stations than the system previously used whereby buses stopped wherever users asked them to do so. The physical improvements in pavements and public spaces introduced as part of the construction of the system have also encouraged greater use of these places by pedestrians.210 Implementation of the system has also been associated with improvements in air quality by helping to reduce congestion, thus increasing average speeds, as well as by transporting more passengers in shorter times—an example of further feedback loops.211
Since 1998, the local government has created a 334-km cycle-path network (Ciclo-Rutas) that covers the city. But despite the existence of this network, only 2% of daily journeys are made by bicycle.207 The reasons for such low use of the network has not been adequately researched, although anecdotal evidence points to perceptions of a high number of traffi c deaths in cyclists, fear of crime, and lack of secure parking facilities for bicycles as deterrents. Walking is the main mode of daily transport for 12% of the population, particularly those in lower socioeconomic groups (61·5% of those who walk for non-recreational purposes have only primary education).
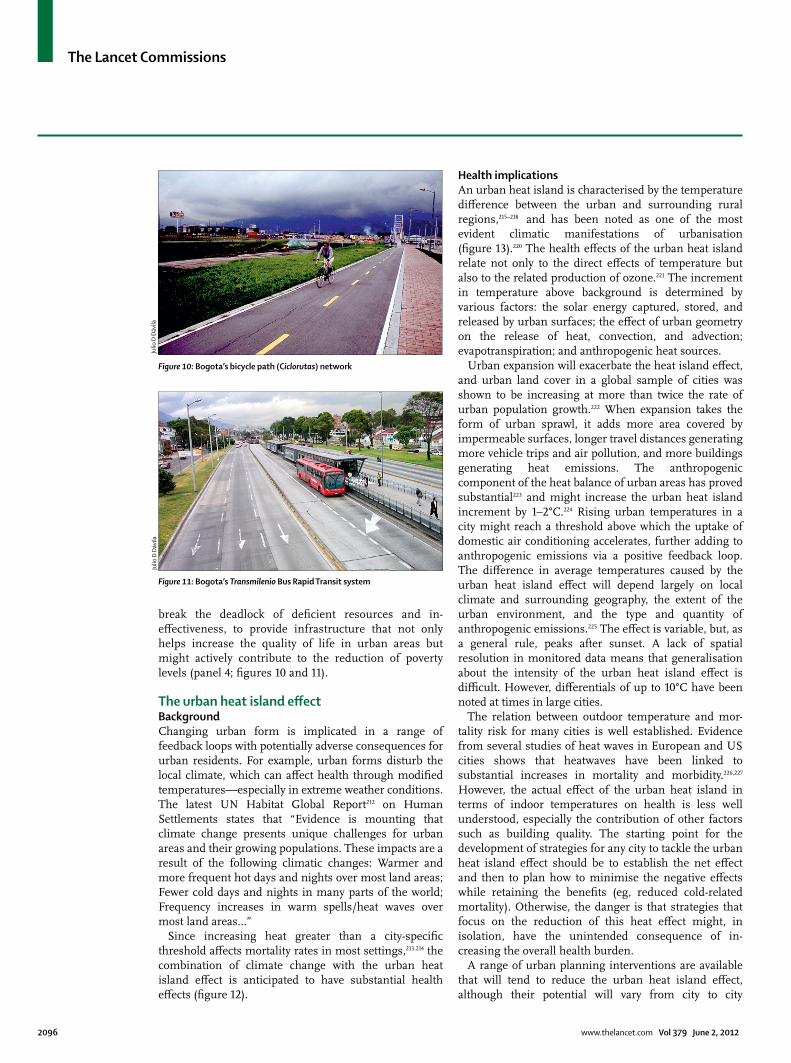
The Lancet Commissions
2096 www.thelancet.com Vol 379 June 2, 2012
break the deadlock of defi cient resources and in-eff ectiveness, to provide infrastructure that not only helps increase the quality of life in urban areas but might actively contribute to the reduction of poverty levels (panel 4; fi gures 10 and 11).
The urban heat island eff ectBackgroundChanging urban form is implicated in a range of feedback loops with potentially adverse consequences for urban residents. For example, urban forms disturb the local climate, which can aff ect health through modifi ed temperatures—especially in extreme weather conditions. The latest UN Habitat Global Report212 on Human Settlements states that “Evidence is mounting that climate change presents unique challenges for urban areas and their growing populations. These impacts are a result of the following climatic changes: Warmer and more frequent hot days and nights over most land areas; Fewer cold days and nights in many parts of the world; Frequency increases in warm spells/heat waves over most land areas…”
Since increasing heat greater than a city-specifi c threshold aff ects mortality rates in most settings,213,214 the combination of climate change with the urban heat island eff ect is anticipated to have substantial health eff ects (fi gure 12).
Health implicationsAn urban heat island is characterised by the tem perature diff erence between the urban and surrounding rural regions,215–218 and has been noted as one of the most evident climatic manifestations of urbanisation (fi gure 13).220 The health eff ects of the urban heat island relate not only to the direct eff ects of temperature but also to the related production of ozone.221 The increment in temperature above background is determined by various factors: the solar energy captured, stored, and released by urban surfaces; the eff ect of urban geometry on the release of heat, convection, and advection; evapotrans piration; and anthropogenic heat sources.
Urban expansion will exacerbate the heat island eff ect, and urban land cover in a global sample of cities was shown to be increasing at more than twice the rate of urban population growth.222 When expansion takes the form of urban sprawl, it adds more area covered by impermeable surfaces, longer travel distances generating more vehicle trips and air pollution, and more buildings generating heat emissions. The anthropogenic component of the heat balance of urban areas has proved substantial223 and might increase the urban heat island increment by 1–2°C.224 Rising urban temperatures in a city might reach a threshold above which the uptake of domestic air conditioning accelerates, further adding to anthropogenic emissions via a positive feedback loop. The diff erence in average temperatures caused by the urban heat island eff ect will depend largely on local climate and surrounding geography, the extent of the urban environment, and the type and quantity of anthropogenic emissions.225 The eff ect is variable, but, as a general rule, peaks after sunset. A lack of spatial resolution in monitored data means that generalisation about the intensity of the urban heat island eff ect is diffi cult. However, diff erentials of up to 10°C have been noted at times in large cities.
The relation between outdoor temperature and mor-tality risk for many cities is well established. Evidence from several studies of heat waves in European and US cities shows that heatwaves have been linked to substantial increases in mortality and morbidity.226,227 However, the actual eff ect of the urban heat island in terms of indoor temperatures on health is less well understood, especially the contribution of other factors such as building quality. The starting point for the development of strategies for any city to tackle the urban heat island eff ect should be to establish the net eff ect and then to plan how to minimise the negative eff ects while retaining the benefi ts (eg, reduced cold-related mortality). Otherwise, the danger is that strategies that focus on the reduction of this heat eff ect might, in isolation, have the unintended consequence of in-creasing the overall health burden.
A range of urban planning interventions are available that will tend to reduce the urban heat island eff ect, although their potential will vary from city to city
Figure 10: Bogota’s bicycle path (Ciclorutas) network
Figure 11: Bogota’s Transmilenio Bus Rapid Transit system
Julio
D D
ávila
Julio
D D
ávila
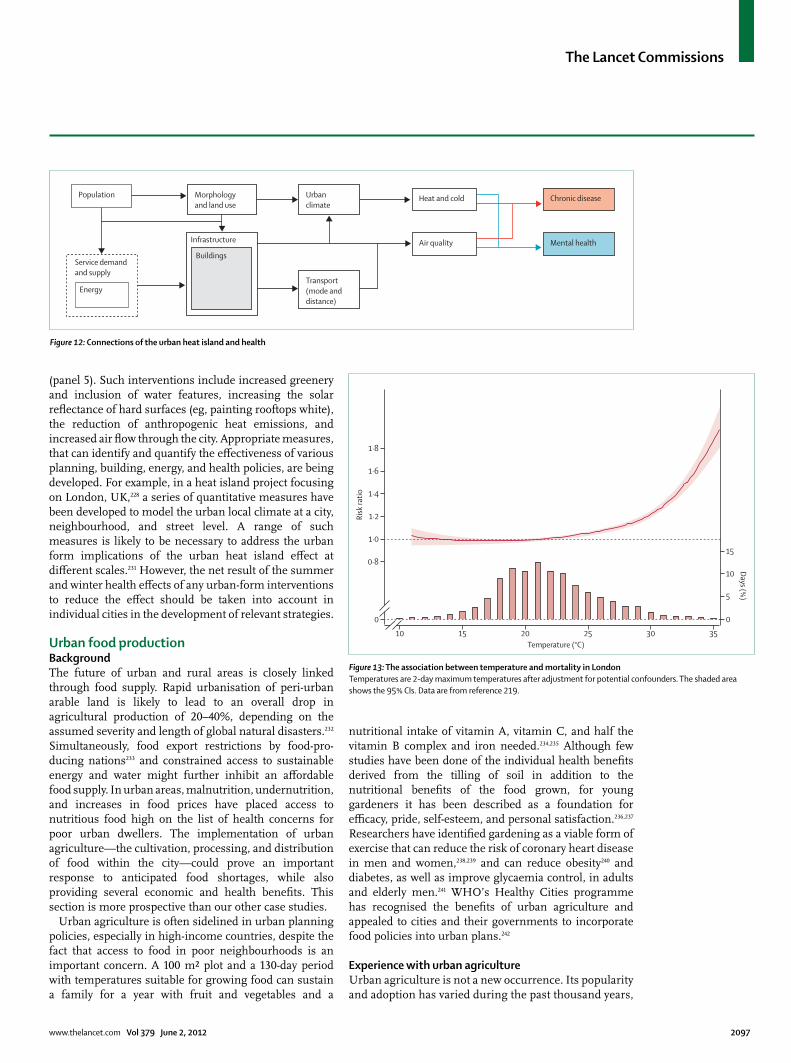
The Lancet Commissions
www.thelancet.com Vol 379 June 2, 2012 2097
(panel 5). Such interventions include increased greenery and inclusion of water features, increasing the solar refl ectance of hard surfaces (eg, painting rooftops white), the reduction of anthropogenic heat emissions, and increased air fl ow through the city. Appropriate measures, that can identify and quantify the eff ectiveness of various planning, building, energy, and health policies, are being developed. For example, in a heat island project focusing on London, UK,228 a series of quantitative measures have been developed to model the urban local climate at a city, neighbourhood, and street level. A range of such measures is likely to be necessary to address the urban form implications of the urban heat island eff ect at diff erent scales.231 However, the net result of the summer and winter health eff ects of any urban-form interventions to reduce the eff ect should be taken into account in individual cities in the development of relevant strategies.
Urban food productionBackgroundThe future of urban and rural areas is closely linked through food supply. Rapid urbanisation of peri-urban arable land is likely to lead to an overall drop in agricultural production of 20–40%, depending on the assumed severity and length of global natural disasters.232 Simultaneously, food export restrictions by food-pro-ducing nations233 and constrained access to sustainable energy and water might further inhibit an aff ordable food supply. In urban areas, malnutrition, undernutrition, and increases in food prices have placed access to nutritious food high on the list of health concerns for poor urban dwellers. The implementation of urban agriculture—the cultivation, processing, and distribution of food within the city—could prove an important response to anticipated food shortages, while also providing several economic and health benefi ts. This section is more prospective than our other case studies.
Urban agriculture is often sidelined in urban planning policies, especially in high-income countries, despite the fact that access to food in poor neighbourhoods is an important concern. A 100 m² plot and a 130-day period with temperatures suitable for growing food can sustain a family for a year with fruit and vegetables and a
nutritional intake of vitamin A, vitamin C, and half the vitamin B complex and iron needed.234,235 Although few studies have been done of the individual health benefi ts derived from the tilling of soil in addition to the nutritional benefi ts of the food grown, for young gardeners it has been described as a foundation for effi cacy, pride, self-esteem, and personal satisfaction.236,237 Researchers have identifi ed gardening as a viable form of exercise that can reduce the risk of coronary heart disease in men and women,238,239 and can reduce obesity240 and diabetes, as well as improve glycaemia control, in adults and elderly men.241 WHO’s Healthy Cities programme has recognised the benefi ts of urban agriculture and appealed to cities and their governments to incorporate food policies into urban plans.242
Experience with urban agricultureUrban agriculture is not a new occurrence. Its popularity and adoption has varied during the past thousand years,
10 15 20 25 30 35
0
0·8
1·0
1·2
1·4
1·6
1·8
0
5
10
15
Risk
ratio
Days (%)
Temperature (°C)
Figure 13: The association between temperature and mortality in LondonTemperatures are 2-day maximum temperatures after adjustment for potential confounders. The shaded area shows the 95% CIs. Data are from reference 219.
Population
Service demandand supply
Energy
Morphology and land use
Urbanclimate
Chronic disease
Mental health
Transport(mode and distance)
Infrastructure
Buildings
Heat and cold
Air quality
Figure 12: Connections of the urban heat island and health
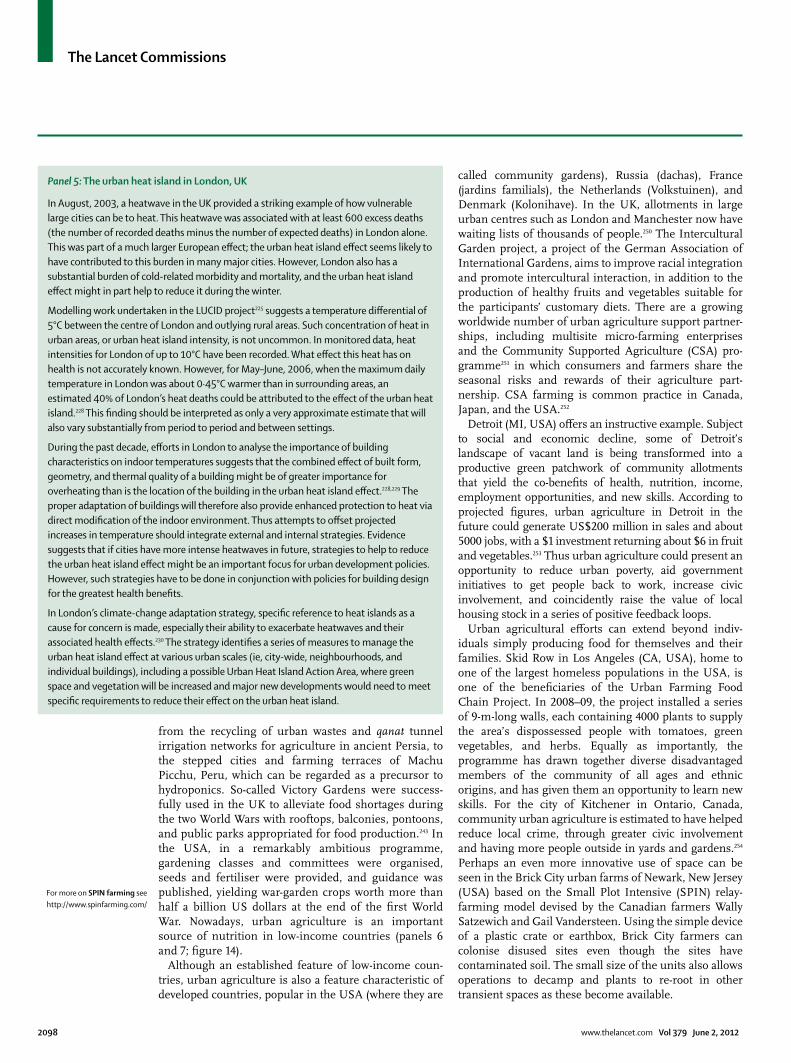
The Lancet Commissions
2098 www.thelancet.com Vol 379 June 2, 2012
from the recycling of urban wastes and qanat tunnel irrigation networks for agriculture in ancient Persia, to the stepped cities and farming terraces of Machu Picchu, Peru, which can be regarded as a precursor to hydro ponics. So-called Victory Gardens were success-fully used in the UK to alleviate food shortages during the two World Wars with rooftops, balconies, pontoons, and public parks appropriated for food production.243 In the USA, in a remarkably ambitious programme, gardening classes and committees were organised, seeds and fertiliser were provided, and guidance was published, yielding war-garden crops worth more than half a billion US dollars at the end of the fi rst World War. Nowadays, urban agriculture is an important source of nutrition in low-income countries (panels 6 and 7; fi gure 14).
Although an established feature of low-income coun-tries, urban agriculture is also a feature characteristic of developed countries, popular in the USA (where they are
called community gardens), Russia (dachas), France (jardins familials), the Netherlands (Volkstuinen), and Denmark (Kolonihave). In the UK, allotments in large urban centres such as London and Manchester now have waiting lists of thousands of people.250 The Intercultural Garden project, a project of the German Association of International Gardens, aims to improve racial integration and promote intercultural interaction, in addition to the production of healthy fruits and vegetables suitable for the participants’ customary diets. There are a growing worldwide number of urban agriculture support partner-ships, including multisite micro-farming enterprises and the Community Supported Agriculture (CSA) pro-gramme251 in which consumers and farmers share the seasonal risks and rewards of their agriculture part-nership. CSA farming is common practice in Canada, Japan, and the USA.252
Detroit (MI, USA) off ers an instructive example. Subject to social and economic decline, some of Detroit’s landscape of vacant land is being transformed into a productive green patchwork of community allotments that yield the co-benefi ts of health, nutrition, income, employment opportunities, and new skills. According to projected fi gures, urban agriculture in Detroit in the future could generate US$200 million in sales and about 5000 jobs, with a $1 investment returning about $6 in fruit and vegetables.253 Thus urban agriculture could present an opportunity to reduce urban poverty, aid government initiatives to get people back to work, increase civic involvement, and coincidently raise the value of local housing stock in a series of positive feedback loops.
Urban agricultural eff orts can extend beyond indiv-iduals simply producing food for themselves and their families. Skid Row in Los Angeles (CA, USA), home to one of the largest homeless populations in the USA, is one of the benefi ciaries of the Urban Farming Food Chain Project. In 2008–09, the project installed a series of 9-m-long walls, each containing 4000 plants to supply the area’s dispossessed people with tomatoes, green vegetables, and herbs. Equally as importantly, the programme has drawn together diverse disadvantaged members of the community of all ages and ethnic origins, and has given them an opportunity to learn new skills. For the city of Kitchener in Ontario, Canada, community urban agriculture is estimated to have helped reduce local crime, through greater civic involvement and having more people outside in yards and gardens.254 Perhaps an even more innovative use of space can be seen in the Brick City urban farms of Newark, New Jersey (USA) based on the Small Plot Intensive (SPIN) relay-farming model devised by the Canadian farmers Wally Satzewich and Gail Vandersteen. Using the simple device of a plastic crate or earthbox, Brick City farmers can colonise disused sites even though the sites have contaminated soil. The small size of the units also allows operations to decamp and plants to re-root in other transient spaces as these become available.
For more on SPIN farming see http://www.spinfarming.com/
Panel 5: The urban heat island in London, UK
In August, 2003, a heatwave in the UK provided a striking example of how vulnerable large cities can be to heat. This heatwave was associated with at least 600 excess deaths (the number of recorded deaths minus the number of expected deaths) in London alone. This was part of a much larger European eff ect; the urban heat island eff ect seems likely to have contributed to this burden in many major cities. However, London also has a substantial burden of cold-related morbidity and mortality, and the urban heat island eff ect might in part help to reduce it during the winter.
Modelling work undertaken in the LUCID project225 suggests a temperature diff erential of 5°C between the centre of London and outlying rural areas. Such concentration of heat in urban areas, or urban heat island intensity, is not uncommon. In monitored data, heat intensities for London of up to 10°C have been recorded. What eff ect this heat has on health is not accurately known. However, for May–June, 2006, when the maximum daily temperature in London was about 0·45°C warmer than in surrounding areas, an estimated 40% of London’s heat deaths could be attributed to the eff ect of the urban heat island.228 This fi nding should be interpreted as only a very approximate estimate that will also vary substantially from period to period and between settings.
During the past decade, eff orts in London to analyse the importance of building characteristics on indoor temperatures suggests that the combined eff ect of built form, geometry, and thermal quality of a building might be of greater importance for overheating than is the location of the building in the urban heat island eff ect.228,229 The proper adaptation of buildings will therefore also provide enhanced protection to heat via direct modifi cation of the indoor environment. Thus attempts to off set projected increases in temperature should integrate external and internal strategies. Evidence suggests that if cities have more intense heatwaves in future, strategies to help to reduce the urban heat island eff ect might be an important focus for urban development policies. However, such strategies have to be done in conjunction with policies for building design for the greatest health benefi ts.
In London’s climate-change adaptation strategy, specifi c reference to heat islands as a cause for concern is made, especially their ability to exacerbate heatwaves and their associated health eff ects.230 The strategy identifi es a series of measures to manage the urban heat island eff ect at various urban scales (ie, city-wide, neighbourhoods, and individual buildings), including a possible Urban Heat Island Action Area, where green space and vegetation will be increased and major new developments would need to meet specifi c requirements to reduce their eff ect on the urban heat island.
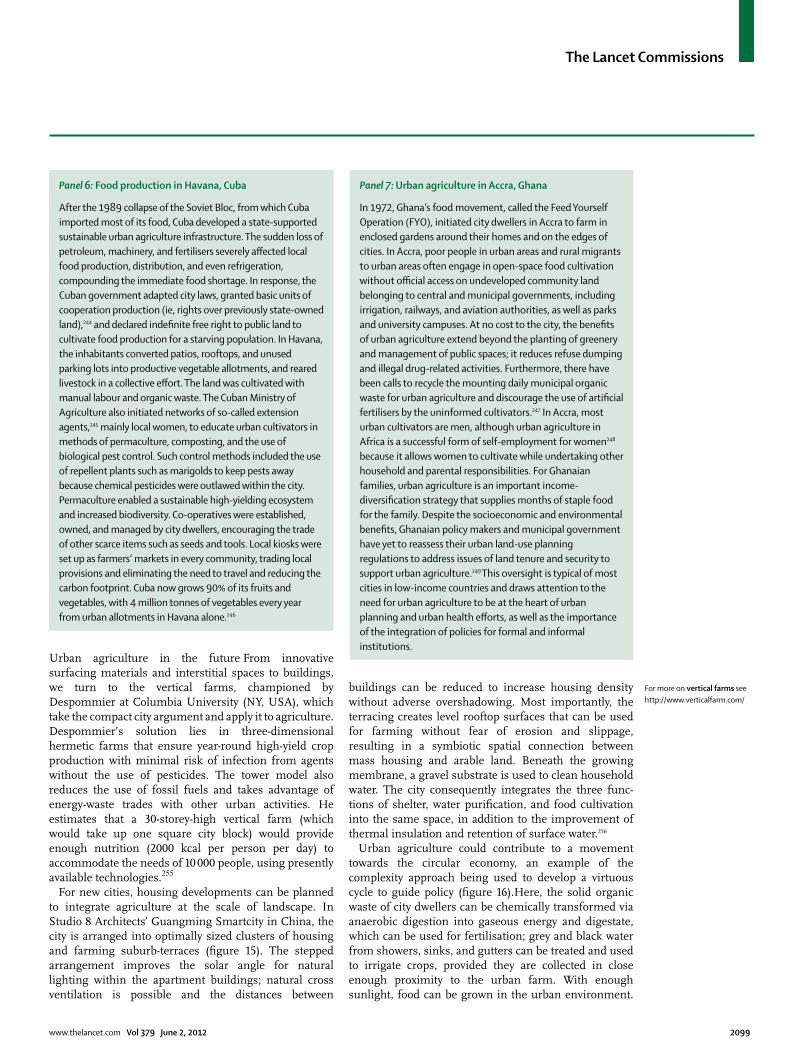
The Lancet Commissions
www.thelancet.com Vol 379 June 2, 2012 2099
Urban agriculture in the future From innovative surfacing materials and interstitial spaces to buildings, we turn to the vertical farms, championed by Despommier at Columbia University (NY, USA), which take the compact city argument and apply it to agriculture. Despommier’s solution lies in three-dimensional hermetic farms that ensure year-round high-yield crop production with minimal risk of infection from agents without the use of pesticides. The tower model also reduces the use of fossil fuels and takes advantage of energy-waste trades with other urban activities. He estimates that a 30-storey-high vertical farm (which would take up one square city block) would provide enough nutrition (2000 kcal per person per day) to accommodate the needs of 10 000 people, using presently available technologies.255
For new cities, housing developments can be planned to integrate agriculture at the scale of landscape. In Studio 8 Architects’ Guangming Smartcity in China, the city is arranged into optimally sized clusters of housing and farming suburb-terraces (fi gure 15). The stepped arrangement improves the solar angle for natural lighting within the apartment buildings; natural cross ventilation is possible and the distances between
buildings can be reduced to increase housing density without adverse overshadowing. Most importantly, the terracing creates level rooftop surfaces that can be used for farming without fear of erosion and slippage, resulting in a symbiotic spatial connection between mass housing and arable land. Beneath the growing membrane, a gravel substrate is used to clean household water. The city consequently integrates the three func-tions of shelter, water purifi cation, and food cultivation into the same space, in addition to the improvement of thermal insulation and retention of surface water.256
Urban agriculture could contribute to a movement towards the circular economy, an example of the complexity approach being used to develop a virtuous cycle to guide policy (fi gure 16).Here, the solid organic waste of city dwellers can be chemically transformed via anaerobic digestion into gaseous energy and digestate, which can be used for fertilisation; grey and black water from showers, sinks, and gutters can be treated and used to irrigate crops, provided they are collected in close enough proximity to the urban farm. With enough sunlight, food can be grown in the urban environment.
Panel 7: Urban agriculture in Accra, Ghana
In 1972, Ghana’s food movement, called the Feed Yourself Operation (FYO), initiated city dwellers in Accra to farm in enclosed gardens around their homes and on the edges of cities. In Accra, poor people in urban areas and rural migrants to urban areas often engage in open-space food cultivation without offi cial access on undeveloped community land belonging to central and municipal governments, including irrigation, railways, and aviation authorities, as well as parks and university campuses. At no cost to the city, the benefi ts of urban agriculture extend beyond the planting of greenery and management of public spaces; it reduces refuse dumping and illegal drug-related activities. Furthermore, there have been calls to recycle the mounting daily municipal organic waste for urban agriculture and discourage the use of artifi cial fertilisers by the uninformed cultivators.247 In Accra, most urban cultivators are men, although urban agriculture in Africa is a successful form of self-employment for women248 because it allows women to cultivate while undertaking other household and parental responsibilities. For Ghanaian families, urban agriculture is an important income-diversifi cation strategy that supplies months of staple food for the family. Despite the socioeconomic and environmental benefi ts, Ghanaian policy makers and municipal government have yet to reassess their urban land-use planning regulations to address issues of land tenure and security to support urban agriculture.249 This oversight is typical of most cities in low-income countries and draws attention to the need for urban agriculture to be at the heart of urban planning and urban health eff orts, as well as the importance of the integration of policies for formal and informal institutions.
Panel 6: Food production in Havana, Cuba
After the 1989 collapse of the Soviet Bloc, from which Cuba imported most of its food, Cuba developed a state-supported sustainable urban agriculture infrastructure. The sudden loss of petroleum, machinery, and fertilisers severely aff ected local food production, distribution, and even refrigeration, compounding the immediate food shortage. In response, the Cuban government adapted city laws, granted basic units of cooperation production (ie, rights over previously state-owned land),244 and declared indefi nite free right to public land to cultivate food production for a starving population. In Havana, the inhabitants converted patios, rooftops, and unused parking lots into productive vegetable allotments, and reared livestock in a collective eff ort. The land was cultivated with manual labour and organic waste. The Cuban Ministry of Agriculture also initiated networks of so-called extension agents,245 mainly local women, to educate urban cultivators in methods of permaculture, composting, and the use of biological pest control. Such control methods included the use of repellent plants such as marigolds to keep pests away because chemical pesticides were outlawed within the city. Permaculture enabled a sustainable high-yielding ecosystem and increased biodiversity. Co-operatives were established, owned, and managed by city dwellers, encouraging the trade of other scarce items such as seeds and tools. Local kiosks were set up as farmers’ markets in every community, trading local provisions and eliminating the need to travel and reducing the carbon footprint. Cuba now grows 90% of its fruits and vegetables, with 4 million tonnes of vegetables every year from urban allotments in Havana alone.246
For more on vertical farms see http://www.verticalfarm.com/
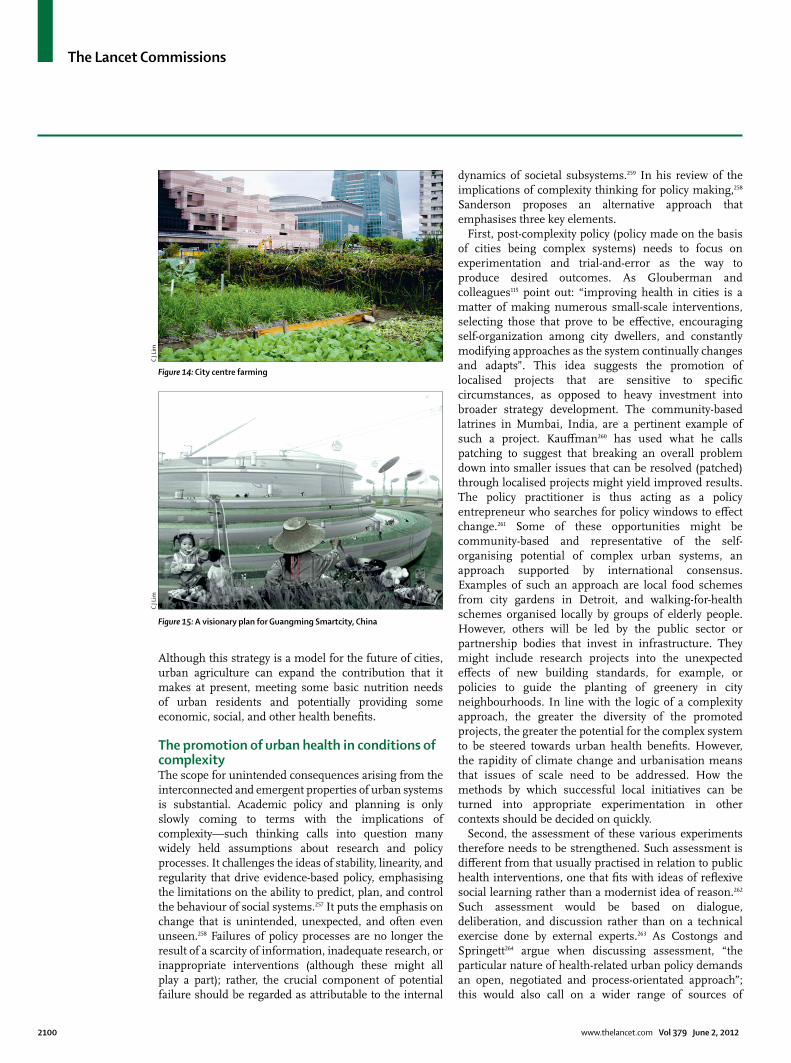
The Lancet Commissions
2100 www.thelancet.com Vol 379 June 2, 2012
Although this strategy is a model for the future of cities, urban agriculture can expand the contribution that it makes at present, meeting some basic nutrition needs of urban residents and potentially providing some economic, social, and other health benefi ts.
The promotion of urban health in conditions of complexityThe scope for unintended consequences arising from the interconnected and emergent properties of urban systems is substantial. Academic policy and planning is only slowly coming to terms with the implications of complexity—such thinking calls into question many widely held assumptions about research and policy processes. It challenges the ideas of stability, linearity, and regularity that drive evidence-based policy, emphasising the limitations on the ability to predict, plan, and control the behaviour of social systems.257 It puts the emphasis on change that is unintended, unexpected, and often even unseen.258 Failures of policy processes are no longer the result of a scarcity of information, inadequate research, or inappropriate interventions (although these might all play a part); rather, the crucial component of potential failure should be regarded as attributable to the internal
dynamics of societal subsystems.259 In his review of the implications of complexity thinking for policy making,258 Sanderson proposes an alternative approach that emphasises three key elements.
First, post-complexity policy (policy made on the basis of cities being complex systems) needs to focus on experimentation and trial-and-error as the way to produce desired outcomes. As Glouberman and colleagues115 point out: “improving health in cities is a matter of making numerous small-scale interventions, selecting those that prove to be eff ective, encouraging self-organ ization among city dwellers, and constantly modifying approaches as the system continually changes and adapts”. This idea suggests the promotion of localised projects that are sensitive to specifi c circumstances, as opposed to heavy investment into broader strategy development. The community-based latrines in Mumbai, India, are a pertinent example of such a project. Kauff man260 has used what he calls patching to suggest that breaking an overall problem down into smaller issues that can be resolved (patched) through localised projects might yield improved results. The policy practitioner is thus acting as a policy entrepreneur who searches for policy windows to eff ect change.261 Some of these opportunities might be community-based and representative of the self-organising potential of complex urban systems, an approach supported by international consensus. Examples of such an approach are local food schemes from city gardens in Detroit, and walking-for-health schemes organised locally by groups of elderly people. However, others will be led by the public sector or partnership bodies that invest in infrastructure. They might include research projects into the unexpected eff ects of new building standards, for example, or policies to guide the planting of greenery in city neighbourhoods. In line with the logic of a complexity approach, the greater the diversity of the promoted projects, the greater the potential for the complex system to be steered towards urban health benefi ts. However, the rapidity of climate change and urbanisation means that issues of scale need to be addressed. How the methods by which successful local initiatives can be turned into appropriate experimentation in other contexts should be decided on quickly.
Second, the assessment of these various experiments therefore needs to be strengthened. Such assessment is diff erent from that usually practised in relation to public health interventions, one that fi ts with ideas of refl exive social learning rather than a modernist idea of reason.262 Such assessment would be based on dialogue, deliberation, and discussion rather than on a technical exercise done by external experts.263 As Costongs and Springett264 argue when discussing assessment, “the particular nature of health-related urban policy demands an open, negotiated and process-orientated approach”; this would also call on a wider range of sources of
Figure 14: City centre farming
Figure 15: A visionary plan for Guangming Smartcity, China
C J L
imC
J Lim
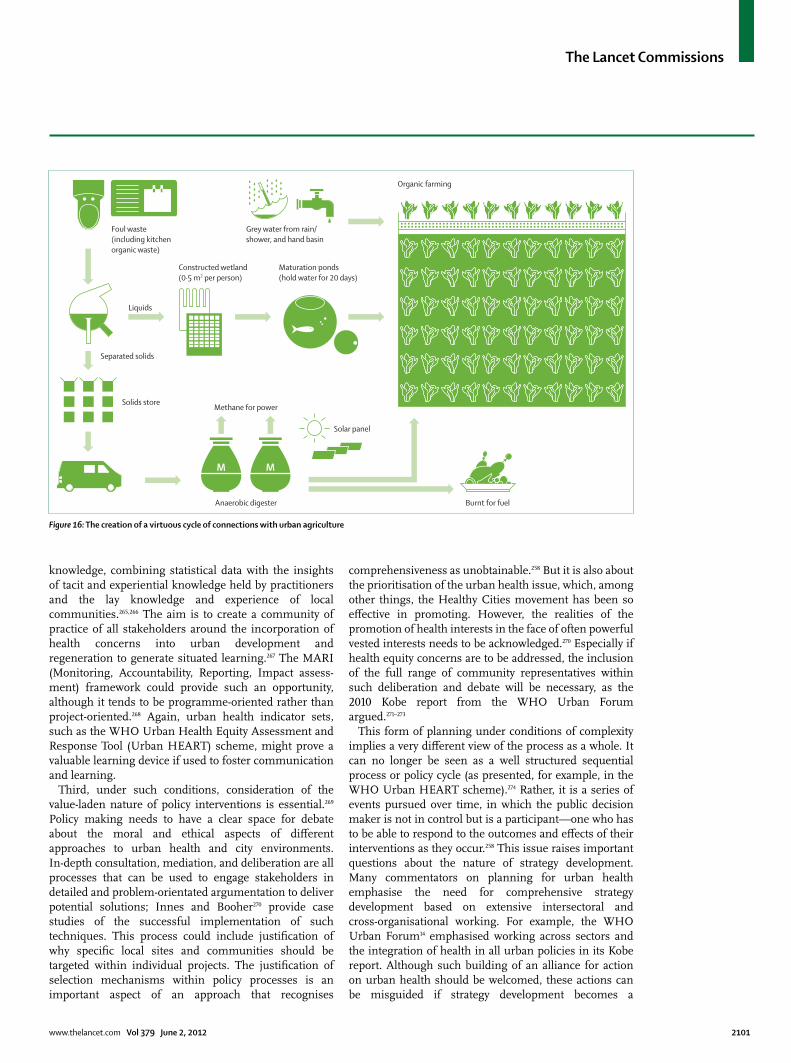
The Lancet Commissions
www.thelancet.com Vol 379 June 2, 2012 2101
knowledge, combining statistical data with the insights of tacit and experiential knowledge held by practitioners and the lay knowledge and experience of local communities.265,266 The aim is to create a community of practice of all stakeholders around the incorporation of health concerns into urban development and regeneration to generate situated learning.267 The MARI (Monitoring, Accountability, Reporting, Impact assess-ment) framework could provide such an opportunity, although it tends to be programme-oriented rather than project-oriented.268 Again, urban health indicator sets, such as the WHO Urban Health Equity Assessment and Response Tool (Urban HEART) scheme, might prove a valuable learning device if used to foster communication and learning.
Third, under such conditions, consideration of the value-laden nature of policy interventions is essential.269 Policy making needs to have a clear space for debate about the moral and ethical aspects of diff erent approaches to urban health and city environments. In-depth consultation, mediation, and deliberation are all processes that can be used to engage stakeholders in detailed and problem-orientated argumentation to deliver potential solutions; Innes and Booher270 provide case studies of the successful implementation of such techniques. This process could include justifi cation of why specifi c local sites and communities should be targeted within individual projects. The justifi cation of selection mechanisms within policy processes is an important aspect of an approach that recognises
comprehensiveness as unobtainable.258 But it is also about the prioritisation of the urban health issue, which, among other things, the Healthy Cities movement has been so eff ective in promoting. However, the realities of the promotion of health interests in the face of often powerful vested interests needs to be acknowledged.270 Especially if health equity concerns are to be addressed, the inclusion of the full range of community repre sentatives within such deliberation and debate will be necessary, as the 2010 Kobe report from the WHO Urban Forum argued.271–273
This form of planning under conditions of complexity implies a very diff erent view of the process as a whole. It can no longer be seen as a well structured sequential process or policy cycle (as presented, for example, in the WHO Urban HEART scheme).274 Rather, it is a series of events pursued over time, in which the public decision maker is not in control but is a participant—one who has to be able to respond to the outcomes and eff ects of their interventions as they occur.258 This issue raises important questions about the nature of strategy development. Many commentators on planning for urban health emphasise the need for comprehensive strategy devel opment based on extensive intersectoral and cross-organisational working. For example, the WHO Urban Forum14 emphasised working across sectors and the integration of health in all urban policies in its Kobe report. Although such building of an alliance for action on urban health should be welcomed, these actions can be misguided if strategy development becomes a
Figure 16: The creation of a virtuous cycle of connections with urban agriculture
Foul waste(including kitchenorganic waste)
Grey water from rain/ shower, and hand basin
Liquids
Separated solids
Solids store
Constructed wetland(0·5 m2 per person)
M M
Anaerobic digester
Methane for power
Solar panel
Organic farming
Burnt for fuel
Maturation ponds(hold water for 20 days)
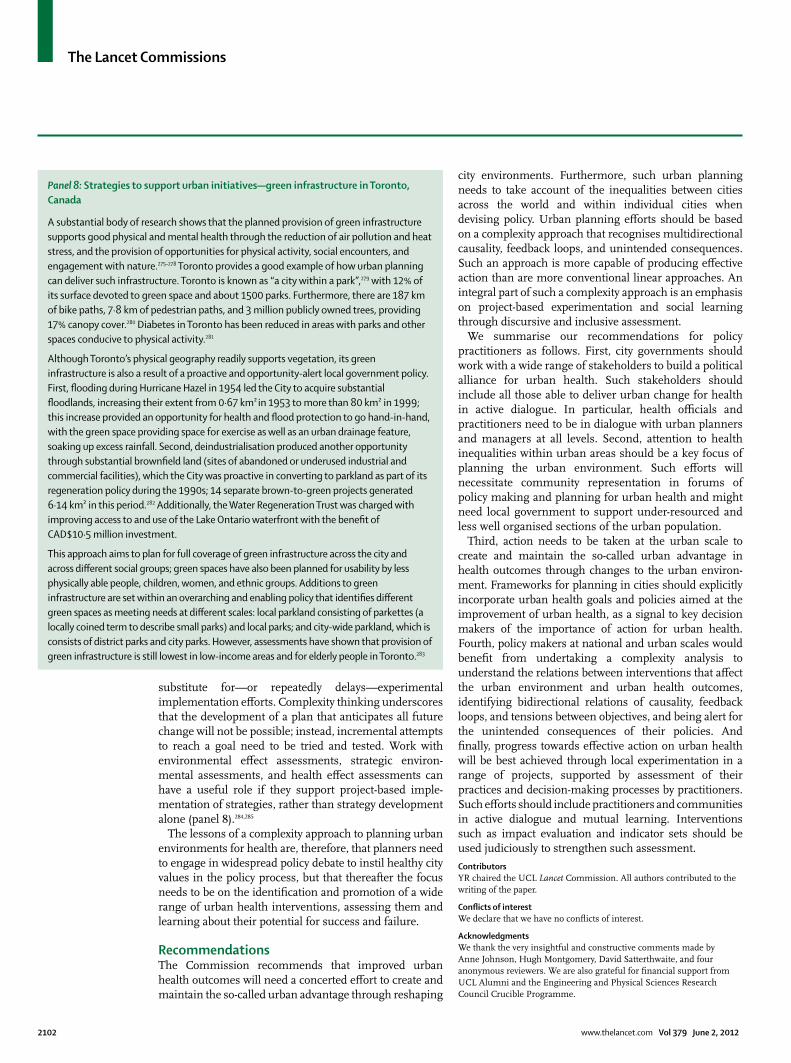
The Lancet Commissions
2102 www.thelancet.com Vol 379 June 2, 2012
substitute for—or repeatedly delays—experimental implementation eff orts. Complexity thinking underscores that the development of a plan that anticipates all future change will not be possible; instead, incremental attempts to reach a goal need to be tried and tested. Work with environmental eff ect assessments, strategic environ-mental assessments, and health eff ect assessments can have a useful role if they support project-based imple-mentation of strategies, rather than strategy development alone (panel 8).284,285
The lessons of a complexity approach to planning urban environments for health are, therefore, that planners need to engage in widespread policy debate to instil healthy city values in the policy process, but that thereafter the focus needs to be on the identifi cation and promotion of a wide range of urban health interventions, assessing them and learning about their potential for success and failure.
RecommendationsThe Commission recommends that improved urban health outcomes will need a concerted eff ort to create and maintain the so-called urban advantage through reshaping
city environ ments. Furthermore, such urban planning needs to take account of the inequalities between cities across the world and within individual cities when devising policy. Urban planning eff orts should be based on a complexity approach that recognises multidirectional causality, feedback loops, and unintended consequences. Such an approach is more capable of producing eff ective action than are more conventional linear approaches. An integral part of such a complexity approach is an emphasis on project-based experimentation and social learning through discursive and inclusive assessment.
We summarise our recommendations for policy practitioners as follows. First, city governments should work with a wide range of stake holders to build a political alliance for urban health. Such stakeholders should include all those able to deliver urban change for health in active dialogue. In particular, health offi cials and practitioners need to be in dialogue with urban planners and managers at all levels. Second, attention to health inequalities within urban areas should be a key focus of planning the urban environment. Such eff orts will necessitate community representation in forums of policy making and planning for urban health and might need local government to support under-resourced and less well organised sections of the urban population.
Third, action needs to be taken at the urban scale to create and maintain the so-called urban advantage in health outcomes through changes to the urban environ-ment. Frameworks for planning in cities should explicitly incorporate urban health goals and policies aimed at the improvement of urban health, as a signal to key decision makers of the importance of action for urban health. Fourth, policy makers at national and urban scales would benefi t from undertaking a com plexity analysis to understand the relations between interventions that aff ect the urban environment and urban health outcomes, identifying bidirectional rela tions of causality, feedback loops, and tensions between objectives, and being alert for the unintended conse quences of their policies. And fi nally, progress towards eff ective action on urban health will be best achieved through local experimentation in a range of projects, supported by assessment of their practices and decision-making processes by practitioners. Such eff orts should include practitioners and communities in active dialogue and mutual learning. Interventions such as impact evaluation and indicator sets should be used judiciously to strengthen such assessment.ContributorsYR chaired the UCL Lancet Commission. All authors contributed to the writing of the paper.
Confl icts of interestWe declare that we have no confl icts of interest.
AcknowledgmentsWe thank the very insightful and constructive comments made by Anne Johnson, Hugh Montgomery, David Satterthwaite, and four anonymous reviewers. We are also grateful for fi nancial support from UCL Alumni and the Engineering and Physical Sciences Research Council Crucible Programme.
Panel 8: Strategies to support urban initiatives—green infrastructure in Toronto, Canada
A substantial body of research shows that the planned provision of green infrastructure supports good physical and mental health through the reduction of air pollution and heat stress, and the provision of opportunities for physical activity, social encounters, and engagement with nature.275–278 Toronto provides a good example of how urban planning can deliver such infrastructure. Toronto is known as “a city within a park”,279 with 12% of its surface devoted to green space and about 1500 parks. Furthermore, there are 187 km of bike paths, 7·8 km of pedestrian paths, and 3 million publicly owned trees, providing 17% canopy cover.280 Diabetes in Toronto has been reduced in areas with parks and other spaces conducive to physical activity.281
Although Toronto’s physical geography readily supports vegetation, its green infrastructure is also a result of a proactive and opportunity-alert local government policy. First, fl ooding during Hurricane Hazel in 1954 led the City to acquire substantial fl oodlands, increasing their extent from 0·67 km² in 1953 to more than 80 km² in 1999; this increase provided an opportunity for health and fl ood protection to go hand-in-hand, with the green space providing space for exercise as well as an urban drainage feature, soaking up excess rainfall. Second, deindustrialisation produced another opportunity through substantial brownfi eld land (sites of abandoned or underused industrial and commercial facilities), which the City was proactive in converting to parkland as part of its regeneration policy during the 1990s; 14 separate brown-to-green projects generated 6·14 km² in this period.282 Additionally, the Water Regeneration Trust was charged with improving access to and use of the Lake Ontario waterfront with the benefi t of CAD$10·5 million investment.
This approach aims to plan for full coverage of green infrastructure across the city and across diff erent social groups; green spaces have also been planned for usability by less physically able people, children, women, and ethnic groups. Additions to green infrastructure are set within an overarching and enabling policy that identifi es diff erent green spaces as meeting needs at diff erent scales: local parkland consisting of parkettes (a locally coined term to describe small parks) and local parks; and city-wide parkland, which is consists of district parks and city parks. However, assessments have shown that provision of green infrastructure is still lowest in low-income areas and for elderly people in Toronto.283
The Lancet Commissions
www.thelancet.com Vol 379 June 2, 2012 2103
References1 United Nations. World urbanization prospects: the 2009 revision.
New York: Department of Economic and Social Aff airs, Population Division, 2010.
2 van Ginkel HJA, Marcotullio PJ. Asian urbanisation and local and global environmental challenges. In: Keiner M, Koll-Schretsenmayr M, Schmid WA, eds. Managing urban futures: sustainability and urban growth in developing countries. Surrey: Ashgate Pub Ltd, 2007.
3 UN Department of Economic and Social Aff airs. Online data: urban and rural population. http://esa.un.org/unpd/wup/unup/index_panel1.html (accessed May 1, 2012).
4 The World Bank. Data—urban population (%). http://data.worldbank.org/indicator/SP.URB.TOTL.IN.ZS (accessed May 1, 2012).
5 Satterthwaite D. The transition to a predominantly urban world and its underpinnings: IIED human settlements, discussion paper series—urban change. London: IIED, 2007.
6 WHO. Megacities and urban health. Kobe: World Health Organization Centre for Health Development, 2009.
7 Kickbush I. The move towards a new public health. Promot Educ 2007; 14: 9.
8 Sclar ED, Garau P, Carolini G. The 21st century health challenge of slums and cities. Lancet 2005; 365: 901–03.
9 WHO. Constitution of the World Health Organization. http://www.who.int/governance/eb/who_constitution_en.pdf (accessed April 16, 2012).
10 Harpham T. Urban health in developing countries: what do we know and where do we go? Health Place 2009; 15: 107–16.
11 Huber M, Knottnerus JA, Green L, et al. How should we defi ne health? BMJ 2011; 343: d4163.
12 Sen A. The Idea of Justice. London: Penguin Books. 2009.13 Marmot M. The Marmot Review. Strategic Review of Health
Inequalities in England post 2010. London, 2000.14 WHO and UN-HABITAT. Hidden cities: unmasking and
overcoming health inequities in urban settings. Kobe: World Health Organization, The WHO Centre for Health Development, Kobe, and United Nations Human Settlements Programme, 2010.
15 Costello A, Abbas M, Allen A, et al. Managing the health eff ects of climate change: Lancet and University College London Institute for Global Health Commission. Lancet 2009; 373: 1693–733.
16 GRNUHE. Improving urban health equity through action on the social and environmental determinants of health: global research network on urban health equity, 2010. London: UCL, 2010.
17 Hughes BB, Kuhn R, Peterson CM, et al. Projections of global health outcomes from 2005 to 2060 using the International Futures integrated forecasting model. Bull World Health Organ 2011; 89: 478–86.
18 Takano T, Nakamura K. An analysis of health levels and various indicators of urban environments for Healthy Cities projects. J Epidemiol Community Health 2001; 55: 263–70.
19 Cutler D, Deaton A, Lleras-Muney A. The determinants of mortality. J Econ Perspect 2006; 20: 97–120.
20 Galea S, Vlahov D. Urban health: evidence, challenges, and directions. Annu Rev Public Health 2005; 26: 341–65.
21 Caldwell J, Caldwell B. Poverty and mortality in the context of economic growth and urbanization. Asia Pac Popul J 2002; 17: 49–66.
22 McGranahan G. Urban environments, wealth and health: shifting burdens and possible responses in low and middle-income nations. London: International Institute for Environment and Development. 2007.
23 Preston SH. The changing relation between mortality and level of economic development. Popul Stud (Camb) 1975; 29: 231–48.
24 Deaton A. Health, inequality, and economic development. J Econ Lit 2003; 41: 113–58.
25 Thompson WS. Population. Am J Sociol 1929; 34: 959–75.26 Omran AR. The epidemiologic transition: a theory of the
epidemiology of population change. Milbank Mem Fund Q 1971; 49: 509–38.
27 Omran AR. The epidemiologic transition theory: a preliminary update. J Trop Pediatr 1983; 29: 305–16.
28 Caldwell JC. Health transition: the cultural, social and behavioural determinants of health in the third world. Soc Sci Med 1993; 36: 125–35.
29 Barnes DF. Population growth, wood fuels, and resource problems in sub-Saharan Africa. in: Acsadi G, Johnson-Acsadi G, Bulatao R, eds. Population growth and reproduction in sub-Saharan Africa. Washington, DC: a World Bank Symposium, 1990.
30 Leach G. The energy transition. Energy Policy 1992; 20: 116–23.31 Wilkinson P, Smith KR, Joff e M, Haines A. A global perspective on
energy: health eff ects and injustices. Lancet 2007; 370: 965–78.32 Pachauri S, Jiang L. The household energy transition in India and
China. Energy Policy 2008; 36: 4022–35.33 Wilkinson P, Smith KR, Davies M, et al. Public health benefi ts of
strategies to reduce greenhouse-gas emissions: household energy. Lancet 2009; 374: 1917–29.
34 Button J. Transport, the environment and sustainable development. London: E&FN Spon, 1993.
35 Bloom DE, Canning D. The Preston Curve 30 years on: still sparking fi res. Int J Epidemiol 2007; 36: 498–99.
36 McKeown T. The role of medicine: dream, mirage, or nemesis. London: Nuffi eld Provincial Hospitals Trust, 1976.
37 McKeown T. The modern rise of population. London: Edward Arnold, 1976.
38 Kunitz SJ. Samuel Preston’s ‘The changing relation between mortality and level of economic development’. Int J Epidemiol 2007; 36: 491–92.
39 Mackenbach JP. The epidemiologic transition theory. J Epidemiol Community Health 1994; 48: 329–31.
40 Wolleswinkel-van den Bosch JH, Looman CWN, Van Poppel FWA, Mackenbach JP. Cause-specifi c mortality trends in The Netherlands, 1875–1992: a formal analysis of the epidemiologic transition. Int J Epidemiol 1997; 26: 772–81.
41 Caldwell JC. Population health in transition. Bull World Health Organ 2001; 79: 159–60.
42 Gage TB. Are modern environments really bad for us?: revisiting the demographic and epidemiologic transitions. Am J Phys Anthropol 2005; 48 (suppl 41): 96–117.
43 Olshansky SJ, Ault AB. The fourth stage of the epidemiologic transition: the age of delayed degenerative diseases. Milbank Q 1986; 64: 355–91.
44 Feinleib M. The epidemiologic transition model: accomplishments and challenges. Ann Epidemiol 2008; 18: 865–67.
45 Salomon JA, Murray CJL. The epidemiologic transition revisited: compositional models for causes of death by age and sex. Popul Dev Rev 2002; 28: 205–28.
46 Olshansky SJ, Carnes B, Rogers RG, Smith L. Infectious diseases—new and ancient threats to world health. Popul Bull 1997; 52: 1–52.
47 Barrett R, Kuzawa CW, McDade T, Armegalos GJ. Emerging and re-emerging infectious diseases: the third epidemiologic transition. Annu Rev Anthropol 1998; 27: 247–71.
48 Cohen ML. Resurgent and emergent disease in a changing world. Br Med Bull 1998; 54: 523–32.
49 Wahdan MH. The epidemiological transition. East Med Health H 1996; 2: 8–20.
50 Smallman-Raynor M, Phillips D. Late stages of epidemiological transition: health status in the developed world. Health Place 1999; 5: 209–22.
51 Rogers RG, Hackenberg R. Extending epidemiologic transition theory: a new stage. Soc Biol 1987; 34: 234–43.
52 Frenk J, Bobadilla JL, Sepulveda J, Lopez Cervantes M. Health transition in middle-income countries: new challenges for health care. Health Policy Plan 1989; 4: 29–39.
53 Stern D, Common M. Is there an Environmental Kuznets Curve for Sulfur? J Environ Econ Manage 2001; 41: 162–78.
54 McGranahan G, Jacobi P, Songsore J. Citizens at risk: from urban sanitation to sustainable cities. London: Earthscan Ltd, 2001.
55 Barnes DF, Krutilla K, Hyde WF. The urban household energy transition: social and environmental impacts in the developing world. London: Earthscan Ltd, 2005.
56 Howden-Chapman P, Viggers H, Chapman R, O’Dea D, Free S, O’Sullivan K. Warm homes: drivers of the demand for heating in the residential sector in New Zealand. Energy Policy 2009; 37: 3387–99.
57 Caballero B, Popkin B. The nutrition transition: diet and disease in the developing world. London: Academic Press, 2002.
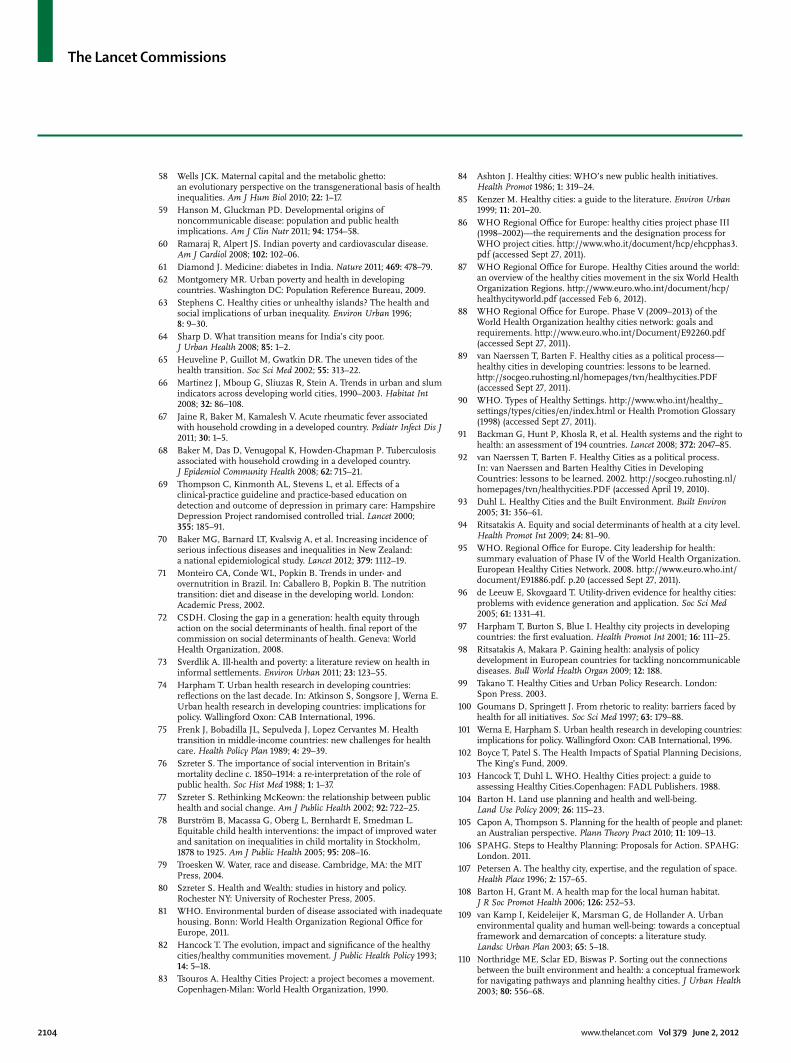
The Lancet Commissions
2104 www.thelancet.com Vol 379 June 2, 2012
58 Wells JCK. Maternal capital and the metabolic ghetto: an evolutionary perspective on the transgenerational basis of health inequalities. Am J Hum Biol 2010; 22: 1–17.
59 Hanson M, Gluckman PD. Developmental origins of noncommunicable disease: population and public health implications. Am J Clin Nutr 2011; 94: 1754–58.
60 Ramaraj R, Alpert JS. Indian poverty and cardiovascular disease. Am J Cardiol 2008; 102: 102–06.
61 Diamond J. Medicine: diabetes in India. Nature 2011; 469: 478–79.62 Montgomery MR. Urban poverty and health in developing
countries. Washington DC: Population Reference Bureau, 2009.63 Stephens C. Healthy cities or unhealthy islands? The health and
social implications of urban inequality. Environ Urban 1996; 8: 9–30.
64 Sharp D. What transition means for India’s city poor. J Urban Health 2008; 85: 1–2.
65 Heuveline P, Guillot M, Gwatkin DR. The uneven tides of the health transition. Soc Sci Med 2002; 55: 313–22.
66 Martinez J, Mboup G, Sliuzas R, Stein A. Trends in urban and slum indicators across developing world cities, 1990–2003. Habitat Int 2008; 32: 86–108.
67 Jaine R, Baker M, Kamalesh V. Acute rheumatic fever associated with household crowding in a developed country. Pediatr Infect Dis J 2011; 30: 1–5.
68 Baker M, Das D, Venugopal K, Howden-Chapman P. Tuberculosis associated with household crowding in a developed country. J Epidemiol Community Health 2008; 62: 715–21.
69 Thompson C, Kinmonth AL, Stevens L, et al. Eff ects of a clinical-practice guideline and practice-based education on detection and outcome of depression in primary care: Hampshire Depression Project randomised controlled trial. Lancet 2000; 355: 185–91.
70 Baker MG, Barnard LT, Kvalsvig A, et al. Increasing incidence of serious infectious diseases and inequalities in New Zealand: a national epidemiological study. Lancet 2012; 379: 1112–19.
71 Monteiro CA, Conde WL, Popkin B. Trends in under- and overnutrition in Brazil. In: Caballero B, Popkin B. The nutrition transition: diet and disease in the developing world. London: Academic Press, 2002.
72 CSDH. Closing the gap in a generation: health equity through action on the social determinants of health. fi nal report of the commission on social determinants of health. Geneva: World Health Organization, 2008.
73 Sverdlik A. Ill-health and poverty: a literature review on health in informal settlements. Environ Urban 2011; 23: 123–55.
74 Harpham T. Urban health research in developing countries: refl ections on the last decade. In: Atkinson S, Songsore J, Werna E. Urban health research in developing countries: implications for policy. Wallingford Oxon: CAB International, 1996.
75 Frenk J, Bobadilla JL, Sepulveda J, Lopez Cervantes M. Health transition in middle-income countries: new challenges for health care. Health Policy Plan 1989; 4: 29–39.
76 Szreter S. The importance of social intervention in Britain’s mortality decline c. 1850–1914: a re-interpretation of the role of public health. Soc Hist Med 1988; 1: 1–37.
77 Szreter S. Rethinking McKeown: the relationship between public health and social change. Am J Public Health 2002; 92: 722–25.
78 Burström B, Macassa G, Oberg L, Bernhardt E, Smedman L. Equitable child health interventions: the impact of improved water and sanitation on inequalities in child mortality in Stockholm, 1878 to 1925. Am J Public Health 2005; 95: 208–16.
79 Troesken W. Water, race and disease. Cambridge, MA: the MIT Press, 2004.
80 Szreter S. Health and Wealth: studies in history and policy. Rochester NY: University of Rochester Press, 2005.
81 WHO. Environmental burden of disease associated with inadequate housing. Bonn: World Health Organization Regional Offi ce for Europe, 2011.
82 Hancock T. The evolution, impact and signifi cance of the healthy cities/healthy communities movement. J Public Health Policy 1993; 14: 5–18.
83 Tsouros A. Healthy Cities Project: a project becomes a movement. Copenhagen-Milan: World Health Organization, 1990.
84 Ashton J. Healthy cities: WHO’s new public health initiatives. Health Promot 1986; 1: 319–24.
85 Kenzer M. Healthy cities: a guide to the literature. Environ Urban 1999; 11: 201–20.
86 WHO Regional Offi ce for Europe: healthy cities project phase III (1998–2002)—the requirements and the designation process for WHO project cities. http://www.who.it/document/hcp/ehcpphas3.pdf (accessed Sept 27, 2011).
87 WHO Regional Offi ce for Europe. Healthy Cities around the world: an overview of the healthy cities movement in the six World Health Organization Regions. http://www.euro.who.int/document/hcp/healthycityworld.pdf (accessed Feb 6, 2012).
88 WHO Regional Offi ce for Europe. Phase V (2009–2013) of the World Health Organization healthy cities network: goals and requirements. http://www.euro.who.int/Document/E92260.pdf (accessed Sept 27, 2011).
89 van Naerssen T, Barten F. Healthy cities as a political process—healthy cities in developing countries: lessons to be learned. http://socgeo.ruhosting.nl/homepages/tvn/healthycities.PDF (accessed Sept 27, 2011).
90 WHO. Types of Healthy Settings. http://www.who.int/healthy_settings/types/cities/en/index.html or Health Promotion Glossary (1998) (accessed Sept 27, 2011).
91 Backman G, Hunt P, Khosla R, et al. Health systems and the right to health: an assessment of 194 countries. Lancet 2008; 372: 2047–85.
92 van Naerssen T, Barten F. Healthy Cities as a political process. In: van Naerssen and Barten Healthy Cities in Developing Countries: lessons to be learned. 2002. http://socgeo.ruhosting.nl/homepages/tvn/healthycities.PDF (accessed April 19, 2010).
93 Duhl L. Healthy Cities and the Built Environment. Built Environ 2005; 31: 356–61.
94 Ritsatakis A. Equity and social determinants of health at a city level. Health Promot Int 2009; 24: 81–90.
95 WHO. Regional Offi ce for Europe. City leadership for health: summary evaluation of Phase IV of the World Health Organization. European Healthy Cities Network. 2008. http://www.euro.who.int/document/E91886.pdf. p.20 (accessed Sept 27, 2011).
96 de Leeuw E, Skovgaard T. Utility-driven evidence for healthy cities: problems with evidence generation and application. Soc Sci Med 2005; 61: 1331–41.
97 Harpham T, Burton S, Blue I. Healthy city projects in developing countries: the fi rst evaluation. Health Promot Int 2001; 16: 111–25.
98 Ritsatakis A, Makara P. Gaining health: analysis of policy development in European countries for tackling noncommunicable diseases. Bull World Health Organ 2009; 12: 188.
99 Takano T. Healthy Cities and Urban Policy Research. London: Spon Press. 2003.
100 Goumans D, Springett J. From rhetoric to reality: barriers faced by health for all initiatives. Soc Sci Med 1997; 63: 179–88.
101 Werna E, Harpham S. Urban health research in developing countries: implications for policy. Wallingford Oxon: CAB International, 1996.
102 Boyce T, Patel S. The Health Impacts of Spatial Planning Decisions, The King’s Fund, 2009.
103 Hancock T, Duhl L. WHO. Healthy Cities project: a guide to assessing Healthy Cities.Copenhagen: FADL Publishers. 1988.
104 Barton H. Land use planning and health and well-being. Land Use Policy 2009; 26: 115–23.
105 Capon A, Thompson S. Planning for the health of people and planet: an Australian perspective. Plann Theory Pract 2010; 11: 109–13.
106 SPAHG. Steps to Healthy Planning: Proposals for Action. SPAHG: London. 2011.
107 Petersen A. The healthy city, expertise, and the regulation of space. Health Place 1996; 2: 157–65.
108 Barton H, Grant M. A health map for the local human habitat. J R Soc Promot Health 2006; 126: 252–53.
109 van Kamp I, Keideleijer K, Marsman G, de Hollander A. Urban environmental quality and human well-being: towards a conceptual framework and demarcation of concepts: a literature study. Landsc Urban Plan 2003; 65: 5–18.
110 Northridge ME, Sclar ED, Biswas P. Sorting out the connections between the built environment and health: a conceptual framework for navigating pathways and planning healthy cities. J Urban Health 2003; 80: 556–68.
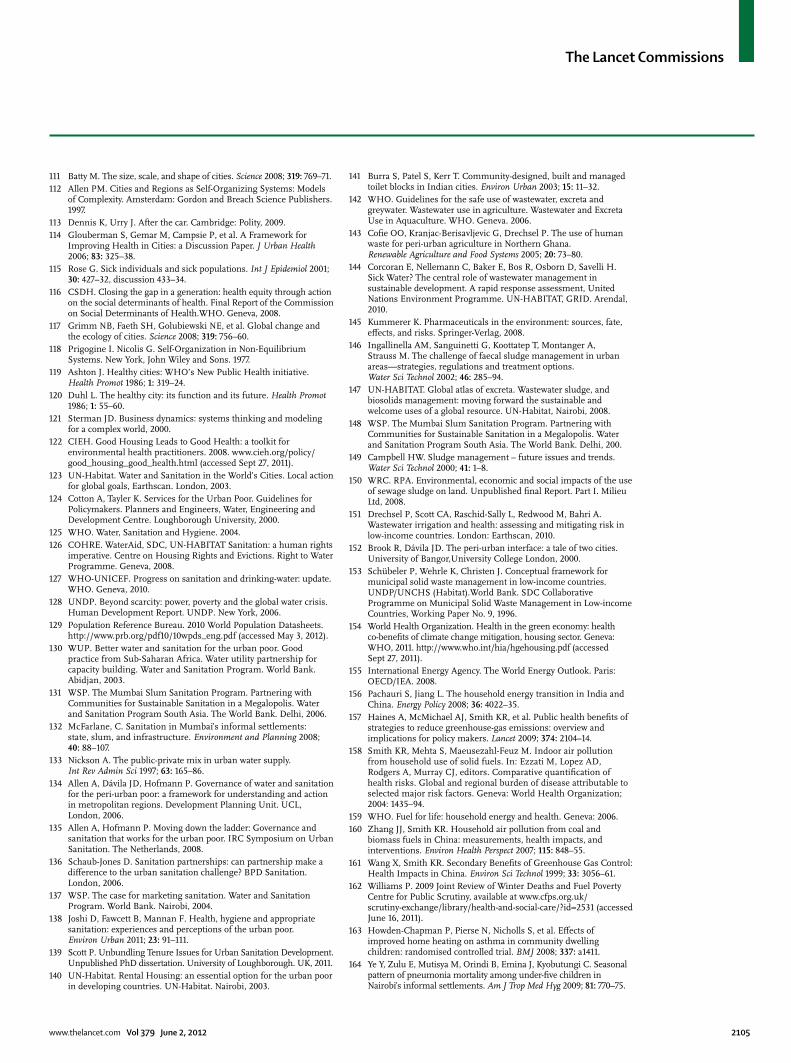
The Lancet Commissions
www.thelancet.com Vol 379 June 2, 2012 2105
111 Batty M. The size, scale, and shape of cities. Science 2008; 319: 769–71.112 Allen PM. Cities and Regions as Self-Organizing Systems: Models
of Complexity. Amsterdam: Gordon and Breach Science Publishers. 1997.
113 Dennis K, Urry J. After the car. Cambridge: Polity, 2009.114 Glouberman S, Gemar M, Campsie P, et al. A Framework for
Improving Health in Cities: a Discussion Paper. J Urban Health 2006; 83: 325–38.
115 Rose G. Sick individuals and sick populations. Int J Epidemiol 2001; 30: 427–32, discussion 433–34.
116 CSDH. Closing the gap in a generation: health equity through action on the social determinants of health. Final Report of the Commission on Social Determinants of Health.WHO. Geneva, 2008.
117 Grimm NB, Faeth SH, Golubiewski NE, et al. Global change and the ecology of cities. Science 2008; 319: 756–60.
118 Prigogine I. Nicolis G. Self-Organization in Non-Equilibrium Systems. New York, John Wiley and Sons. 1977.
119 Ashton J. Healthy cities: WHO’s New Public Health initiative. Health Promot 1986; 1: 319–24.
120 Duhl L. The healthy city: its function and its future. Health Promot 1986; 1: 55–60.
121 Sterman JD. Business dynamics: systems thinking and modeling for a complex world, 2000.
122 CIEH. Good Housing Leads to Good Health: a toolkit for environmental health practitioners. 2008. www.cieh.org/policy/good_housing_good_health.html (accessed Sept 27, 2011).
123 UN-Habitat. Water and Sanitation in the World’s Cities. Local action for global goals, Earthscan. London, 2003.
124 Cotton A, Tayler K. Services for the Urban Poor. Guidelines for Policymakers. Planners and Engineers, Water, Engineering and Development Centre. Loughborough University, 2000.
125 WHO. Water, Sanitation and Hygiene. 2004.126 COHRE. WaterAid, SDC, UN-HABITAT Sanitation: a human rights
imperative. Centre on Housing Rights and Evictions. Right to Water Programme. Geneva, 2008.
127 WHO-UNICEF. Progress on sanitation and drinking-water: update. WHO. Geneva, 2010.
128 UNDP. Beyond scarcity: power, poverty and the global water crisis. Human Development Report. UNDP. New York, 2006.
129 Population Reference Bureau. 2010 World Population Datasheets. http://www.prb.org/pdf10/10wpds_eng.pdf (accessed May 3, 2012).
130 WUP. Better water and sanitation for the urban poor. Good practice from Sub-Saharan Africa. Water utility partnership for capacity building. Water and Sanitation Program. World Bank. Abidjan, 2003.
131 WSP. The Mumbai Slum Sanitation Program. Partnering with Communities for Sustainable Sanitation in a Megalopolis. Water and Sanitation Program South Asia. The World Bank. Delhi, 2006.
132 McFarlane, C. Sanitation in Mumbai’s informal settlements: state, slum, and infrastructure. Environment and Planning 2008; 40: 88–107.
133 Nickson A. The public-private mix in urban water supply. Int Rev Admin Sci 1997; 63: 165–86.
134 Allen A, Dávila JD, Hofmann P. Governance of water and sanitation for the peri-urban poor: a framework for understanding and action in metropolitan regions. Development Planning Unit. UCL, London, 2006.
135 Allen A, Hofmann P. Moving down the ladder: Governance and sanitation that works for the urban poor. IRC Symposium on Urban Sanitation. The Netherlands, 2008.
136 Schaub-Jones D. Sanitation partnerships: can partnership make a diff erence to the urban sanitation challenge? BPD Sanitation. London, 2006.
137 WSP. The case for marketing sanitation. Water and Sanitation Program. World Bank. Nairobi, 2004.
138 Joshi D, Fawcett B, Mannan F. Health, hygiene and appropriate sanitation: experiences and perceptions of the urban poor. Environ Urban 2011; 23: 91–111.
139 Scott P. Unbundling Tenure Issues for Urban Sanitation Development. Unpublished PhD dissertation. University of Loughborough. UK, 2011.
140 UN-Habitat. Rental Housing: an essential option for the urban poor in developing countries. UN-Habitat. Nairobi, 2003.
141 Burra S, Patel S, Kerr T. Community-designed, built and managed toilet blocks in Indian cities. Environ Urban 2003; 15: 11–32.
142 WHO. Guidelines for the safe use of wastewater, excreta and greywater. Wastewater use in agriculture. Wastewater and Excreta Use in Aquaculture. WHO. Geneva. 2006.
143 Cofi e OO, Kranjac-Berisavljevic G, Drechsel P. The use of human waste for peri-urban agriculture in Northern Ghana. Renewable Agriculture and Food Systems 2005; 20: 73–80.
144 Corcoran E, Nellemann C, Baker E, Bos R, Osborn D, Savelli H. Sick Water? The central role of wastewater management in sustainable development. A rapid response assessment, United Nations Environment Programme. UN-HABITAT, GRID. Arendal, 2010.
145 Kummerer K. Pharmaceuticals in the environment: sources, fate, eff ects, and risks. Springer-Verlag, 2008.
146 Ingallinella AM, Sanguinetti G, Koottatep T, Montanger A, Strauss M. The challenge of faecal sludge management in urban areas—strategies, regulations and treatment options. Water Sci Technol 2002; 46: 285–94.
147 UN-HABITAT. Global atlas of excreta. Wastewater sludge, and biosolids management: moving forward the sustainable and welcome uses of a global resource. UN-Habitat, Nairobi, 2008.
148 WSP. The Mumbai Slum Sanitation Program. Partnering with Communities for Sustainable Sanitation in a Megalopolis. Water and Sanitation Program South Asia. The World Bank. Delhi, 200.
149 Campbell HW. Sludge management – future issues and trends. Water Sci Technol 2000; 41: 1–8.
150 WRC. RPA. Environmental, economic and social impacts of the use of sewage sludge on land. Unpublished fi nal Report. Part I. Milieu Ltd, 2008.
151 Drechsel P, Scott CA, Raschid-Sally L, Redwood M, Bahri A. Wastewater irrigation and health: assessing and mitigating risk in low-income countries. London: Earthscan, 2010.
152 Brook R, Dávila JD. The peri-urban interface: a tale of two cities. University of Bangor,University College London, 2000.
153 Schübeler P, Wehrle K, Christen J. Conceptual framework for municipal solid waste management in low-income countries. UNDP/UNCHS (Habitat).World Bank. SDC Collaborative Programme on Municipal Solid Waste Management in Low-income Countries, Working Paper No. 9, 1996.
154 World Health Organization. Health in the green economy: health co-benefi ts of climate change mitigation, housing sector. Geneva: WHO, 2011. http://www.who.int/hia/hgehousing.pdf (accessed Sept 27, 2011).
155 International Energy Agency. The World Energy Outlook. Paris: OECD/IEA. 2008.
156 Pachauri S, Jiang L. The household energy transition in India and China. Energy Policy 2008; 36: 4022–35.
157 Haines A, McMichael AJ, Smith KR, et al. Public health benefi ts of strategies to reduce greenhouse-gas emissions: overview and implications for policy makers. Lancet 2009; 374: 2104–14.
158 Smith KR, Mehta S, Maeusezahl-Feuz M. Indoor air pollution from household use of solid fuels. In: Ezzati M, Lopez AD, Rodgers A, Murray CJ, editors. Comparative quantifi cation of health risks. Global and regional burden of disease attributable to selected major risk factors. Geneva: World Health Organization; 2004: 1435–94.
159 WHO. Fuel for life: household energy and health. Geneva: 2006.160 Zhang JJ, Smith KR. Household air pollution from coal and
biomass fuels in China: measurements, health impacts, and interventions. Environ Health Perspect 2007; 115: 848–55.
161 Wang X, Smith KR. Secondary Benefi ts of Greenhouse Gas Control: Health Impacts in China. Environ Sci Technol 1999; 33: 3056–61.
162 Williams P. 2009 Joint Review of Winter Deaths and Fuel Poverty Centre for Public Scrutiny, available at www.cfps.org.uk/scrutiny-exchange/library/health-and-social-care/?id=2531 (accessed June 16, 2011).
163 Howden-Chapman P, Pierse N, Nicholls S, et al. Eff ects of improved home heating on asthma in community dwelling children: randomised controlled trial. BMJ 2008; 337: a1411.
164 Ye Y, Zulu E, Mutisya M, Orindi B, Emina J, Kyobutungi C. Seasonal pattern of pneumonia mortality among under-fi ve children in Nairobi’s informal settlements. Am J Trop Med Hyg 2009; 81: 770–75.
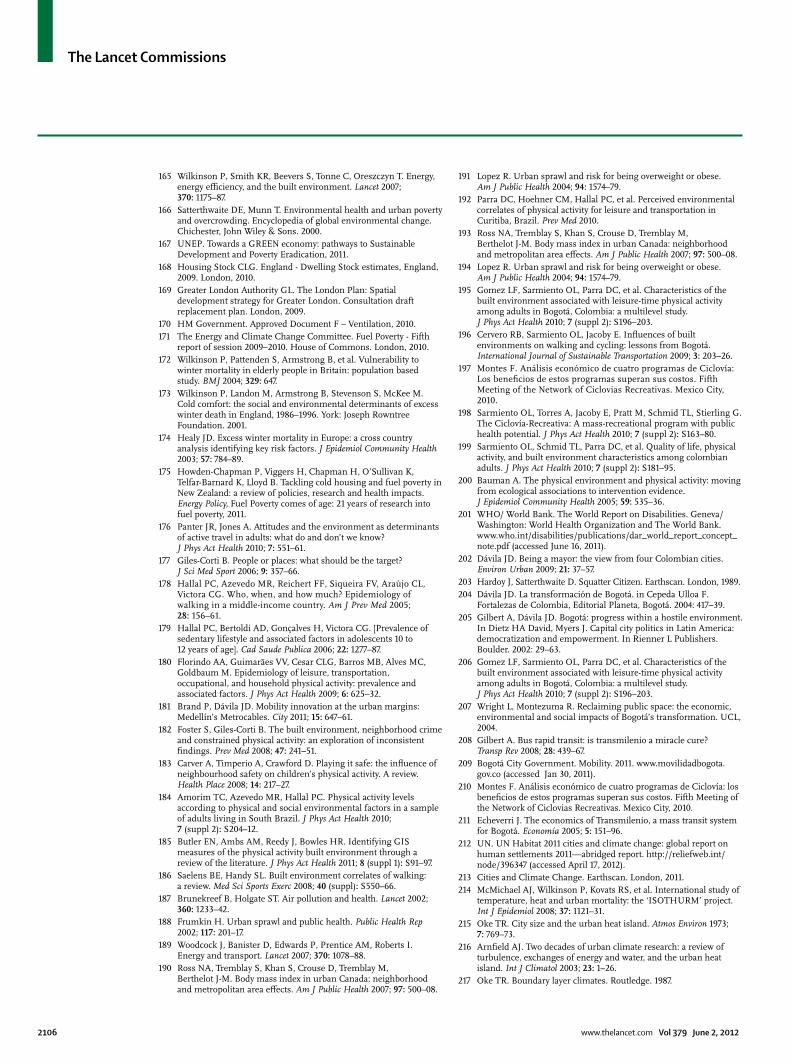
The Lancet Commissions
2106 www.thelancet.com Vol 379 June 2, 2012
165 Wilkinson P, Smith KR, Beevers S, Tonne C, Oreszczyn T. Energy, energy effi ciency, and the built environment. Lancet 2007; 370: 1175–87.
166 Satterthwaite DE, Munn T. Environmental health and urban poverty and overcrowding. Encyclopedia of global environmental change. Chichester, John Wiley & Sons. 2000.
167 UNEP. Towards a GREEN economy: pathways to Sustainable Development and Poverty Eradication, 2011.
168 Housing Stock CLG. England - Dwelling Stock estimates, England, 2009. London, 2010.
169 Greater London Authority GL. The London Plan: Spatial development strategy for Greater London. Consultation draft replacement plan. London, 2009.
170 HM Government. Approved Document F – Ventilation, 2010.171 The Energy and Climate Change Committee. Fuel Poverty - Fifth
report of session 2009–2010. House of Commons. London, 2010.172 Wilkinson P, Pattenden S, Armstrong B, et al. Vulnerability to
winter mortality in elderly people in Britain: population based study. BMJ 2004; 329: 647.
173 Wilkinson P, Landon M, Armstrong B, Stevenson S, McKee M. Cold comfort: the social and environmental determinants of excess winter death in England, 1986–1996. York: Joseph Rowntree Foundation. 2001.
174 Healy JD. Excess winter mortality in Europe: a cross country analysis identifying key risk factors. J Epidemiol Community Health 2003; 57: 784–89.
175 Howden-Chapman P, Viggers H, Chapman H, O’Sullivan K, Telfar-Barnard K, Lloyd B. Tackling cold housing and fuel poverty in New Zealand: a review of policies, research and health impacts. Energy Policy, Fuel Poverty comes of age: 21 years of research into fuel poverty, 2011.
176 Panter JR, Jones A. Attitudes and the environment as determinants of active travel in adults: what do and don’t we know? J Phys Act Health 2010; 7: 551–61.
177 Giles-Corti B. People or places: what should be the target? J Sci Med Sport 2006; 9: 357–66.
178 Hallal PC, Azevedo MR, Reichert FF, Siqueira FV, Araújo CL, Victora CG. Who, when, and how much? Epidemiology of walking in a middle-income country. Am J Prev Med 2005; 28: 156–61.
179 Hallal PC, Bertoldi AD, Gonçalves H, Victora CG. [Prevalence of sedentary lifestyle and associated factors in adolescents 10 to 12 years of age]. Cad Saude Publica 2006; 22: 1277–87.
180 Florindo AA, Guimarães VV, Cesar CLG, Barros MB, Alves MC, Goldbaum M. Epidemiology of leisure, transportation, occupational, and household physical activity: prevalence and associated factors. J Phys Act Health 2009; 6: 625–32.
181 Brand P, Dávila JD. Mobility innovation at the urban margins: Medellín’s Metrocables. City 2011; 15: 647–61.
182 Foster S, Giles-Corti B. The built environment, neighborhood crime and constrained physical activity: an exploration of inconsistent fi ndings. Prev Med 2008; 47: 241–51.
183 Carver A, Timperio A, Crawford D. Playing it safe: the infl uence of neighbourhood safety on children’s physical activity. A review. Health Place 2008; 14: 217–27.
184 Amorim TC, Azevedo MR, Hallal PC. Physical activity levels according to physical and social environmental factors in a sample of adults living in South Brazil. J Phys Act Health 2010; 7 (suppl 2): S204–12.
185 Butler EN, Ambs AM, Reedy J, Bowles HR. Identifying GIS measures of the physical activity built environment through a review of the literature. J Phys Act Health 2011; 8 (suppl 1): S91–97.
186 Saelens BE, Handy SL. Built environment correlates of walking: a review. Med Sci Sports Exerc 2008; 40 (suppl): S550–66.
187 Brunekreef B, Holgate ST. Air pollution and health. Lancet 2002; 360: 1233–42.
188 Frumkin H. Urban sprawl and public health. Public Health Rep 2002; 117: 201–17.
189 Woodcock J, Banister D, Edwards P, Prentice AM, Roberts I. Energy and transport. Lancet 2007; 370: 1078–88.
190 Ross NA, Tremblay S, Khan S, Crouse D, Tremblay M, Berthelot J-M. Body mass index in urban Canada: neighborhood and metropolitan area eff ects. Am J Public Health 2007; 97: 500–08.
191 Lopez R. Urban sprawl and risk for being overweight or obese. Am J Public Health 2004; 94: 1574–79.
192 Parra DC, Hoehner CM, Hallal PC, et al. Perceived environmental correlates of physical activity for leisure and transportation in Curitiba, Brazil. Prev Med 2010.
193 Ross NA, Tremblay S, Khan S, Crouse D, Tremblay M, Berthelot J-M. Body mass index in urban Canada: neighborhood and metropolitan area eff ects. Am J Public Health 2007; 97: 500–08.
194 Lopez R. Urban sprawl and risk for being overweight or obese. Am J Public Health 2004; 94: 1574–79.
195 Gomez LF, Sarmiento OL, Parra DC, et al. Characteristics of the built environment associated with leisure-time physical activity among adults in Bogotá, Colombia: a multilevel study. J Phys Act Health 2010; 7 (suppl 2): S196–203.
196 Cervero RB, Sarmiento OL, Jacoby E. Infl uences of built environments on walking and cycling: lessons from Bogotá. International Journal of Sustainable Transportation 2009; 3: 203–26.
197 Montes F. Análisis económico de cuatro programas de Ciclovía: Los benefi cios de estos programas superan sus costos. Fifth Meeting of the Network of Ciclovias Recreativas. Mexico City, 2010.
198 Sarmiento OL, Torres A, Jacoby E, Pratt M, Schmid TL, Stierling G. The Ciclovía-Recreativa: A mass-recreational program with public health potential. J Phys Act Health 2010; 7 (suppl 2): S163–80.
199 Sarmiento OL, Schmid TL, Parra DC, et al. Quality of life, physical activity, and built environment characteristics among colombian adults. J Phys Act Health 2010; 7 (suppl 2): S181–95.
200 Bauman A. The physical environment and physical activity: moving from ecological associations to intervention evidence. J Epidemiol Community Health 2005; 59: 535–36.
201 WHO/ World Bank. The World Report on Disabilities. Geneva/Washington: World Health Organization and The World Bank. www.who.int/disabilities/publications/dar_world_report_concept_note.pdf (accessed June 16, 2011).
202 Dávila JD. Being a mayor: the view from four Colombian cities. Environ Urban 2009; 21: 37–57.
203 Hardoy J, Satterthwaite D. Squatter Citizen. Earthscan. London, 1989.204 Dávila JD. La transformación de Bogotá. in Cepeda Ulloa F.
Fortalezas de Colombia, Editorial Planeta, Bogotá. 2004: 417–39.205 Gilbert A, Dávila JD. Bogotá: progress within a hostile environment.
In Dietz HA David, Myers J. Capital city politics in Latin America: democratization and empowerment. In Rienner L Publishers. Boulder. 2002: 29–63.
206 Gomez LF, Sarmiento OL, Parra DC, et al. Characteristics of the built environment associated with leisure-time physical activity among adults in Bogotá, Colombia: a multilevel study. J Phys Act Health 2010; 7 (suppl 2): S196–203.
207 Wright L, Montezuma R. Reclaiming public space: the economic, environmental and social impacts of Bogotá’s transformation. UCL, 2004.
208 Gilbert A. Bus rapid transit: is transmilenio a miracle cure? Transp Rev 2008; 28: 439–67.
209 Bogotá City Government. Mobility. 2011. www.movilidadbogota.gov.co (accessed Jan 30, 2011).
210 Montes F. Análisis económico de cuatro programas de Ciclovía: los benefi cios de estos programas superan sus costos. Fifth Meeting of the Network of Ciclovias Recreativas. Mexico City, 2010.
211 Echeverri J. The economics of Transmilenio, a mass transit system for Bogotá. Economía 2005; 5: 151–96.
212 UN. UN Habitat 2011 cities and climate change: global report on human settlements 2011—abridged report. http://reliefweb.int/node/396347 (accessed April 17, 2012).
213 Cities and Climate Change. Earthscan. London, 2011.214 McMichael AJ, Wilkinson P, Kovats RS, et al. International study of
temperature, heat and urban mortality: the ‘ISOTHURM’ project. Int J Epidemiol 2008; 37: 1121–31.
215 Oke TR. City size and the urban heat island. Atmos Environ 1973; 7: 769–73.
216 Arnfi eld AJ. Two decades of urban climate research: a review of turbulence, exchanges of energy and water, and the urban heat island. Int J Climatol 2003; 23: 1–26.
217 Oke TR. Boundary layer climates. Routledge. 1987.
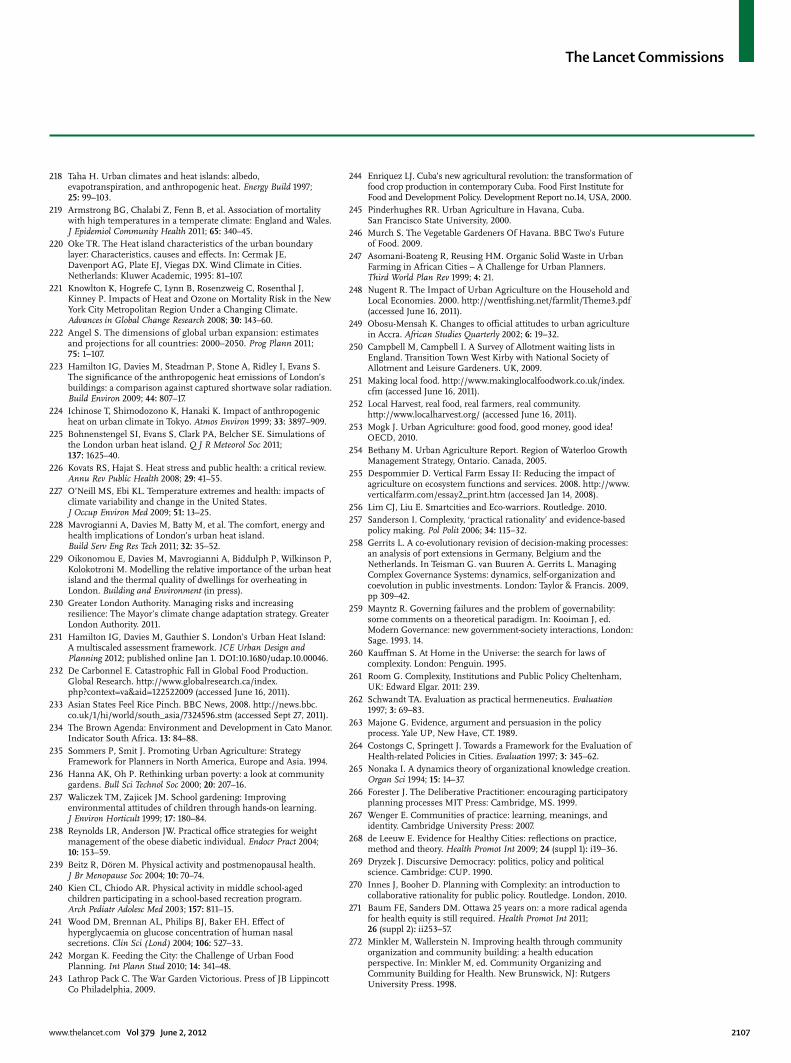
The Lancet Commissions
www.thelancet.com Vol 379 June 2, 2012 2107
218 Taha H. Urban climates and heat islands: albedo, evapotranspiration, and anthropogenic heat. Energy Build 1997; 25: 99–103.
219 Armstrong BG, Chalabi Z, Fenn B, et al. Association of mortality with high temperatures in a temperate climate: England and Wales. J Epidemiol Community Health 2011; 65: 340–45.
220 Oke TR. The Heat island characteristics of the urban boundary layer: Characteristics, causes and eff ects. In: Cermak JE, Davenport AG, Plate EJ, Viegas DX. Wind Climate in Cities. Netherlands: Kluwer Academic, 1995: 81–107.
221 Knowlton K, Hogrefe C, Lynn B, Rosenzweig C, Rosenthal J, Kinney P. Impacts of Heat and Ozone on Mortality Risk in the New York City Metropolitan Region Under a Changing Climate. Advances in Global Change Research 2008; 30: 143–60.
222 Angel S. The dimensions of global urban expansion: estimates and projections for all countries: 2000–2050. Prog Plann 2011; 75: 1–107.
223 Hamilton IG, Davies M, Steadman P, Stone A, Ridley I, Evans S. The signifi cance of the anthropogenic heat emissions of London’s buildings: a comparison against captured shortwave solar radiation. Build Environ 2009; 44: 807–17.
224 Ichinose T, Shimodozono K, Hanaki K. Impact of anthropogenic heat on urban climate in Tokyo. Atmos Environ 1999; 33: 3897–909.
225 Bohnenstengel SI, Evans S, Clark PA, Belcher SE. Simulations of the London urban heat island. Q J R Meteorol Soc 2011; 137: 1625–40.
226 Kovats RS, Hajat S. Heat stress and public health: a critical review. Annu Rev Public Health 2008; 29: 41–55.
227 O’Neill MS, Ebi KL. Temperature extremes and health: impacts of climate variability and change in the United States. J Occup Environ Med 2009; 51: 13–25.
228 Mavrogianni A, Davies M, Batty M, et al. The comfort, energy and health implications of London’s urban heat island. Build Serv Eng Res Tech 2011; 32: 35–52.
229 Oikonomou E, Davies M, Mavrogianni A, Biddulph P, Wilkinson P, Kolokotroni M. Modelling the relative importance of the urban heat island and the thermal quality of dwellings for overheating in London. Building and Environment (in press).
230 Greater London Authority. Managing risks and increasing resilience: The Mayor’s climate change adaptation strategy. Greater London Authority. 2011.
231 Hamilton IG, Davies M, Gauthier S. London’s Urban Heat Island: A multiscaled assessment framework. ICE Urban Design and Planning 2012; published online Jan 1. DOI:10.1680/udap.10.00046.
232 De Carbonnel E. Catastrophic Fall in Global Food Production. Global Research. http://www.globalresearch.ca/index.php?context=va&aid=122522009 (accessed June 16, 2011).
233 Asian States Feel Rice Pinch. BBC News, 2008. http://news.bbc.co.uk/1/hi/world/south_asia/7324596.stm (accessed Sept 27, 2011).
234 The Brown Agenda: Environment and Development in Cato Manor. Indicator South Africa. 13: 84–88.
235 Sommers P, Smit J. Promoting Urban Agriculture: Strategy Framework for Planners in North America, Europe and Asia. 1994.
236 Hanna AK, Oh P. Rethinking urban poverty: a look at community gardens. Bull Sci Technol Soc 2000; 20: 207–16.
237 Waliczek TM, Zajicek JM. School gardening: Improving environmental attitudes of children through hands-on learning. J Environ Horticult 1999; 17: 180–84.
238 Reynolds LR, Anderson JW. Practical offi ce strategies for weight management of the obese diabetic individual. Endocr Pract 2004; 10: 153–59.
239 Beitz R, Dören M. Physical activity and postmenopausal health. J Br Menopause Soc 2004; 10: 70–74.
240 Kien CL, Chiodo AR. Physical activity in middle school-aged children participating in a school-based recreation program. Arch Pediatr Adolesc Med 2003; 157: 811–15.
241 Wood DM, Brennan AL, Philips BJ, Baker EH. Eff ect of hyperglycaemia on glucose concentration of human nasal secretions. Clin Sci (Lond) 2004; 106: 527–33.
242 Morgan K. Feeding the City: the Challenge of Urban Food Planning. Int Plann Stud 2010; 14: 341–48.
243 Lathrop Pack C. The War Garden Victorious. Press of JB Lippincott Co Philadelphia, 2009.
244 Enriquez LJ. Cuba’s new agricultural revolution: the transformation of food crop production in contemporary Cuba. Food First Institute for Food and Development Policy. Development Report no.14, USA, 2000.
245 Pinderhughes RR. Urban Agriculture in Havana, Cuba. San Francisco State University, 2000.
246 Murch S. The Vegetable Gardeners Of Havana. BBC Two’s Future of Food. 2009.
247 Asomani-Boateng R, Reusing HM. Organic Solid Waste in Urban Farming in African Cities – A Challenge for Urban Planners. Third World Plan Rev 1999; 4: 21.
248 Nugent R. The Impact of Urban Agriculture on the Household and Local Economies. 2000. http://wentfi shing.net/farmlit/Theme3.pdf (accessed June 16, 2011).
249 Obosu-Mensah K. Changes to offi cial attitudes to urban agriculture in Accra. African Studies Quarterly 2002; 6: 19–32.
250 Campbell M, Campbell I. A Survey of Allotment waiting lists in England. Transition Town West Kirby with National Society of Allotment and Leisure Gardeners. UK, 2009.
251 Making local food. http://www.makinglocalfoodwork.co.uk/index.cfm (accessed June 16, 2011).
252 Local Harvest, real food, real farmers, real community. http://www.localharvest.org/ (accessed June 16, 2011).
253 Mogk J. Urban Agriculture: good food, good money, good idea! OECD, 2010.
254 Bethany M. Urban Agriculture Report. Region of Waterloo Growth Management Strategy, Ontario. Canada, 2005.
255 Despommier D. Vertical Farm Essay II: Reducing the impact of agriculture on ecosystem functions and services. 2008. http://www.verticalfarm.com/essay2_print.htm (accessed Jan 14, 2008).
256 Lim CJ, Liu E. Smartcities and Eco-warriors. Routledge. 2010.257 Sanderson I. Complexity, ‘practical rationality’ and evidence-based
policy making. Pol Polit 2006; 34: 115–32.258 Gerrits L. A co-evolutionary revision of decision-making processes:
an analysis of port extensions in Germany, Belgium and the Netherlands. In Teisman G. van Buuren A. Gerrits L. Managing Complex Governance Systems: dynamics, self-organization and coevolution in public investments. London: Taylor & Francis. 2009, pp 309–42.
259 Mayntz R. Governing failures and the problem of governability: some comments on a theoretical paradigm. In: Kooiman J, ed. Modern Governance: new government-society interactions, London: Sage. 1993. 14.
260 Kauff man S. At Home in the Universe: the search for laws of complexity. London: Penguin. 1995.
261 Room G. Complexity, Institutions and Public Policy Cheltenham, UK: Edward Elgar. 2011: 239.
262 Schwandt TA. Evaluation as practical hermeneutics. Evaluation 1997; 3: 69–83.
263 Majone G. Evidence, argument and persuasion in the policy process. Yale UP, New Have, CT. 1989.
264 Costongs C, Springett J. Towards a Framework for the Evaluation of Health-related Policies in Cities. Evaluation 1997; 3: 345–62.
265 Nonaka I. A dynamics theory of organizational knowledge creation. Organ Sci 1994; 15: 14–37.
266 Forester J. The Deliberative Practitioner: encouraging participatory planning processes MIT Press: Cambridge, MS. 1999.
267 Wenger E. Communities of practice: learning, meanings, and identity. Cambridge University Press: 2007.
268 de Leeuw E. Evidence for Healthy Cities: refl ections on practice, method and theory. Health Promot Int 2009; 24 (suppl 1): i19–36.
269 Dryzek J. Discursive Democracy: politics, policy and political science. Cambridge: CUP. 1990.
270 Innes J, Booher D. Planning with Complexity: an introduction to collaborative rationality for public policy. Routledge. London, 2010.
271 Baum FE, Sanders DM. Ottawa 25 years on: a more radical agenda for health equity is still required. Health Promot Int 2011; 26 (suppl 2): ii253–57.
272 Minkler M, Wallerstein N. Improving health through community organization and community building: a health education perspective. In: Minkler M, ed. Community Organizing and Community Building for Health. New Brunswick, NJ: Rutgers University Press. 1998.
The Lancet Commissions
2108 www.thelancet.com Vol 379 June 2, 2012
273 Wallerstein N. Copenhagen: WHO Regional Offi ce for Europe; 2006. What is the Evidence on Eff ectiveness of Empowerment to Improve Health? Health Evidence Network Report. http://www.euro.who.int/Document/E88086.pdf (accessed June 27, 2011).
274 WHO. 2010 Urban HEART Kobe: WHO.275 Byrne J, Wolch J, Zhang J. Planning for environmental justice in an
urban national park. J Environ Plann Manage 2009; 52: 365–92.276 Tzoulas K. Promoting ecosystem and human health in urban areas
using Green Infrastructure: a literature review. Landsc Urban Plan 2007; 81: 167–78.
277 Bedimo-Rung AL, Mowen AJ, Cohen DA. The signifi cance of parks to physical activity and public health: a conceptual model. Am J Prev Med 2005; 28 (suppl 2): 159–68.
278 Maller C, Townsend M, Brown P, St Leger L. Healthy parks, healthy people: the health benefi ts of contact with nature in a park context: a review of current literature. Melbourne: Parks Victoria, Deakin University Faculty of Health and Behavioural Sciences, 2002.
279 De Sousa C. Turning brownfi elds into green space in the City of Toronto. Landsc Urban Plan 2003; 62: 181–98.
280 City of Toronto.Toronto Facts, Toronto’s racial diversity. Available from: http://www.toronto.ca/toronto_facts/diversity.htm (accessed May 15, 2010).
281 Glazier R, Booth G. Neighborhood environments and resources for healthy living - A focus on diabetes in Toronto. ICES Atlas. 2007. http://www.ices.on.ca/webpage.cfm?site_id=1&org_id=67&morg_id=0&gsec_id=0&item_id=4406&type=atlas (accessed November, 2010).
282 Yokohari M, Amati M. Nature in the city, city in the nature: case studies of the restoration of urban nature in Tokyo. Japan and Toronto, Canada. Landscape Ecol Eng 2005; 1: 53–59.
283 Whitzman C. Safer Space in Toronto. Urban Plan Int 2005; 19: 58–61 [in Chinese]; English version published as a special report by York University Centre for Urban Studies. 2005; 121–130. www.arts.yorku.ca/sosc/urbanst/publications.html (accessed Oct 15, 2010).
284 Burns J, Bond A. The consideration of health in land use planning: barriers and opportunities. Environ Impact Assess Rev 2008; 28: 184–97.
285 Kørnov L. Strategic Environmental Assessment as catalyst of healthier spatial planning: the Danish guidance and practice. Environ Impact Assess Rev 2009; 29: 60–65.