healthy communities: immunisation rates for children in 2011–12
TRANSCRIPT

7/28/2019 Healthy Communities: Immunisation rates for children in 2011–12
http://slidepdf.com/reader/full/healthy-communities-immunisation-rates-for-children-in-201112 1/56
Healthy Communities:
Immunisation rates or children in 2011–12
National Health Performance Authority

7/28/2019 Healthy Communities: Immunisation rates for children in 2011–12
http://slidepdf.com/reader/full/healthy-communities-immunisation-rates-for-children-in-201112 2/56
7/28/2019 Healthy Communities: Immunisation rates for children in 2011–12
http://slidepdf.com/reader/full/healthy-communities-immunisation-rates-for-children-in-201112 3/56
Healthy Communities:
Immunisation rates or children in 2011–12
National Health Performance Authority

7/28/2019 Healthy Communities: Immunisation rates for children in 2011–12
http://slidepdf.com/reader/full/healthy-communities-immunisation-rates-for-children-in-201112 4/56
National Health Performance Authority
GPO Box 9848
Sydney, NSW 2001 Australia
Telephone: +61 2 9186 9210
www.nhpa.gov.au
Paper-based publications
© Commonwealth o Australia 2013
This work is copyright. You may reproduce the whole or part o this work in unaltered orm or your own personal use
or, i you are part o an organisation, or internal use within your organisation, but only i you or your organisation do not
use the reproduction or any commercial purpose and retain this copyright notice and all disclaimer notices as part o
that reproduction. Apart rom rights to use as permitted by the Copyright Act 1968 or allowed by this copyright notice, all
other rights are reserved and you are not allowed to reproduce the whole or any part o this work in any way (electronic or
otherwise) without rst being given the specic written permission rom the Commonwealth to do so.
Internet sites
© Commonwealth o Australia 2013
This work is copyright. You may download, display, print and reproduce the whole or part o this work in unaltered orm or
your own personal use or, i you are part o an organisation, or internal use within your organisation, but only i you or your
organisation do not use the reproduction or any commercial purpose and retain this copyright notice and all disclaimer
notices as part o that reproduction. Apart rom rights to use as permitted by the Copyright Act 1968 or allowed by this
copyright notice, all other rights are reserved and you are not allowed to reproduce the whole or any part o this work in any
way (electronic or otherwise) without rst being given the specic written permission rom the Commonwealth to do so.
Requests and inquiries concerning reproduction and rights are to be sent to Communications, MDP 158, National Health
Perormance Authority, GPO Box 9848, Sydney NSW 2001, or by email to [email protected]
ISSN: 2201-8212
ISBN: 978-1-74241-900-8
Online ISBN: 978-1-74241-901-5
Suggested citation: National Health Perormance Authority 2013, Healthy Communities: Immunisation rates or
children in 2011–12, NHPA, Sydney.
Further copies o this document can be downloaded rom www.nhpa.gov.au
Published April 2013.
Please note that there is the potential or minor revisions o this report.
Please check www.nhpa.gov.au or any amendments.

7/28/2019 Healthy Communities: Immunisation rates for children in 2011–12
http://slidepdf.com/reader/full/healthy-communities-immunisation-rates-for-children-in-201112 5/56
iNational Health Performance Authority Healthy Communities: Immunisation rates for children in 2011–12www.nhpa.gov.au
About the Authority . . . . . . . . . . . . . . . . . . . . . . . . . . . . . . . . . . . . . . . . . . . . . . . . . . . . . . . . . . . . . . . . . iii
Summary . . . . . . . . . . . . . . . . . . . . . . . . . . . . . . . . . . . . . . . . . . . . . . . . . . . . . . . . . . . . . . . . . . . . . . . . . . v
Key ndings . . . . . . . . . . . . . . . . . . . . . . . . . . . . . . . . . . . . . . . . . . . . . . . . . . . . . . . . . . . . . . . . . . v
Next steps . . . . . . . . . . . . . . . . . . . . . . . . . . . . . . . . . . . . . . . . . . . . . . . . . . . . . . . . . . . . . . . . . . vii
Introduction . . . . . . . . . . . . . . . . . . . . . . . . . . . . . . . . . . . . . . . . . . . . . . . . . . . . . . . . . . . . . . . . . . . . . . . 1
About this report . . . . . . . . . . . . . . . . . . . . . . . . . . . . . . . . . . . . . . . . . . . . . . . . . . . . . . . . . . . . . 1
Why immunisation matters . . . . . . . . . . . . . . . . . . . . . . . . . . . . . . . . . . . . . . . . . . . . . . . . . . . . . 1
Improving uptake . . . . . . . . . . . . . . . . . . . . . . . . . . . . . . . . . . . . . . . . . . . . . . . . . . . . . . . . . . . . . 2
About the data . . . . . . . . . . . . . . . . . . . . . . . . . . . . . . . . . . . . . . . . . . . . . . . . . . . . . . . . . . . . . . 3
Key ndings: All children . . . . . . . . . . . . . . . . . . . . . . . . . . . . . . . . . . . . . . . . . . . . . . . . . . . . . . . . . . . . . 5
Percentages ully immunised: Variation by Medicare Local catchment . . . . . . . . . . . . . . . . . . 5
Percentages ully immunised: Variation by age. . . . . . . . . . . . . . . . . . . . . . . . . . . . . . . . . . . . .
5
Numbers o children not ully immunised . . . . . . . . . . . . . . . . . . . . . . . . . . . . . . . . . . . . . . . . . . 5
Lower-level reporting . . . . . . . . . . . . . . . . . . . . . . . . . . . . . . . . . . . . . . . . . . . . . . . . . . . . . . . . . . 6
Key ndings: Aboriginal and Torres Strait Islander children . . . . . . . . . . . . . . . . . . . . . . . . . . . . . . . . 7
Percentages ully immunised: Variation by Medicare Local catchment . . . . . . . . . . . . . . . . . . . 7
Percentages ully immunised: Variation by age . . . . . . . . . . . . . . . . . . . . . . . . . . . . . . . . . . . . . 7
Numbers o children not ully immunised . . . . . . . . . . . . . . . . . . . . . . . . . . . . . . . . . . . . . . . . . . 8
Comparison between percentages o Aboriginal and Torres Strait Islander children ully
immunised and all children. . . . . . . . . . . . . . . . . . . . . . . . . . . . . . . . . . . . . . . . . . . . . . . . . . . .
8
Children ully immunised: Medicare Local catchment snapshot . . . . . . . . . . . . . . . . . . . . . . . . . . . . 9
Aboriginal and Torres Strait Islander children ully immunised:
Medicare Local catchment snapshot . . . . . . . . . . . . . . . . . . . . . . . . . . . . . . . . . . . . . . . . . . . . . . . . . . 11
Children aged 1 year who were ully immunised, 2011–12 . . . . . . . . . . . . . . . . . . . . . . . . . . . . . . . . . 15
Aboriginal and Torres Strait Islander children aged 1 year who were ully immunised, 2011–12 . . 17
Children aged 2 years who were ully immunised, 2011–12 . . . . . . . . . . . . . . . . . . . . . . . . . . . . . . . . 19
Aboriginal and Torres Strait Islander children aged 2 years who were ully immunised, 2011–12 . . 21
Children aged 5 years who were ully immunised, 2011–12 . . . . . . . . . . . . . . . . . . . . . . . . . . . . . . . 23
Aboriginal and Torres Strait Islander children aged 5 years who were ully immunised, 2011–12 . . 25
Children aged 1 year who were ully immunised, by statistical area, 2011–12 . . . . . . . . . . . . . . . . 29
Children aged 2 years who were ully immunised, by statistical area, 2011–12 . . . . . . . . . . . . . . . 33
Children aged 5 years who were ully immunised, by statistical area, 2011–12 . . . . . . . . . . . . . . . 37
Glossary . . . . . . . . . . . . . . . . . . . . . . . . . . . . . . . . . . . . . . . . . . . . . . . . . . . . . . . . . . . . . . . . . . . . . . . . . 41
Acknowledgements . . . . . . . . . . . . . . . . . . . . . . . . . . . . . . . . . . . . . . . . . . . . . . . . . . . . . . . . . . . . . . . . 43
Table o contents

7/28/2019 Healthy Communities: Immunisation rates for children in 2011–12
http://slidepdf.com/reader/full/healthy-communities-immunisation-rates-for-children-in-201112 6/56
ii National Health Performance AuthorityHealthy Communities: Immunisation rates for children in 2011–12 www.nhpa.gov.au

7/28/2019 Healthy Communities: Immunisation rates for children in 2011–12
http://slidepdf.com/reader/full/healthy-communities-immunisation-rates-for-children-in-201112 7/56
iiiNational Health Performance Authority Healthy Communities: Immunisation rates for children in 2011–12www.nhpa.gov.au
About the Authority
The National Health Perormance Authority
(the Authority) is an independent body that
provides locally relevant and nationally consistentinormation on the perormance o hospitals and
other health care organisations. The Authority was
set up under the National Health Reorm Act 2011
and commenced ull operations in 2012.
Under the terms o the Act, the Authority monitors,
and reports on, the perormance o Local Hospital
Networks, public and private hospitals, primary
health care organisations and other bodies thatprovide health care services.
The Authority’s reports provide timely and
impartial inormation that allows all Australians to
airly compare their local health care organisations
against their peers.
The reports let people see, or the rst time, how their
local health care organisations measure up against
comparable organisations across Australia.
The Authority’s activities are guided by a
document called the Perormance and
Accountability Framework agreed by the
Council o Australian Governments (COAG). The
ramework contains 48 indicators that orm the
basis or the Authority’s reports.
The Authority’s role includes reporting on theperormance o health care organisations against
the 48 indicators in order to identiy both high-
perorming Local Hospital Networks, Medicare
Locals and hospitals (so eective practices can
be shared), and Local Hospital Networks and
Medicare Locals that perorm poorly (so that
steps can be taken to address problems).
The Authority releases reports on a quarterly
basis, and also publishes perormance data on the
MyHospitals website and on www.nhpa.gov.au
The Authority consists o a Chairman, a Deputy
Chairman and ve other members, appointed or
up to ve years. Members o the Authority are:
• Ms Patricia Faulkner AO (Chairman)
• Mr John Walsh AM (Deputy Chairman)
• Dr David Filby PSM
• Pro Michael Reid
• Pro Bryant Stokes AM RFD
• Pro Paul Torzillo AM
• Pro Claire Jackson (acting member).
The conclusions in this report are those o the
Authority. No ocial endorsement rom any
Minister, department o health or health care
organisation is intended or should be inerred.

7/28/2019 Healthy Communities: Immunisation rates for children in 2011–12
http://slidepdf.com/reader/full/healthy-communities-immunisation-rates-for-children-in-201112 8/56
iv National Health Performance AuthorityHealthy Communities: Immunisation rates for children in 2011–12 www.nhpa.gov.au

7/28/2019 Healthy Communities: Immunisation rates for children in 2011–12
http://slidepdf.com/reader/full/healthy-communities-immunisation-rates-for-children-in-201112 9/56
vNational Health Performance Authority Healthy Communities: Immunisation rates for children in 2011–12www.nhpa.gov.au
Summary
Immunisation helps protect individuals and thecommunity generally against potentially serious
diseases such as measles, polio, tetanus and
whooping cough (pertussis).
Although the great majority o children in Australia
are immunised, it is important to maintain high
immunisation rates to reduce the risk o outbreaks
o these and other diseases recurring.
Australian governments and experts endorse
achieving high immunisation rates to protect
individuals and those not immunised or too
young to be immunised. States and territories
are expected to maintain or improve their existing
respective immunisation rates under the terms o
the National Partnership Agreement on Essential
Vaccines agreed in 2009.
This report allows the public, clinicians and
health managers to see or all children, and or
Aboriginal and Torres Strait Islander children,
the percentages ully immunised and how those
percentages dier across the country. It reports
these immunisation rates or each o the 61
geographic areas covered by the new network o
Medicare Locals, which have been established
to improve the responsiveness, coordination and
integration o local health services.
These data were sourced rom the Australian
Childhood Immunisation Register (ACIR). It is
important to note that these data cover the period
rom July 2011 to June 2012. As Medicare Locals
were still being set up during this time, this report
establishes a baseline or comparisons that in uture
will help clinicians, health managers and others to
assess whether improvements are occurring.
Where possible, the results are broken down intogeographic areas that are smaller than Medicare
Local catchments – more than 300 statistical
areas and more than 1500 postcodes.
The report shows the percentages o children
who were ully immunised at 1 year, 2 years and
5 years in each Medicare Local catchment, and in
the smaller units o geography where applicable.
Also reported are the numbers o children in eacharea who are not ully immunised.
Key fndings
The report’s ndings can be considered in the
context o three broad themes:
• The percentages o children ully immunised
and variation between Medicare Local
catchments, and between age groups
• The numbers o children who are not ully
immunised in each Medicare Local catchment
• Lower immunisation rates among Aboriginal
and Torres Strait Islander children.
Percentages ully immunised and variation
between Medicare Local catchments
There was considerable variation between
Medicare Local catchments in terms o the
percentages o all children ully immunised across
all three age groups (Figure 3, page 10).
The percentages o all children ully immunised at:
• 1 year o age ranged rom 85% in Far West
NSW to 94% in Great South Coast (Vic), Hume
(Vic), Barwon (Vic), Murrumbidgee (NSW),
Grampians (Vic), Goulburn Valley (Vic) and
Australian Capital Territory (page 16).

7/28/2019 Healthy Communities: Immunisation rates for children in 2011–12
http://slidepdf.com/reader/full/healthy-communities-immunisation-rates-for-children-in-201112 10/56
vi National Health Performance AuthorityHealthy Communities: Immunisation rates for children in 2011–12 www.nhpa.gov.au
• 2 years o age ranged rom 89% in NorthCoast NSW, Eastern Sydney and Sunshine
Coast (Qld) to 96% in Great South Coast (Vic)
(page 20)
• 5 years o age ranged rom 84% in Eastern
Sydney to 95% in Great South Coast (Vic)
(page 24).
Variation across age groups
Comparing the three age groups, percentages o
children ully immunised were highest at 2 years o
age. Out o the three age groups, percentages o
all children ully immunised at 2 years o age were
highest (or equal highest) or all but seven o the
61 Medicare Local catchments (Figure 3,
page 10).
Rates were lowest at 5 years o age. Percentages
o all children ully immunised at 5 years were
lowest (or equal lowest) o the three age groups
or all but our o the 61 Medicare Locals.
Aboriginal and Torres Strait Islander children
In many Medicare Local catchments,
immunisation rates among Aboriginal and Torres
Strait Islander children were considerably lower
than they were or all children (Figure 5,
page 12).
The percentages o Aboriginal and Torres Strait
Islander children ully immunised at:
• 1 year o age ranged rom 69% in Bentley-
Armadale (WA) to 94% in Gold Coast (Qld)
(page 18)
• 2 years o age ranged rom 80% in Central
Adelaide and Hills to 97% in Northern Territory
and Gold Coast (Qld) (page 22)
• 5 years o age ranged rom 70% in Perth
North Metro to 95% in Central and North West
Queensland (page 26).
Not only were the ranges wider when looking
at Aboriginal and Torres Strait Islander children,but the percentages were lower among a large
number o Medicare Local catchments.
The number o Medicare Local catchments where
less than 90% o children were ully immunised
was as ollows1:
1 year o age:
All children: 2 (o 61 reported)
Indigenous children: 46 (o 54 reported)2
2 years o age:
All children: 3 (o 61 reported)
Indigenous children: 16 (o 56 reported)
5 years o age:
All children: 23 (o 61 reported)
Indigenous children: 35 (o 55 reported)
There were also 12 Medicare Local catchmentswhere less than 80% o Aboriginal and Torres
Strait Islander children, in at least one age group,
were ully immunised – eight or 1 year olds and
nine or 5 year olds. No catchments returned
results below 80% or all children (pages 18
and 26).
1. The level o 90% o children ully immunised does not relate to any benchmarks and is used here or indicative purposes only.
2. Results are not reported or Medicare Local catchments or any age group with less than 26 children registered with the ACIR.

7/28/2019 Healthy Communities: Immunisation rates for children in 2011–12
http://slidepdf.com/reader/full/healthy-communities-immunisation-rates-for-children-in-201112 11/56
viiNational Health Performance Authority Healthy Communities: Immunisation rates for children in 2011–12www.nhpa.gov.au
Lower-level reporting
The report also shows the percentages o all
children ully immunised in more than 300 smaller
local areas called Statistical Areas Level 3 (SA3s).
There were 32 statistical areas where the
percentages o all children ully immunised were
85% or lower or at least one age group.
There were 77 statistical areas where the
percentages o all children ully immunised were
95% or higher or at least one age group.
There were 898,373 children aged 1, 2 or 5 years
registered with the ACIR in 2011–12. O these, the
data suggests 76,769 are not ully immunised:
• or children aged 1 year - 24,360
• or children aged 2 years - 22,334
• or children aged 5 years - 30,075.
(pages 29 to 40).
Results or Aboriginal and Torres Strait Islander
children are not reported or statistical areas because
the populations o Indigenous children in those areas
are too small to support reliable estimates.
Numbers o children not ully immunised
Some Medicare Local catchments contained
high numbers o children who were not ully
immunised. There are Medicare Local catchments
where more than 1000 children aged 1, 2 or 5
years are not ully immunised (page 6).
Next steps
The National Immunisation Program Schedule has
been expanded since the data in this report werecollected. Future Authority reports will include
data against the denition o ully immunised
applied in this report and also include data on
the revised denition o ully immunised, which
includes additional vaccines on the National
Immunisation Program Schedule.
The Authority is aware o issues with measuring
percentages o children ully immunised in some
urban areas. Factors such as population mobility
and large immigrant populations may make tracking
childhood immunisation rates more dicult.
A better understanding is also needed o the level o
identication o children as Aboriginal and/or Torres
Strait Islander in the Medicare enrolment data that
is used in the ACIR, and the impact or reporting
immunisation rates or these children.
The Authority will consider ways to address these
issues in the uture.
What is the percentage o
children who are ully immunised
in your local area?
The National Health Perormance Authorityhas released 2011–12 data or Medicare
Local catchments, or more than 300
smaller geographic areas, and or more
than 1500 postcodes, on the percentages
o all children who are ully immunised at
1 year, 2 years and 5 years.
For inormation about your local area, go to
www.nhpa.gov.au

7/28/2019 Healthy Communities: Immunisation rates for children in 2011–12
http://slidepdf.com/reader/full/healthy-communities-immunisation-rates-for-children-in-201112 12/56
1 National Health Performance AuthorityHealthy Communities: Immunisation rates for children in 2011–12 www.nhpa.gov.au
Introduction
About this report
The Authority bases its perormance reports
on the 48 indicators agreed by the Council o
Australian Governments (COAG). In this report, the
Authority has ocused on the indicator that relates
to rates o childhood immunisation.
While the percentages o children ully immunised
are periodically reported at the state and national
level, this report is dierent in that it provides this
inormation at much smaller units o geography.
This report states the percentages or all children,
and or all Aboriginal and Torres Strait Islander
children, who are ully immunised at three time
points – 1 year, 2 years and 5 years – or each area
served by the new network o Medicare Locals.
There are 61 Medicare Locals across Australia,which were established in 2011 to improve the
responsiveness, coordination and integration o
local health services.
This report provides some data or even smaller
geographic areas, called Statistical Areas Level 3
(SA3s), which are used by the Australian Bureau o
Statistics. Some data are also available at the level
o individual postcodes at www.nhpa.gov.au
The Authority has chosen to ocus this report on
childhood immunisation at this level o geographic
detail in order to help clinicians and health
managers better understand where more work
needs to be done to increase the percentages o
ully immunised children.
Fully immunised means that a child has received
a subset o vaccinations that are detailed in the
National Immunisation Program Schedule or
their age. Four vaccinations on that Schedule
are excluded or the purposes o measuring ully
immunised status. Fully immunised or age means a
child received the most recent vaccination or each
disease, and assumes all previous vaccinations
were administered (Figure 1, page 2).
It is important to note that these data relate to the
period July 2011 to June 2012, while Medicare
Locals were still being set up. Accordingly, the
ndings do not refect on the perormance o
Medicare Locals as organisations.
Why immunisation matters
Routine childhood immunisations protect babies
and children against potentially serious diseasessuch as measles, polio, tetanus and whooping
cough (pertussis) (Glossary, page 41).
Although the majority o children in Australia
are immunised, it is important to maintain high
immunisation rates. When high percentages o
people are ully immunised, diseases such as
whooping cough have less opportunity to
spread because there are ewer people who
can be inected.
In addition, people who remain susceptible
to inection – such as babies too young to be
immunised and people with specic medical
conditions that prevent them rom being immunised
– may be indirectly protected, as they are less likely
to be exposed to disease. This concept is called
“herd immunity” or “community immunity”.

7/28/2019 Healthy Communities: Immunisation rates for children in 2011–12
http://slidepdf.com/reader/full/healthy-communities-immunisation-rates-for-children-in-201112 13/56
2National Health Performance Authority Healthy Communities: Immunisation rates for children in 2011–12www.nhpa.gov.au
VaccinationsMeasured
for fully
immunised at
Hepatitis B (hepB)
Diphtheria, tetanus and
whooping cough (DTPa)
Haemophilus inuenzae
type b (Hib)
Polio (IPV)
Hepatitis B (hepB)
Diphtheria, tetanus and
whooping cough (DTPa)
Haemophilus inuenzae
type b (Hib)
Polio (IPV)
Diphtheria, tetanus andwhooping cough (DTPa)
Polio (IPV)
Measles, mumps and
rubella (MMR)
Haemophilus inuenzae
type b (Hib)
Measles, mumps and
rubella (MMR)
1 year
2 years
5 years
2 m o n t h s
4 m o n t h s
1 2 m o n t h s
4 y e a r s
Agedue
Hepatitis B (hepB)
Diphtheria, tetanus and
whooping cough (DTPa)
Haemophilus inuenzae
type b (Hib)
Polio (IPV) 6 m o n t h s
3. World Health Organization, WHO guidelines or epidemic preparedness and response to measles outbreaks, WHO, Geneva, May 1999.
4. World Health Organization, Measles vaccines: WHO position paper, Weekly epidemiological record , No 35, 84, 349–360, WHO, Geneva, 2009.5. Centers or Disease Control and Prevention (2013), Pertussis requently asked questions (actsheet), [Online] Available at: www.cdc.gov/pertussis/
about/faqs.html Accessed 26 March 2013.
6. Medicare Local Key Reporting Areas or 2012–13. Key Reporting Area 2: Maintain or improve immunisation coverage rates or children.
Figure 1: Vaccinations measured or ullyimmunised status
According to the World Health Organization(WHO), measles is a potentially serious and highly
contagious disease (with a single inected person
able to inect up to 17-20 other people).3 The WHO
has advocated an immunisation rate o greater
than 93–95% or all districts within a country to
ensure measles elimination.4 The US Centers
or Disease Control and Prevention considers
whooping cough to be so inectious (with a single
inected person able to inect up to 12-15 otherpeople) that it is important everyone gets the
recommended vaccine.5
Improving uptake
From 1 July 2012, Medicare Locals are
responsible or ensuring high immunisation rates
are maintained across their catchments.6
The National Partnership Agreement (NPA)on Essential Vaccines, established by
Commonwealth, state and territory governments
through COAG in 2009, set benchmarks or
maintaining or improving the percentage o
children ully immunised or:
• all children at 4 years o age (measured at 5
years o age)
• Aboriginal and Torres Strait Islander children at
1, 2 and 5 years o age
• all children in areas o low immunisation.
For the purposes o reporting the data, ully immunised
means a child receives the vaccinations due at or immediately
prior to the age at which the measurement occurs. It is
assumed that all previous vaccinations were received.
Note:

7/28/2019 Healthy Communities: Immunisation rates for children in 2011–12
http://slidepdf.com/reader/full/healthy-communities-immunisation-rates-for-children-in-201112 14/56
3 National Health Performance AuthorityHealthy Communities: Immunisation rates for children in 2011–12 www.nhpa.gov.au
7. Hull BP, Shelley LD, McIntyre PB. The Australian Childhood Immunisation Register - A model or universal immunisation registers? Vaccine 2009;
27: 5054–5060.
The Commonwealth government pays or thepurchase o all essential vaccines and provides
payments to the states and territories and general
practices that are linked to achieving high rates o
immunisation and notication to the ACIR.
About the data
Data or this report, Healthy Communities:
Immunisation rates or children in 2011–12,
were sourced rom the Australian ChildhoodImmunisation Register (ACIR) which is
administered by the Australian Government
Department o Human Services (Medicare).
It has been estimated that ACIR includes close to
99% o Australian children.7
The report includes data on both the percentages
o children ully immunised and the numbers o children not ully immunised. All data rom the
ACIR are mapped to Medicare Local catchment
areas in which children live (i.e. by the postcode
or their address), rather than the areas in which
the services are provided.
For more inormation, see Healthy Communities:
Immunisation rates or children in 2011–12,
Technical Supplement at www.nhpa.gov.au
Australian Childhood
Immunisation Register
The Australian Childhood Immunisation
Register (ACIR) is a national register that
records immunisations given to children
up to the age o 7 years.
The ACIR helps parents and guardians
keep track o children’s immunisations.It also enables governments and health
managers to monitor immunisation
coverage in Australia.
The ACIR provides immunisation history
statements that can be used as proo
o immunisation status or childcare and
school enrolments. Children who are
not immunised are subject to exclusion
rom childcare and school when disease
outbreaks occur.
Lower-level data
Inormation on the percentages o
children ully immunised is available or
local communities across Australia at
www.nhpa.gov.au
The purpose o providing local
inormation is to help clinicians and
health managers to target their eorts
to protect the health o children and the
broader community. Note that where the
number o children or an area is very
small, data has been withheld to preserve
condentiality.

7/28/2019 Healthy Communities: Immunisation rates for children in 2011–12
http://slidepdf.com/reader/full/healthy-communities-immunisation-rates-for-children-in-201112 15/56
Child immunisation ratesKey ndings 2011–12
4

7/28/2019 Healthy Communities: Immunisation rates for children in 2011–12
http://slidepdf.com/reader/full/healthy-communities-immunisation-rates-for-children-in-201112 16/56
5 National Health Performance AuthorityHealthy Communities: Immunisation rates for children in 2011–12 www.nhpa.gov.au
Percentages ully immunised: Variation by Medicare Local
catchment
There was considerable variation between
Medicare Local catchments in terms o the
percentages o all children ully immunised across
all three age groups.
Percentages o 1 year olds ully immunised,
by Medicare Local catchment
The percentage o children aged 1 year ully
immunised ranged rom:
Highest 94% – Great South Coast (Vic), Hume
(Vic), Barwon (Vic), Murrumbidgee (NSW),
Grampians (Vic), Goulburn Valley (Vic), Australian
Capital Territory
Lowest 85% – Far West NSW (pages 15
and 16).
Percentages o 2 year olds ully immunised,
by Medicare Local catchment
The percentage o children aged 2 years ully
immunised ranged rom:
Highest 96% – Great South Coast (Vic)
Lowest 89% – North Coast NSW, Eastern
Sydney, Sunshine Coast (Qld) (pages 19
and 20).
Percentages o 5 year olds ully immunised,
by Medicare Local catchment
The percentage o all children aged 5 years ully
immunised ranged rom:
Highest 95% – Great South Coast (Vic)
Lowest 84% – Eastern Sydney (pages 23
and 24).
Percentages ully immunised: Variation by age
Immunisation rates were highest at 2 years o
age. Out o the three age groups, percentages o
children ully immunised at 2 years o age were
highest (or equal highest) or all but seven o the
61 Medicare Local catchments.
Rates were lowest at 5 years o age. Percentages
o children ully immunised at 5 years were lowest
(or equal lowest) o the three age groups or all but
our o the 61 Medicare Local catchments
(Figure 3, page 10).
For children aged 1 year, two Medicare
Local catchments recorded percentages
ully immunised o less than 90%, while three
catchments had less than 90% or children
aged 2 years.
For children aged 5 years, 23 Medicare Local
catchments had less than 90% o children
ully immunised.8
Numbers o children not ully
immunised
In a Medicare Local catchment with a large
population, a high percentage o children whoare ully immunised can conceal a high number
o children who are not ully immunised (Figure 2,
page 9).
In our Medicare Local catchments, there were
more than 1000 children who were not ully
immunised in one or more age groups. One
Medicare Local catchment (Western Sydney) had
Key fndings: All children
8. The level o 90% o children ully immunised does not relate to any benchmarks and is used here or indicative purposes only.

7/28/2019 Healthy Communities: Immunisation rates for children in 2011–12
http://slidepdf.com/reader/full/healthy-communities-immunisation-rates-for-children-in-201112 17/56
6National Health Performance Authority Healthy Communities: Immunisation rates for children in 2011–12www.nhpa.gov.au
nearly 3600 children who were not ully immunisedacross the three age groups combined (pages 16,
20 and 24).
The largest single group o children not ully
immunised in one Medicare Local catchment was
1287 (recorded in Western Sydney or 5 year olds).
Numbers o 1 year olds not ully immunised,
by Medicare Local catchment
The number o all children aged 1 year not ully
immunised ranged rom more than 1100, recorded
in Western Sydney, Greater Metro South Brisbane
and South Western Sydney, to ewer than 80
recorded in Far West NSW, Central and Northern
Queensland and Great South Coast (Vic) (page 16).
Numbers o 2 year olds not ully immunised,
by Medicare Local catchment
The number o all children aged 2 years not ully
immunised ranged rom almost 1100, recorded
in Western Sydney, to ewer than 80, recorded
in Lower Murray (Vic), Great South Coast (Vic),
Central and North West Queensland, and Far
West NSW (page 20).
Numbers o 5 year olds not ully immunised,
by Medicare Local catchment
The number o all children aged 5 years not
ully immunised ranged rom more than 1200,
recorded in Western Sydney, South Western
Sydney and Greater Metro South Brisbane to
ewer than 80 recorded in Greater South Coast
(Vic), Far West NSW, and Central and North West
Queensland (page 24).
Lower-level reporting
Where possible, the percentages o children ully
immunised have been broken down by smaller
local areas called Statistical Areas Level 3 (SA3)
which are used by the Australian Bureau o
Statistics. There are 333 statistical areas covering
the whole o Australia without gaps or overlaps.
There were 32 statistical areas where the
percentages o all children ully immunised were
85% or lower or at least one age group:
• or children 1 year o age - 4 statistical areas
• or children 2 years o age - 4
• or children 5 years o age - 30.
There were 77 statistical areas where the
percentages o all children ully immunised were
95% or higher or at least one age group:• or children 1 year o age - 23 statistical areas
• or children 2 years o age - 72
• or children 5 years o age - 3
(pages 29 to 40).
Results or Aboriginal and Torres Strait Islander
children are not reported or statistical areas because
the populations o these children in most o statistical
areas are too small to support reliable estimates.
Local-level data are available at
www.nhpa.gov.au

7/28/2019 Healthy Communities: Immunisation rates for children in 2011–12
http://slidepdf.com/reader/full/healthy-communities-immunisation-rates-for-children-in-201112 18/56
7 National Health Performance AuthorityHealthy Communities: Immunisation rates for children in 2011–12 www.nhpa.gov.au
Key fndings: Aboriginal and Torres Strait
Islander children
The data presented here refect results or thosechildren who were identied as Aboriginal and
Torres Strait Islander in the Australian Childhood
Immunisation Register (ACIR) during 2011–12.
The ACIR data are based on Medicare enrolment
records and levels o identication may vary
between Medicare Local catchments.
Percentages ully immunised:
Variation by Medicare Localcatchment
There was considerable variation between
Medicare Local catchments in terms o the
percentages o Aboriginal and Torres Strait
Islander children ully immunised across all three
age groups.
Percentages o 1 year olds ully immunised,
by Medicare Local catchment The percentage o Aboriginal and Torres Strait
Islander children aged 1 ully immunised
ranged rom:
Highest 94% – Gold Coast (Qld)
Lowest 69% – Bentley-Armadale (WA) (pages 17
and 18).
Percentages o 2 year olds ully immunised,
by Medicare Local catchment
The percentage o Aboriginal and Torres Strait
Islander children aged 2 ully immunised
ranged rom:
Highest 97% – Northern Territory and Gold
Coast (Qld)
Lowest 80% – Central Adelaide and Hills (pages
21 and 22).
Percentages o 5 year olds ully immunised,by Medicare Local catchment
The percentage o Aboriginal and Torres Strait
Islander children aged 5 years ully immunised
ranged rom:
Highest 95% – Central and North West
Queensland
Lowest 70% – Perth North Metro (pages 25
and 26).
Percentages ully immunised:
Variation by age
Immunisation rates were highest at 2 years o
age. Out o the three age groups, percentages
o Aboriginal and Torres Strait Islander children
ully immunised at 2 years o age were highest (or
equal highest) or all but seven o the 56 Medicare
Local catchments reported (Figure 5, page 12).9
Rates were lowest or children at 1 year o age.
Percentages o Aboriginal and Torres Strait Islander
children ully immunised at 1 year were lowest (or
equal lowest) o the three age groups or 35 o the
56 Medicare Local catchments reported.
The percentages ully immunised or Aboriginal
and Torres Strait Islander children aged 1 year
and 5 years were also much lower than the 2 yearage group.
For Aboriginal and Torres Strait Islander children
aged 2 years, 16 Medicare Local catchments
recorded percentages ully immunised o less
than 90%.10
9. Results are not reported or Medicare Local catchments or any age group with less than 26 children registered with the ACIR.
10. The level o 90% o children ully immunised does not relate to any benchmarks and is used here or indicative purposes only.

7/28/2019 Healthy Communities: Immunisation rates for children in 2011–12
http://slidepdf.com/reader/full/healthy-communities-immunisation-rates-for-children-in-201112 19/56
8National Health Performance Authority Healthy Communities: Immunisation rates for children in 2011–12www.nhpa.gov.au
But or children aged 1 year, there were 46Medicare Local catchments with percentages
below 90%, and 35 catchments had less than
90% or children aged 5 years.
There were also eight Medicare Local catchments
with percentages below 80% or children aged
1 year, and nine catchments with results below
80% or children aged 5 years.
Numbers o children not ully
immunised
There were three Medicare Local catchments that
recorded more than 100 Aboriginal and Torres
Strait Islander children aged 1 year who were not
ully immunised (Figure 4, page 11).
At 148, the largest single group o Aboriginal and
Torres Strait Islander children not ully immunisedwas recorded or 1 year olds. Next were 5 year
olds, with 110 in the largest group o children not
ully immunised. The largest group o 2 year olds
not ully immunised was 63 (pages 18, 22
and 26).
Numbers o 1 year olds not ully immunised,
by Medicare Local catchment
The number o Aboriginal and Torres Strait
Islander children aged 1 year not ully immunised
ranged rom 148 to 5 or ewer (page 18).
Numbers o 2 year olds not ully immunised,
by Medicare Local catchment
The number o Aboriginal and Torres Strait
Islander children aged 2 years not ully immunised
ranged rom 63 to 5 or ewer (page 22).
Numbers o 5 year olds not ully immunised,by Medicare Local catchment
The number o Aboriginal and Torres Strait
Islander children aged 5 years not ully immunised
ranged rom 110 to 5 or ewer (page 26).
Comparison between percentages o
Aboriginal and Torres Strait Islander
children ully immunised and all
children
The highest percentages recorded or Aboriginal
and Torres Strait Islander children in Medicare
Local catchments exceeded or equalled those
recorded or all children. However, the lowest
percentages recorded or Aboriginal and Torres
Strait Islander children were substantially lower
than those recorded or all children (pages 18,
22 and 26).
The lowest percentage o ully immunised
Aboriginal and Torres Strait Islander children
recorded or 1 year olds was 69%, compared with
85% or all children – a variation o 16 percentage
points (pages 16 and 18).
The lowest percentage o ully immunised
Aboriginal and Torres Strait Islander children
recorded or 5 year olds was 70%, compared with84% or all children – a variation o 14 percentage
points (pages 24 and 26).
At 80%, the lowest percentage o ully immunised
Aboriginal and Torres Strait Islander children
recorded or 2 year olds was closest to that
recorded or all children, which was 89%. The
variation was 9 percentage points (pages 20
and 22).

7/28/2019 Healthy Communities: Immunisation rates for children in 2011–12
http://slidepdf.com/reader/full/healthy-communities-immunisation-rates-for-children-in-201112 20/56
9 National Health Performance AuthorityHealthy Communities: Immunisation rates for children in 2011–12 www.nhpa.gov.au
It is important to look at the percentages o
children who were ully immunised in conjunction
with the numbers o children who were not ully
immunised. (For the numbers o children aged
1, 2 and 5 not ully immunised see pages 16,
20 and 24.) A Medicare Local catchment with
a large population can have a high percentage
o children that are ully immunised and a high
number o children who are not ully immunised.
Figure 2 shows the percentages o children that
were ully immunised and the numbers o children
not ully immunised at 1 year, 2 years and 5 years.
Each dot represents a Medicare Local catchment.
The size o each dot is scaled to represent the
number o children in each Medicare Local
catchment that were not ully immunised.
The gure shows that there were Medicare Local
catchments with 93% o children who were ully
immunised that still contain groups o more than
600 children who were not ully immunised. The
largest single group o children who were not
ully immunised was recorded or 5 year olds
(1287 children).
Figure 3 on the opposite page compares the
percentages o children ully immunised or 1 year
olds, 2 year olds and 5 year olds by Medicare
Local catchment.
The gure shows that the percentage o children
who were ully immunised at 2 years generally
exceeded that recorded or 1 year olds. In most
cases, the percentage recorded or 5 year olds
was the lowest.
Children ully immunised:
Medicare Local catchment snapshot
Number not ully immunised
∙∙∙ 93 up to 95%
∙∙∙ 90 up to 93%
95 to 100%
90 up to 95%
85 up to 90%
80 up to 85%
75 up to 80%
Percentage ully immunised
50
100
250
500
1000
1250
Children aged 1 year
Children aged 2 years
Children aged 5 years
Figure 2: Percentages o all children1 in eacho 61 Medicare Local catchments that are
ully immunised by age and number not ully
immunised, 2011–12
Each dot represents one Medicare Local catchment
Each dot represents one Medicare Local catchment
Each dot represents one Medicare Local catchment
96%
94%
92%
90%
88%
86%
84%
96%
94%
92%
90%
88%
86%
84%
96%
94%
92%
90%
88%
86%
84%

7/28/2019 Healthy Communities: Immunisation rates for children in 2011–12
http://slidepdf.com/reader/full/healthy-communities-immunisation-rates-for-children-in-201112 21/56
10National Health Performance Authority Healthy Communities: Immunisation rates for children in 2011–12www.nhpa.gov.au
1. Data are reported as whole numbers. However, or graphical display they are plotted by 2 decimal places.
Source: Department o Human Services, Australian Childhood Immunisation Register statistics 2011–12, data supplied 14/01/2013.
Figure 3: Percentages o all children1 in each o 61 Medicare Local catchments that are
ully immunised by age, 2011–12
Fully immunised at age 1yr 2yrs 5yrs
Medicare Local catchments
Postcode-level data available
at www.nhpa.gov.au
Defnitions o ullyimmunised at:
1 year
Fully immunised at 1 year means
that a child aged 12 months to
less than 15 months received
their third vaccination or
diphtheria, tetanus, whooping
cough and polio and either their
second or third vaccination
(dependent on the type o
vaccine used) or hepatitis B andHaemophilus infuenzae type
b, all prior to the age o 1 year.
It is assumed that all previous
vaccinations were received.
2 years
Fully immunised at 2 years means
that a child aged 24 to less than
27 months received their third or
ourth vaccination (dependent
on the type o vaccine used) or
diphtheria, tetanus, whooping
cough and Haemophilus
infuenzae type b, their thirdvaccination or polio and hepatitis
B and their frst vaccination or
measles, mumps and rubella,
all prior to the age o 2 years.
It is assumed that all previous
vaccinations were received.
5 years
Fully immunised at 5 years
means that a child aged 60 to
less than 63 months received
their ourth or fth vaccination
(dependent on the type o
vaccine used) or diphtheria,tetanus and whooping cough,
their ourth vaccination or polio
and their second vaccination
or measles mumps and rubella,
all prior to the age o 5 years.
It is assumed that all previous
vaccinations were received.
70% 75% 80% 85% 90% 95%
Great South Coast (Vic).........................
Hume (Vic/NSW) ...................................
Barwon (Vic) .........................................
Murrumbidgee (NSW)............................
Grampians (Vic) ....................................
Goulburn Valley (Vic) .............................
Australian Capital Territory .................... .
Gippsland (Vic) ...................... ................
New England (NSW) .............................
Western NSW .......................................
Country North SA .................................
Hunter (NSW)........................................
Bayside (Vic) .........................................
Sthn Adelaide-Fleurieu-Kangaroo Is. .....
Townsville-Mackay (Qld) ................... .....
Country South SA .................................
Metro North Brisbane............................
Frankston-Mornington Peninsula (Vic) ...
Inner East Melbourne ............................
Northern Adelaide .................................
Tasmania ................... ...................... .....
Northern Melbourne ..............................
South Western Melbourne ....................
South Eastern Sydney ..........................
Wide Bay (Qld) ......................................
Macedon Ranges & NW Melb ...............
Illawarra-Shoalhaven (NSW) ..................
South Eastern Melbourne......................
Nepean-Blue Mountains (NSW) .............Eastern Melbourne................................
Loddon-Mallee-Murray (Vic/NSW) .........
Central Qld ...........................................
Kimberley-Pilbara (WA) ..................... .....
Southern NSW ...................... ................
Darling Downs-SW Qld .........................
Central Coast NSW ...................... .........
Northern Territory ..................... .............
West Moreton-Oxley (Qld) .....................
Inner West Sydney ................................
South Western Sydney .........................
Northern Sydney ................... ................
Inner NW Melbourne .............................
Sydney North Shore & Beaches ............
Gold Coast (Qld) ...................................
Central & NW Qld .................................
Western Sydney....................................
Greater Metro South Brisbane ...............
Central Adelaide & Hills .........................
Perth North Metro .................................
Lower Murray (Vic/NSW) .......................
Perth South Coastal ..............................
South West WA ....................................
Goldelds-Midwest (WA) .......................
Far North Qld ........................................
Bentley-Armadale (WA) .........................
Perth Central & East Metro ....................
Fremantle (WA) .....................................
Eastern Sydney.....................................
Sunshine Coast (Qld) ............................
North Coast NSW .................................
Far West NSW ......................................
94%
94%
94%
94%
94%
94%
94%
93%
93%
93%
93%
93%
93%
93%
93%
93%
93%
93%
93%
93%
93%
93%
92%
92%
92%
92%
92%
92%
92%92%
92%
92%
92%
92%
92%
92%
92%
92%
92%
91%
91%
91%
91%
91%
91%
91%
91%
91%
91%
91%
91%
90%
90%
90%
90%
90%
90%
90%
90%
88%
85%
96%
95%
95%
95%
94%
93%
94%
94%
94%
95%
95%
94%
93%
92%
95%
95%
93%
93%
92%
93%
94%
93%
93%
92%
94%
93%
94%
93%
94%93%
94%
94%
93%
93%
94%
94%
94%
93%
91%
93%
92%
93%
90%
91%
95%
92%
93%
91%
91%
92%
91%
92%
92%
94%
90%
90%
90%
89%
89%
89%
94%
95%
93%
92%
92%
93%
91%
92%
93%
92%
91%
91%
93%
92%
87%
92%
89%
91%
91%
91%
88%
91%
91%
91%
92%
92%
91%
92%
91%
90%91%
92%
90%
86%
89%
92%
92%
89%
91%
88%
91%
89%
90%
87%
89%
92%
90%
90%
86%
87%
87%
87%
89%
89%
91%
86%
86%
87%
84%
87%
86%
88%
Statistical Area Level 3 and
postcode-level data availableat www.nhpa.gov.au

7/28/2019 Healthy Communities: Immunisation rates for children in 2011–12
http://slidepdf.com/reader/full/healthy-communities-immunisation-rates-for-children-in-201112 22/56
11 National Health Performance AuthorityHealthy Communities: Immunisation rates for children in 2011–12 www.nhpa.gov.au
Figure 4 shows the percentages o Aboriginal
and Torres Strait Islander children that were ully
immunised and the numbers o children not ully
immunised at 1 year, 2 years and 5 years.
Each dot represents a Medicare Local catchment.
The size o each dot is scaled to represent the
number o children in each Medicare Local
catchment that were not ully immunised.
There were large variations in the percentages o
Aboriginal and Torres Strait Islander children who
were ully immunised in all three age groups. The
largest variation was recorded or 1 year olds and
5 year olds. The percentages o children aged 1
who were ully immunised ranged rom 94% to
69%, and or children aged 5, the percentages
ranged rom 95% to 70%. The percentages o
children aged 2 years who were ully immunised
ranged rom 97% to 80%.
Figure 5 on the opposite page compares the
percentages o Aboriginal and Torres Strait Islander
children ully immunised or 1 year olds, 2 year olds
and 5 year olds by Medicare Local catchment.
The gure shows that the percentages o children
who were ully immunised at 2 years almost
always exceeded that recorded or 1 year olds.
The percentages recorded or 5 year olds was
almost always lower than that or 2 year olds.
Aboriginal and Torres Strait Islander children ully
immunised: Medicare Local catchment snapshot
Figure 4: Percentages o
Aboriginal and Torres Strait
Islander children1 in each o 61
Medicare Local catchments
that are ully immunised by
age and number not ully
immunised, 2011–12
Number not ully immunised
∙∙∙ 93 up to 95%
∙∙∙ 90 up to 93%
95 to 100%
90 up to 95%
85 up to 90%
80 up to 85%
75 up to 80%
70 up to 75%
65 up to 70%
Percentage ully immunised
≤5
25
50
75
100
150
Aboriginal and Torres
Strait Islander children
aged 1 year
Aboriginal and Torres
Strait Islander children
aged 2 years
Aboriginal and Torres
Strait Islander children
aged 5 years
Interpret with caution, population
between 26 and 100 children
96%
94%
92%
90%
88%
86%
84%
82%
80%
78%
76%
74%
72%
70%
96%
94%
92%
90%
88%
86%
84%
82%
80%
78%
76%
74%
72%
70%
96%
94%
92%
90%
88%
86%
84%
82%
80%
78%
76%
74%
72%
70%Each dot represents
one Medicare Local
catchment
Each dot represents
one Medicare Local
catchment
Each dot represents
one Medicare Local
catchment

7/28/2019 Healthy Communities: Immunisation rates for children in 2011–12
http://slidepdf.com/reader/full/healthy-communities-immunisation-rates-for-children-in-201112 23/56
12National Health Performance Authority Healthy Communities: Immunisation rates for children in 2011–12www.nhpa.gov.au
1. Data are reported as whole numbers. However, or graphical display they are plotted by 2 decimal places.
Note: Interpret with caution: the eligible population is between 26 and 100 Aboriginal or Torres Strait Islander children, so small data errors can aect
results.
Source: Department o Human Services, Australian Childhood Immunisation Register statistics 2011–12, data supplied 14/1/2013.
Figure 5: Percentages o Aboriginal and Torres Strait Islander children1 in each o
61 Medicare Local catchments that are ully immunised by age, 2011–12
1yr 2yrs 5yrsFully immunised at age
Medicare Local catchments
Interpret with caution: the
eligible population is between
26 and 100 children, so small
data errors can aect results.
Not published as less than 26
registered children in age group.
#
NP
70% 75% 80% 85% 90% 95%
South Eastern Sydney ..........................
Gold Coast (Qld) ...................................
Tasmania ................... ...................... .....
South Eastern Melbourne......................
Central Coast NSW...............................
Hume (Vic/NSW) ...................................
Northern Territory ...................... ............
Illawarra-Shoalhaven (NSW) ..................
Hunter (NSW)........................................
Murrumbidgee (NSW)............................
Eastern Sydney.....................................
Sthn Adelaide-Fleurieu-Kangaroo Is. .....
Inner NW Melbourne .............................
Kimberley-Pilbara (WA) ..................... .....
Metro North Brisbane............................
Far North Qld ........................................
Southern NSW ...................... ................
Grampians (Vic) ....................................
Great South Coast (Vic).........................
South Western Sydney .........................
New England (NSW) .............................
Central & NW Qld .................................
Wide Bay (Qld) ......................................
Greater Metro South Brisbane ...............
Barwon (Vic) .........................................
North Coast NSW .................................
Nepean-Blue Mountains (NSW) .............
Macedon Ranges & NW Melb ...............
Western NSW .......................................Sunshine Coast (Qld) ............................
West Moreton-Oxley (Qld) .....................
Gippsland (Vic) ...................... ................
Central Qld ...........................................
Northern Melbourne ..............................
South West WA ....................................
Country South SA .................................
Fremantle (WA) .....................................
Loddon-Mallee-Murray (Vic/NSW) .........
Inner West Sydney ................................
Perth South Coastal ..............................
Australian Capital Territory ................... ..
Country North SA .................................
Townsville-Mackay (Qld) ...................... ..
Darling Downs-SW Qld .........................
Goulburn Valley (Vic) .............................
Goldelds-Midwest (WA) .......................
Western Sydney....................................
Perth North Metro .................................
Northern Adelaide .................................
Lower Murray (Vic/NSW) .......................
Central Adelaide & Hills .........................
Far West NSW ......................................
Perth Central & East Metro ....................
Bentley-Armadale (WA) .........................
Bayside (Vic) .........................................
Eastern Melbourne................................
Frankston-Mornington Peninsula (Vic) ...
Inner East Melbourne ............................
Northern Sydney ...................................
South Western Melbourne ....................
Sydney North Shore & Beaches ............
95%
94%
93%
92%
92%
91%
90%
90%
89%
89%
89%
89%
88%
88%
88%
88%
88%
88%
87%
87%
87%
87%
87%
87%
86%
86%
85%
85%
85%85%
85%
85%
84%
83%
83%
83%
82%
82%
82%
82%
82%
81%
81%
81%
81%
80%
79%
76%
75%
75%
74%
73%
72%
69%
NP
NP
NP
NP
NP
NP
NP
94%
97%
95%
89%
96%
93%
97%
93%
93%
92%
94%
91%
93%
93%
95%
95%
85%
93%
93%
91%
92%
94%
91%
91%
94%
92%
93%
82%
94%89%
94%
94%
91%
88%
88%
93%
85%
94%
88%
85%
91%
91%
91%
92%
90%
92%
86%
89%
84%
88%
80%
90%
83%
86%
NP
NP
92%
NP
NP
90%
NP
93%
94%
92%
85%
92%
91%
92%
90%
92%
83%
83%
75%
NP
84%
88%
91%
76%
90%
86%
90%
86%
95%
86%
89%
95%
86%
88%
84%
83%91%
90%
87%
83%
91%
87%
80%
76%
90%
85%
80%
90%
83%
87%
91%
86%
87%
88%
70%
78%
82%
76%
84%
74%
71%
NP
76%
92%
NP
NP
NP
NP
#
#
#
#
#
#
#
#
#
#
#
#
#
#
#
#
#
#
#
#
#
#
#
#
#
#
#
#
#
#
#
#
#
#
#
#
#
#
#
#
#
#
#
#
#
#
#
#
#
#
#
#
#
#
Defnitions o ullyimmunised at:
1 year
Fully immunised at 1 year means
that a child aged 12 months to
less than 15 months received
their third vaccination or
diphtheria, tetanus, whooping
cough and polio and either their
second or third vaccination
(dependent on the type o
vaccine used) or hepatitis B andHaemophilus infuenzae type
b, all prior to the age o 1 year.
It is assumed that all previous
vaccinations were received.
2 years
Fully immunised at 2 years means
that a child aged 24 to less than
27 months received their third or
ourth vaccination (dependent
on the type o vaccine used) or
diphtheria, tetanus, whooping
cough and Haemophilus
infuenzae type b, their thirdvaccination or polio and hepatitis
B and their frst vaccination or
measles, mumps and rubella,
all prior to the age o 2 years.
It is assumed that all previous
vaccinations were received.
5 years
Fully immunised at 5 years
means that a child aged 60 to
less than 63 months received
their ourth or fth vaccination
(dependent on the type o
vaccine used) or diphtheria,tetanus and whooping cough,
their ourth vaccination or polio
and their second vaccination
or measles mumps and rubella,
all prior to the age o 5 years.
It is assumed that all previous
vaccinations were received.

7/28/2019 Healthy Communities: Immunisation rates for children in 2011–12
http://slidepdf.com/reader/full/healthy-communities-immunisation-rates-for-children-in-201112 24/56

7/28/2019 Healthy Communities: Immunisation rates for children in 2011–12
http://slidepdf.com/reader/full/healthy-communities-immunisation-rates-for-children-in-201112 25/56
Child immunisation ratesMedicare Local catchments 2011–12
14

7/28/2019 Healthy Communities: Immunisation rates for children in 2011–12
http://slidepdf.com/reader/full/healthy-communities-immunisation-rates-for-children-in-201112 26/56
1515 National Health Performance AuthorityHealthy Communities: Immunisation rates for children in 2011–12 www.nhpa.gov.au
Percentages o children aged 1 year ully immunised, by Medicare Local catchment, 2011–12
Fully immunised at 1 year means that a child
aged 12 months to less than 15 months received
their third vaccination or diphtheria, tetanus,
whooping cough and polio, and either their
second or third vaccination (dependent on
the type o vaccine used) or hepatitis B and
Haemophilus infuenzae type b1, all prior to the
age o 1 year. It is assumed that all previous
vaccinations were received.
Children aged 1 year who were ully
immunised, 2011–12
111
113114
115
116
117
118
211
212
213
214
215216
217
306
307
308309
310
311
404
405
506
507
508
601
701
501
502
503504
505
506
401
402
403
404
405
201
202203
204
205
206207
208
209
210
211
214
215
216
217
117
801
i.
vi.
ii.
iii.
iv.
v.
iv. ACTiii. Greater Melbourneii. Greater Adelaidei. Greater Perth
Medicare Local
boundary
Numbers on maps are Medicare Local
catchment codes on the opposite page
405
95 to 100%
93 up to 95%
90 up to 93%
85 up to 90%
80 up to 85%
75 up to 80% L o w e s t
g r o u p
H i g h e s t
g r o u p
1. For more details on the diseases and immunisations see Immunise Australia Program. Diseases and Programs A - Z.
www.immunise.health.gov.au Accessed 26/02/2013.2. Results are reported as whole numbers. However, or graphical display they are plotted by 2 decimal places.
Note: Data exclude a number o invalid and unallocated postcodes – or more inormation see Healthy Communities: Immunisation rates or children in
2011–12, Technical Supplement www.nhpa.gov.au
Source: Department o Human Services, Australian Childhood Immunisation Register statistics 2011–12, data supplied 14/01/2013.

7/28/2019 Healthy Communities: Immunisation rates for children in 2011–12
http://slidepdf.com/reader/full/healthy-communities-immunisation-rates-for-children-in-201112 27/56
16National Health Performance Authority Healthy Communities: Immunisation rates for children in 2011–12www.nhpa.gov.au
Medicare Local catchmentsMap
Re.
Numbernot fully
immunised
aged 1 yearChildren fully immunised Aged 1 yearChildren fully immunised
Percentages o children aged 1 year ully immunised2,
by Medicare Local catchment, 2011–12
70% 80% 90% 100%
92%
212
216
210
116
211
215
801
217
114
115
405
111
202
403
310
404
301
209
206
401
601
205
203
103
307
204
110
208
106207
214
308
508
117
306
109
701
305
102
104
107
201
108
303
309
105
302
402
502
213
505
506
507
311
504
501
503
101
304
113
118
Great South Coast (Vic).........................
Hume (Vic/NSW) ...................................
Barwon (Vic) .........................................
Murrumbidgee (NSW)............................
Grampians (Vic) ....................................
Goulburn Valley (Vic) .............................
Australian Capital Territory .....................
Gippsland (Vic)......................................
New England (NSW) .............................
Western NSW .......................................
Country North SA .................................
Hunter (NSW)........................................
Bayside (Vic) .........................................
Sthn Adelaide-Fleurieu-Kangaroo Is. .....
Townsville-Mackay (Qld) .................... ....
Country South SA .................................
Metro North Brisbane ..................... .......
Frankston-Mornington Peninsula (Vic) ...
Inner East Melbourne ............................
Northern Adelaide .................................
Tasmania .................... ...................... ....
Northern Melbourne ................... ...........
South Western Melbourne ....................
South Eastern Sydney ..........................
Wide Bay (Qld) ......................................
Macedon Ranges & NW Melb ...............
Illawarra-Shoalhaven (NSW) ..................
South Eastern Melbourne......................
Nepean-Blue Mountains (NSW) .............Eastern Melbourne................................
Loddon-Mallee-Murray (Vic/NSW) .........
Central Qld ...........................................
Kimberley-Pilbara (WA) ...................... ....
Southern NSW......................................
Darling Downs-SW Qld .........................
Central Coast NSW...............................
Northern Territory ................... ...............
West Moreton-Oxley (Qld) .....................
Inner West Sydney ..................... ...........
South Western Sydney .........................
Northern Sydney .................... ...............
Inner NW Melbourne .............................
Sydney North Shore & Beaches ............
Gold Coast (Qld) ...................................
Central & NW Qld .................................
Western Sydney....................................
Greater Metro South Brisbane ...............
Central Adelaide & Hills .........................
Perth North Metro .................................
Lower Murray (Vic/NSW) .......................
Perth South Coastal ..............................
South West WA ....................................
Goldelds-Midwest (WA) .......................
Far North Qld ........................................
Bentley-Armadale (WA) .........................
Perth Central & East Metro ................... .
Fremantle (WA) .....................................
Eastern Sydney.....................................
Sunshine Coast (Qld) ............................
North Coast NSW .................................
Far West NSW ......................................
69
135
199
151
157
118
326
208
170
249
164
598
491
333
430
113
846
254
466
413
461
664
351
479
173
542
341
563
382404
214
253
128
178
346
330
305
478
692
1144
385
445
540
576
70
1200
1150
478
642
80
318
365
182
408
552
533
289
462
425
685
79
94%
94%
94%
94%
94%
94%
94%
93%
93%
93%
93%
93%
93%
93%
93%
93%
93%
93%
93%
93%
93%
93%
92%
92%
92%
92%
92%
92%
92%92%
92%
92%
92%
92%
92%
92%
92%
92%
92%
91%
91%
91%
91%
91%
91%
91%
91%
91%
91%
91%
91%
90%
90%
90%
90%
90%
90%
90%
90%
88%
85%
113
301
302
303
304
305
306
307
102
103104
105
106
107
108
109
110
111
101
vi. Greater Brisbane
v. Greater Sydney
National ully immunised rate 1 year
Postcode-level data available
at www.nhpa.gov.au
Statistical Area Level 3 and
postcode-level data available at
www.nhpa.gov.au
7/28/2019 Healthy Communities: Immunisation rates for children in 2011–12
http://slidepdf.com/reader/full/healthy-communities-immunisation-rates-for-children-in-201112 28/56
17 National Health Performance AuthorityHealthy Communities: Immunisation rates for children in 2011–12 www.nhpa.gov.au
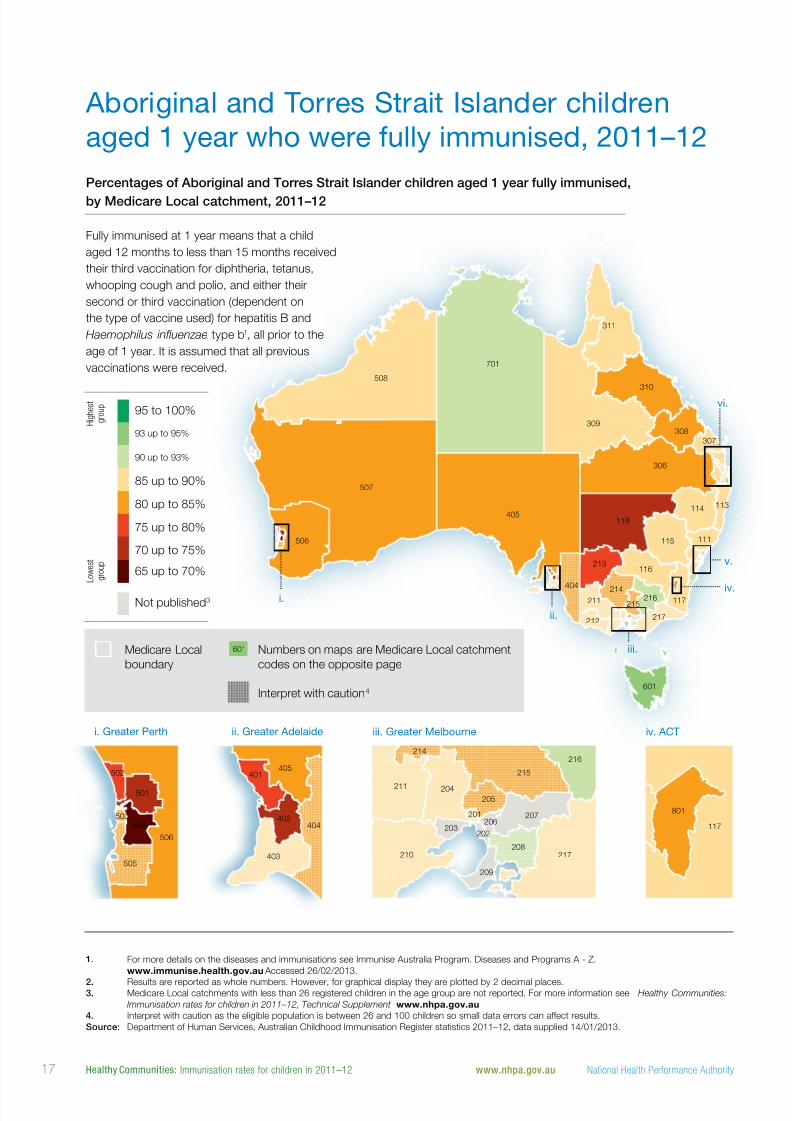
Percentages o Aboriginal and Torres Strait Islander children aged 1 year ully immunised,
by Medicare Local catchment, 2011–12
Aboriginal and Torres Strait Islander children
aged 1 year who were ully immunised, 2011–12
Not published3
95 to 100%
93 up to 95%
90 up to 93%
85 up to 90%
80 up to 85%
75 up to 80%
70 up to 75%
65 up to 70% L o w e s t
g r o u p
H i g h e s t
g r o u p
1. For more details on the diseases and immunisations see Immunise Australia Program. Diseases and Programs A - Z.
www.immunise.health.gov.au Accessed 26/02/2013.
2. Results are reported as whole numbers. However, or graphical display they are plotted by 2 decimal places.3. Medicare Local catchments with less than 26 registered children in the age group are not reported. For more inormation see Healthy Communities:
Immunisation rates or children in 2011–12, Technical Supplement www.nhpa.gov.au
4. Interpret with caution as the eligible population is between 26 and 100 children so small data errors can aect results.
Source: Department o Human Services, Australian Childhood Immunisation Register statistics 2011–12, data supplied 14/01/2013.
Fully immunised at 1 year means that a child
aged 12 months to less than 15 months received
their third vaccination or diphtheria, tetanus,
whooping cough and polio, and either their
second or third vaccination (dependent on
the type o vaccine used) or hepatitis B and
Haemophilus infuenzae type b1, all prior to the
age o 1 year. It is assumed that all previous
vaccinations were received.
111
113114
115
116
117
118
211
212
213
214
215216
217
306
307
308309
310
311
404
405
506
507
508
601
701
501
502
503504
505
506
401
402
403
404
405
201
202203
204
205
206207
208
209
210
211
214
215
216
217
117
801
i.
vi.
ii.
iii.
iv.
v.
iv. ACTiii. Greater Melbourneii. Greater Adelaidei. Greater Perth
Medicare Local
boundary
Numbers on maps are Medicare Local catchment
codes on the opposite page
Interpret with caution4
601

7/28/2019 Healthy Communities: Immunisation rates for children in 2011–12
http://slidepdf.com/reader/full/healthy-communities-immunisation-rates-for-children-in-201112 29/56
18National Health Performance Authority Healthy Communities: Immunisation rates for children in 2011–12www.nhpa.gov.au
Medicare Local catchmentsMap
Re.
Numbernot fully
immunised
aged 1 year Aboriginal and Torres Strait Islander children fully immunised Aged 1 year
Aborig inal andTorres Strait
Islander children All childre n
Percentage o Aboriginal and Torres Strait Islander children aged
1 year ully immunised2, by Medicare Local catchment, 2011–12
70% 80% 90% 100%
85%
103
303
601
208
109
216
701
110
111
116
101
403
201
508
301
311
117
211
212
104
114
309
307
302
210
113
106
204
115304
305
217
308
205
506
404
503
214
102
505
801
405
310
306
215
507
105
502
401
213
402
118
501
504
202
207
209
206
107
203
108
South Eastern Sydney ..........................
Gold Coast (Qld) ...................................
Tasmania ..................... ...................... ...
South Eastern Melbourne......................
Central Coast NSW...............................
Hume (Vic/NSW) ...................................
Northern Territory ................... ...............
Illawarra-Shoalhaven (NSW) ..................
Hunter (NSW)........................................
Murrumbidgee (NSW)............................
Eastern Sydney.....................................
Sthn Adelaide-Fleurieu-Kangaroo Is. .....
Inner NW Melbourne .............................
Kimberley-Pilbara (WA) ...................... ....
Metro North Brisbane............................
Far North Qld ........................................
Southern NSW......................................
Grampians (Vic) ....................................
Great South Coast (Vic).........................
South Western Sydney .........................
New England (NSW) .............................
Central & NW Qld .................................
Wide Bay (Qld) ......................................
Greater Metro South Brisbane ...............
Barwon (Vic) .........................................
North Coast NSW .................................
Nepean-Blue Mountains (NSW) .............
Macedon Ranges & NW Melb ...............
Western NSW .......................................Sunshine Coast (Qld) ............................
West Moreton-Oxley (Qld) .....................
Gippsland (Vic)......................................
Central Qld ...........................................
Northern Melbourne ...................... ........
South West WA ....................................
Country South SA .................................
Fremantle (WA) .....................................
Loddon-Mallee-Murray (Vic/NSW) .........
Inner West Sydney ................................
Perth South Coastal ..............................
Australian Capital Territory .................... .
Country North SA .................................
Townsville-Mackay (Qld) .................... ....
Darling Downs-SW Qld .........................
Goulburn Valley (Vic) .............................
Goldelds-Midwest (WA) .......................
Western Sydney....................................
Perth North Metro .................................
Northern Adelaide .................................
Lower Murray (Vic/NSW) .......................
Central Adelaide & Hills .........................
Far West NSW ......................................
Perth Central & East Metro ................... .
Bentley-Armadale (WA) .........................
Bayside (Vic) .........................................
Eastern Melbourne................................
Frankston-Mornington Peninsula (Vic) ...
Inner East Melbourne ............................
Northern Sydney .................... ...............
South Western Melbourne ....................
Sydney North Shore & Beaches ............
≤5
7
27
≤5
16
9
145
28
59
23
≤5
10
≤5
72
40
148
16
7
≤5
33
57
40
25
57
≤5
84
25
6
8122
42
14
59
16
42
13
12
16
14
16
21
48
129
93
16
72
42
34
53
26
29
44
40
74
95%
94%
93%
92%
92%
91%
90%
90%
89%
89%
89%
89%
88%
88%
88%
88%
88%
88%
87%
87%
87%
87%
87%
87%
86%
86%
85%
85%
85%85%
85%
85%
84%
83%
83%
83%
82%
82%
82%
82%
82%
81%
81%
81%
81%
80%
79%
76%
75%
75%
74%
73%
72%
69%
NP
NP
NP
NP
NP
NP
NP
4
4
4
4
4
4
4
4
4
4
4
4
4
4
4
4
4
3
3
3
3
3
3
3
Notes: Data exclude a number o invalid and unallocated postcodes – or more inormation see Healthy Communities: Immunisation rates or children in
2011–12, Technical Supplement www.nhpa.gov.au
This data refects the resu lts or children identied as Aboriginal and Torres Strait Islander in the ACIR in 2011–12. Levels o identication may vary
between Medicare Local catchments.
113
301
302
303
304
305
306
307
102
103104
105
106
107
108
109
110
111
101
vi. Greater Brisbane
v. Greater Sydney
National ully immunised rate 1 year

7/28/2019 Healthy Communities: Immunisation rates for children in 2011–12
http://slidepdf.com/reader/full/healthy-communities-immunisation-rates-for-children-in-201112 30/56
19 National Health Performance AuthorityHealthy Communities: Immunisation rates for children in 2011–12 www.nhpa.gov.au
Percentages o children aged 2 years ully immunised, by Medicare Local catchment, 2011–12
Fully immunised at 2 years means that a child
aged 24 to less than 27 months received their third
or ourth vaccination (dependent on the type o
vaccine used) or diphtheria, tetanus, whooping
cough and Haemophilus infuenzae type b, their
third vaccination or polio and hepatitis B and their
rst vaccination or measles, mumps and rubella1,
all prior to the age o 2 years. It is assumed
that all previous vaccinations
were received.
Children aged 2 years who were ully
immunised, 2011–12
111
113114
115
116
117
118
211
212
213
214
215216
217
306
307
308309
310
311
404
405
506
507
508
601
701
501
502
503504
505
506
401
402
403
404
405
201
202203
204
205
206207
208
209
210
211
214
215
216
217
117
801
i.
vi.
ii.
iii.
iv.
v.
iv. ACTiii. Greater Melbourneii. Greater Adelaidei. Greater Perth
Medicare Local
boundary
508 Numbers on maps are Medicare Local
catchment codes on the opposite page
95 to 100%
93 up to 95%
90 up to 93%
85 up to 90%
80 up to 85%
75 up to 80% L o w e s t
g r o u p
H i g h e s t
g r o u p
1. For more details on the diseases and immunisations see Immunise Australia Program. Diseases and Programs A - Z.
www.immunise.health.gov.au Accessed 26/02/2013.2. Results are reported as whole numbers. However, or graphical display they are plotted by 2 decimal places.
Note: Data exclude a number o invalid and unallocated postcodes – or more inormation see Healthy Communities: Immunisation rates or children in
2011–12, Technical Supplement www.nhpa.gov.au
Source: Department o Human Services, Australian Childhood Immunisation Register statistics 2011–12, data supplied 14/01/2013.

7/28/2019 Healthy Communities: Immunisation rates for children in 2011–12
http://slidepdf.com/reader/full/healthy-communities-immunisation-rates-for-children-in-201112 31/56
20National Health Performance Authority Healthy Communities: Immunisation rates for children in 2011–12www.nhpa.gov.au
Medicare Local catchmentsMap
Re.
Numbernot fully
immunised
Aged 2 yearsChildren fully immunised
Percentages o children aged 2 years ully immunised2,
by Medicare Local catchment, 2011–12
Postcode-level data available
at www.nhpa.gov.au
70% 80% 90% 100%
93%
212
115
405
216
309
404
116
310
210
701
214
114
111
211
217
109
307
801
106
601
308
311
118
306
110
205
208
117
209401
508
301
215
203
104
204
207
201
305
202
302
206
213
107
507
403
103
105
506
303
505
102
502
402
504
503
501
108
304
101
113
Great South Coast (Vic).........................
Western NSW .......................................
Country North SA .................................
Hume (Vic/NSW) ...................................
Central & NW Qld .................................
Country South SA ...................... ...........
Murrumbidgee (NSW)............................
Townsville-Mackay (Qld) .................... ....
Barwon (Vic) .........................................
Northern Territory ................... ...............
Loddon-Mallee-Murray (Vic/NSW) .........
New England (NSW) .............................
Hunter (NSW)........................................
Grampians (Vic) ....................................
Gippsland (Vic)......................................
Central Coast NSW...............................
Wide Bay (Qld) ......................................
Australian Capital Territory .....................
Nepean-Blue Mountains (NSW) .............
Tasmania .................... ...................... ....
Central Qld ...........................................
Far North Qld ........................................
Far West NSW ......................................
Darling Downs-SW Qld .........................
Illawarra-Shoalhaven (NSW) ..................
Northern Melbourne ................... ...........
South Eastern Melbourne......................
Southern NSW......................................
Frankston-Mornington Peninsula (Vic) ...Northern Adelaide .................................
Kimberley-Pilbara (WA) ...................... ....
Metro North Brisbane .................... ........
Goulburn Valley (Vic) .............................
South Western Melbourne ....................
South Western Sydney .........................
Macedon Ranges & NW Melb ...............
Eastern Melbourne................................
Inner NW Melbourne .............................
West Moreton-Oxley (Qld) .....................
Bayside (Vic) .........................................
Greater Metro South Brisbane ...............
Inner East Melbourne ............................
Lower Murray (Vic/NSW) .......................
Northern Sydney .................... ...............
Goldelds-Midwest (WA) .......................
Sthn Adelaide-Fleurieu-Kangaroo Is. .....
South Eastern Sydney ..........................
Western Sydney....................................
South West WA ....................................
Gold Coast (Qld) ...................................
Perth South Coastal ..............................
Inner West Sydney ................................
Perth North Metro .................................
Central Adelaide & Hills .........................
Bentley-Armadale (WA) .........................
Fremantle (WA) .....................................
Perth Central & East Metro ................... .
Sydney North Shore & Beaches ............
Sunshine Coast (Qld) ............................
Eastern Sydney.....................................
North Coast NSW .................................
48
169
120
128
40
87
139
314
197
206
144
136
498
146
187
242
147
319
308
401
211
261
36
276
306
583
498
153
243376
107
799
138
329
958
520
380
355
437
492
969
491
68
364
142
357
492
1097
322
589
302
724
660
514
530
284
553
651
475
473
666
96%
95%
95%
95%
95%
95%
95%
95%
95%
94%
94%
94%
94%
94%
94%
94%
94%
94%
94%
94%
94%
94%
94%
94%
94%
93%
93%
93%
93%93%
93%
93%
93%
93%
93%
93%
93%
93%
93%
93%
93%
92%
92%
92%
92%
92%
92%
92%
92%
91%
91%
91%
91%
91%
90%
90%
90%
90%
89%
89%
89%
113
301
302
303
304
305
306
307
102
103104
105
106
107
108
109
110
111
101
vi. Greater Brisbane
v. Greater Sydney
National ully immunised rate 2 years
Statistical Area Level 3 and
postcode-level data available at
www.nhpa.gov.au

7/28/2019 Healthy Communities: Immunisation rates for children in 2011–12
http://slidepdf.com/reader/full/healthy-communities-immunisation-rates-for-children-in-201112 32/56
21 National Health Performance AuthorityHealthy Communities: Immunisation rates for children in 2011–12 www.nhpa.gov.au
Aboriginal and Torres Strait Islander children
aged 2 years who were ully immunised, 2011–12
Percentages o Aboriginal and Torres Strait Islander children aged 2 years ully immunised,
by Medicare Local catchment, 2011–12
Fully immunised at 2 years means that a child
aged 24 to less than 27 months received their third
or ourth vaccination (dependent on the type o
vaccine used) or diphtheria, tetanus, whooping
cough and Haemophilus infuenzae type b, their
third vaccination or polio and hepatitis B and their
rst vaccination or measles, mumps and rubella1,
all prior to the age o 2 years. It is assumed
that all previous vaccinations
were received.
111
113114
115
116
117
118
211
212
213
214
215216
217
306
307
308309
310
311
404
405
506
507
508
601
701
501
502
503504
505
506
401
402
403
404
405
201
202203
204
205
206207
208
209
210
211
214
215
216
217
117
801
i.
vi.
ii.
iii.
iv.
v.
iv. ACTiii. Greater Melbourneii. Greater Adelaidei. Greater Perth
Medicare Local
boundary
508 Numbers on maps are Medicare Local catchment
codes on the opposite page
Interpret with caution4
1. For more details on the diseases and immunisations see Immunise Australia Program. Diseases and Programs A - Z.
www.immunise.health.gov.au Accessed 26/02/2013.
2. Results are reported as whole numbers. However, or graphical display they are plotted by 2 decimal places.3. Medicare Local catchments with less than 26 registered children in the age group are not reported. For more inormation see Healthy Communities:
Immunisation rates or children in 2011–12, Technical Supplement www.nhpa.gov.au
4. Interpret with caution as the eligible population is between 26 and 100 children so small data errors can aect results.
Source: Department o Human Services, Australian Childhood Immunisation Register statistics 2011–12, data supplied 14/01/2013.
Not published3
95 to 100%
93 up to 95%
90 up to 93%
85 up to 90%
80 up to 85%
75 up to 80%
70 up to 75%
65 up to 70% L o w e s t
g r o u p
H i g h e s t
g r o u p

7/28/2019 Healthy Communities: Immunisation rates for children in 2011–12
http://slidepdf.com/reader/full/healthy-communities-immunisation-rates-for-children-in-201112 33/56
22National Health Performance Authority Healthy Communities: Immunisation rates for children in 2011–12www.nhpa.gov.au
Medicare Local catchmentsMap
Re.
Aged 2 years Aboriginal and Torres Strait Islander children fully immunised
Numbernot fully
immunised
Aborig inal andTorres Strait
Islander children All childre n
Percentages o Aboriginal and Torres Strait Islander children aged
2 years ully immunised2, by Medicare Local catchment, 2011–12
70% 80% 90% 100%
92%
701
303
109
311
301
601
115
101
210
309
103
217
214
305
508
201
111
216
106
212
404
211
110
116
306
507
113
209
114403
801
405
310
104
307
302
308
215
203
118
304
208
502
205
102
506
213
105
504
117
503
505
401
501
204
402
202
207
206
107
108
Northern Territory .................... ..............
Gold Coast (Qld) ...................................
Central Coast NSW .................... ...........
Far North Qld ...................... ..................
Metro North Brisbane ..................... .......
Tasmania ..................... ...................... ...
Western NSW .......................................
Eastern Sydney.....................................
Barwon (Vic) .........................................
Central & NW Qld .................................
South Eastern Sydney ..........................
Gippsland (Vic)......................................
Loddon-Mallee-Murray (Vic/NSW) .........
West Moreton-Oxley (Qld) .....................
Kimberley-Pilbara (WA)..........................
Inner NW Melbourne .............................
Hunter (NSW)........................................
Hume (Vic/NSW) ...................................
Nepean-Blue Mountains (NSW) .............
Great South Coast (Vic).........................
Country South SA .................................
Grampians (Vic) ....................................
Illawarra-Shoalhaven (NSW) ..................
Murrumbidgee (NSW)............................
Darling Downs-SW Qld .........................
Goldelds-Midwest (WA) .......................
North Coast NSW .................................
Frankston-Mornington Peninsula (Vic) ...
New England (NSW) .............................Sthn Adelaide-Fleurieu-Kangaroo Is. .....
Australian Capital Territory .....................
Country North SA .................................
Townsville-Mackay (Qld) .................... ....
South Western Sydney .........................
Wide Bay (Qld) ......................................
Greater Metro South Brisbane ...............
Central Qld ...........................................
Goulburn Valley (Vic) .............................
South Western Melbourne ....................
Far West NSW ......................................
Sunshine Coast (Qld) ............................
South Eastern Melbourne......................
Perth North Metro .................................
Northern Melbourne ...................... ........
Inner West Sydney ................................
South West WA ....................................
Lower Murray (Vic/NSW) .......................
Western Sydney....................................
Bentley-Armadale (WA) .........................
Southern NSW......................................
Fremantle (WA) .....................................
Perth South Coastal ...................... ........
Northern Adelaide .................................
Perth Central & East Metro ................... .
Macedon Ranges & NW Melb ...............
Central Adelaide & Hills .........................
Bayside (Vic) .........................................
Eastern Melbourne................................
Inner East Melbourne ............................
Northern Sydney .................... ...............
Sydney North Shore & Beaches ............
51
7
9
57
16
22
30
≤5
≤5
16
≤5
6
≤5
21
36
≤5
32
≤5
10
≤5
7
≤5
18
14
39
28
44
≤5
328
9
23
63
22
19
38
33
7
≤5
17
16
≤5
13
9
13
32
11
33
31
17
11
17
32
27
8
26
97%
97%
96%
95%
95%
95%
94%
94%
94%
94%
94%
94%
94%
94%
93%
93%
93%
93%
93%
93%
93%
93%
93%
92%
92%
92%
92%
92%
92%91%
91%
91%
91%
91%
91%
91%
91%
90%
90%
90%
89%
89%
89%
88%
88%
88%
88%
86%
86%
85%
85%
85%
84%
83%
82%
80%
NP
NP
NP
NP
NP
113
301
302
303
304
305
306
307
102
103104
105
106
107
108
109
110
111
101
vi. Greater Brisbane
v. Greater Sydney
National ully immunised rate 2 years
Notes: Data exclude a number o invalid and unallocated postcodes – or more inormation see Healthy Communities: Immunisation rates or children in
2011–12, Technical Supplement www.nhpa.gov.au
This data refects the resu lts or children identied as Aboriginal and Torres Strait Islander in the ACIR in 2011–12. Levels o identication may vary
between Medicare Local catchments.
4
4
4
4
4
4
4
4
4
4
4
4
4
4
4
4
4
4
4
3
3
3
3
3

7/28/2019 Healthy Communities: Immunisation rates for children in 2011–12
http://slidepdf.com/reader/full/healthy-communities-immunisation-rates-for-children-in-201112 34/56
23 National Health Performance AuthorityHealthy Communities: Immunisation rates for children in 2011–12 www.nhpa.gov.au
Percentages o children aged 5 years ully immunised, by Medicare Local catchment, 2011–12
Fully immunised at 5 years means that a child
aged 60 to less than 63 months received their
ourth or th vaccination (dependent on the
type o vaccine used) or diphtheria, tetanus and
whooping cough, their ourth vaccination or polio
and their second vaccination or measles mumps
and rubella1, all prior to the age o 5 years.
It is assumed that all previous vaccinations
were received.
Children aged 5 years who were ully
immunised, 2011–12
111
113114
115
116
117
118
211
212
213
214
215216
217
306
307
308309
310
311
404
405
506
507
508
601
701
501
502
503504
505
506
401
402
403
404
405
201
202203
204
205
206207
208
209
210
211
214
215
216
217
117
801
i.
vi.
ii.
iii.
iv.
v.
iv. ACTiii. Greater Melbourneii. Greater Adelaidei. Greater Perth
Medicare Local
boundary
111 Numbers on maps are Medicare Local
catchment codes on the opposite page
1. For more details on the diseases and immunisations see Immunise Australia Program. Diseases and Programs A - Z.
www.immunise.health.gov.au Accessed 26/02/2013.2. Results are reported as whole numbers. However, or graphical display they are plotted by 2 decimal places.
Note: Data exclude a number o invalid and unallocated postcodes – or more inormation see Healthy Communities: Immunisation rates or children in
2011–12, Technical Supplement www.nhpa.gov.au
Source: Department o Human Services, Australian Childhood Immunisation Register statistics 2011–12, data supplied 14/01/2013.
95 to 100%
93 up to 95%
90 up to 93%
85 up to 90%
80 up to 85%
75 up to 80% L o w e s t
g r o u p
H i g h e s t
g r o u p

7/28/2019 Healthy Communities: Immunisation rates for children in 2011–12
http://slidepdf.com/reader/full/healthy-communities-immunisation-rates-for-children-in-201112 35/56
24National Health Performance Authority Healthy Communities: Immunisation rates for children in 2011–12www.nhpa.gov.au
Medicare Local catchmentsMap
Re.
Numbernot fully
immunised
Aged 5 yearsChildren fully immunised
Percentages o children aged 5 years ully immunised2,
by Medicare Local catchment, 2011–12
70% 80% 90% 100%
90%
212
216
217
111
211
116
110
307
214
210
109
202
309
114
801
103
306
310
206
205
209
204
405
203
601
208
207
215
305301
104
115
311
106
302
201
105
308
107
117
506
701
507
303
404
102
401
118
213
108
505
304
503
502
403
402
508
504
501
113
101
Great South Coast (Vic).........................
Hume (Vic/NSW) ...................................
Gippsland (Vic)......................................
Hunter (NSW)........................................
Grampians (Vic) ....................................
Murrumbidgee (NSW)............................
Illawarra-Shoalhaven (NSW) ..................
Wide Bay (Qld) ......................................
Loddon-Mallee-Murray (Vic/NSW) .........
Barwon (Vic) .........................................
Central Coast NSW...............................
Bayside (Vic) .........................................
Central & NW Qld .................................
New England (NSW) .............................
Australian Capital Territory .....................
South Eastern Sydney ..........................
Darling Downs-SW Qld .........................
Townsville-Mackay (Qld) .................... ....
Inner East Melbourne ............................
Northern Melbourne ................... ...........
Frankston-Mornington Peninsula (Vic) ...
Macedon Ranges & NW Melb ...............
Country North SA .................................
South Western Melbourne ....................
Tasmania .................... ...................... ....
South Eastern Melbourne......................
Eastern Melbourne................................
Goulburn Valley (Vic) .............................
West Moreton-Oxley (Qld) .....................Metro North Brisbane .................... ........
South Western Sydney .........................
Western NSW .......................................
Far North Qld ........................................
Nepean-Blue Mountains (NSW) .............
Greater Metro South Brisbane ...............
Inner NW Melbourne .............................
Western Sydney....................................
Central Qld ...........................................
Northern Sydney .................... ...............
Southern NSW......................................
South West WA ....................................
Northern Territory ................... ...............
Goldelds-Midwest (WA) .......................
Gold Coast (Qld) ...................................
Country South SA .................................
Inner West Sydney ................................
Northern Adelaide .................................
Far West NSW ......................................
Lower Murray (Vic/NSW) .......................
Sydney North Shore & Beaches ............
Perth South Coastal ..............................
Sunshine Coast (Qld) ............................
Fremantle (WA) .....................................
Perth North Metro .................................
Sthn Adelaide-Fleurieu-Kangaroo Is. .....
Central Adelaide & Hills .........................
Kimberley-Pilbara (WA) ...................... ....
Bentley-Armadale (WA) .........................
Perth Central & East Metro ................... .
North Coast NSW .................................
Eastern Sydney.....................................
71
168
234
623
202
201
362
197
216
285
336
537
57
208
398
501
371
484
604
770
329
622
228
372
592
693
492
194
5391098
1274
352
376
480
1252
417
1287
328
543
265
446
377
192
742
203
782
630
62
113
757
456
602
368
940
621
755
206
741
787
896
592
95%
93%
93%
93%
93%
92%
92%
92%
92%
92%
92%
92%
92%
92%
92%
92%
92%
92%
91%
91%
91%
91%
91%
91%
91%
91%
91%
91%
91%91%
91%
91%
91%
90%
90%
90%
90%
90%
89%
89%
89%
89%
89%
89%
89%
88%
88%
88%
87%
87%
87%
87%
87%
87%
87%
86%
86%
86%
86%
86%
84%
113
301
302
303
304
305
306
307
102
103104
105
106
107
108
109
110
111
101
vi. Greater Brisbane
v. Greater Sydney
National ully immunised rate 5 years
Postcode-level data available
at www.nhpa.gov.au
Statistical Area Level 3 and
postcode-level data available at
www.nhpa.gov.au

7/28/2019 Healthy Communities: Immunisation rates for children in 2011–12
http://slidepdf.com/reader/full/healthy-communities-immunisation-rates-for-children-in-201112 36/56
25 National Health Performance AuthorityHealthy Communities: Immunisation rates for children in 2011–12 www.nhpa.gov.au
Aboriginal and Torres Strait Islander children
aged 5 years who were ully immunised, 2011–12
Percentages o Aboriginal and Torres Strait Islander children aged 5 years ully immunised,
by Medicare Local catchment, 2011–12
Fully immunised at 5 years means that a child
aged 60 to less than 63 months received their
ourth or th vaccination (dependent on the
type o vaccine used) or diphtheria, tetanus and
whooping cough, their ourth vaccination or polio
and their second vaccination or measles mumps
and rubella1, all prior to the age o 5 years.
It is assumed that all previous vaccinations
were received.
111
113114
115
116
117
118
211
212
213
214
215216
217
306
307
308309
310
311
404
405
506
507
508
601
701
501
502
503504
505
506
401
402
403
404
405
201
202203
204
205
206207
208
209
210
211
214
215
216
217
117
801
i.
vi.
ii.
iii.
iv.
v.
iv. ACTiii. Greater Melbourneii. Greater Adelaidei. Greater Perth
Medicare Local
boundary
303 Numbers on maps are Medicare Local
catchment codes on the opposite page
Interpret with caution4
1. For more details on the diseases and immunisations see Immunise Australia Program. Diseases and Programs A - Z.
www.immunise.health.gov.au Accessed 26/02/2013.
2. Results are reported as whole numbers. However, or graphical display they are plotted by 2 decimal places.3. Medicare Local catchments with less than 26 registered children in the age group are not reported. For more inormation see Healthy Communities:
Immunisation rates or children in 2011–12, Technical Supplement www.nhpa.gov.au
4. Interpret with caution as the eligible population is between 26 and 100 children so small data errors can aect results.
Source: Department o Human Services, Australian Childhood Immunisation Register statistics 2011–12, data supplied 14/01/2013.
Not published3
95 to 100%
93 up to 95%
90 up to 93%
85 up to 90%
80 up to 85%
75 up to 80%
70 up to 75%
65 up to 70% L o w e s t
g r o u p
H i g h e s t
g r o u p

7/28/2019 Healthy Communities: Immunisation rates for children in 2011–12
http://slidepdf.com/reader/full/healthy-communities-immunisation-rates-for-children-in-201112 37/56
26National Health Performance Authority Healthy Communities: Immunisation rates for children in 2011–12www.nhpa.gov.au
Medicare Local catchmentsMap
Re.
Numbernot fully
immunised
Aged 5 years Aboriginal and Torres Strait Islander children fully immunised
Percentages o Aboriginal and Torres Strait Islander children aged
5 years ully immunised2, by Medicare Local catchment, 2011–12
70% 80% 90% 100%
87%
210
309
303
103
701
209
111
601
109
216
311
306
205
304
211
110
214
305
801
104
302
301
105
106
506
507
217
310
212215
307
113
114
102
208
204
508
118
405
115
101
308
116
213
505
404
401
402
117
207
503
403
501
504
502
202
206
201
107
203
108
Barwon (Vic) .........................................
Central & NW Qld .................................
Gold Coast (Qld) ...................................
South Eastern Sydney ..........................
Northern Territory .................... ..............
Frankston-Mornington Peninsula (Vic) ..
Hunter (NSW)........................................
Tasmania ..................... ..................... ....
Central Coast NSW...............................
Hume (Vic/NSW) ..................................
Far North Qld ...................... ..................
Darling Downs-SW Qld .........................
Northern Melbourne ................... ...........
Sunshine Coast (Qld) ............................
Grampians (Vic) .......... ..................... ....
Illawarra-Shoalhaven (NSW) ..................
Loddon-Mallee-Murray (Vic/NSW) ........
West Moreton-Oxley (Qld) .....................
Australian Capital Territory .....................
South Western Sydney .........................
Greater Metro South Brisbane ...............
Metro North Brisbane ..................... .......
Western Sydney....................................
Nepean-Blue Mountains (NSW) .............
South West WA ....................................
Goldelds-Midwest (WA) .......................
Gippsland (Vic) .....................................
Townsville-Mackay (Qld) .................... ....
Great South Coast (Vic) ........................Goulburn Valley (Vic) .......... ..................
Wide Bay (Qld) ......................................
North Coast NSW .................................
New England (NSW) .............................
Inner West Sydney ................................
South Eastern Melbourne......................
Macedon Ranges & NW Melb ...............
Kimberley-Pilbara (WA) ...................... ....
Far West NSW ......................................
Country North SA .................................
Western NSW .......................................
Eastern Sydney.....................................
Central Qld ...........................................
Murrumbidgee (NSW)............................
Lower Murray (Vic/NSW) ......................
Perth South Coastal ...................... ........
Country South SA .................................
Northern Adelaide .................................
Central Adelaide & Hills .........................
Southern NSW......................................
Eastern Melbourne................................
Fremantle (WA) ....................................
Sthn Adelaide-Fleurieu-Kangaroo Is. .....
Perth Central & East Metro ................... .
Bentley-Armadale (WA) .........................
Perth North Metro .................................
Bayside (Vic) .........................................
Inner East Melbourne ............................
Inner NW Melbourne .............................
Northern Sydney .................... ...............
South Western Melbourne ....................
Sydney North Shore & Beaches ............
≤5
12
9
≤5
110
≤5
35
27
15
6
95
40
7
10
≤5
19
8
33
10
22
43
33
24
17
32
45
10
78
≤59
24
75
50
12
6
6
87
23
36
78
7
54
32
14
24
16
35
24
28
7
14
20
45
61
48
95%
95%
94%
93%
92%
92%
92%
92%
92%
91%
91%
91%
91%
91%
90%
90%
90%
90%
90%
90%
89%
88%
88%
88%
87%
87%
87%
87%
86%86%
86%
86%
86%
85%
85%
84%
84%
84%
83%
83%
83%
83%
83%
82%
80%
80%
78%
76%
76%
76%
76%
75%
74%
71%
70%
NP
NP
NP
NP
NP
NP
4
4
4
4
4
4
4
4
4
4
4
4
4
4
4
4
4
4
4
4
4
3
3
3
3
3
3
113
301
302
303
304
305
306
307
102
103104
105
106
107
108
109
110
111
101
vi. Greater Brisbane
v. Greater Sydney
National ully immunised rate 5 years
Notes: Data exclude a number o invalid and unallocated postcodes – or more inormation see Healthy Communities: Immunisation rates or children in
2011–12, Technical Supplement www.nhpa.gov.au
This data refects the resu lts or children identied as Aboriginal and Torres Strait Islander in the ACIR in 2011–12. Levels o identication may vary
between Medicare Local catchments.
Aborig inal andTorres Strait
Islander children All childre n

7/28/2019 Healthy Communities: Immunisation rates for children in 2011–12
http://slidepdf.com/reader/full/healthy-communities-immunisation-rates-for-children-in-201112 38/56

7/28/2019 Healthy Communities: Immunisation rates for children in 2011–12
http://slidepdf.com/reader/full/healthy-communities-immunisation-rates-for-children-in-201112 39/56
Child immunisation ratesStatistical areas 2011–12
28

7/28/2019 Healthy Communities: Immunisation rates for children in 2011–12
http://slidepdf.com/reader/full/healthy-communities-immunisation-rates-for-children-in-201112 40/56
29 National Health Performance AuthorityHealthy Communities: Immunisation rates for children in 2011–12 www.nhpa.gov.au
Children aged 1 year who were ully
immunised, by statistical area, 2011–12 Variation within Medicare Local catchments
The maps on these pages show the percentages
o children aged 1 year who were ully immunised
by geographic areas reerred to as Statistical
Areas Level 3 (SA3).1 The numbers o children not
ully immunised or each statistical area1 are
also shown.
Findings
In 2011–12, the percentages o children aged
1 year who were ully immunised varied across
statistical areas1, ranging rom 96% to 82%.
The statistical areas1 with the highest percentage
were Sutherland - Menai - Heathcote (NSW),
Wodonga - Alpine (Vic), Grampians (Vic), Strathpine
(Qld), Lower North (SA) and Weston Creek (ACT).
The statistical area1 with the lowest percentage was
Richmond Valley - Coastal (NSW).
The location o the statistical areas1 with the highest
and lowest percentages are shown on the maps.
There was large variation in the number o
children aged 1 year not ully immunised across
statistical areas1, ranging rom less than 25
children to around 270.
Percentages o children aged 1 year who are ully immunised by number not ully immunised 2 and
statistical area1, 2011–12
What does ully immunised at1 year mean?
Fully immunised at 1 year means
that a child aged 12 months to less
than 15 months received their third
vaccination or diphtheria, tetanus,
whooping cough and polio, and either
their second or third vaccination
(dependent on the type o vaccine
used) or hepatitis B and Haemophilus
infuenzae type b, all prior to the age o
1 year. It is assumed that all previous
vaccinations were received.
Sutherland - Menai - Heathcote (NSW), Wodonga - Alpine (Vic), Grampians (Vic), Strathpine (Qld), Lower North (SA) and Weston Creek (ACT)
Richmond Valley - Coastal (NSW)
Number not
ully immunised
∙∙∙ 93 up to 95%
∙∙∙ 90 up to 93%
95 to 100%
90 up to 95%
85 up to 90%80 up to 85%
75 up to 80%
Percentage
ully immunised
≤ 25
50
100
200300
400
Each dot represents one SA3.
The colour o the dot
represents the % o children
ully immunised.
The size o the dot representsthe number o children not ully
immunised.
98%
96%
94%
92%
90%
88%
86%
84%
82%
80%
78%

7/28/2019 Healthy Communities: Immunisation rates for children in 2011–12
http://slidepdf.com/reader/full/healthy-communities-immunisation-rates-for-children-in-201112 41/56
30National Health Performance Authority Healthy Communities: Immunisation rates for children in 2011–12www.nhpa.gov.au
Aged 1 yearChildren fully immunised
Percentages o children aged 1 year ully immunised, by statistical area, 2011–12
Percentages and numbers o children aged 1 year ully
immunised2, 2011–12
Children
in group3
Fully
immunised
Not ully
immunised
Not published3
Total 297,338 272,978 24,360
1. For more inormation about SA3s see Australian Bureau o Statistics (2010) Australian Statistical Geography Standard (ASGS): Volume 1 – Main
Structure and Greater Capital Cities Statistical Areas, July 2011. www.abs.gov.au Accessed 26/02/2013.
2. Figures are rounded - see Healthy Communities: Immunisation rates or children in 2011–12, Technical Supplement www.nhpa.gov.au3. SA3 data exclude a number o invalid and unallocated postcodes, and SA3s with less than 26 registered children in the age group are not reported. For
more inormation see Healthy Communities: Immunisation rates or children in 2011–12, Technical Supplement www.nhpa.gov.au
4. Interpret with caution as the eligible population is between 26 and 100 children so small data errors can aect results.
Source: Department o Human Services, Australian Childhood Immunisation Register statistics 2011–12, data supplied 14/01/2013.
95 to 100%
93 up to 95%
90 up to 93%
85 up to 90%
80 up to 85%
75 up to 80% L o w e s t
g r o u p
H i g h e s t
g r o u p
Postcode-level data available
at www.nhpa.gov.au
15,350
254,335
25,228
844
1,581
14,598
234,078
22,203
696
1,403
752
20,257
3,025
148
178
Medicare Local catchment boundary
ABS Statistical Area Level 3
(SA3) boundary
Highest % ully immunised
Lowest % ully immunised
Interpret with caution4
Richmond Valley -Coastal
Lower North
Grampians Wodonga - Alpine
Statistical Area Level 3 and
postcode-level data available atwww.nhpa.gov.au

7/28/2019 Healthy Communities: Immunisation rates for children in 2011–12
http://slidepdf.com/reader/full/healthy-communities-immunisation-rates-for-children-in-201112 42/56
31 National Health Performance AuthorityHealthy Communities: Immunisation rates for children in 2011–12 www.nhpa.gov.au
Percentages o children aged
1 year ully immunised1, by
statistical area2, 2011–12
Children aged 1 year who were ully
immunised, by statistical area, 2011–12 Variation within Medicare Local catchments
Not published3
95 to 100%
93 up to 95%
90 up to 93%
85 up to 90%
80 up to 85%
75 up to 80% L o w e s t
g r o u p
H i g h e s t
g r o u p
i. Greater Perth
ii. Greater Adelaide iii. Greater Melbourne
Medicare Local catchment
boundary
ABS Statistical Area Level 3
(SA3) boundary
Highest % ully immunised
Lowest % ully immunised
Interpret with caution4
PERTH
ROCKINGHAM
MANDURAH
i.
ii.iii.
iv.
v.
vi.
viii.
vii.
MELBOURNE
GEELONG
ADELAIDE

7/28/2019 Healthy Communities: Immunisation rates for children in 2011–12
http://slidepdf.com/reader/full/healthy-communities-immunisation-rates-for-children-in-201112 43/56
32National Health Performance Authority Healthy Communities: Immunisation rates for children in 2011–12www.nhpa.gov.au
Aged 1 yearChildren fully immunised
1. Figures are rounded - see Healthy Communities: Immunisation rates or children in 2011–12, Technical Supplement www.nhpa.gov.au
2. For more inormation about SA3s see Australian Bureau o Statistics (2010) Australian Statistical Geography Standard (ASGS): Volume 1 – Main
Structure and Greater Capital Cities Statistical Areas, July 2011. www.abs.gov.au Accessed 26/02/2013.3. SA3s with less than 26 registered children in the age group are not reported. For more inormation see Healthy Communities: Immunisation rates or
children in 2011–12, Technical Supplement www.nhpa.gov.au
4. Interpret with caution as the eligible population is between 26 and 100 children so small data errors can aect results.
Source: Department o Human Services, Australian Childhood Immunisation Register statistics 2011–12, data supplied 14/01/2013.
iv. ACT v. Greater Sydney
vi. Greater Brisbane
viii. Greater Hobartvii. Greater Darwin
HOBART
BRISBANE
GOLD
COAST
SUNSHINE
COAST
CANBERRA
NEWCASTLE
SYDNEY
WOLLONGONG
DARWIN
WestonCreek
Strathpine
Sutherland- Menai -
Heathcote
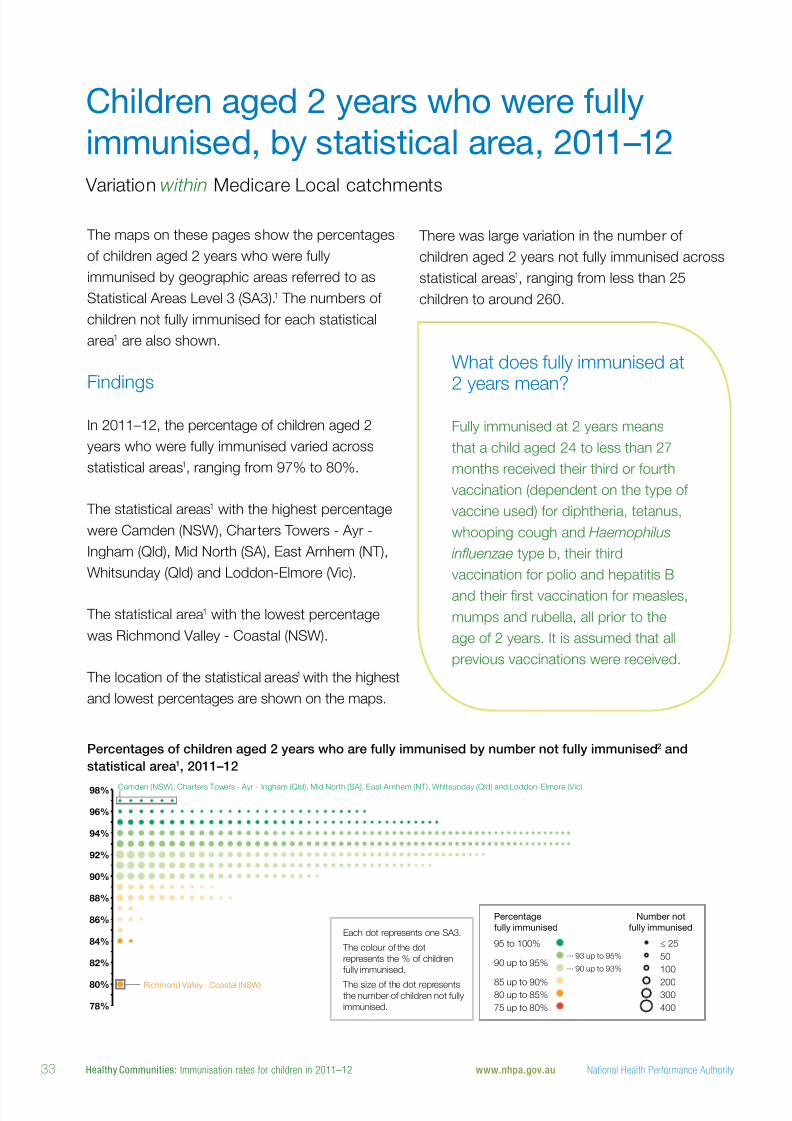
7/28/2019 Healthy Communities: Immunisation rates for children in 2011–12
http://slidepdf.com/reader/full/healthy-communities-immunisation-rates-for-children-in-201112 44/56
33 National Health Performance AuthorityHealthy Communities: Immunisation rates for children in 2011–12 www.nhpa.gov.au
Children aged 2 years who were ully
immunised, by statistical area, 2011–12 Variation within Medicare Local catchments
The maps on these pages show the percentages
o children aged 2 years who were ully
immunised by geographic areas reerred to as
Statistical Areas Level 3 (SA3).1 The numbers o
children not ully immunised or each statistical
area1 are also shown.
Findings
In 2011–12, the percentage o children aged 2
years who were ully immunised varied across
statistical areas1, ranging rom 97% to 80%.
The statistical areas1 with the highest percentage
were Camden (NSW), Charters Towers - Ayr -
Ingham (Qld), Mid North (SA), East Arnhem (NT),
Whitsunday (Qld) and Loddon-Elmore (Vic).
The statistical area1 with the lowest percentage
was Richmond Valley - Coastal (NSW).
The location o the statistical areas1 with the highest
and lowest percentages are shown on the maps.
Percentages o children aged 2 years who are ully immunised by number not ully immunised 2 and
statistical area1, 2011–12
What does ully immunised at
2 years mean?
Fully immunised at 2 years means
that a child aged 24 to less than 27
months received their third or ourth
vaccination (dependent on the type o
vaccine used) or diphtheria, tetanus,
whooping cough and Haemophilus
infuenzae type b, their third
vaccination or polio and hepatitis B
and their rst vaccination or measles,
mumps and rubella, all prior to the
age o 2 years. It is assumed that all
previous vaccinations were received.
Camden (NSW), Charters Towers - Ayr - Ingham (Qld), Mid North (SA), East Arnhem (NT), Whitsunday (Qld) and Loddon-Elmore (Vic)
Richmond Valley - Coastal (NSW)
There was large variation in the number o
children aged 2 years not ully immunised across
statistical areas1, ranging rom less than 25
children to around 260.
Number not
ully immunised
∙∙∙ 93 up to 95%
∙∙∙ 90 up to 93%
95 to 100%
90 up to 95%
85 up to 90%80 up to 85%
75 up to 80%
Percentage
ully immunised
≤ 25
50
100
200300
400
Each dot represents one SA3.
The colour o the dot
represents the % o children
ully immunised.
The size o the dot representsthe number o children not ully
immunised.
98%
96%
94%
92%
90%
88%
86%
84%
82%
80%
78%

7/28/2019 Healthy Communities: Immunisation rates for children in 2011–12
http://slidepdf.com/reader/full/healthy-communities-immunisation-rates-for-children-in-201112 45/56
34National Health Performance Authority Healthy Communities: Immunisation rates for children in 2011–12www.nhpa.gov.au
Aged 2 yearsChildren fully immunised
Percentages o children aged 2 years ully immunised, by statistical area, 2011–12
Percentages and numbers o children aged 2 years ully
immunised2, 2011–12
51,631
228,182
18,401
1,852
1,618
49,235
210,934
16,226
1,525
1,428
2,396
17,248
2,175
327
190
Children
in group3
Fully
immunised
Not ully
immunised
Postcode-level data available
at www.nhpa.gov.au
Not published3
95 to 100%
93 up to 95%
90 up to 93%
85 up to 90%
80 up to 85%
75 up to 80% L o w e s t
g r o u p
H i g h e s t
g r o u p
Medicare Local catchment boundary
ABS Statistical Area Level 3
(SA3) boundary
Highest % ully immunised
Lowest % ully immunised
Interpret with caution4
1. For more inormation about SA3s see Australian Bureau o Statistics (2010) Australian Statistical Geography Standard (ASGS): Volume 1 – Main
Structure and Greater Capital Cities Statistical Areas, July 2011. www.abs.gov.au Accessed 26/02/2013.
2. Figures are rounded - see Healthy Communities: Immunisation rates or children in 2011–12, Technical Supplement www.nhpa.gov.au3. SA3 data exclude a number o invalid and unallocated postcodes, and SA3s with less than 26 registered children in the age group are not reported. For
more inormation see Healthy Communities: Immunisation rates or children in 2011–12, Technical Supplement www.nhpa.gov.au
4. Interpret with caution as the eligible population is between 26 and 100 children so small data errors can aect results.
Source: Department o Human Services, Australian Childhood Immunisation Register statistics 2011–12, data supplied 14/01/2013.
Total 301,683 279,349 22,334
Richmond Valley -Coastal
East Arnhem
Whitsunday
Mid North
Loddon - Elmore
Charters Towers - Ayr - Ingham
Statistical Area Level 3 and
postcode-level data available atwww.nhpa.gov.au

7/28/2019 Healthy Communities: Immunisation rates for children in 2011–12
http://slidepdf.com/reader/full/healthy-communities-immunisation-rates-for-children-in-201112 46/56
35 National Health Performance AuthorityHealthy Communities: Immunisation rates for children in 2011–12 www.nhpa.gov.au
Percentages o children aged
2 years ully immunised1, by
statistical area2, 2011–12
Children aged 2 years who were ully
immunised, by statistical area, 2011–12 Variation within Medicare Local catchments
Not published3
95 to 100%
93 up to 95%
90 up to 93%
85 up to 90%
80 up to 85%
75 up to 80% L o w e s t
g r o u p
H i g h e s t
g r o u p
i. Greater Perth
ii. Greater Adelaide iii. Greater Melbourne
Medicare Local catchment
boundary
ABS Statistical Area Level 3
(SA3) boundary
Highest % ully immunised
Lowest % ully immunised
Interpret with caution4
PERTH
ROCKINGHAM
MANDURAH
i.
ii.iii.
iv.
v.
vi.
viii.
vii.
MELBOURNE
GEELONG
ADELAIDE

7/28/2019 Healthy Communities: Immunisation rates for children in 2011–12
http://slidepdf.com/reader/full/healthy-communities-immunisation-rates-for-children-in-201112 47/56
36National Health Performance Authority Healthy Communities: Immunisation rates for children in 2011–12www.nhpa.gov.au
Aged 2 yearsChildren fully immunised
iv. ACT v. Greater Sydney
vi. Greater Brisbane
viii. Greater Hobartvii. Greater Darwin
1. Figures are rounded - see Healthy Communities: Immunisation rates or children in 2011–12, Technical Supplement www.nhpa.gov.au
2. For more inormation about SA3s see Australian Bureau o Statistics (2010) Australian Statistical Geography Standard (ASGS): Volume 1 – Main
Structure and Greater Capital Cities Statistical Areas, July 2011. www.abs.gov.au Accessed 26/02/2013.3. SA3s with less than 26 registered children in the age group are not reported. For more inormation see Healthy Communities: Immunisation rates or
children in 2011–12, Technical Supplement www.nhpa.gov.au
4. Interpret with caution as the eligible population is between 26 and 100 children so small data errors can aect results.
Source: Department o Human Services, Australian Childhood Immunisation Register statistics 2011–12, data supplied 14/01/2013.
HOBART
BRISBANE
GOLD
COAST
SUNSHINE
COAST
CANBERRA
NEWCASTLE
SYDNEY
WOLLONGONG
DARWIN
Camden

7/28/2019 Healthy Communities: Immunisation rates for children in 2011–12
http://slidepdf.com/reader/full/healthy-communities-immunisation-rates-for-children-in-201112 48/56
37 National Health Performance AuthorityHealthy Communities: Immunisation rates for children in 2011–12 www.nhpa.gov.au
Children aged 5 years who were ully
immunised, by statistical area, 2011–12 Variation within Medicare Local catchments
The maps on these pages show the percentages
o children aged 5 years who were ully immunised
by geographic areas reerred to as Statistical Areas
Level 3 (SA3)1. The numbers o children not ully
immunised or each statistical area1 are
also shown.
Findings
In 2011–12, the percentages o children aged 5
years who were ully immunised varied across
statistical areas1, ranging rom 96% to 79%.
The statistical areas1 with the highest percentage
were Maitland (NSW) and Yorke Peninsula (SA).
The statistical areas1 with the lowest percentage
were Richmond Valley - Coastal (NSW) and
Adelaide City (SA).
The location o the statistical areas1 with the highest
and lowest percentages are shown on the maps.
What does ully immunised at5 years mean?
Fully immunised at 5 years means
that a child aged 60 to less than 63
months received their ourth or th
vaccination (dependent on the type o
vaccine used) or diphtheria, tetanus
and whooping cough, their ourth
vaccination or polio and their second
vaccination or measles mumps and
rubella, all prior to the age o 5 years.
It is assumed that all previous
vaccinations were received.
Maitland (NSW), Yorke Peninsula (SA)
Richmond Valley - Coastal (NSW),
Adelaide City (SA)
There was large variation in the number o
children aged 5 years not ully immunised across
statistical areas1, ranging rom less than 25
children to around 360.
98%
96%
94%
92%
90%
88%
86%
84%
82%
80%
78%
Number not
ully immunised
∙∙∙ 93 up to 95%
∙∙∙ 90 up to 93%
95 to 100%
90 up to 95%
85 up to 90%80 up to 85%
75 up to 80%
Percentage
ully immunised
≤ 25
50
100
200300
400
Each dot represents one SA3.
The colour o the dot
represents the % o children
ully immunised.
The size o the dot representsthe number o children not ully
immunised.
Percentages o children aged 5 years who are ully immunised by number not ully immunised 2 and
statistical area1, 2011–12
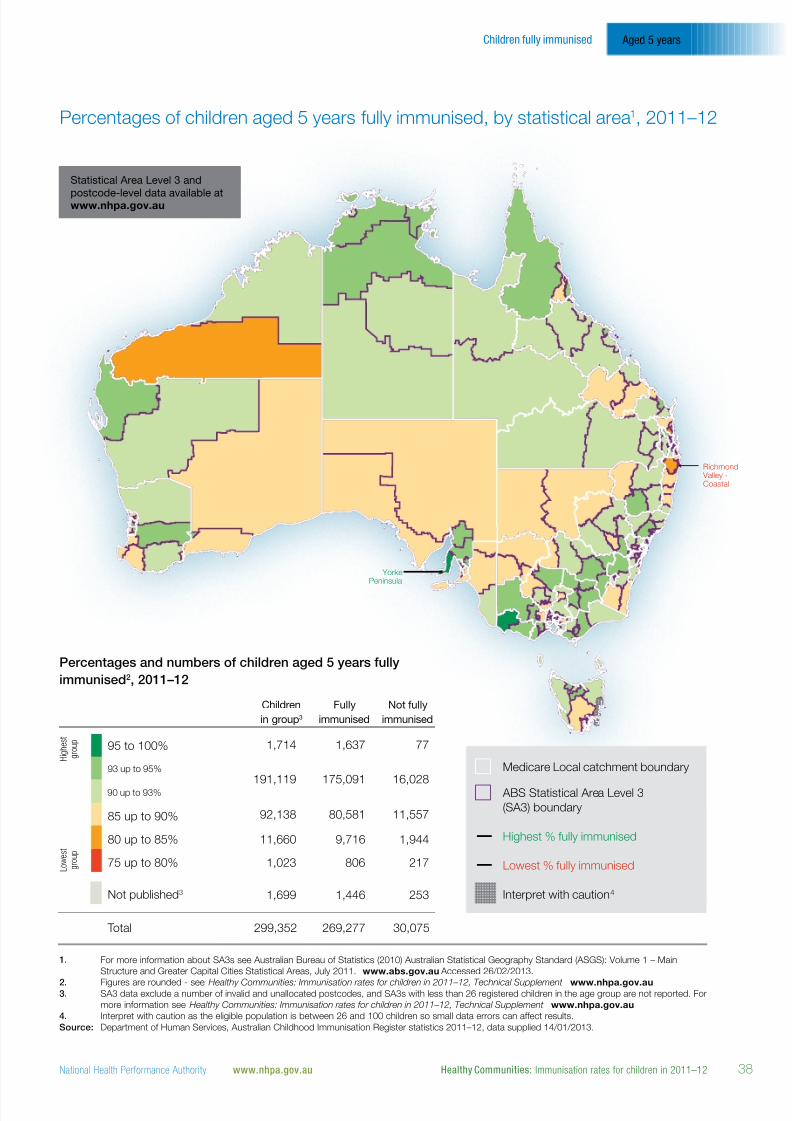
7/28/2019 Healthy Communities: Immunisation rates for children in 2011–12
http://slidepdf.com/reader/full/healthy-communities-immunisation-rates-for-children-in-201112 49/56
38National Health Performance Authority Healthy Communities: Immunisation rates for children in 2011–12www.nhpa.gov.au
Aged 5 yearsChildren fully immunised
Percentages o children aged 5 years ully immunised, by statistical area1, 2011–12
Percentages and numbers o children aged 5 years ully
immunised2, 2011–12
1,714
191,119
92,138
11,660
1,023
1,699
1,637
175,091
80,581
9,716
806
1,446
77
16,028
11,557
1,944
217
253
Children
in group3
Fully
immunised
Not ully
immunised
Postcode-level data available
at www.nhpa.gov.au
Not published3
95 to 100%
93 up to 95%
90 up to 93%
85 up to 90%
80 up to 85%
75 up to 80% L o w e s t
g r o u p
H i g h e s t
g r o u p
1. For more inormation about SA3s see Australian Bureau o Statistics (2010) Australian Statistical Geography Standard (ASGS): Volume 1 – Main
Structure and Greater Capital Cities Statistical Areas, July 2011. www.abs.gov.au Accessed 26/02/2013.
2. Figures are rounded - see Healthy Communities: Immunisation rates or children in 2011–12, Technical Supplement www.nhpa.gov.au3. SA3 data exclude a number o invalid and unallocated postcodes, and SA3s with less than 26 registered children in the age group are not reported. For
more inormation see Healthy Communities: Immunisation rates or children in 2011–12, Technical Supplement www.nhpa.gov.au
4. Interpret with caution as the eligible population is between 26 and 100 children so small data errors can aect results.
Source: Department o Human Services, Australian Childhood Immunisation Register statistics 2011–12, data supplied 14/01/2013.
Total 299,352 269,277 30,075
Medicare Local catchment boundary
ABS Statistical Area Level 3
(SA3) boundary
Highest % ully immunised
Lowest % ully immunised
Interpret with caution4
Richmond Valley -Coastal
YorkePeninsula
Statistical Area Level 3 and
postcode-level data available atwww.nhpa.gov.au

7/28/2019 Healthy Communities: Immunisation rates for children in 2011–12
http://slidepdf.com/reader/full/healthy-communities-immunisation-rates-for-children-in-201112 50/56
39 National Health Performance AuthorityHealthy Communities: Immunisation rates for children in 2011–12 www.nhpa.gov.au
Percentages o children aged
5 years ully immunised1, by
statistical area2, 2011–12
Children aged 5 years who were ully
immunised, by statistical area, 2011–12 Variation within Medicare Local catchments
Not published3
95 to 100%
93 up to 95%
90 up to 93%
85 up to 90%
80 up to 85%
75 up to 80% L o w e s t
g r o u p
H i g h e s t
g r o u p
i. Greater Perth
ii. Greater Adelaide iii. Greater Melbourne
Medicare Local catchment
boundary
ABS Statistical Area Level 3
(SA3) boundary
Highest % ully immunised
Lowest % ully immunised
Interpret with caution4
PERTH
ROCKINGHAM
MANDURAH
i.
ii.iii.
iv.
v.
vi.
viii.
vii.
MELBOURNE
GEELONG
ADELAIDE AdelaideCity
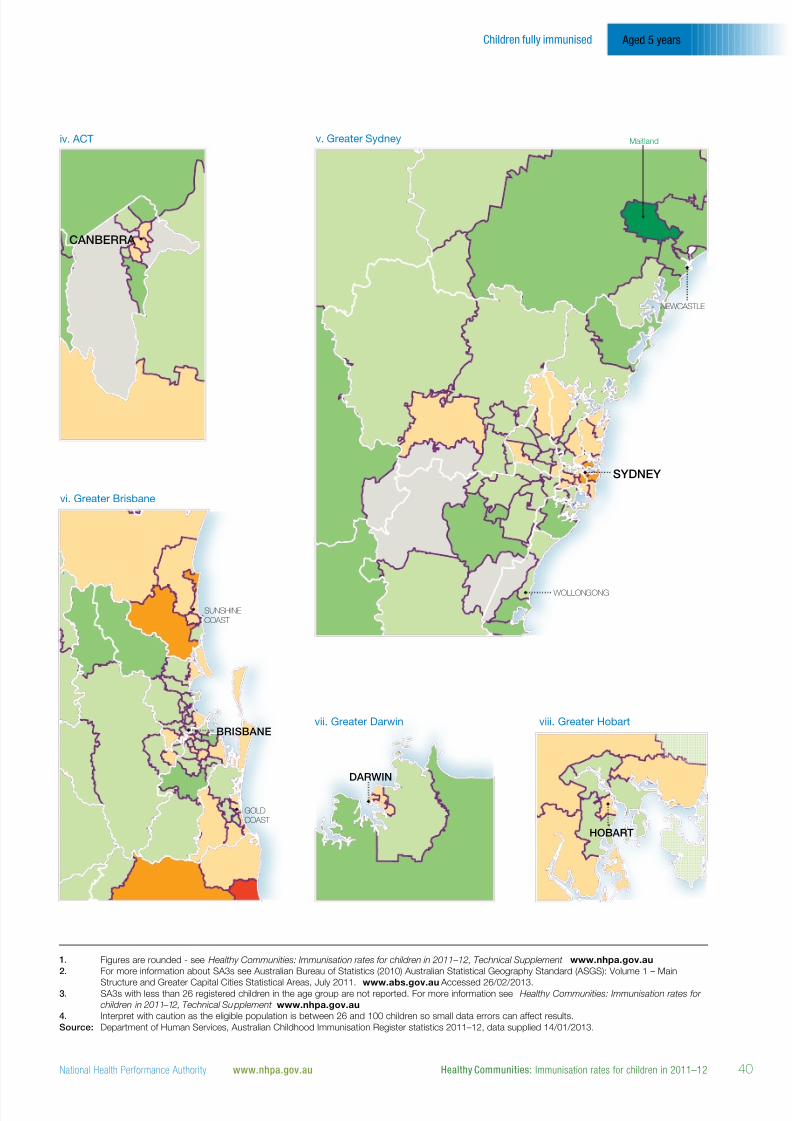
7/28/2019 Healthy Communities: Immunisation rates for children in 2011–12
http://slidepdf.com/reader/full/healthy-communities-immunisation-rates-for-children-in-201112 51/56
40National Health Performance Authority Healthy Communities: Immunisation rates for children in 2011–12www.nhpa.gov.au
Aged 5 yearsChildren fully immunised
1. Figures are rounded - see Healthy Communities: Immunisation rates or children in 2011–12, Technical Supplement www.nhpa.gov.au
2. For more inormation about SA3s see Australian Bureau o Statistics (2010) Australian Statistical Geography Standard (ASGS): Volume 1 – Main
Structure and Greater Capital Cities Statistical Areas, July 2011. www.abs.gov.au Accessed 26/02/2013.3. SA3s with less than 26 registered children in the age group are not reported. For more inormation see Healthy Communities: Immunisation rates or
children in 2011–12, Technical Supplement www.nhpa.gov.au
4. Interpret with caution as the eligible population is between 26 and 100 children so small data errors can aect results.
Source: Department o Human Services, Australian Childhood Immunisation Register statistics 2011–12, data supplied 14/01/2013.
iv. ACT v. Greater Sydney
vi. Greater Brisbane
viii. Greater Hobartvii. Greater Darwin
HOBART
BRISBANE
GOLD
COAST
SUNSHINE
COAST
CANBERRA
NEWCASTLE
SYDNEY
WOLLONGONG
DARWIN
Maitland

7/28/2019 Healthy Communities: Immunisation rates for children in 2011–12
http://slidepdf.com/reader/full/healthy-communities-immunisation-rates-for-children-in-201112 52/56
41 National Health Performance AuthorityHealthy Communities: Immunisation rates for children in 2011–12 www.nhpa.gov.au
Glossary
This glossary denes technical and medical terms used in this report. For more inormation, please see
Healthy Communities: Immunisation rates or children in 2011–12, Technical Supplement.
Diphtheria Diphtheria is an acute illness caused by the bacterium Corynebacterium
diphtheriae. Symptoms include severe infammation o the nose, throat and
windpipe leading to breathing and swallowing problems. Diphtheria can
cause nerve and heart damage, and result in death.
Fully immunised Fully immunised means received the scheduled vaccinations according
to age or hepatitis B (hepB); diphtheria, tetanus and whooping cough
(acellular pertussis) (DTPa); Haemophilus infuenzae type B (Hib);
poliomyelitis (inactivated poliomyelitis IPV); and measles, mumps and
rubella (MMR). See Healthy Communities: Immunisation rates or children
in 2011–12, Technical Supplement or more inormation.
German measles See rubella.
Haemophilus
infuenzae type B (Hib)
Haemophilus infuenzae type B is a bacterium that causes meningitis and
other serious inections in young children.
Hepatitis Hepatitis means infammation o the liver. The most common types o viral
hepatitis are hepatitis A, hepatitis B and hepatitis C.
Infection An inection occurs when bacteria or viruses enter the human body. I
the body cannot ght the inection, the person may get sick. Measles,
rubella, mumps, polio and hepatitis B are examples o inections caused by
viruses. Diphtheria, tetanus, pertussis and Hib are examples o inections
caused by bacteria.
Immunisation Immunisation means both receiving a vaccine and becoming immune to a
disease as a result o being vaccinated.
Measles Measles is a highly inectious disease caused by the Morbillivirus. Symptoms
include rash, ever cough, runny nose and infammation o the eye.
Medicare Local A Medicare Local is an organisation that has responsibil ity or the
provision, delivery and coordination o primary health care services in a
dened geographical area. There are 61 Medicare Locals across Australia.

7/28/2019 Healthy Communities: Immunisation rates for children in 2011–12
http://slidepdf.com/reader/full/healthy-communities-immunisation-rates-for-children-in-201112 53/56
42National Health Performance Authority Healthy Communities: Immunisation rates for children in 2011–12www.nhpa.gov.au
Medicare Local
catchment
A Medicare Local catchment is a population that lives in a specic
geographical area dened as a Medicare Local. See Medicare Local.
Meningitis See Haemophilus infuenzae type B (Hib).
Mumps Mumps is a salivary gland inection caused by the Rubulavirus. Symptoms
include swelling under the jaw, ever, headache and aching muscles.
National ImmunisationProgram Schedule
The schedule which describes the 16 vaccinations that are provided ree to Australians under childhood programs, school programs and programs or
special groups.
Pertussis See whooping cough.
Polio Polio, also known as poliomyelitis, is caused by a highly inectious virus.
Symptoms include headache, nausea and vomiting, tiredness, stiness
and muscle pain. Polio also causes paralysis and in some cases is atal.
Rubella Rubella, also known as German measles, is a viral illness that causes a
rash and joint pains.
Statistical area A statistical area or a Statistical Area Level 3 is a geographic area dened
by the Australian Bureau o Statistics (ABS) which has a population o
between 30,000 and 130,000 people. There are more than 300 Statistical
Areas Level 3 in Australia.
Tetanus Tetanus, also known as lockjaw, is a serious disease caused by the
bacterium Clostridium tetani . Caused by a toxin made by bacteria present
in soil, dust and manure, tetanus attacks the nervous system and causes
severe muscle spasms leading to breathing diculties, painul convulsions
and abnormal heart rhythms.
Vaccination Vaccination means having a vaccine – that is actually getting the injection.
Vaccine A product made rom whole, or extracts o, killed viruses or bacteria, or
rom live weakened strains o viruses or bacteria.
Whooping cough Whooping cough, also known as pertussis, is a serious, contagious
respiratory inection caused by the bacterium Bordetella pertussis.

7/28/2019 Healthy Communities: Immunisation rates for children in 2011–12
http://slidepdf.com/reader/full/healthy-communities-immunisation-rates-for-children-in-201112 54/56
43National Health Performance Authority Healthy Communities: Immunisation rates for children in 2011–12www.nhpa.gov.au
Acknowledgements
This report has beneted rom advice rom anumber o individuals and organisations with
interest and expertise in immunisation.
The National Health Perormance Authority
received advice rom its Immunisation Advisory
Group. The Advisory Group comprised:
• Proessor Peter McIntyre
- National Immunisation Committee
- Director, National Centre or ImmunisationResearch & Surveillance
- Proessor, Discipline o Paediatrics and
Child Health and School o Public Health,
University o Sydney
• Dr Aditi Dey
- National Centre or Immunisation Research
& Surveillance
•
Proessor Terry Nolan - Chair, Australian Technical Advisory Group
on Immunisation
- Head, Melbourne School o Population and
Global Health, University o Melbourne
• Ms Debra Petrys
- Consumer representative nominated to
bring a consumer perspective by the
Consumers Health Forum o Australia
• Ms Helen Moore
- National Immunisation Committee
- National Principal Adviser – Immunisation,
Australian Medicare Local Alliance
• Ms Karen Peterson
- National Immunisation Committee
- Immunisation Manager, Queensland Health
• Dr Michael Crampton- RACGP representative, National
Immunisation Committee
- General Practitioner, Clinical Director,
WentWest Ltd
• Mr Michael Frost
- Deputy Head o Secretariat, COAG
Reorm Council
The Authority also received advice rom
representatives o:
• the National Advisory Group on Aboriginal and
Torres Strait Islander Health Inormation Data
• the National Aboriginal and Torres Strait
Islander Health Standing Committee
• the National Aboriginal Community Controlled
Health Organisation.
This report relies on data provided by the
Australian Government Department o Health and
Ageing (DoHA) rom the Australian Childhood
Immunisation Register (ACIR). These data were
used to calculate the perormance measures
in this report. The Authority does a number o
checks to ensure data quality, and also relies on
the data quality work o DoHA and the Australian
Government Department o Human Services or
the ACIR.
Thanks are extended to all those who contributed.

7/28/2019 Healthy Communities: Immunisation rates for children in 2011–12
http://slidepdf.com/reader/full/healthy-communities-immunisation-rates-for-children-in-201112 55/56

7/28/2019 Healthy Communities: Immunisation rates for children in 2011–12
http://slidepdf.com/reader/full/healthy-communities-immunisation-rates-for-children-in-201112 56/56