healthy eating and obesity prevention. healthy eating focus area process local data expert input...
TRANSCRIPT

Healthy Eating and Obesity Prevention

Healthy Eating Focus Area Process
• Local data
• Expert input
• Best practices
Develop statement of
the issue
Determine what is known through scientific literature;Quantify the issue
Develop key messages and
recommendations
Develop action plan
Evaluate program or
policy
Adapted from “Evidence-Based Decision Making in Public Health, Public Health Management Practice, 1999.

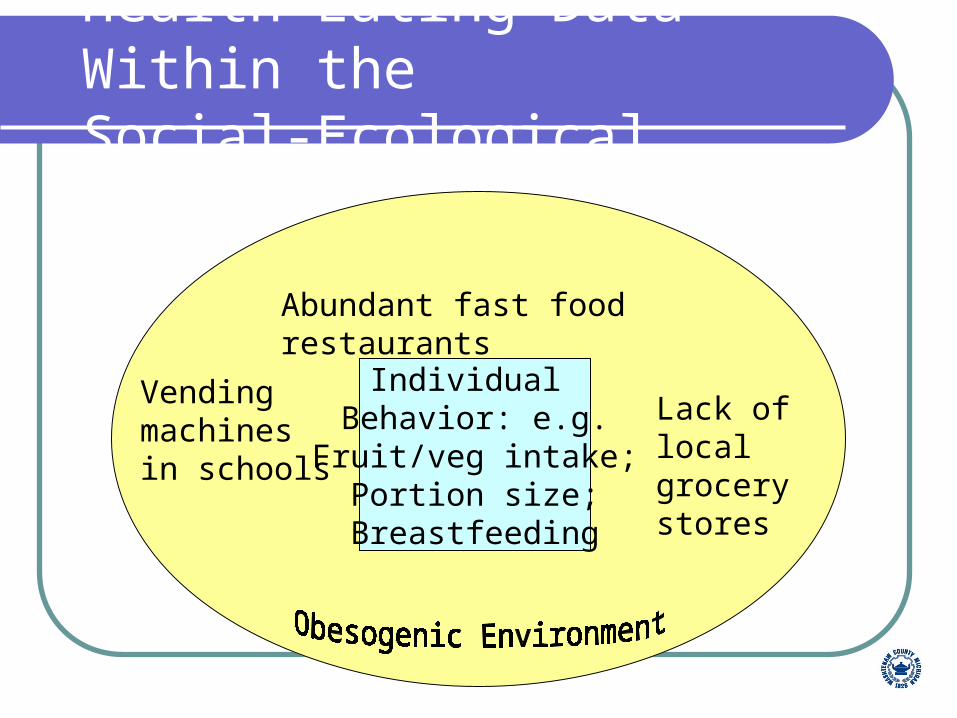
Health Eating Data Within the Social-Ecological Framework
Individual Behavior: e.g.
Fruit/veg intake;Portion size;
Breastfeeding
Abundant fast food restaurants
Vendingmachinesin schools
Lack of local grocery stores

Breastfeeding and Obesity Prevention
Breastfeeding is linked to decreased risk of obesity, possibly due to physiologic factors in human milk, feeding and parenting patterns associated with nursing.*
Breastfed infants are leaner at 1 year compared to formula-fed counterparts. Early growth pattern may influence later growth.**
•Prevention of Pediatric Overweight and Obesity, Policy Statement, American Academy of Pediatrics, Vol. 112, No. 2, Aug. 2003, pp. 424-430. www.aap.org/policy/s100029.html.
•Breastfeeding: HHS Blueprint for Action on Breastfeeding, Dept. of HHS, Office of Women’s Health, 2000.

Other Individual Behavior Trends
Portion sizes increasing TV watching (especially
by children) increasing “Convenience foods”
more available in supermarkets
Less cooking at home
The “Obesogenic” Environmentor ‘Supply Side of Consumption’ in Washtenaw County

The ‘Obesogenic’ Society Hunter/gatherers ate 75% nuts, vegs, fruits; 25% lean game We eat 17% fruits, vegs; 28% fatty meats; 55% carbos, sugars, etc We would need to slow jog for 6-8 miles every day to exercise as
hunter/gatherers Cheap, fast, low nutrition, high fat foods Convenient stores ‘Drive-Throughs’ – not much ‘healthy’ food eaten in the car? Perception of increased preparation time for fresh fruits and vegetables Decreased time available – e.g. Americans working more hours, more
single parent homes, etc.
The ‘Obesogenic’ Society Linkages between exposure to grocery stores and
restaurants and overweight have not been firmly established – but they’re coming…
Sensible, but need to be creative about interventions and approaches, evaluate well
Anxious to examine Community Prevention Guide recommendations regarding environmental approaches regarding overweight and healthy eating

Relevant Research Lower prevalence of supermarkets and higher prevalence of
independently owned grocery stores in low-wealth neighborhoods and greater proportion of households without access to private transportation*
Fruit and vegetable intake increases significantly for each additional supermarket in census tract**
Forty percent of American food budget spent on fast foods*** Low income communities have significantly fewer supermarkets
per capita than similar communities****
*Morland, K. et.al. “Neighborhood characteristics associated with the location of food stores and food service places.” AJPM.2002;22:23-29.
**Morland, K., et.al.“The Contextual Effect of the Local Food Environment on Residents’ Diets: The Atherosclerosis Risk in Communities Study.” AJPH. 2002;92:1761-1767.
***Dietz, W. “Obesity in Children” UM-SPH Presentation…
****Philadelphia Food Trust
*****University of California Cooperative Extension. July 2002

School Environment Trends
Local data based on Physical Activity and Healthy Eating Asset Survey, April 2003Questions based on CDC’s School Health Index for
Physical Activity & Healthy Eating53 of 114 schools in WC returned a survey (46%
response rate)

School Environment TrendsJunk food accessibility
Nationally 26.3% elementary, 62% Middle/JRHS, 94.9% HS (2001) students
have access to vending machines at school 26.8% elementary, 39.4% Middle/JRHS, 59.3% HS have school
store, canteen or snack bar
Washtenaw County 18% of elementary schools, 25% of middle schools, and 69% of
high schools allow the sale of junk foods at school 29% of schools have policies regarding availability of low fat foods
in school

School Environment Trends
CurriculumLocally, only 14% of schools teach all 18 healthy
eating curriculum topics recommended by the School Health Index
Milk ConsumptionNationally, student milk consumption has decreased
40% since 1977Locally, 91% of schools offer either low-fat or skim
milk in their school meals

02468
101214161820
Boys1977-78
Boys1994-96
Girls1977-78
Girls1994-96
ou
nce
s p
er d
ay
MilkSoft Drinks
Teens’ Consumption of Milk and Non-diet Soft Drinks (ages 12-19)

Teens’ Consumption of Milk and Non-diet Soft Drinks (ages 12-19)
02468
101214161820
Boys1977-78
Boys1994-96
Girls1977-78
Girls1994-96
ou
nce
s p
er d
ay
MilkSoft Drinks
90% girls, 70% boysfail to meet daily
calcium recommendation
Teens drink 2X as muchsoda as milk, providing
many with 15-20%of their calories
Teens average 1 glass milk per day

Common Messages Across Populations (1)Prepare more meals at home – more
cooking. Focus on what we are drinking
(sweetened beverages). Define what is a healthy beverage.
Promote community and school gardens
Common Messages Across Populations (2)
Increase fiber intake; more fruits and vegetables; support plant-based diet
Cut unnecessary sugar and fatDefine “healthy snacking” & replace junk
food snacking with healthy snackingGood dine out/fast food optionsPortion size *

Nutrition, Physical Activity, and Obesity Prevention Program
Kim Bandelier, MPH, RD/LDProgram Coordinator

Program Staff
Kim Bandelier, MPH, RD/LD Lesli Biediger, MPH, RD
Chronic Disease Nutrition Consultant Kristy Hansen, M.Ed., CHES
Physical Activity Coordinator Brett Spencer
Partnership Coordinator 8 Regional Nutritionists

Funding
CDC Cooperative Agreement (~$450,000)State Nutrition and Physical Activity
Programs to Prevent Obesity and Related Chronic Diseases
5 year award, currently starting year 3Capacity building level
State general revenue (~$800,000)

Caloric Balance
Breastfeeding Fruits and Vegetables
Reduced TV
Nutrition Physical Activity
Required Focus Areas

Strategic Plan for the Prevention of Obesity in Texas
Originally released in 2003 Currently revising to include
All age groups 5-year goals Breastfeeding and reducing TV viewing Specific strategies for communities
Final will be released on April 24, 2006 at Texas Public Health Association convention

Demonstration Communities Project
In 2004, 2 communities chosenCorpus Christi (urban) & Ft. Stockton (rural)
Collected baseline dataConducted visioning workshops and
stakeholder interviewsCompleted strategic/action planning
processCurrently implementing interventionsUT-Austin manages project

Corpus Christi, TX
CCAPWell (Coordinated Community Approach to Wellness) coalition2005 Summer Scorecard Program
~300 children IN MOTION End of Summer CelebrationNext interventions will be worksite wellness
and breastfeeding promotion

Ft. Stockton, TX
Ft. Stockton Lifestyle CoalitionHosted Family Play-Day on June 18, 2005Conducted worksite wellness pilot in Ft.
Stockton ISDFuture plans include continuing worksite
wellness with FISD, website development, and expanding physical activity programs for teens

Model for Dissemination
Skill-Building WorkshopsTeaching communities skills needed to
promote nutrition and physical activity through a community coalition or collaborative
Using lessons learned from demonstration communities
Regional Nutritionist hosting workshops for interested but not organized or newly organized community coalitions
Skill-Building Workshops
3 Pilot workshops conducted in 20045 workshops conducted in 2005
Partnership between NUPAOP and Goal A of the Texas Strategic Health Partnership
14 communities, 110+ attendees3 new coalitions formed2 existing coalitions trained

Future of Program
Increase CDC funding from Capacity Building to Basic Implementation