healthy eating in the west- follow-up evaluation:...
TRANSCRIPT

Healthy Eating in the West- Follow-up evaluation (City of Melton) 1
Healthy Eating in the West- Follow-up
evaluation: City of Melton
Report for VicHealth
March 2018

Prepared by Miranda Blake, Angela Ryan and Anna Peeters Deakin University, Geelong, Australia, Global Obesity Centre March 2018 Funded by VicHealth For further information regarding this report, contact Miranda Blake at [email protected]

Acknowledgements
Participants We would like to thank the interview and survey participants for their time. We would also particularly like to thank the dietitian at Wyndham City Council for her assistance in liaising with sites, assistance with data collection and valuable advice on the context of the project. Research group We would like to thank members of the Epidemiology Unit of the Global Obesity Centre at Deakin University for their support and assistance. In particular Tara Boelsen-Robinson who assisted in qualitative data analysis and Beth Gillham and Jacqui McCann who assisted in data collection and cleaning. Funding This project was initially funded through Wyndham City Council and Melton City Council, by the Victorian Government (Thrive program). This follow-up evaluation was funded by VicHealth. Additional support was provided by Deakin University and the National Health and Medical Research Council through support of Anna Peeters, and Miranda Blake, funded by an Australian Government Research Training Program Stipend.

Table of Contents
Acknowledgements ................................................................................................................................ iii
Executive summary ................................................................................................................................. v
Staff advice on implementation of Healthy Choices guidelines ........................................................... viii
Highlights ............................................................................................................................................... ix
Background ............................................................................................................................................. 1
The setting .......................................................................................................................................... 1
Methods .................................................................................................................................................. 2
Implementation and maintenance monitoring .................................................................................. 2
Sales data- health behaviour and business outcomes ........................................................................ 3
Customer surveys ................................................................................................................................ 3
Staff interviews ................................................................................................................................... 3
Results ..................................................................................................................................................... 4
Implementation and maintenance of drink availability targets ......................................................... 4
Changes in drink sales- health behaviour implications ....................................................................... 6
Changes in drink sales- business implications .................................................................................... 7
Customer surveys ................................................................................................................................ 8
Staff surveys and interviews ............................................................................................................. 12
Discussion and recommendations ........................................................................................................ 14
Recommendations to enable successful implementation of Healthy Choices guidelines ................ 15
References ............................................................................................................................................ 18
Appendix I: Drink trial details ................................................................................................................ 19
Appendix II: Detailed data analysis methods ........................................................................................ 20
Sales data analysis ............................................................................................................................. 20
Qualitative interviews ....................................................................................................................... 20
Appendix III: Customer survey questions ............................................................................................. 21
Appendix IV: Additional sales data analysis .......................................................................................... 25
Appendix V: Customer survey demographic results ............................................................................. 26
Appendix VI: De-identified stakeholder diagram ................................................................................. 27
Appendix VII: Recommendations from previous report ....................................................................... 28

Healthy Eating in the West- Follow-up evaluation (City of Melton) v
Executive summary
Background The Melton City Council has been working towards the Victorian Government’s Healthy Choices: policy guidelines for sport and recreation centres (HCGs) in council managed sports and recreation facilities and library sites, with a focus on healthy drinks. The HCGs require that 50% of food and drinks at on-site retail outlets are ‘green’ (best choice) with no more than 20% of available options from the ‘red’ (limit) category. ‘Amber’ (choose carefully) food and drinks may make up the difference. From September to December 2016, changes were implemented at the Caroline Springs (CS) Leisure Centre café, CS Library kiosk, and Melton Indoor Recreation Centre (MIRC) kiosk to:
remove less healthy milkshakes and introduce healthier smoothies, and
increase the proportion of fridge shelf-space for ‘green’ and ‘amber’ pre-packaged drinks and decrease shelf-space for ‘red’ drinks.
This report extends findings from a previous short-term evaluation of the initiative (Blake & Peeters, 2017). Evaluation at 12 months post-implementation provides the opportunity to assess project maintenance and to document factors that enable or inhibit sustainability. Aim To summarise key learnings from healthy drink changes across three Melton City Council sports and recreation centres and library sites, including long-term impact on healthiness of products sold, business outcomes and stakeholder and customer attitudes. Methods We used the Victorian Government’s Healthy Choices: food and drink classification guide to categorise drinks as ‘red’, ‘amber’ and ‘green’ and monitored availability of items in each category using photo audits five times between May 2016-September 2017. Audit sites varied over time. We analysed changes in drink sales before and after changes were implemented using itemized, weekly sales data from November 2015 to October 2017 (trial period September to December 2016, maintenance period January to October 2017). We evaluated customer and staff reactions through brief customer exit surveys (CS Library and CS Leisure Centre, September-October 2017) and semi-structured interviews with staff (n=6). Results Summary results are found in Table 1. Melton City Council sites have reduced the proportion of ‘red’ drinks on display and increased availability of ‘green’ drinks, demonstrating progress towards compliance with the HCGs. Due to perceived customer demand in CS Library, one healthy drink change (a switch from milkshakes to smoothies) was reversed in February 2017. During the initial drink trial period, there was a 65% decrease in sales of cold ‘red’ drinks, including milkshakes. After milkshakes were re-introduced, ‘red’ drink sales returned to pre-intervention levels. ‘Green’ drink sales, driven by bottled water, increased during the trial period and remained

Healthy Eating in the West- Follow-up evaluation (City of Melton) vi
high during the maintenance period. Total revenue from cold drinks declined by 26% by the end of the initial trial. At 12 months post implementation, revenue from cold drinks remained lower than that predicted if no changes to availability had occurred. 141 customer surveys were completed. The majority of participants indicated low levels of awareness of changes to the provision of drinks across the sites. A large majority of participants reported they were supportive of a healthy food and drink provision initiative within the environment of a sports and recreation centre and agreed that these centres have a responsibility to promote healthy eating. Key themes for successful implementation of a healthy food and drinks initiative identified through staff interviews included staff time and knowledge resources, supply of healthier alternatives, the importance of knowing your customer base, financial considerations, and initiative sustainability. Table 1: Summary of changes in drink availability and sales, and customer support for changes, Melton City Council, September 2016- October 2017
Melton sites+
Cold ‘red’ drink availability# 72% 47%
Cold ‘green’ drink availability# 19% 34%
Meeting Healthy Choices drink guidelines No
Cold ‘red’ drink volume sales* No change
Cold ‘amber’ and ‘green’ drink volume sales* 439% increase
Total cold drink volume sales (L)* 28% increase
Customer support for healthier food and drinks 83% support
# Change from before (September 2016) to after (September-October 2017) healthy drinks
changes (proportion of all cold drinks available)
* Change in sales from September 2016 to October 2017 compared to what would have
been predicted if healthy drinks changes had not occurred (adjusted for seasonal variation
and trends over time), data range November 2015 – October 2017
+ Average results at each time point from all three Melton sites (Caroline Springs Leisure
Centre, Caroline Springs Library, and Melton Indoor Recreation Centre)
Conclusion At Melton City Council sites, there have been sustained reductions in the availability of ‘red’ drinks from pre-implementation levels. Lower availability of ‘red’ drinks was associated with lower sales of ‘red’ drinks and increased sales of ‘green’ and ‘amber’ alternatives. There was an increase in volume of cold drinks sold but a decrease in revenue from cold drinks. This apparent contradiction is likely due to an increase in water purchases over time, which is high in volume (600 to 750mL per bottle), but sells at a lower unit price than most unhealthy alternatives. These results indicate that numerous factors influence the outcome of healthy drink provision changes.

Healthy Eating in the West- Follow-up evaluation (City of Melton) vii
Customer surveys suggest that overwhelmingly, customers are supportive of a change to healthier food and drink at sports and recreation centres, and report that these centres have a responsibility to promote healthy eating. Staff interviews revealed a contrasting concern that if popular unhealthy alternatives are removed customers may choose not to purchase from the cafés at all. However, staff viewed heathy food retail changes in community settings as part of long-term cultural changes needed to improve the health of the community. It will be critical to ensure a range of operational and policy strategies are in place to enable vibrant and viable healthy cafés and community centres into the future. Key recommendations to enable successful implementation of HCGs For the retailer
1. Ensure that implementing the HCGs is embedded as one part of a viable café strategy, including considering promotional material and ambience.
2. Explore strategies to source a wide variety of healthy alternatives, tailored to your customers.
3. Communicate success of implementation, outcomes and customer satisfaction across the organization, the local community and the state.
4. Continue to monitor profitability or revenue from different lines, to prioritise removal of less profitable unhealthy items and promote healthier choices which are more profitable.
For local government
5. Support the vision that implementing a healthier food supply at sports and recreation centres is a priority, through policy, finance, staffing and recognition.
6. Develop clear organisational guidance and leadership on the prioritisation, funding and support available for promotion of healthy eating at council sports and recreation sites.
7. Incorporate HCGs adoption or progress targets into local council plans (e.g. health and wellbeing and sport, recreation and leisure) to provide a platform for advocacy on healthy food supply and HCGs progress.
8. Embed HCGs in leasing/licensing arrangements with user groups and contracts with facility management organisations (e.g. YMCA).
For the researcher
9. Work closely with the retailer and management to embed an evaluation strategy with outcomes relevant to all stakeholders.

Healthy Eating in the West- Follow-up evaluation (City of Melton) viii
Staff advice on implementation of Healthy Choices guidelines
In the previous report we outlined key practical strategies discussed by staff that aided implementation of HCGs. Below we summarise strategic advice from staff to those planning implementation of similar initiatives (Figure 1).
Figure 1. Key practical strategies that enabled transition to healthier food and drink provision. HEAS, Healthy Eating Advisory Service.
Get key players on board early
Secure sign off from the top
Acknowledge time and resources
needed for change
Have infrastructure in
place
Tap into resources (e.g. HEAS)
Don't be affraid to negotiate with
suppliers
Engage customers early
Do it in stages
Monitor progressIdentify regular
reporting processes
Bring staff on the journey
Adapt as you go

Healthy Eating in the West- Follow-up evaluation (City of Melton) ix
Highlights
Healthier drink options
Sites increased the number of
‘green’ drinks available by 80% and
decreased ‘red’ drinks available by
35%.
More healthy drinks
purchased
An extra 1500L of healthier
‘green’ and ‘amber’ drinks were
purchased annually after
implementing Healthy Choices
guidelines.
Strong support from key
centre staff
Several challenges were overcome
through sustained commitment and
ongoing collaboration between staff.
Staff believed they could contribute to
a healthier community through the
initiative.
“If we can change one person’s
perception about that then we’re going
the right direction, aren’t we?”
- Senior staff member
Strong customer support
More than 80% of customers
surveyed were supportive of the
centre’s healthy eating initiative, and
believed that sport and recreation
centres are responsible for promoting
healthy eating.
“It makes sense. Sports centres should
work hand in hand with nutrition.”
- Customer

Healthy Eating in the West- Follow-up evaluation (City of Melton) 1
Background The Melton City Council sports and recreation centres have been working towards implementing the Victorian Government’s Healthy Choices: policy guidelines for sport and recreation centres (HCGs) in their sports and recreation facilities and library sites, with a focus on healthy drinks. This evaluation extends our previous evaluation (Blake & Peeters, 2017) of the implementation of healthy drinks changes in sports and recreation centres in the City of Wyndham and the City of Melton based on the HCGs. This current report has been written alongside a companion report (Blake et al, Healthy Eating in the West- Follow-up evaluation: Western Leisure Services, 2017). The HCGs aim to improve the availability and promotion of healthier foods and drinks in community settings by providing guidance on the types of products available for sale, and their pricing, promotion and placement in these settings. The HCGs set out a traffic light classification system for healthiness of foods and drinks based on their nutritional value (Department of Health & Human Services, 2015). These are ‘red’ (limit), ‘amber’ (choose carefully) and ‘green’ (best choices). The guidelines require that less than 20% of available foods and drinks are from the ‘red’ category, and greater than 50% are from the ‘green’ category. Awareness and acceptability of a healthy food and drink policy for customers is integral to the impact of the intervention on customer purchases, and retailer perspectives on the appropriateness and sustainability of the intervention (Gittelsohn et al., 2008; Gravlee, Boston, Mitchell, Schultz, & Betterley, 2014). To date, such investigations have also been limited (Boelsen-Robinson et al., 2017; Minaker et al., 2016; Olstad, Goonewardene, McCargar, & Raine, 2014). The initiative at City of Melton sites provides an opportunity to investigate the long-term economic and customer impact of such initiatives through a case study. Moreover, evaluating the initiative over a longer timespan provides the opportunity to assess the sustainability of the intervention, and to document factors that may enable or inhibit maintenance.
The setting Much of the background to this current report is detailed in the previous report (Blake & Peeters, 2017). In brief, in September 2016, Caroline Springs (CS) Leisure Centre (café in indoor high ball centre), CS Library (small kiosk), and Melton Indoor Recreation Centre (MIRC) (kiosk in indoor high ball centre) commenced a focused three month trial on improving the availability of healthy compared to unhealthy drinks (Appendix I). Implementation support was provided by a council-employed local dietitian with additional support from the Healthy Eating Advisory Service (HEAS) (a service supported by the Victorian government and delivered by Nutrition Australia Victorian Division). Following initial findings suggesting positive health behaviour effects, and neutral economic impact, though still facing challenges impairing maintenance, the council sought to embed the operational changes including by changing the drinks supplier. This case study seeks to evaluate the longer-term impact of this policy on the healthiness of customer purchases, revenue, staff psychosocial factors, as well as to examine customer acceptability for the first time.
Healthy Eating in the West- Follow-up evaluation (City of Melton) 2
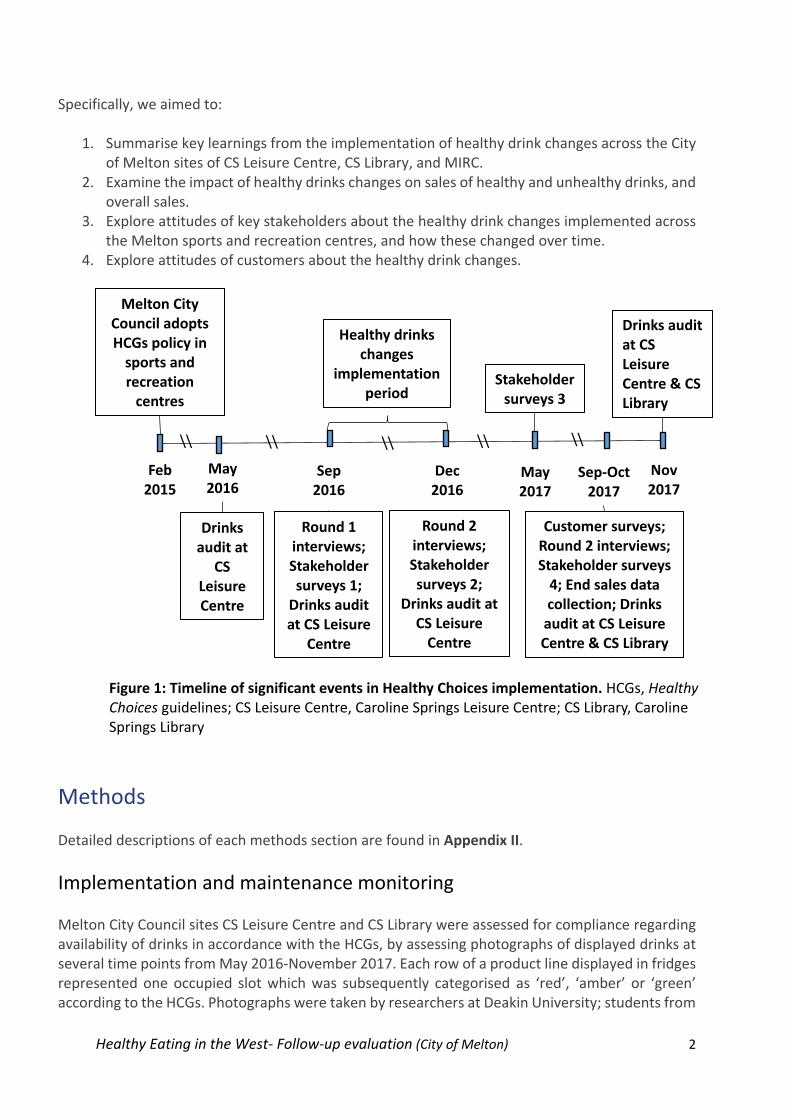
Specifically, we aimed to:
1. Summarise key learnings from the implementation of healthy drink changes across the City of Melton sites of CS Leisure Centre, CS Library, and MIRC.
2. Examine the impact of healthy drinks changes on sales of healthy and unhealthy drinks, and overall sales.
3. Explore attitudes of key stakeholders about the healthy drink changes implemented across the Melton sports and recreation centres, and how these changed over time.
4. Explore attitudes of customers about the healthy drink changes.
Methods Detailed descriptions of each methods section are found in Appendix II.
Implementation and maintenance monitoring Melton City Council sites CS Leisure Centre and CS Library were assessed for compliance regarding availability of drinks in accordance with the HCGs, by assessing photographs of displayed drinks at several time points from May 2016-November 2017. Each row of a product line displayed in fridges represented one occupied slot which was subsequently categorised as ‘red’, ‘amber’ or ‘green’ according to the HCGs. Photographs were taken by researchers at Deakin University; students from
Dec 2016
Healthy drinks changes
implementation period
Sep
2016
\\ \\
Nov
2017
\\
Sep-Oct 2017
Customer surveys; Round 2 interviews; Stakeholder surveys
4; End sales data collection; Drinks
audit at CS Leisure Centre & CS Library
Figure 1: Timeline of significant events in Healthy Choices implementation. HCGs, Healthy Choices guidelines; CS Leisure Centre, Caroline Springs Leisure Centre; CS Library, Caroline Springs Library
Feb 2015
Melton City Council adopts HCGs policy in
sports and recreation
centres
Round 1 interviews; Stakeholder surveys 1;
Drinks audit at CS Leisure
Centre
Round 2 interviews; Stakeholder surveys 2;
Drinks audit at CS Leisure
Centre
Drinks audit at
CS Leisure Centre
May
2016
Drinks audit at CS Leisure Centre & CS Library
\\
Stakeholder surveys 3
May 2017
\\

Healthy Eating in the West- Follow-up evaluation (City of Melton) 3
Monash University; as well as staff from the sites. These audits were conducted across five time points at CS Leisure Centre, and two time points at CS Library (Figure 1). The total proportion of each category of drink displayed was calculated by dividing the total number of spaces occupied by each ‘red’, ‘amber’ and ‘green’ item by the total number of occupied spaces on display. The HCGs stipulate that a minimum of 50% of total drinks available to customers (i.e. on display) come from the ‘green’ category, with no greater than 20% of ‘red’ drinks on display. Data from photograph audits at each site were entered into Microsoft Excel software and compared to the HCG benchmarks at each time point.
Sales data- health behaviour and business outcomes Sales data provided by the sites were examined for dollar sales (revenue), item and volume sales by total, ‘red’, ‘amber’ and ‘green’ drinks. Data were collected weekly from November 2015 (10 months prior to the drink trial) until October 2017, as available. The point of implementation was considered to be 19th September to 19th December 2016. Sales data were analysed to estimate the difference between the number/volume of items sold or dollar sales throughout the implementation and maintenance periods compared to what would have been expected if the changes had not occurred (the counterfactual or predicted amount) using ‘interrupted time series analysis’ (Linden, 2015).
Customer surveys Customer surveys were conducted over the end of the school period and beginning of school holiday period (September - October 2017) at CS Leisure Centre and CS Library, for two weekdays at each site during the main opening hours (1pm-5pm and 5pm-9pm respectively). We aimed to collect a total of 100 completed surveys per site, with 50 surveys targeted for each day of surveying. Ethics approval was granted to include participation of adolescents from 15 years and adults, and those who looked under 18 were asked to confirm their age prior to participation. Every second visitor was asked to participate in a quick 1-2 minute survey upon exiting, and responses were recorded on iPads using the QuickTap Survey application. Surveys consisted of 21 questions (see Appendix III) to determine visitors’ frequency and purpose of visits; food and drink purchasing patterns; socio-demographic information; awareness of, and attitude towards, the healthy drink changes; and the perceived role of sports and recreation centres in promoting healthy eating. Questions were developed collaboratively with catering managers at both sites. Survey data were exported into Microsoft Excel software and collated into spreadsheets for analysis. Responses were analysed using descriptive statistics.
Staff interviews Semi-structured qualitative interviews were conducted with a total of six staff across City of Melton and Western Leisure Services (n=6). Learnings from both organisations are considered together in this report. The interviews aimed to explore staff perceptions of the purpose, challenges and benefits of food and drink provision in community settings, and how these changed during the

Healthy Eating in the West- Follow-up evaluation (City of Melton) 4
implementation of a healthy food and drink policy. Staff included two sport and recreation centre managers, two council mangers, the dietitian responsible for implementation, and a food service manager. Interviews were conducted immediately prior to and immediately following the initial 12-week drink trial implementation period, and then 12 months after the beginning of the drink trial (3 months after full HCGs compliance was reached at Western Leisure Services). One staff member left the organisation between the second and third rounds of interviews and hence was not included at this last timepoint. Interviews were analysed using thematic analysis. In order to assist in quantifying perceptions of change, so that changes in attitudes could be more easily monitored over time, we conducted repeated quantitative surveys with staff who were interviewed. This was performed using the Commitment to Organisational Change scale (Herscovitch & Meyer, 2002) at intervals: immediately before, and 3, 9 and 12 months after beginning the drink trial. Ethical approval was granted for customer surveys and staff interviews by Deakin University.
Results
Implementation and maintenance of drink availability targets Photographic audits demonstrated reductions in the proportion of ‘red’ drinks and increases in the proportion of ‘green’ drinks displayed in occupied slots across CS Leisure Centre and CS Library, moving towards compliance with the HCGs (Figure 2 and Figure 3). From May 2016 to November 2017, CS Leisure Centre reduced the proportion of ‘red’ drinks from 72% of occupied spaces to 47%, and increased the proportion of ‘green’ drinks from 14% to 31% (Figure 2). Audits were conducted over a shorter time period of three months at CS Library, from September 2017 to November 2017 (Figure 3). This site showed a reduction in the proportion of ‘red’ drinks from 58% to 39%, and increased the proportion of ‘green’ drinks from 30% to 36%. The improvements in HCG compliance were despite the re-introduction of ‘red’ milkshakes at CS Library and CS Leisure Centre in February 2017, which occurred before the first audit timepoint.

Healthy Eating in the West- Follow-up evaluation (City of Melton) 5
Figure 2: Changes in proportion of ‘red’, ‘amber’ and ‘green’ cold drink availability over auditing period, and HCGs proportion requirements for compliance (Caroline Springs Leisure Centre), Melton, May 2016-November 2017. HCGs, Healthy Choices guidelines
Figure 3: Changes in proportion of ‘red’, ‘amber’ and ‘green’ cold drink availability over auditing period, and HCGs proportion requirements for compliance (Caroline Springs Library), Melton, September 2016-November 2017. HCGs, Healthy Choices guidelines
0%
20%
40%
60%
80%
100%
May-16 Sep-16 Dec-16 May-17 Nov-17 Compliancewith HCGs
Pro
po
rtio
n o
f 'r
ed
', 'a
mb
er'
an
d 'g
ree
n'
cold
dri
nks
in o
ccu
pie
d s
lots
(%
)
Caroline Springs Leisure Centre audit dates
'Red' 'Amber' 'Green'
0%
20%
40%
60%
80%
100%
Sep-17 Nov-17 Compliance with HCGsPro
po
rtio
n o
f 'r
ed
', 'a
mb
er'
an
d
'gre
en
' co
ld d
rin
ks in
occ
up
ied
slo
ts
(%)
Caroline Springs Library audit dates
'Red' 'Amber' 'Green'

Healthy Eating in the West- Follow-up evaluation (City of Melton) 6
Both CS Leisure Centre and CS Library have made reductions in the proportion of ‘red’ drinks on display and increased ‘green’ drinks, demonstrating that these sites are making progress towards becoming compliant with the Healthy Choices guidelines. Due to perceived customer demand in CS Library, one of the healthy drink changes (removal of ‘red’ milkshakes) was reversed.
Changes in drink sales- health behaviour implications
Figure 4: Weekly volume sales of cold drinks before, during, after drink trial (3 Melton sites), adjusted for seasonal variation. Analysis of sales data revealed trends in sales before, during trial, and during maintenance period (Figure 4). As noted in the previous report, before the trial, there was an overall downward trend in drink sales across the three sites, driven by decreases at MIRC and CS Leisure Centre. During the trial there was a significant 60% drop in sales of cold ‘red’ drinks and a 130% increase in ‘amber’ and ‘green’ drink volume sales, compared to predicted sales. During the maintenance period, sales of ‘red’ increased such that sales were similar to predicted pre-trial trends. ‘Amber’ and ‘green’ cold drink sales increased by 490% compared to pre-trial trends. The very high increase for these products is partly due to the low absolute numbers sold prior the drinks changes and the strong overall prior downward trend in sales. Sales were also examined without regular soft drinks (‘red’), and diet soft drinks (‘amber’) which were recorded as the same item prior to the drinks trial. Sales were similar when examined without soft drinks (Appendix IV, Figure S1).
0
20
40
60
80
100
120
140
160
No
v-1
5
Dec
-15
Jan
-16
Feb
-16
Mar
-16
Ap
r-1
6
May
-16
Jun
-16
Jul-
16
Au
g-1
6
Sep
-16
Oct
-16
No
v-1
6
Dec
-16
Jan
-17
Feb
-17
Mar
-17
Ap
r-1
7
May
-17
Jun
-17
Jul-
17
Au
g-1
7
Sep
-17
Oct
-17
Vo
lum
e s
old
pe
r w
ee
k (L
)
Cold 'amber' and 'green' beverages (fitted)Cold 'amber' and 'green' beverages (predicted)Cold 'red' beverages (fitted)Cold 'red' beverages (predicted)
Healthy drinks
implementation period

Healthy Eating in the West- Follow-up evaluation (City of Melton) 7
Sales of key products were examined further including smoothies (introduced at beginning of trial), milkshakes (removed from sale for initial trial period and reintroduced during maintenance phase), and water (which comprised the majority of ‘green’ cold drink sales in all time periods) (Figure 5). Bottled water sales increased during the trial and maintenance periods by 61% and 210%, respectively, compared to predicted trends. Milkshake sales decreased during trial to no sales by the end of the trial period, but increased to pre-intervention trends during maintenance period after re-introduction. Conversely, smoothie sales were relatively steady during trial period, but decreased during maintenance period after milkshake re-introduction. Predicted sales of smoothies cannot be calculated as smoothies were introduced for sale in September 2016 (beginning of initial trial period).
Figure 5: Weekly volume sales of milkshake, smoothies and water before, during, after drink trial (3 Melton sites), adjusted for seasonal variation. Predicted sales of smoothies not shown as smoothies were introduced for sale in September 2016 (beginning of initial trial period). During the initial drink trial period, there was a 65% decrease in sales of cold ‘red’ drinks, including milkshakes. After re-introduction of the milkshakes, ‘red’ drink sales returned to pre-intervention levels. ‘Green’ and ‘amber’ drink sales, driven by bottled water sales, increased during trial and remained high during maintenance period.
Changes in drink sales- business implications
0
10
20
30
40
50
60
70
No
v-1
5
Dec
-15
Jan
-16
Feb
-16
Mar
-16
Ap
r-1
6
May
-16
Jun
-16
Jul-
16
Au
g-1
6
Sep
-16
Oct
-16
No
v-1
6
Dec
-16
Jan
-17
Feb
-17
Mar
-17
Ap
r-1
7
May
-17
Jun
-17
Vo
lum
e s
old
pe
r w
ee
k (L
)
Milkshakes (fitted) Milkshakes (predicted)
Water (fitted) Water (predicted)
Smoothies (fitted)
Healthy drinks
implementation period

Healthy Eating in the West- Follow-up evaluation (City of Melton) 8
Cold drink revenue declined by 26% by the end of the initial trial, and remained lower that predicted 12 months post initial implementation compared to what would have been expected if there was no trial (Figure 6). While, there is an apparent contradiction in the results from decreased revenue and increased volume sold, there was an increase in proportion of purchases for water over time, which is high in volume (600 to 750mL per bottle), but sells at a lower unit price than most unhealthy alternatives. Due to small sample sizes, statistical analysis could not be performed for individual sites, but it should be noted that there was a lot of variation in total drink volume sales between and within sites. Revenue declines may also be related to changes in site opening hours or attendance, as well as changes in purchases per customer. No attendance data was available for sites.
Figure 6: Weekly revenue before, during, after drink trial (3 Melton sites), adjusted for seasonal variation Cold drink revenue declined by 26% by the end of the initial trial, and remained lower than predicted 12 months post initial implementation.
Customer surveys Researchers collected a total of 141 survey responses across both sites. 85 surveys were completed at CS Library over the intended two-day period, while 56 were completed at CS Leisure Centre over an extended period of four days, due to lower attendance numbers. At CS Library, 48% of respondents were female; 49% reported ages between 15 and 17 years; and 52% had been visiting the site for two years or more. At CS Leisure Centre, 73% of respondents were female; 50% reported ages between 35 and 54 years; and 64% had been visiting the site for two years or more. Full socio-demographic information of participants is presented in Appendix V, Table S1.
0
500
1000
1500
2000
2500
3000
3500
4000
Rev
en
ue
pe
r w
ee
k ($
)
Cold beverage revenue (fitted) Cold beverage revenue (predicted)
Healthy drinks implementation
period

Healthy Eating in the West- Follow-up evaluation (City of Melton) 9
Participants were asked about their food and drink consumption at the site on the day they were surveyed (Figure 7). At CS Library, 32% consumed food which was mostly brought in from outside the site; and 53% consumed one or more drinks whilst at the site, of which a third was purchased at the site. At CS Leisure Centre, 68% consumed food which was purchased solely from the site; and 73% consumed one or more drinks, of which half was purchased from the site.
Figure 7: Participant food and drink consumption at site on day surveyed, Caroline Springs Library (n=85) and Caroline Springs Leisure Centre (n=56), Melton, September-November 2017 Participants were asked to report how frequently they purchase food and/or drinks from the café when visiting the site to identify purchasing patterns. At CS Library, the majority of participants either never or rarely bought food and drinks from the site (59%). Those who had been visiting the site for more than 6 months (76% of participants) were asked if they had noticed any changes to the kinds of food and drinks sold since they had been attending, with most reporting that they had not noticed any changes (58%). Participants at CS Leisure Centre reported a higher frequency of café purchases, with 43% of participants buying food and/or drinks often or regularly. Anecdotally, many participants noted that they were visiting the site around the time which they would normally be eating dinner at home. Of those visiting the site for more than 6 months (86%), most had not noticed any changes (66%). Participants who reported their frequency of purchases as “never bought anything”, “rarely”, or “sometimes” (54% CS Library respondents; 41% CS Leisure Centre respondents) were asked: “Is there a particular reason for not buying food from here?” (Table 2). 14% and 18% of participants, at CS Library and CS Leisure Centre respectively, reported that they usually ate before/after attending the site. Price was also reported as a barrier to purchase by 6% and 9% of participants, respectively (Table 2).
0%
20%
40%
60%
80%
100%
Consumedfood at centre
Consumeddrink(s) at
centre
Consumedfood at centre
Consumeddrink(s) at
centre
Pro
po
rtio
n o
f p
arti
cip
ants
wh
o c
on
sum
ed
fo
od
/dri
nks
at
the
ce
ntr
e (
%)
Caroline Springs Library Caroline Springs Leisure Centre
Purchased at centre Brought from home/other
From drinking fountain Did not consume
Drinks from multiple sources

Healthy Eating in the West- Follow-up evaluation (City of Melton) 10
Table 2: Customers’ reported reasons for infrequent café use
Reported reason, n (% total surveys)
Caroline Springs Library
(n=39) *
Caroline Springs Leisure Centre (n=28) *
Usually eat beforehand or afterwards 12 (14) 10 (18)
Price 5 (6) 5 (9)
Don’t like what is available 4 (5) 4 (7)
Other/don’t know 18 (21) 9 (16)
* Total number customer surveys: at Caroline Springs Library (n=85), Caroline Springs Leisure Centre (n=56)
Survey participants at CS Leisure Centre frequent the café more regularly than those at the CS Library. This may be attributed to the time of day visitors are attending the site (around dinner time). Survey results demonstrate low levels of awareness of changes to the provision of food and drinks across both sites. Participants were told, “This centre has been working on an initiative to promote healthy eating by increasing the availability of healthy foods and drinks, and decreasing the availability of unhealthy foods and drinks.” They were then asked how supportive they were of an initiative such as this. At CS Library, 85% or participants reported that they were supportive, as did 82% of participants at CS Leisure Centre (Figure 8).
Figure 8: Participant response to healthy eating initiative, Caroline Springs Library (n=85) and Caroline Springs Leisure Centre (n=56), Melton, September-November 2017. Note: figure excludes those who responded to question with ‘I don’t know’. Researchers asked participants how much they agreed with the following statement: “Sports and recreation centres have a responsibility to promote healthy eating.” 87% of participants at CS Library, and 89% at CS Leisure Centre, either agreed or strongly agreed with this statement (Figure 9).
0%
20%
40%
60%
80%
100%
Caroline Springs Library Caroline Springs Leisure Centre
Pro
po
rtio
n o
f p
arti
cip
ants
su
pp
ort
ive
of
he
alth
y ea
tin
g in
itia
tive
(%
)
Supportive Neither supportive/unsupportive Unsupportive

Healthy Eating in the West- Follow-up evaluation (City of Melton) 11
Figure 9: Proportion of participants who agree/disagree with the statement: “Sports and recreation centres have a responsibility to promote healthy eating.” Caroline Springs Library (n=85) and Caroline Springs Leisure Centre (n=56), Melton, September-November 2017. Note: figure excludes those who responded to question with ‘I don’t know’.
A large majority of participants across both sites reported that they were supportive of a healthy eating initiative within the environment of a sports and recreation centre. Similarly, a large majority agreed that these centres have a responsibility to promote healthy eating. At the conclusion of the survey, participants were asked if they “had any other comments they would like to make regarding food and drinks sold at the centre?” A low number of participants across both sites chose to provide comments. However, some comments were made in support of the healthy eating initiative (n=9), such as, “it makes sense. Sports centres should work hand in hand with nutrition”; and “it should be kept healthy because the library is an educational environment.” Suggestions for the provision of healthier foods (n=7) included, “more fresh options, like wraps”; and “I would love to see things like fruit salad or yoghurt cups.” Others made comments questioning the role of the centre in promoting healthy eating (n=5), such as “people have to take responsibility for themselves”; and “it’s the parent’s job, not the centre’s”.
0%
20%
40%
60%
80%
100%
Caroline Springs Library Caroline Springs Leisure Centre
Pro
po
rtio
n o
f p
arti
cip
ants
wh
o
agre
e/d
isag
ree
wit
h s
tate
me
nt
(%)
Strongly agree/agree Neither agree/disagree Strongly disagree/disagree

Healthy Eating in the West- Follow-up evaluation (City of Melton) 12
Staff surveys and interviews Three rounds of staff interviews and surveys were conducted with two sport and recreation centre managers, a council manger, the dietitian responsible for implementation, and a food service manager. Survey results from staff suggested that desire for change remained moderate and consistent across participants and over time. Perceived cost of change varied a lot between participants and within participants over time, generally dropping after initial drink implementation period and then increasing again. Sense of obligation to change was moderate to high, and varied between participants and over time. Interviews highlighted key themes around resources and supply, customers, prior expectations, financial considerations, and initiative sustainability. These themes are elaborated on below, along with practical strategies used by sites to facilitate healthy food and drink changes. The lines of communication between staff are outlined in Appendix VI. Resources and supply of healthy alternatives Staff time and knowledge resource limitations were initially considered to be significant barriers to change, however solutions included integrating responsibility for changes into staff roles, and utilising (low-cost) external resources such as Food Checker, product classification software from HEAS.
“FoodChecker which is a very good resource for us because it's going to help us determine what we can introduce, what we can't, and if we want to introduce something we might have to get rid of something else so having that there to make sure that we're always in check is good.” [Staff member 1, post-implementation]
Negotiating with (particularly new) suppliers, who often charge more for healthier options, was a major challenge. This was overcome by pushing back against supplier demands and prices, for example negotiating on length of contract. Buyers groups were suggested as a way to increase negotiating power of smaller retailers. On the other hand, staff noted that existing suppliers were increasingly accommodating of healthy changes, including marketing requirements. Know your customer base Customer acceptability of changes remained an important staff concern. However, all staff acknowledged that customers are not a uniform group, and that certain customers may be more receptive to changes, particularly health conscious patrons and parents. Differences in sales between sites were also attributed to differences in customer demographics. Some staff discussed the value of targeting different marketing strategies to different groups of consumers.
“I'd certainly be keen to understand some of the insights … for the want of a better word, demographic of people that we have at AquaPulse versus Eagle Stadium and why are they making different choices.“ [Staff member 2, post-implementation]
Service staff were acknowledged to play an important part in engaging customers and gauging customer acceptability of changes.

Healthy Eating in the West- Follow-up evaluation (City of Melton) 13
“[Service staff] can be our ambassadors …to try to educate and change people’s perceptions of what they’re putting into their bodies.” [Staff member 3, post-implementation]
Business operations Financial aspects remained important, and were an ongoing concern, and several staff expressed that implementation of HCGs may have caused revenue losses or slower growth. However, industry trends towards healthier sports and recreation centre offerings, increasing customer demand, and potential customer health benefits were important reflections. Staff costs were also a significant ongoing expense which is unrelated to HCG implementation. Considering healthy food policy implementation as a business problem, rather than a moral or nutritional problem, was suggested as an alternative framing that may be acceptable to the wider industry.
“I would really look to bundle it up as a finance project and actually consider what is the start point? What is the end point? Not just let's start it and see where it goes, it might be a two year project … That way you get better structure to it, you get better results, better outcomes, you can measure things, get better support and certainly seek to understand…what are your experiences and what we can we do to implement.“ [Staff member 2, post-implementation]
Staff also recognised that retaining at least some ‘red’ foods and/or drinks for sale would be important for maintaining financial viability.
Initiative sustainability and maintenance Discussions of initiative sustainability of changes focused on issues of supply and accountability. Council dietitians had provided a way of regularly touching base and therefore incentivised timeline progression. It was acknowledged that the HEAS could provide a similar function. However HEAS mainly provides assessment and implementation support on request, rather than providing a monitoring or accountability service.
“I think someone going in, them knowing that someone’s going to go in and have a look at the sites, I think is important, not just a teleconference – I mean for the Healthy Choices - because then they think, okay, we need to make sure that we’re doing what we say we’re doing.” [Staff member 4, post-implementation]
Embedding changes by changing suppliers, using approved planograms (layout guidelines for fridges), ongoing staff training, and working towards integrating healthy food policy requirements into contracts were noted as important for maintenance. In addition, maintenance was acknowledged to not be static, but rather a process of ongoing adaption- for example supplying variety in food offerings over time, dealing with staff turnover, and new challenges, such as changing contract arrangements. Finally, the value of recognition of achievement from council, customers, and the general public was noted by several staff. This included a desire from WLS to be officially recognised or accredited

Healthy Eating in the West- Follow-up evaluation (City of Melton) 14
for having fully implemented the HCGs, and to allow them to promote such a certification as a commercial point-of-difference. Vision Staff discussed the importance of support from senior council members for change to occur, and believed that in-principle support was growing at both City of Melton and City of Wyndham. Council plans could also be an important advocacy tool for council workers to promote the adoption of healthy food policies. For example, the City of Melton plan includes the vision of “a thriving community” (City of Melton, 2016). Heathy food retail changes in community settings were viewed as part of long-term cultural changes needed to improve the health of the community.
“If we can change one person’s perception about that then we’re going the right direction, aren’t we?” [Staff member 3, post-implementation] “I think there might be a little bit of a shift towards those things, or a treat rather than a norm.” [Staff member 5, post-implementation] “Demand is increasing as well. And I think it’s just something that needs to happen over time to slowly start to reduce those discretionary lines, get rid of all the red, and for it to be the norm to be your healthy food, and not the norm for it to be all the junk.” [Staff member 4, post-implementation] “It's a generational change that we're looking at.” [Staff member 2, post-implementation]
Discussion and recommendations At City of Melton sites, there has been sustained reductions in the availability of ‘red’ drinks from pre-implementation levels (see Table 1 in Executive Summary). This was reflected in sales trends over time. While there was a decrease in sales of ‘red’ drinks during the initial implementation period, these increased again after re-introduction of milkshakes. Milkshakes were re-introduced due to staff concerns over the potential negative impact on drink sales and customer satisfaction. Over time there has been an increase in sales of healthier ‘green’ and ‘amber’ drinks. Customer surveys suggest that overwhelmingly customers are supportive of a change to healthier food and drink provision at sports and recreation centres, and report that these centres have a responsibility to promote healthy eating. Staff interviews revealed a contrasting concern that if popular unhealthy alternatives are removed customers may choose not to purchase from the cafés at all. This is of particular concern since ‘red’ drinks (and food) make up the majority of café revenue at all sites. Revenue from all cold drinks experienced a small decrease during the study period, which was maintained for the twelve months following the trial. This change is likely to be partly attributable to changes in availability of milkshakes and other drinks including diet sports drinks over time. Other changes, such as changes in opening hours and overall attendance, may also have played a role. Once the changes in availability at Melton sites are stabilised it will be important to continue to monitor the revenue from all cold drinks over time.

Healthy Eating in the West- Follow-up evaluation (City of Melton) 15
It will be critical to ensure a range of operational and policy strategies are in place to enable vibrant and viable healthy cafés and sports and recreation centres into the future, especially in geographic areas with lower economic resources. Staff interviews also suggested that forward-thinking changes in such settings could help to shift the cultural norms required for wider spread of healthy food provision changes in community and commercial organisations. Based on the learnings from Western Leisure Service and Melton City Council experience, we have developed a series of recommendations in consultation with staff, tailored to different organisational levels. Based on key recommendations from our previous report (Appendix VII), and from this updated analysis, we have identified key recommendations for different stakeholder groups (Retailers; Local Government; Statement Government; Researchers). We note that, given the current stage of change for Melton progressing towards the HCGs, recommendations 2, 7b, 7d, and 10 are particularly relevant.
Recommendations to enable successful implementation of Healthy Choices guidelines
For the retailer 1. Once committed to making healthy food the norm, consider the transition as a business
challenge.
2. Use existing resources to support implementation, including the Healthy Eating Advisory Service and local public health and nutrition workforce and collateral from existing social marketing campaigns, such as the VicHealth H3O or CancerCouncil 'rethinksugarydrink' campaigns.
3. Source new suppliers if needed to provide green and amber varieties of popular red food and drink, and new options for green and amber food and drink, and embed these in the regular supply chain. Consider collaborating with other retailers to form buyers groups to reduce the wholesale costs of healthier food and drink orders.
4. Be leaders in the field and share learnings with other organisations transitioning to
healthier choices.
5. Implement procedures for ongoing monitoring and feedback of HCG compliance at all sites.
6. Consider other ways to improve café sales beyond the types of food and drinks you sell. For example:
a. Considering promotional strategies and the ambience of your customer environment may encourage customers to spend longer in cafes and purchase tea or coffee.
b. Continue to build innovative communications with customers to increase acceptability of new food and drink options, and increase education about healthy

Healthy Eating in the West- Follow-up evaluation (City of Melton) 16
lifestyles. Consider that different marketing strategies may appeal to different customer groups.
c. Provide foods and drinks that are tailored to needs of customers. For example, if events often occur over dinner time, consider offering more complete meals, as well as snack options.
7. Consider these top practical tips for implementing HCGs: a. Start with sugary drinks. b. Target reduction in number of confectionary lines. c. Provide more variety of healthy alternatives, and plan to change varieties of fresh
foods in particular over time (e.g. new sandwich varieties, seasonal variation). d. Create a timeline for progression to HCGs compliant sites along with an action plan
to reach these goals. Seek council executive approval for plan. e. Monitor profitability or revenue from different lines, to prioritise removal of less
healthy and less profitable items and promotion of more profitable healthier items.
For Government Local government 8. Be forward-thinking. Start or continue the transition to healthy food now to keep pace
with changing consumer expectations and business practices of industry leaders. Support the vision that implementing a healthier food supply at sports and recreation centres is a priority, through policy, finance, staffing and recognition.
9. Develop a strategy for HCG implementation, including:
a. Assigning accountability for implementation of policy to individuals and leadership team or include implementation of HCG in the role of current staff member, including in key progress outcomes or Key Performance Indicators.
b. Engaging staff at all levels in the process of implementation of changes. c. Developing organisation-wide healthy eating policies (based on the HCG) using best
practice change management processes, including in consultation with all relevant council departments to gain expertise and cooperation from each group.
d. Identifying and making available existing internal and external nutrition and research resources to support changes in food and drink provision.
e. Harnessing different stakeholders’ background, skills and interests to achieve healthier food provision while acknowledging that health is not always the primary motivation for many stakeholders.
10. Ensure level senior management and executive consider and communicate the relative
prioritisation of sports and recreation site profitability versus promoting of healthy setting including: a. Incorporating HCGs adoption or progress targets into local council health and
wellbeing plans to provide platform for advocacy on HCGs progress. b. Embedding healthy choices in leasing/licensing arrangements with user groups and
contracts with facility management organisations (e.g. YMCA).

Healthy Eating in the West- Follow-up evaluation (City of Melton) 17
11. Communicate evaluation outcomes to senior management and councillors, ensuring that assessment of evaluation outcomes aligns with strategic goals.
State government and Healthy Eating Advisory Service 12. Create opportunities for external recognition of HCG achievement through key industry
organisations, e.g. Aquatic Recreation Victoria (ARV). 13. Further incentivise HCG compliance at a State Government level though implementing
and publicising preferential funding to sites or councils that are HCGs compliant (e.g. Better Indoor Stadiums fund) and providing practical (e.g. nutrition expertise) and financial support for implementation.
14. Collate lists of compliant products for major suppliers.
State and local government 15. Consider government responsibility to support development of healthy norms by
promoting healthy eating in all government settings including sports and recreation centres.
16. Reduce reliance on healthy food marketing and sponsorship for sports teams and events.
For example, investigate alternative sponsors, such as a local green grocer. For the researcher 17. Work closely with the retailer and management to embed an evaluation strategy with
outcomes relevant to all stakeholders. 18. Conduct controlled interventions over a defined intervention period to quantify the
specific and directly attributable impact of HCG changes on long-term profitability. 19. Continue monitoring availability, sales and customer satisfaction to inform future
changes, including: a. Conduct regular customer surveys before, during and after HCG implementation to
gauge customer awareness, acceptability and feedback for further ideas and adjustments to process of implementation.
b. Collect and report on changes in profitability of HCGs implementation. c. Develop standardised reporting and evaluation tools to assist ongoing evaluation of
HCGs in community food retail settings. 20. Explore differences in response to heathy food policies by customer demographics and
site type (for example pool versus gym), and which product choices and marketing strategies may be most effective for engaging different customer groups.

Healthy Eating in the West- Follow-up evaluation (City of Melton) 18
References
Blake, M. R., & Peeters, A. (2017). Healthy eating in the west: economic evaluation. Retrieved from Melbourne, Victoria: http://www.globalobesity.com.au/reports/
Boelsen-Robinson, T., Backholer, K., Corben, K., Blake, M., Palermo, C., & Peeters, A. (2017). The effect of a change to healthy vending in a major Australian health service on sales of healthy and unhealthy food and beverages. Appetite, 114, 78-83.
City of Melton. (2016). Council Plan 2013-7. Retrieved from Melbourne, Australia: http://www.melton.vic.gov.au/Council/About-Council/Council-Plan-and-Budgets
Department of Health & Human Services. (2015). Healthy choices: food and drink classification guide. Retrieved from Melbourne, Victoria: www.health.vic.gov.au/nutrition
Gittelsohn, J., Franceschini, M. C., Rasooly, I. R., Ries, A. V., Ho, L. S., Pavlovich, W., . . . Frick, K. D. (2008). Understanding the food environment in a low-income urban setting: implications for food store interventions. J Hunger Environ Nutr, 2(2-3), 33-50.
Gravlee, C. C., Boston, P. Q., Mitchell, M. M., Schultz, A. F., & Betterley, C. (2014). Food store owners’ and managers’ perspectives on the food environment: an exploratory mixed-methods study. BMC Public Health, 14(1), 1031. doi:10.1186/1471-2458-14-1031
Herscovitch, L., & Meyer, J. P. (2002). Commitment to organizational change: extension of a three-component model. Journal of Applied Psychology, 87(3), 474.
Linden, A. (2015). Conducting interrupted time-series analysis for single-and multiple-group comparisons. Stata J, 15(2), 480-500. doi:10.1017/S136898001600104X
Minaker, L. M., Olstad, D. L., MacKenzie, G., Nguyen, N., Azagba, S., Cook, B. E., & Mah, C. L. (2016). An evaluation of the impact of a restrictive retail food environment intervention in a rural community pharmacy setting. BMC Public Health, 16(1), 1-7. doi:10.1186/s12889-016-3281-9
Olstad, D. L., Goonewardene, L. A., McCargar, L. J., & Raine, K. D. (2014). Choosing healthier foods in recreational sports settings: a mixed methods investigation of the impact of nudging and an economic incentive. Int J Behav Nutr Phys Act, 11(1), 6. doi:10.1186/1479-5868-11-6

Healthy Eating in the West- Follow-up evaluation (City of Melton) 19
Appendix I: Drink trial details
The drink trial involved the implementation of the Healthy Choice guidelines for drinks
at participating facilities including the following parameters:
Drink fridge(s) have less than 20% ‘red’ drinks and more than 50% ‘green’ drinks
‘Green’ drinks are displayed in the most prominent position in fridges
‘Red’ drinks are not displayed in the most prominent position in fridges
Swapping milkshakes (‘red’) to smoothies (‘green’)
Making low fat milk the default milk for all drinks - tea, coffee, smoothies
Free refills of sugar sweetened drinks are not available or promoted
No upsizing and/or upselling of ‘red’ drinks
‘Red’ drinks are not included in meal deals or specials
Promotional material featuring ‘red’ drinks, or brands that are strongly associated with
‘red’ drinks are not visible to customers
Clean and safe water is always available free of charge (for example, from water bubblers
and/or food outlets) in high traffic areas
Details of the Healthy Choices guidelines relating to food changes can be found at the references below. Reference Department of Health & Human Services. (2014). Healthy choices: policy guidelines for sport and recreation centres. Melbourne, Victoria: Victorian Government. Department of Health & Human Services. (2015). Healthy choices: food and drink classification guide. Melbourne, Victoria: Victorian Government.

Healthy Eating in the West- Follow-up evaluation (City of Melton) 20
Appendix II: Detailed data analysis methods
Sales data analysis Sales data are routinely collected at intervention sites when items are selected by staff by pressing the relevant item button on the point of sales system. Weekly item and dollar sales data (drink revenue) were extracted for each food and drink line sold for at least 52 weeks prior to the intervention and for all data points available until October 2017. Our primary analysis compared item and volume (litre) sales and drink revenue for ‘red’, ‘amber’ and ‘green’ drink categories before, during, and after the drink intervention time points. We analysed each outcome (volume, number of items and revenue) using single-group interrupted time series analyses (ITSA), which can be considered the “strongest, quasi-experimental approach for evaluating longitudinal effects of interventions” (Wagner, 2002)(p.299). We applied ordinary least squared regressions with Newey-West standard errors to handle autocorrelation in addition to possible heteroscedasticity. Evidence for autocorrelation in the error distribution of the data was evaluated using the Cumby-Huizinga general test for autocorrelation with a maximum of 20 lags. Using the parameter estimates and standard errors we projected the pre-intervention trend into the intervention period (to serve as a counterfactual – an estimation of the outcome that would have been expected if the intervention had not taken place) and calculated the adjusted predicted intervention effect with 95% confidence intervals to test significance. We also created dummy variables corresponding to sales of less than $1000 per week, which presented as outliers and included Christmas and New Year dates. Analyses were adjusted for each seasonal quarter to account for temporal fluctuations in sales. Data were pooled from Melton sites Melton Indoor Recreation Centre, Caroline Spring Leisure Centre and Caroline Spring Library due to small sample sizes. Caroline Spring Library shares common customers, staff and stock with Caroline Springs Leisure Centre. A sensitivity analysis was conducted with and without the library to test the effect on conclusions.
All analyses were conducted using Stata 14 ITSA package (Linden, 2015).
Qualitative interviews Interviews were audio recorded (with consent from participants) and transcribed verbatim for analysis by a professional transcription company. Immediately following the interview, initial impressions were recorded to inform later analyses. Data from all interviews were analysed through thematic analysis using NVivo qualitative data management software. Key themes and sub-themes were identified. A subset of interviews was cross-coded by a second researcher to check for consistency. References Linden A. Conducting interrupted time-series analysis for single-and multiple-group comparisons. Stata J 2015;15(2):480-500. doi: 10.1017/S136898001600104X. Wagner AK , Soumerai SB, Zhang F, Ross‐Degnan D. Segmented regression analysis of interrupted time series studies in medication use research. J Clin Pharm Ther 2002;27(4):299-309.

Healthy Eating in the West- Follow-up evaluation (City of Melton) 21
Appendix III: Customer survey questions
1. How often do you visit this centre?
a. Once per week or more b. Once per month c. Less than once per month d. Never before
If never before Go to Q3
2. How long have you been visiting this centre for?
a. Less than a month – 6 months b. 6 months – 1 year c. 1 year – 2 years d. 2 years or more
3. What was the purpose of your visit to the centre today?
a. Casual use of pool facilities b. Adult swimming class/activity (e.g. water aerobics) c. Gym (casual or group fitness classes) d. Taking a child/children to a class (e.g. Learn to Swim) e. Supervising child/children using facilities (e.g. basketball) f. Borrowing books (Caroline Springs Library only) g. Library study (Caroline Springs Library only) h. Other.....................................................................................
4. Did you, or anyone that you came with, have anything to eat while you’ve been at the
centre today?
Yes/No
If yes Go to Q5 If no Go to Q8
5. What did you (or they) eat?
Comment:…………………………………………………………………….
6. Did you purchase it from the centre?
Yes/No
If yes Go to Q8

Healthy Eating in the West- Follow-up evaluation (City of Melton) 22
If no Go to Q7
7. Where did your food come from?
a. Home b. Other:………………………………………………………….
8. How often would you buy food or drinks from the centre?
a. Never bought anything b. Rarely c. Sometimes d. Often e. Regularly
If never Go to Q9; otherwise Go to Q10
9. Is there a particular reason for that?:
a. Usually eat before/after visiting centre b. Don’t like what is available c. Price d. Don’t usually visit the café e. Other:………………………………………………………………………… f. Don’t know
10. Did you have anything to drink while you’ve been at the centre today?
Yes/No; If no Go to Q14
11. What did you drink?
a. Plain natural/sparkling water b. Flavoured water c. Regular soft drink d. Diet/zero calorie soft drink e. Energy drink f. Diet energy drink g. Sports drink h. Diet sports drink i. Juice j. Low-fat milk k. Flavoured milk l. Protein drink m. Milkshake n. Smoothie o. Coffee/tea/hot chocolate

Healthy Eating in the West- Follow-up evaluation (City of Melton) 23
p. Other:……………………………………………………………….
12. Did you purchase your drink from the centre?
Yes/No
13. Did you use the drinking fountains at the centre today?
Yes/No
14. **Ask only if customer has been attending the centre for 6-12 months or more** Since you’ve been coming here, have you noticed any changes to the kinds of food and drinks sold at the centre?
If yes Go to Q15
If no/don’t know Go to Q16
15. What have you noticed?
Comment:………………………………………………………………….
16. ***Give a short explanation: “This centre has been working on an initiative to promote healthy eating by making more healthy food and drinks available and less unhealthy food and drinks available.
How supportive would you say you are of this initiative?
a. Supportive b. Neither supportive/unsupportive c. Unsupportive d. Don’t know
17. How much do you agree with the statement: “Sports and recreation centres have a
responsibility to promote healthy eating.”
a. Strongly agree b. Agree c. Neither agree or disagree d. Disagree e. Strongly disagree f. Don’t know
18. Do you have any other comments you would like to make regarding food or drinks at
the centre?
Comment:………………………………………………………………………………

Healthy Eating in the West- Follow-up evaluation (City of Melton) 24
19. Age 15-17 18-24 25-34 35-44
45-54 55-64 65+
20. Gender Male/Female
21. Postcode _______________

Healthy Eating in the West- Follow-up evaluation (City of Melton) 25
Appendix IV: Additional sales data analysis
Figure S1: Weekly volume sales of cold drinks before, during, after drink trial without soft drink sales (3 sites), adjusted for seasonal variation
0
20
40
60
80
100
120
No
v-1
5
Dec
-15
Jan
-16
Feb
-16
Mar
-16
Ap
r-1
6
May
-16
Jun
-16
Jul-
16
Au
g-1
6
Sep
-16
Oct
-16
No
v-1
6
Dec
-16
Jan
-17
Feb
-17
Mar
-17
Ap
r-1
7
May
-17
Jun
-17
Jul-
17
Au
g-1
7
Sep
-17
Oct
-17
Vo
lum
e s
old
pe
r w
ee
k (L
)
Cold 'red' beverages (fitted)Cold 'red' beverages (predicted)Cold 'amber' & 'green' beverages (fitted)Cold 'amber' & 'green' beverages (predicted)
Healthy drinks
implementation period

Healthy Eating in the West- Follow-up evaluation (City of Melton) 26
Appendix V: Customer survey demographic results Table S1: Socio-demographic information of survey participants
Socio-demographic information, n (%) Caroline Springs Library (n=85)
Caroline Springs Leisure Centre (n=56)
Female 41 (48) 41 (73)
Age (years)
15-17 42 (49) 8 (14)
18-24 11 (13) 10 (18)
25-34 9 (11) 3 (5)
35-44 11 (13) 17 (30)
45-54 7 (8) 11 (20)
55-64 2 (2) 3 (5)
65+ 3 (4) 4 (7)
Time since first visit to centre
<1 month – 6 months 20 (24) 8 (14)
6 months – 1 year 12 (14) 5 (9)
1 – 2 years 9 (11) 7 (13)
2 years or more 44 (52) 36 (64)
Purpose of visit
Adult sport (e.g. basketball/netball)
N/A 19 (34)
Umpiring sport N/A 4 (7)
Supervising child/children using facilities (e.g. basketball)
1 (1) 31 (55)
Library study 30 (35) N/A
Borrowing books 10 (12) N/A
Socialising 9 (11) N/A
Café 2 (2) N/A
Other 33 (39) 2 (4)

Healthy Eating in the West- Follow-up evaluation (City of Melton) 27
Appendix VI: De-identified stakeholder diagram
Council
executives
Catering
Manager
Service
Staff
External
Supplier
(PFD Main
Supplier)
Western Leisure Service
Outlet Staff
Wyndham Council Staff
Students
Services Group
Manager
Assistant
Centre Manager
(MW- private)
Melton Retail Outlet
Staff
New Centre
Manager (MW-
private) Cafe Manager
(MW- private)
Team Leader,
Health Promotion
And Planning
Coordinator
Leisure Services
Planning
Coordinator Leisure
Services Planning
Service
Staff
Marketing And
Membership
Management
Operations
group
manager
Chief
Operating
Officer
Melton Council Staff
Health
Promotion
Officer
Healthy Eating
Officer
State Public
Health
Nutritionist
(DHHS)
Customers Customers Lines of communication Interviewees Interviewees
External
vending
machine
supplier
Healthy Eating
Advisory
Service
(Nutrition
Australia)
Health and
wellbeing manager
Chefs &
Service
Staff
State
management
(Belgravia
Leisure)
Youth and
recreation
manager
Council
executive

Healthy Eating in the West- Follow-up evaluation (City of Melton) 28
Appendix VII: Recommendations from previous report 6.1 Melton City Council recommendations
Recommendations for healthy drinks changes implementation. 6.1.1. Embed new operational or supply chain so that healthier drink options are routinely delivered. 6.1.2. Communicate trial outcomes to council, ensuring that assessment of evaluation outcomes aligns with strategic goals. Recommendations for healthy choice guidelines implementation more broadly. 6.1.3. Create a timeline for progression to Healthy Choices compliant sites along with an action plan to reach these goals. Seek council executive approval for plan including timeline and profit goals as above. 6.1.4. Target reduction in number of confectionary lines. 6.1.5. Use existing internal and external nutrition and research resources to support changes in food and drink provision. 6.1.6. Seek clarity on relative prioritisation sports and recreation site profitability versus promoting of healthy setting from senior management and executive.
6.2 Broader recommendations for implementation of the Healthy Choices guidelines 6.2.1. Build on existing sales expertise. 6.2.1.1 Continue to develop an attractive food retail setting to promote the HCGs and healthier food and drink options. 6.2.1.2 Ensure that the implementation of HCG is developed using the managers’ expert knowledge of food and drink sales (e.g. popular types of drinks, purchase frequency and customer demographics), staff input and customer responses to increase the profitability and customer and staff acceptability of changes. 6.2.1.3 Promote healthy choices to customers as a point of difference. 6.2.2. Embed Healthy Choices changes using a whole of organisation change management approach. 6.2.2.1 Provide avenues for explicit discussion of operational concerns between management and operational staff, e.g. setting up a working group. 6.2.2.2 Engage staff at all levels in the process of implementation of changes. 6.2.2.3 Develop organisation-wide healthy eating policies (based on the HCGs) using best practice change management processes, including in consultation with all relevant council departments to gain expertise and cooperation from each group. 6.2.2.4 Assign accountability for implementation of policy to individuals and leadership team or include implementation of HCG in the role of current staff member, including in key progress outcomes or Key Performance Indicators. 6.2.2.5 Develop clear organisational guidance and leadership on the prioritisation, funding and support available for promotion of healthy eating at council sports and recreation sites.

Healthy Eating in the West- Follow-up evaluation (City of Melton) 29
6.2.2.6 Consider how learnings from one site might inform progress at other sites. 6.2.2.7 Be adaptable to changes, including making use of opportunities when they arise, and dedicating resources to periodically revising strategies. 6.2.2.8 Expand the HCG to other sites of government including local government influence, focusing first on those that are health-promoting and therefore have a natural alignment such as sports clubs, and by implementing Healthy choices: healthy eating policy and catering guide for workplaces within council settings, for example healthy catering and breastfeeding support. 6.2.3. Harness dietetic resources. 6.2.3.1 Utilise dietetic resources where available to accelerate implementation and facilitate feasible, practical changes to healthier food options and supply. 6.2.3.2 Utilise public nutrition support where dietetic resources are not available, e.g. Healthy Eating Advisory Service (HEAS) training, online product/menu assessment tools, website resources and phone advice, to accelerate implementation; as well as nutrition and dietetic students where available. 6.2.3.3 Build the nutrition and healthy food provisions capacity of centre or café staff via local dietetic support and with HEAS training and online tools. 6.2.3.4 Focus on the goal of improving the proportion of ‘green’ and ‘amber’ purchases. 6.2.3.5 Support the growth of nutrition capability within local government. 6.2.3.6 Explore how to increase capacity to deliver nutrition support to organisations implementing change in a regular and timely way. 6.2.4. Develop supportive infrastructure. 6.2.4.1 Digitise sales data and wastage. Create finely graded categories of products to allow distinction between different varieties (e.g. sandwich types), to allow removal or adaption of unprofitable items, and monitoring of response to future changes. 6.2.4.2 Collect accurate attendance data. 6.2.4.3 Maintain comprehensive evaluation of ongoing implementation of HCG (e.g. reviews every 12 months) according to an evaluation framework such as the current evaluation, for example, ongoing assessment of profitability versus healthiness of offerings. 6.2.5. Build opportunities for external support. 6.2.5.1 Create opportunities for external recognition of HCG achievement through key industry organisations, e.g. Aquatic Recreation Victoria (ARV). 6.2.5.2 Encourage compliance through site and supplier contracts and at contract renewal, including requirement to meet HCG and clauses for penalties for non-compliance or incentives for compliance, e.g. decreases in rental price for progress against key outcomes. 6.2.5.3 Further incentivise HCG compliance at a State Government level though implementing and publicising preferential funding to sites or councils that are healthy choices compliant (e.g. Better Indoor Stadiums fund) and providing practical (e.g. nutrition expertise) and financial support for implementation. 6.2.5.4 Plan new sites with HCG compliance in mind, for example by the absence of deep fryers, and sufficient food preparation and cold display space for fresh foods.

Healthy Eating in the West- Follow-up evaluation (City of Melton) 30
6.3 Future research recommendations 6.3.1. Conduct regular customer surveys before, during and after HCG implementation to gauge customer awareness, acceptability and feedback for further ideas and adjustments to process of implementation. 6.3.2. Collect and report on changes in profitability of healthy choices implementation. 6.3.3. Develop standardised reporting and evaluation tools to assist ongoing evaluation of HCG in community food retail settings. Reference Blake, M. R., & Peeters, A. (2017). Healthy eating in the west: economic evaluation. Retrieved from Melbourne, Victoria: http://www.globalobesity.com.au/reports/