healthy ecosystems healthy economy -...
TRANSCRIPT

@KITTYVDHEIJDEN
HEALTHY ECOSYSTEMS
=
HEALTHY ECONOMY
KITTY VAN DER HEIJDEN, DIRECTOR EUROPE WRI

2014 GO TO THINK TANK (JAN 2015) TOP ENVIRONMENTAL THINK TANK
1. World Resources Institute
2. Stockholm Environment Institute (SEI)
3. Worldwatch Institute
4. Brookings Institution
5. Center for Climate and Energy Solutions
6. Chatham House
7. Ecologic Institute
8. Potsdam Institute for Climate Research
9. International Institute for Sustainable Devt
10.Center for Environmental Research

SIX GOALS, THREE CROSS-CUTS
Climate Energy Food Forests Water Cities &
Transport
Business
Governance
Finance

OUR GLOBAL NETWORK
Institutional
Project staff on the ground
and/or project office
Active partnership
Liaison office
Planned office

Population Growth
Climate Change
Economic growth
Erosion of Ecosystems [60 % loss]

$15 trillion
$30tr
$50tr
$100tr
1970
1990
2010
Real GDP
(2005 dollars)
2030
Source: U.S. Department of Agriculture, Economic Research Service

1990
1 Billion
2010
2 Billion
2030
5 Billion
Source: Reuters, OECD 2010
THE RISE OF THE GLOBAL MIDDLE CLASS

EXPONENTIAL ENVIRONMENTAL TRENDS

(WRI chart using World Bank data, 2012)
ARE WE RUNNING OUT? Price trends of major commodity bundles (real 2005 dollars)
Pri
ce
in
re
al 2
00
5 d
oll
ars
250
200
150
100
50
1960 1970 1980 1990 2000 2010
Food
Energy
Timber
Fertilizers
Metals and Minerals

NO ABSOLUTE DECOUPLING…

THE HIGH COST OF ENVIRONMENTAL DEGRADATION
0
2
4
6
8
10
Co
st
of
en
vir
on
me
nta
l d
eg
rad
ati
on
as
% o
f G
DP
eq
uiv
ale
nt
CHINA: 9.2% OF GDP
(World Bank reports, 2005-2012)

14
Source: NCE estimate, based on WHO mortality data
ECONOMIC VALUE OF PREMATURE DEATH FROM pm 2.5
AIR POLLUTION

UNECONOMIC GROWTH
Source: UNU-IHDP, 2012

MASSIVE OPPORTUNITIES FOR RESOURCE EFFICIENCY


Global Green / Circular / Low Carbon Economy
• Prevailing economic model not leading to equitable and sustainable development
• Market and institutional failures
• What policies/reforms to address these shortcomings?

• GDP growth
• Globalization
• Deregulation
• Privatization
Prevailing growth model
• Output
• Incomes
• Living standards for many
Benefits • Poverty
• Inequality
• Ecosystem degradation
• GHG emissions
Costs
Prevailing economic growth model has benefits and shortcomings

These shortcomings derive from a series of market and institutional failures
Failures • Externalities • Under-provision of public goods • Missing markets • Asymmetrical information • Insecure property rights • Competitive barriers

But economic policies can provide a partial fix
Failures • Externalities • Under-provision of public goods • Missing markets • Asymmetrical information • Insecure property rights • Competitive barriers
Fixes • Getting prices right • Sustained public investments • Payments for ecosystem services • Labeling and 3rd party certification • Tenure reform, benefit sharing • Fair trade agreements
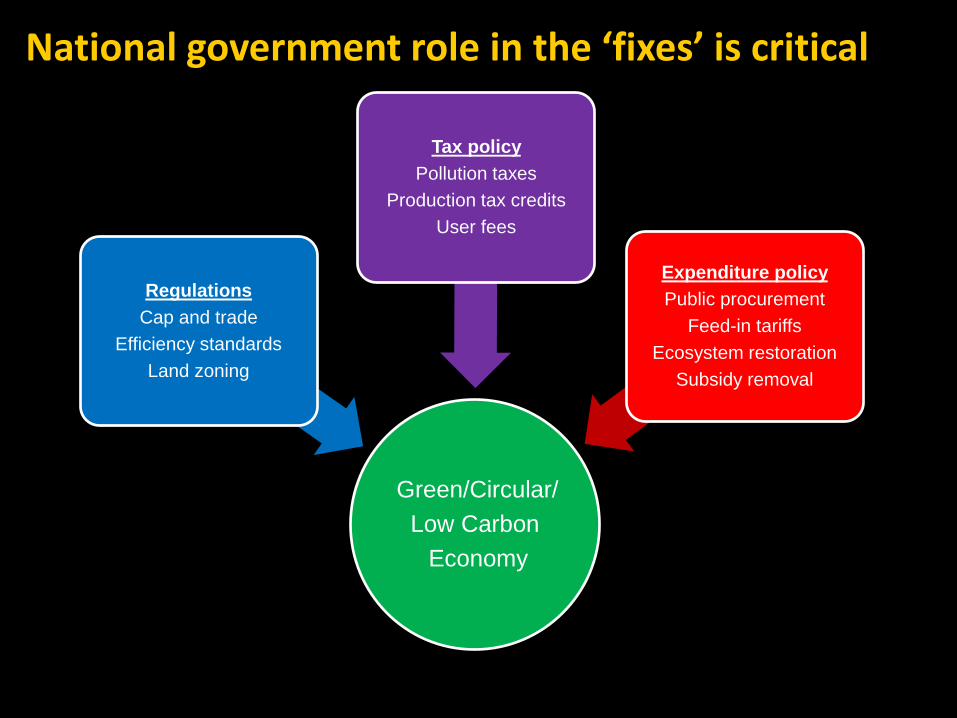
National government role in the ‘fixes’ is critical
Green/Circular/
Low Carbon
Economy
Regulations
Cap and trade
Efficiency standards
Land zoning
Tax policy
Pollution taxes
Production tax credits
User fees
Expenditure policy
Public procurement
Feed-in tariffs
Ecosystem restoration
Subsidy removal
1
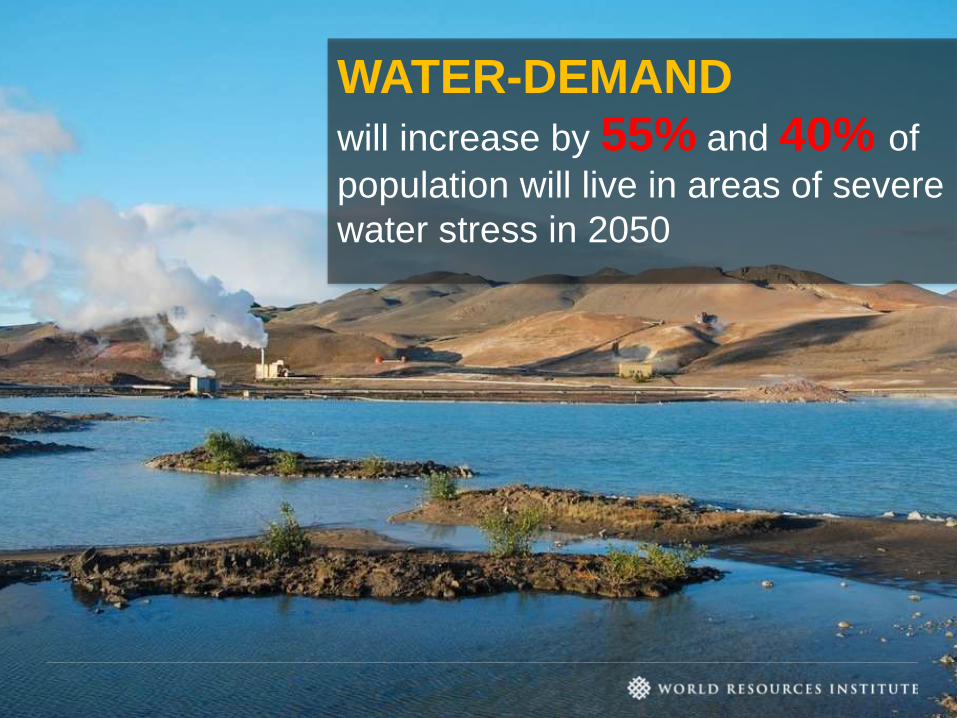
WATER-DEMAND
will increase by 55% and 40% of
population will live in areas of severe
water stress in 2050

WATER IS SCARCE TO START WITH

IN PRINCIPLE, THERE IS WATER FOR ALL

2.9 billion people live in highly to extremely highly water-stressed countries

Source: MIT, 2014
1.8 B
2020
2030
2040
Additional people in
(at least) moderate
water stress
2050
WATER SCARCITY ON THE RISE

Source: OECD Environmental Outlook Baseline; output from IMAGE
Environmental Outlook to 2050: Water
Global water demand: Baseline scenario, 2000 and 2050
irrigation domestic livestock manufacturing electricity
0
1 000
2 000
3 000
4 000
5 000
6 000
2000 2050 2000 2050 2000 2050 2000 2050
World OECD BRIICS RoW
Km
3
+400%
+130%
+140%

GLOBAL WATER RISK MAPPING

39% of irrigated cropland in this region is located in areas of water stress concern
Baseline Water Stress in areas with Irrigated Agriculture
39% of irrigated cropland in this region is located in areas of water stress concern
39% of irrigated cropland in this region is located in areas of water stress concern
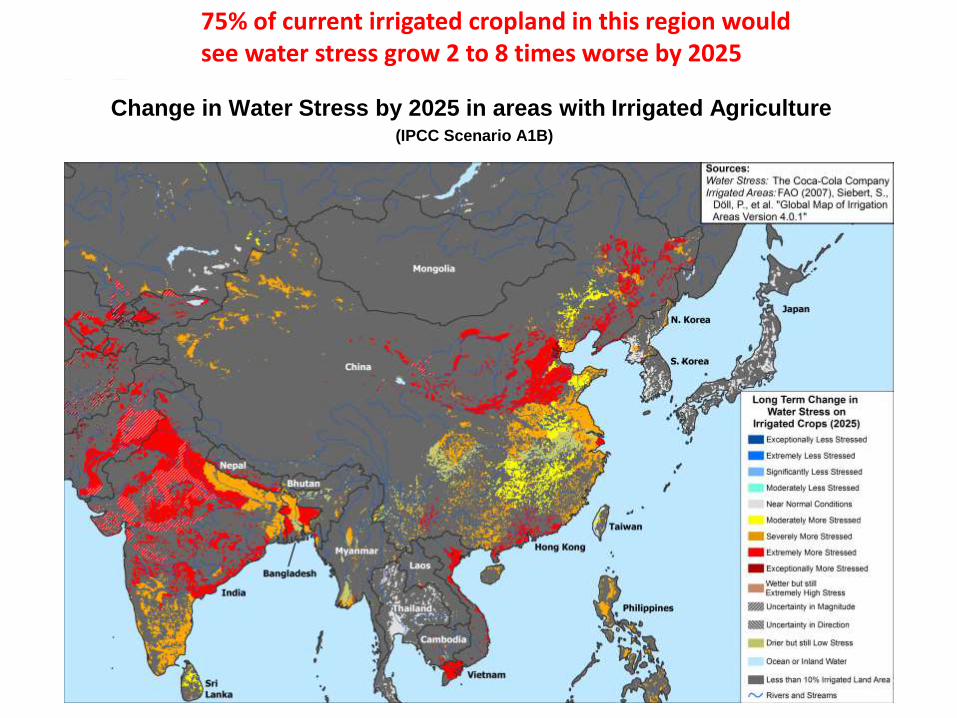
75% of current irrigated cropland in this region would see water stress grow 2 to 8 times worse by 2025 nt irrigated cropland in this region would see water stress grow 2 to 8 times worse by 2025 Change in Water Stress by 2025 in areas with Irrigated Agriculture
(IPCC Scenario A1B)

Energy Demand will grow by 1/3 by 2035 and electricity
demand will grow by 70% by 2035. Yet
90% of global power generation is water
intensive

19% of power plant design capacity in this region is located in areas of water stress concern
Baseline Water Stress and Power Plants

55% of current power plant design capacity in this region
would see water stress grow 2 to 8 times worse by 2025
Change in Water Stress by 2025 and Power Plants (IPCC Scenario A1B)
55% of POWER CAPACITY WILL SEE WATER STRESS
GROW 2 – 8 TIMES WORSE BY 2025

Source: Rio Times
Photo: flickr: queulat00
BRAZIL DRY SEASON
POWER PRICE UP 60%

THE IMPACT OF DROUGHT
Made it to nr # 20 this year in


(WRI, 2012)
COAL | PROPOSED NEW COAL POWER CAPACITY

COAL | PROPOSED NEW COAL POWER CAPACITY
(WRI, 2012)
INDIA

(WRI, 2012)
COAL | PROPOSED NEW COAL POWER CAPACITY
INDIA
CHINA

THREATS TO ENERGY

WHO SUFFERS FROM WATER SCARCITY?

WORLD ECONOMIC FORUM: WATER IS A GLOBAL RISK
Water crises

WATER ‘A GIFT OF NATURE’ ?

BUT THAT WILL (NEED TO) CHANGE


Environmental Outlook to 2050: Socioeconomic Developments
0
50 000
100 000
150 000
200 000
250 000
300 000
350 000
2010 2015 2020 2025 2030 2035 2040 2045 2050
Bill
ions o
f consta
nt 2010 U
SD
OECD BRIICS RoW US China India
Projections for real gross domestic product: Baseline, 2010-2050

Environmental Outlook to 2050: Climate Change
0
10
20
30
40
50
60
70
80
90
2010 2015 2020 2025 2030 2035 2040 2045 2050
GtC
O2e
OECD AI Russia & rest of AI Rest of BRIICS ROW
•Source: OECD Environmental Outlook Baseline; output from ENV-Linkages.
GHG emissions by region: Baseline, 2010-2050
•49

We need growth !
-20.0
-15.0
-10.0
-5.0
0.0
5.0
10.0
15.0
20.0
-3.0
-2.0
-1.0
0.0
1.0
2.0
3.0
1996 1998 2000 2002 2004 2006 2008 2010 2012
Mill
ion
s To return to 2007 employment levels
Additional unemployed since 2007 (Right hand axis)
Employment growth (%) (Left hand axis)
Jobs
0
2
4
6
8
10
12
14
16
Per cent of GDP
Deficit improvement to achieve 60% debt to GDP by 2025
Debt Demographics
-1.0
0.0
1.0
2.0
3.0
4.0
5.0
6.0
7.0
Pensions
Long term care
Health
Percent of GDP
Changes in age related public spending to 2025

GLOBAL COMMISSION on the ECONOMY & CLIMATE
Co-Chair:
Felipe Calderón Dan Doctoroff Luisa Diogo Minouche Shafik Co-Chair: Lord
Nicholas Stern
Ingrid Bonde Sharan Burrow Helen Clark
Kris Gopalakrishnan Chad Holliday Sri Mulyani Indrawati Ricardo Lagos Trevor Manuel
Paul Polman Zhu Levin
Takehiko Nakao
Chen Yuan Angel Gurría Jens Stoltenberg Michel M. Liès Annise Parker
Caio Koch-Weser
Eduardo Paes
Maria
van der Hoeven

52
The exam question …
Can we have better growth and a better
climate at the same time?
Fighting Climate Change
Promoting Economic Growth
VS

53
GLOBAL NEW CLIMATE ECONOMY PARTNERSHIP
Global Commission
Chaired by former President of Mexico, Felipe
Calderón
Comprising 24 members, including former heads
of government and finance ministers, and
leaders in business, finance and economics,
from 20 countries
Economic Advisory Panel
14 world leading economists, chaired by
Professor Lord Nicholas Stern
Includes:
Two Nobel prize winners:
Daniel Kahneman and Michael Spence
7 Commissioning Countries
Colombia
Ethiopia
Indonesia
Norway
Sweden
South Korea
United Kingdom
8 Partner Research Institutes
Climate Policy Initiative (USA)
Ethiopian Development and Research Institute
Indian Centre for Research on Economic
Relations (ICRIER)
Global Green Growth Institute (South Korea)
London School of Economics (UK)
Stockholm Environment Institute (Sweden)
Tsinghua University (China)
World Resource Institute (USA)

54
A different growth pathway
CARBON
BUBBLE
TODAY
LIMITS TO
GROWTH
Growth
performance
Good
Bad
Bad Good
Climate performance
NEW CLIMATE
ECONOMY

55
Main findings of the Commission:
• Economic growth and climate mitigation can be achieved together. We do
not need to choose.
• A growing number of businesses, cities and countries are demonstrating
this. Recent technological and policy developments mean that even more
opportunities are available today.
• About US$ 90 trillion will be invested in infrastructure to 2030 – need to
choose if it is low-carbon and climate resilient. Low-carbon would not cost
much more, and fuel savings could fully offset additional investment costs.
• But if we lock-in the wrong path, we risk significant economic and social
impacts of climate change. Need to act urgently.
• There are multiple economic benefits of action, e.g. reduced health costs
from air pollution, less congestion & road deaths, enhanced energy, water
and food security. In many cases these will outweigh the costs of action.

56
Key drivers of growth and climate performance
RESOURCE
EFFICIENCY
INNOVATION
INFRASTRUCTURE
INVESTMENT
HIGH QUALITY, RESILIENT, INCLUSIVE = BETTER GROWTH
ENERGY LAND
USE CITIES
WIDER
ECONOMY

57
A different model of urban development is possible:
Atlanta and Barcelona have similar populations and wealth
levels but very different carbon productivities
Atlanta’s built-up area Barcelona’s built-up area
Population: 5.26 million
Total area: 16,605 km2
Urban area: 7692 km2
Transport carbon emissions: 6.9 tonnes CO2 p.c.
Population: 5 million
Total area: 3263 km2
Urban area: 648 km2
Transport carbon emissions: 1.2 tonnes CO2 p.c.
ATLANTA BARCELONA
Source: LSE research, drawing on data from Atlanta Regional Commission
(2014), Autoritat del Transport Metropolita (Area de Barcelona) (2013), GenCat
(2013), UCSB (2014), D’Onofrio (2014), based on latest data.

Per capita emissions of CO2 equivalent (2011)
Source: Cai et al. 2013, Hoornweg et al. 2011, Olivier et al. 2012

59
0
50
100
150
200
250
300
350
400
450
500
550
600
2005 2010 2015 2020
Source: Citi Research 2012; Bloomberg NEF (Turner 2013); AIE, World Energy Outlook 2013, WEO 2012
Cost of wind energy
USD/MWh
2000 2005 2010 2015 2020
150
100
90
160
140
130
120
110
50
70
60
80
10
0
Coal
Natural
gas
Cost of solar energy (solar panels)
USD/MWh
Actual Predicted Actual Predicted
2012 2012 Note: The graph shows a world average. In some markets
the cost of solar energy is competitive with other sources of
energy.
The cost of renewable energy is falling rapidly
Coal
Natural
gas

60
Wind turbines have evolved to have 100 times more power
generation capabilities than 30 years ago
Sources: Cityfix.com, NY Times, LSE and NCE Cities – Paper 03 Accessibility in Cities: Transport and Urban Form, p 10-11

61
A full accounting of the impact of a low carbon transition shows that
declining risks and operating costs could offset increased investment
needs
Financial Impact of a Coal to Renewable Energy Transition (2015-2035)

62

63
Investment in infrastructure: estimate for a low-carbon scenario
Source: OECD (2006, 2012), IEA ETP (2012), modelling by Climate Policy Initiative (CPI) for New Climate Economy (forthcoming), and New Climate Economy analysis.
$88
INCLUDES
REDUCTIONS IN
OPERATING
EXPENDITURES

65
Next steps The Global Commission recommends 10 transformative
actions
Source: NCE. For details please see the NCE Global Action Plan (2014)
1 Integrate climate risk into strategic decisions
Secure a strong international climate agreement
End perverse subsidies
Price carbon to send a clear market signal
Scale-up low-carbon innovation
Reduce the cost of capital for low-carbon investment
Move toward connected and compact cities
End deforestation
Restore degraded lands
Phase out unabated coal fast
2
3
4
5
6
7
8
9
10


Smart economic policies can provide a partial fix
Failures • Environmental externalities • Under-provision of public goods • Missing markets • Asymmetrical information • Insecure property rights • Competitive barriers
Fixes • Getting prices right • Sustained public investments • Payments for ecosystem services • Labeling and 3rd party certification • Tenure reform, benefit sharing • Fair trade agreements

National government role in the ‘fixes’ is critical
Green/Circular/
Low Carbon
Economy
Regulations
Cap and trade
Efficiency standards
Land zoning
Tax policy
Pollution taxes
Production tax credits
User fees
Expenditure policy
Public procurement
Feed-in tariffs
Ecosystem restoration
Subsidy removal

Ultimately … advancing a green/circular/low carbon economy is a political economy question
• Who has power?
• Who has control over resources?
• Who is involved in decisions?
• Where are vested interests?
• Are decisions transparent?
• Is there accountability?
• Is there adequate information?

Thank you !
@KittyvdHeijden