healthy people 2020: who’s leading the leading health
TRANSCRIPT

Healthy People 2020:
Who’s Leading the
Leading Health Indicators?
Carter Blakey
Deputy Director
Office of Disease Prevention and Health Promotion

Who’s Leading the Leading
Health Indicators?
Leading Health Indicators are:
■
■
■
Critical health issues that, if addressed appropriately, will dramatically reduce the leading causes of preventable deaths and illnesses.
Linked to specific Healthy People objectives.
Intended to motivate action to improve the health of the entire population.
1200 Healthy People measures
LHIs are a subset of Healthy People
measures
Who’s Leading the Leading
Health Indicators?
■
■
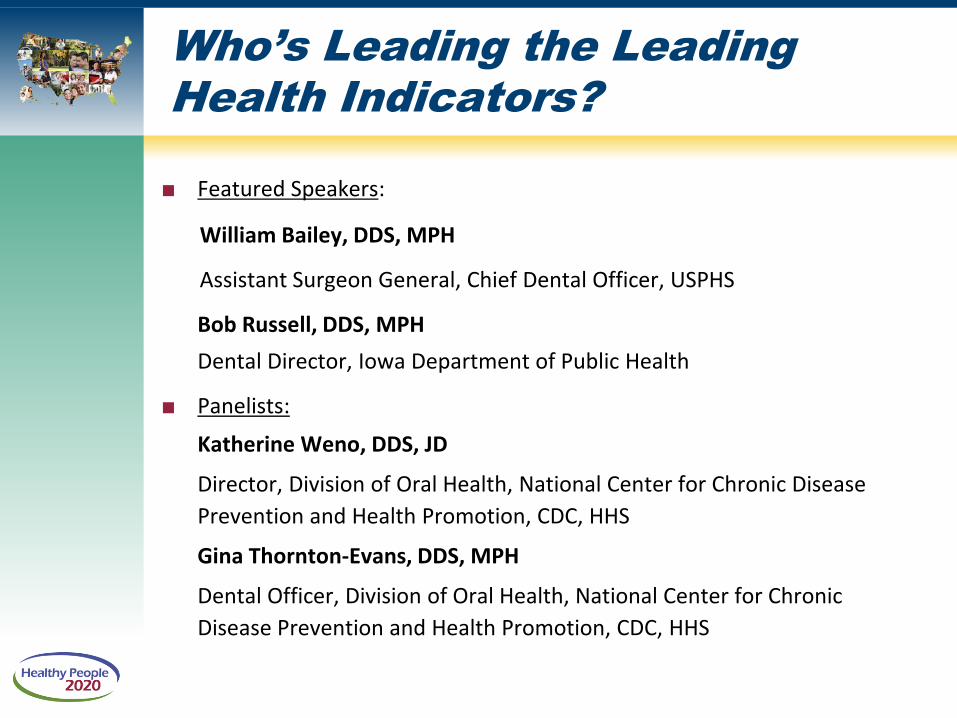
Featured Speakers:
William Bailey, DDS, MPH
Assistant Surgeon General, Chief Dental Officer, USPHS
Bob Russell, DDS, MPH
Dental Director, Iowa Department of Public Health
Panelists:
Katherine Weno, DDS, JD
Director, Division of Oral Health, National Center for Chronic Disease
Prevention and Health Promotion, CDC, HHS
Gina Thornton-Evans, DDS, MPH
Dental Officer, Division of Oral Health, National Center for Chronic
Disease Prevention and Health Promotion, CDC, HHS

William Bailey, DDS, MPH
Assistant Surgeon General
Chief Dental Officer, USPHS
Oral Health: Beyond Brushing
■
■
–
■
–
–
–
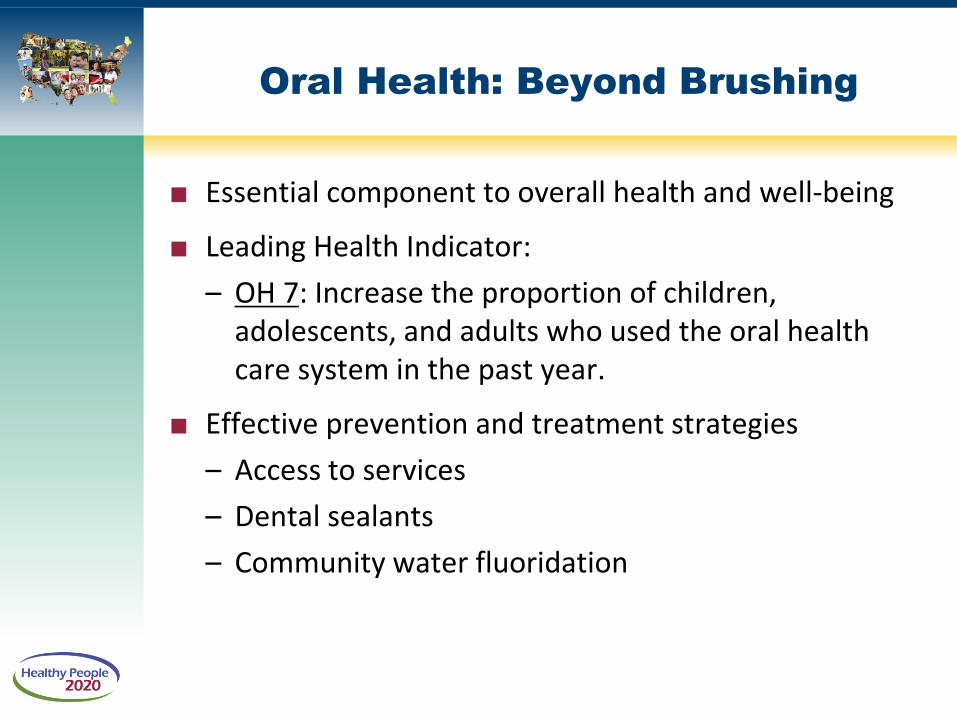
Essential component to overall health and well-being
Leading Health Indicator:
OH 7: Increase the proportion of children, adolescents, and adults who used the oral health care system in the past year.
Effective prevention and treatment strategies
Access to services
Dental sealants
Community water fluoridation

Barriers to Oral Health
■
–
–
■
–
Care across the lifespan
Underserved populations
Older adults
Support from the Affordable Care Act
Medicaid expansion projects
0
10
20
30
40
50
60
1995 2000 2005 2010
Percent
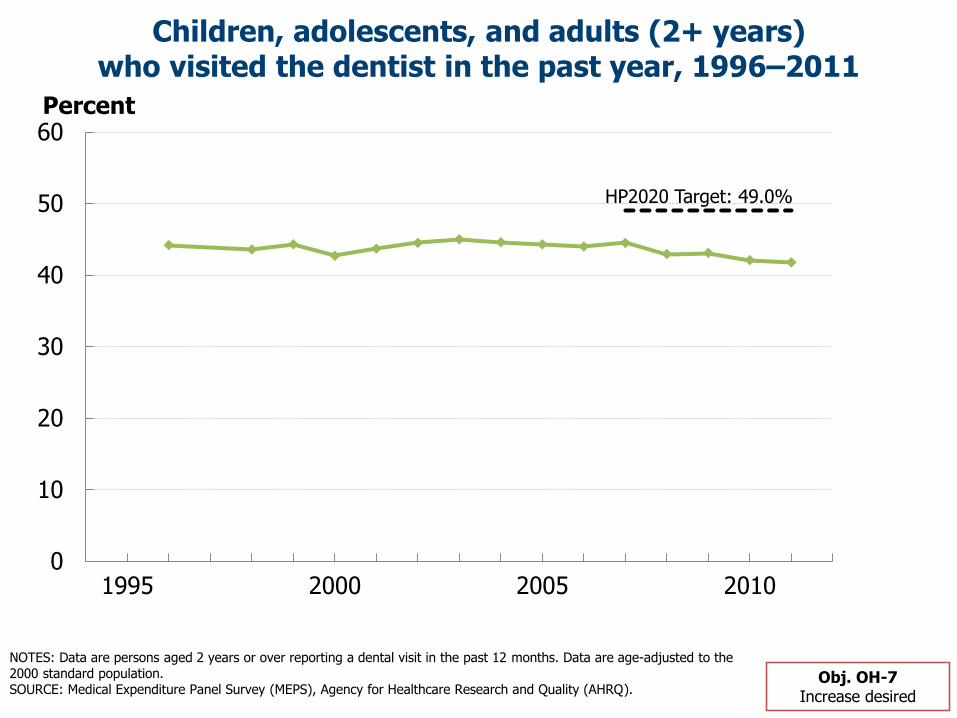
Children, adolescents, and adults (2+ years) who visited the dentist in the past year, 1996–2011
HP2020 Target: 49.0%
Obj. OH-7 Increase desired
NOTES: Data are persons aged 2 years or over reporting a dental visit in the past 12 months. Data are age-adjusted to the 2000 standard population. SOURCE: Medical Expenditure Panel Survey (MEPS), Agency for Healthcare Research and Quality (AHRQ).

0
10
20
30
40
50
60
Total NativeHawaiian
Hispanic Black AmericanIndian
Asian White
Percent
Children, adolescents, and adults (2+ years) who visited the dentist in the past year by race/ethnicity, 2011
NOTES: I = 95% confidence interval. Data are persons aged 2 years or over reporting a dental visit in the past 12 months. Black and White exclude persons of Hispanic origin. Persons of Hispanic origin may be any race. American Indian includes Alaska Native. Native Hawaiian includes other Pacific Islanders. Respondents were asked to select one or more races. Data for the single race categories shown are for persons who reported only one racial group. Data are age adjusted to the 2000 standard population. SOURCE: Medical Expenditure Panel Survey (MEPS), Agency for Healthcare Research and Quality (AHRQ).
HP2020 Target: 49.0%
Obj. OH-7 Increase desired
0
10
20
30
40
50
60
Total 2-4 5-11 12-17 18-24 25-44 45-54 55-64 65-74 75-84 85+
Percent
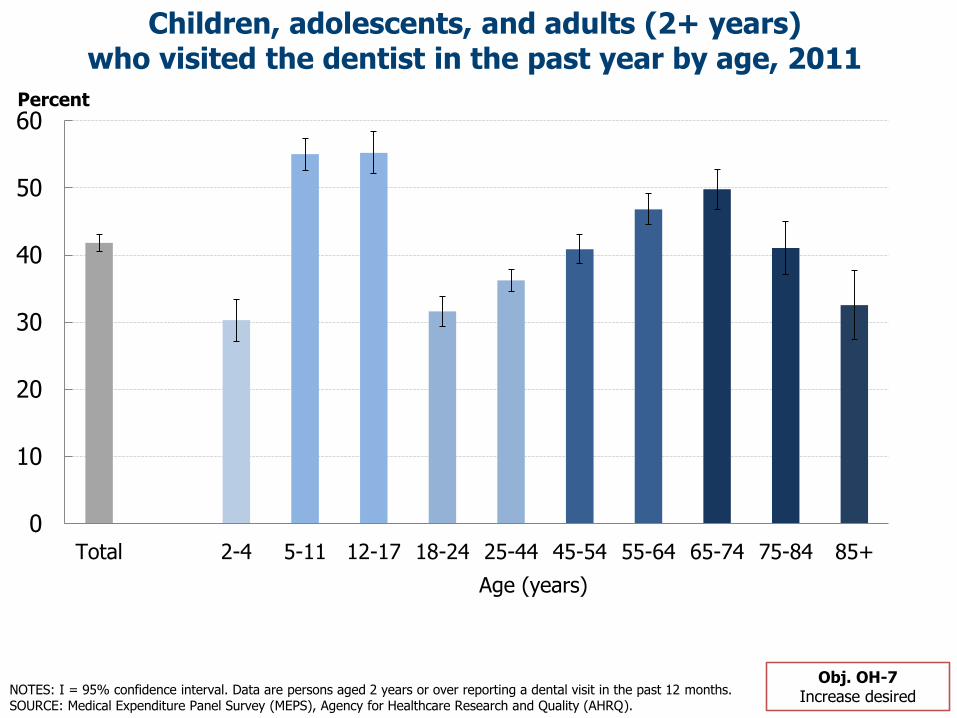
Children, adolescents, and adults (2+ years) who visited the dentist in the past year by age, 2011
NOTES: I = 95% confidence interval. Data are persons aged 2 years or over reporting a dental visit in the past 12 months. SOURCE: Medical Expenditure Panel Survey (MEPS), Agency for Healthcare Research and Quality (AHRQ).
Obj. OH-7 Increase desired
Age (years)

Bob Russell, DDS, MPH
Iowa Department of Public Health
Steps for improving dental care delivery

Iowa Prior to 2005
•
•
•
•
•
•
Dental care access is a growing problem for low-income, Medicaid enrolled, uninsured, and minority populations
Practice maldistribution and an aging dental workforce
Many general dentists express discomfort treating children under age 4
Medicaid rates did not assure dental participation or access to care
Little public education in dental disease prevention
Difficult to locate dental services
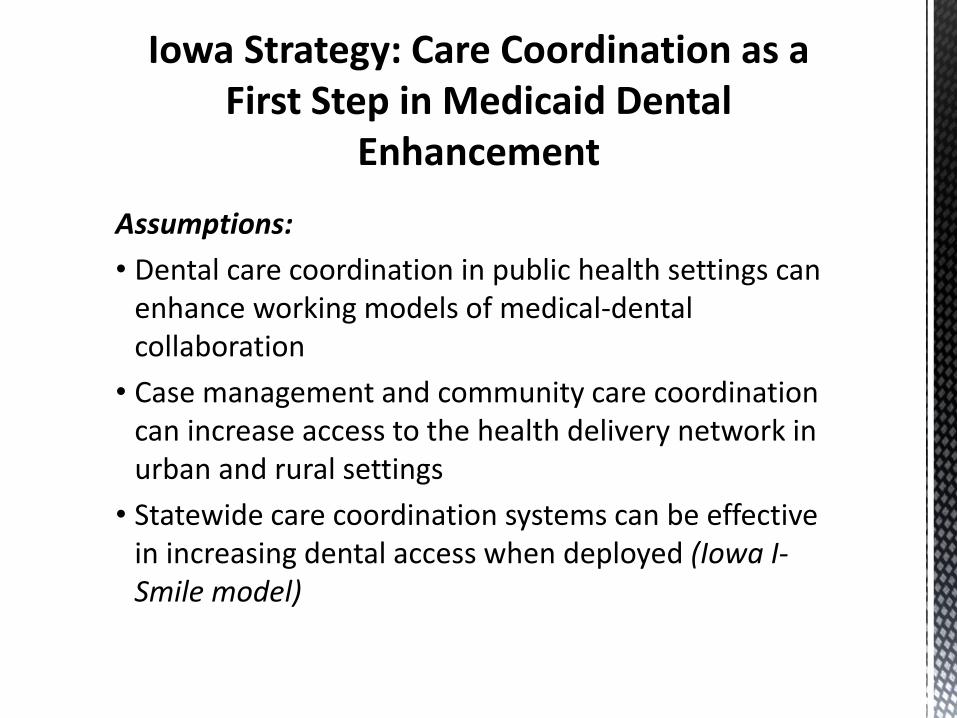
Assumptions:
•
•
•
Dental care coordination in public health settings can enhance working models of medical-dental collaboration
Case management and community care coordination can increase access to the health delivery network in urban and rural settings
Statewide care coordination systems can be effective in increasing dental access when deployed (Iowa I-Smile model)

Creating I-Smile
Iowa Dept. of Human Services
Iowa Dept. of Public Health
Community-based Title V Child Health Agencies
Interagency Agreement
Subcontract / Employment
Hygienists as Local Providers
Contract
Federal Department of Health and Human Services
Title V Title XIX
Screening Center
Number
•
•
•
•
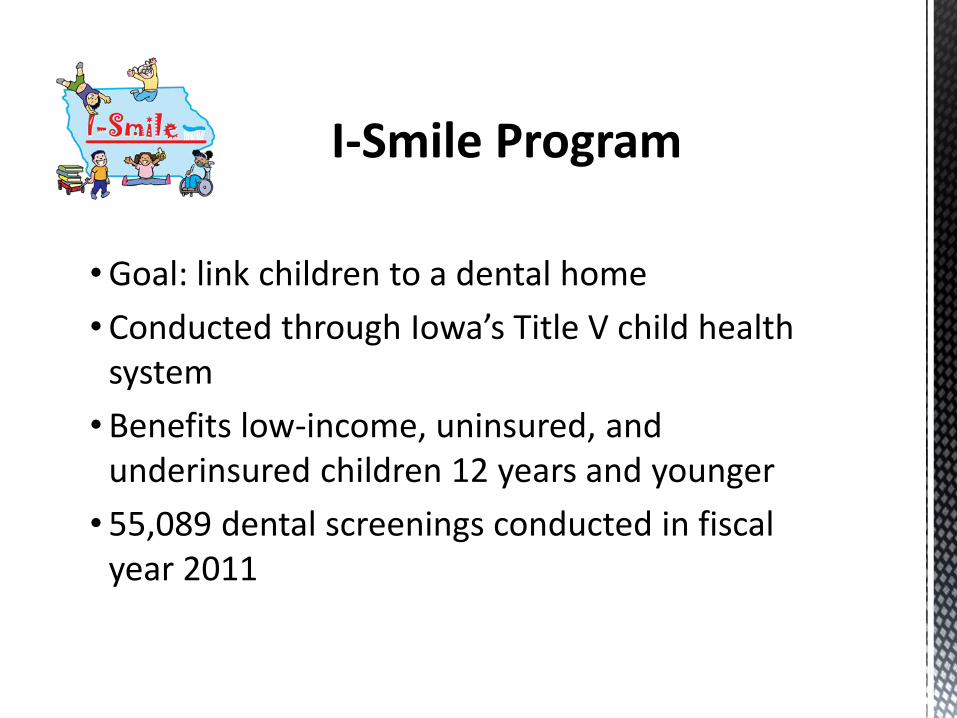
Goal: link children to a dental home
Conducted through Iowa’s Title V child health system
Benefits low-income, uninsured, and underinsured children 12 years and younger
55,089 dental screenings conducted in fiscal year 2011

I-Smile Primary Benefits
Statewide Dental Care Coordination: •
•
•
•
•
Provide families with the names and locations of dental providers
Link medical providers with sources of dental care
Assist families with appointments
Arrange support services, such as transportation and translation
Maintain statewide tracking database and registry

I-Smile: Special Targeted Population
Children Ages 5 and Under
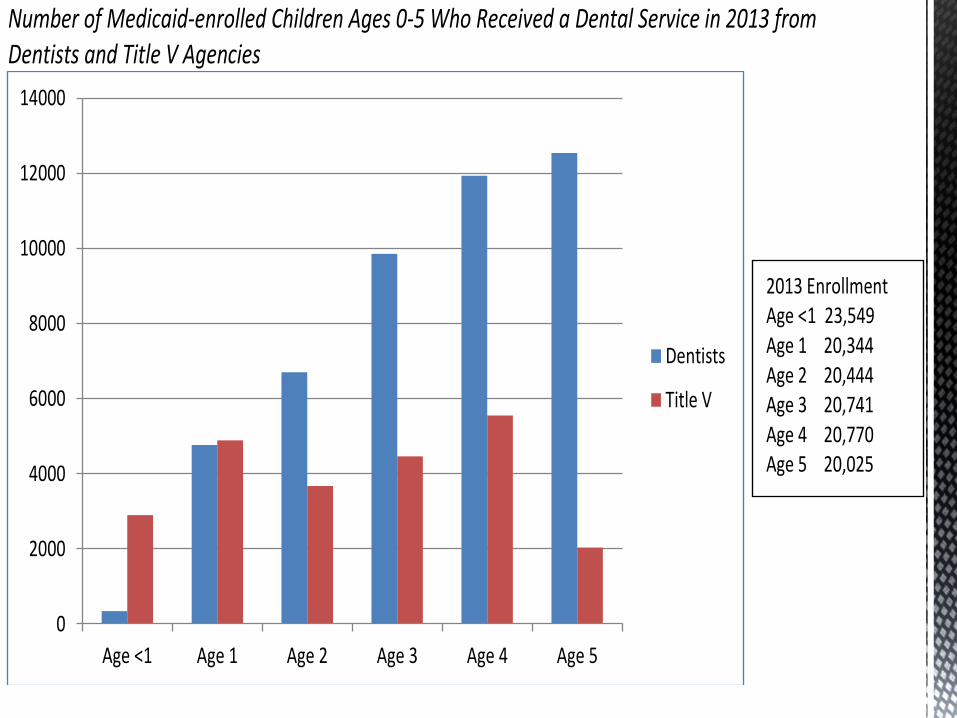
Number of Medicaid-enrolled Children Ages 0-5 Who Received a Dental Service in 2013 from Dentists and Title V Agencies
0
2000
4000
6000
8000
10000
12000
14000
Age <1 Age 1 Age 2 Age 3 Age 4 Age 5
Dentists
Title V
2013 Enrollment Age <1 23,549 Age 1 20,344 Age 2 20,444 Age 3 20,741 Age 4 20,770 Age 5 20,025

•
•
•
•
•
Expand to include adults aged 19-64 – Iowa Health and Wellness Program/Medicaid Expansion Pilot (May, 2014)
Increase agency networks beyond Title V – ACOs, Area Aging Agencies, etc…
Increase outreach and promotion
Improvement in payment systems under Medicaid and Marketplace Exchanges = more dental provider participation increasing available dental homes (in planning stage)
Increase care coordination and opportunities for integrated health home efforts.

Bob Russell, DDS, MPH State of Iowa Public Health Dental Director
515-281-4916 e-mail: [email protected]

Roundtable Discussion Please take a moment to fill out our brief survey.
Healthy People 2020
Progress Review Webinar
Mental Health Mental Disorders and Substance Abuse
February 2014
Please join us as we review the progress of select Healthy People 2020 objectives in the
Mental Health Mental Disorders and Substance Abuse Topic Areas.
To learn more and to register, visit: www.healthypeople.gov
Additional Resources
■
–
■
–
I-Smile Program (Iowa Department of Public Health)
http://www.idph.state.ia.us/ohds/OralHealth.aspx?prog=OHC&pg=Reports
Healthy People 2020 Oral Health Topic Area
http://www.healthypeople.gov/2020/topicsobjectives2020/overview.aspx?topicid=32

Stay Connected
Visit healthypeople.gov to learn more about the Healthy People 2020 Leading Health Indicators.
To receive the latest information about Healthy People 2020 and related events, visit our website to:
Join the Healthy People 2020 Consortium
Share how your organization is working to achieve Healthy People goals
Follow us on Twitter @gohealthypeople
Join our Healthy People 2020 group on LinkedIn
Watch past Webinars at www.YouTube.com/ODPHP

Q&A Slides
0
10
20
30
40
50
60
70
80
90
1997 1999 2001 2003 2005 2007 2009 2011 2013
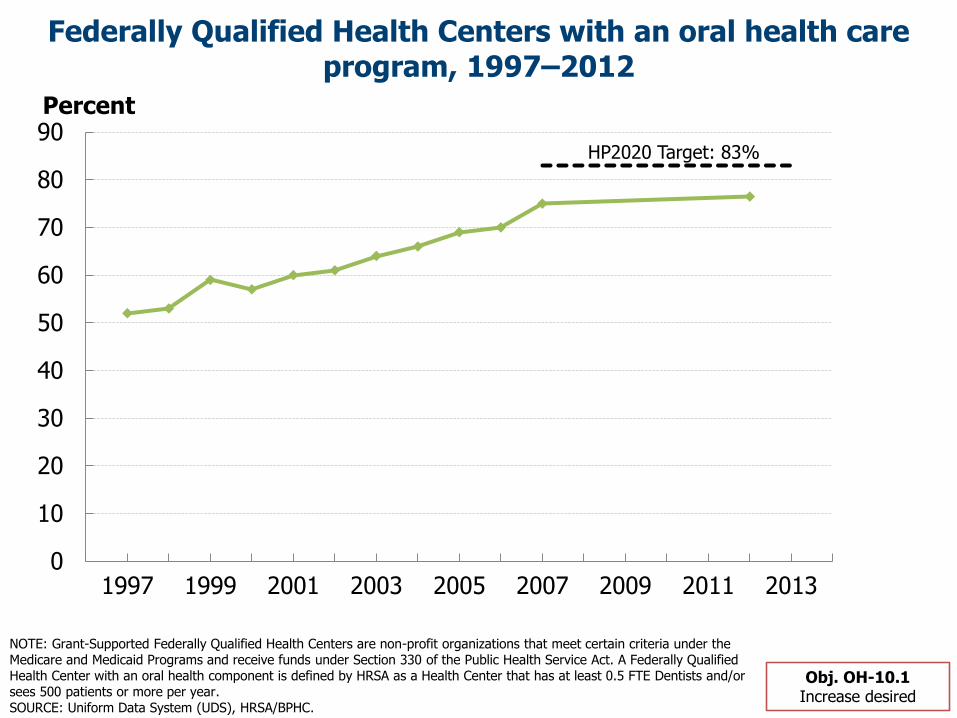
Percent
Federally Qualified Health Centers with an oral health care program, 1997–2012
HP2020 Target: 83%
Obj. OH-10.1 Increase desired
NOTE: Grant-Supported Federally Qualified Health Centers are non-profit organizations that meet certain criteria under the Medicare and Medicaid Programs and receive funds under Section 330 of the Public Health Service Act. A Federally Qualified Health Center with an oral health component is defined by HRSA as a Health Center that has at least 0.5 FTE Dentists and/or sees 500 patients or more per year. SOURCE: Uniform Data System (UDS), HRSA/BPHC.

0
10
20
30
40
50
2007 2011
Percent
Patients at Federally Qualified Health Centers receiving dental services, 2007 and 2012
NOTE: Data are for patients that receive any health service (including oral health services) at Federally Qualified Health Centers who receive oral health services. Grant-Supported Federally Qualified Health Centers are non-profit organizations that meet certain criteria under the Medicare and Medicaid Programs and receive funds under Section 330 of the Public Health Service Act. SOURCE: Uniform Data System (UDS), HRSA/BPHC.
HP2020 Target: 33.3%
Obj. OH-11Increase desired

Ages 0-2 Ages 3-5 Ages 6-9 Ages 10-12 Ages 0-12
Baseline Current Baseline Current Baseline Current Baseline Current Baseline Current
2005 2013 2005 2013 2005 2013 2005 2013 2005 2013
Number of
children receiving a service
4,901 11,806 21,832 34,327 26,994 42,738 17,466 26,027 71,193 114,898
Total Enrolled
48,573 64,337 40,396 61,536 43,981 68,472 30,726 44,214 163,676 238,559
Increase in
number 6,905 12,495 15,744 8,561 43,705
Percent increase
141% 57% 58% 49% 61%
Rate of increase
2.4 times 1.6 times 1.6 times 1.5 times 1.6 times
Number of Medicaid-enrolled children ages 0-12 receiving a dental service from dentists
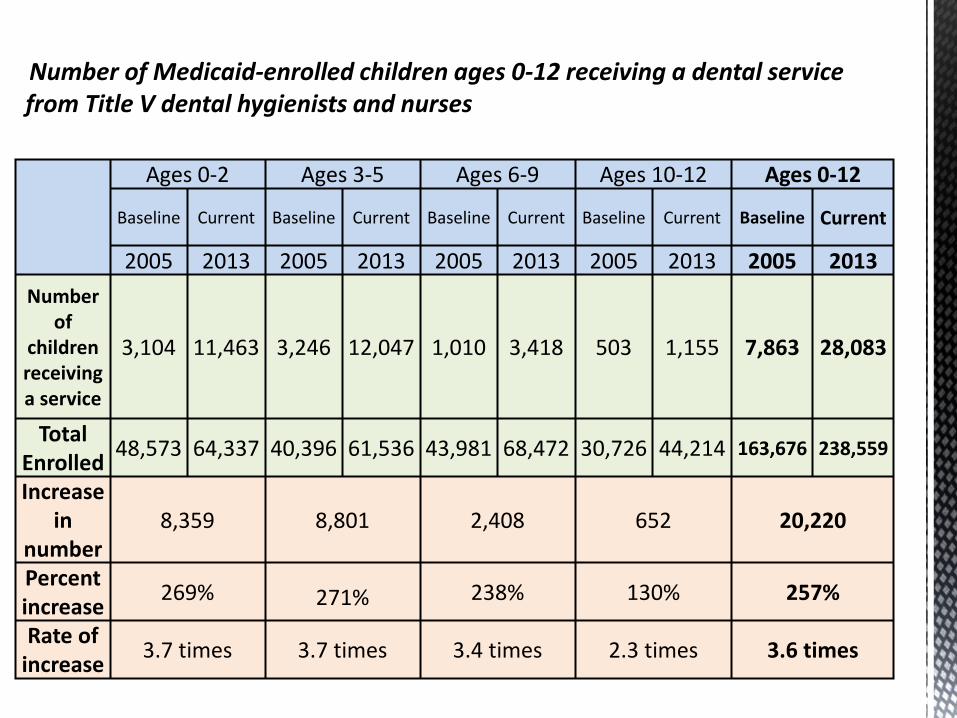
Ages 0-2 Ages 3-5 Ages 6-9 Ages 10-12 Ages 0-12
Baseline Current Baseline Current Baseline Current Baseline Current Baseline Current
2005 2013 2005 2013 2005 2013 2005 2013 2005 2013
Number of
children receiving a service
3,104 11,463 3,246 12,047 1,010 3,418 503 1,155 7,863 28,083
Total Enrolled
48,573 64,337 40,396 61,536 43,981 68,472 30,726 44,214 163,676 238,559
Increase in
number 8,359 8,801 2,408 652 20,220
Percent increase
269% 271% 238% 130% 257%
Rate of increase
3.7 times 3.7 times 3.4 times 2.3 times 3.6 times
Number of Medicaid-enrolled children ages 0-12 receiving a dental service from Title V dental hygienists and nurses
3131
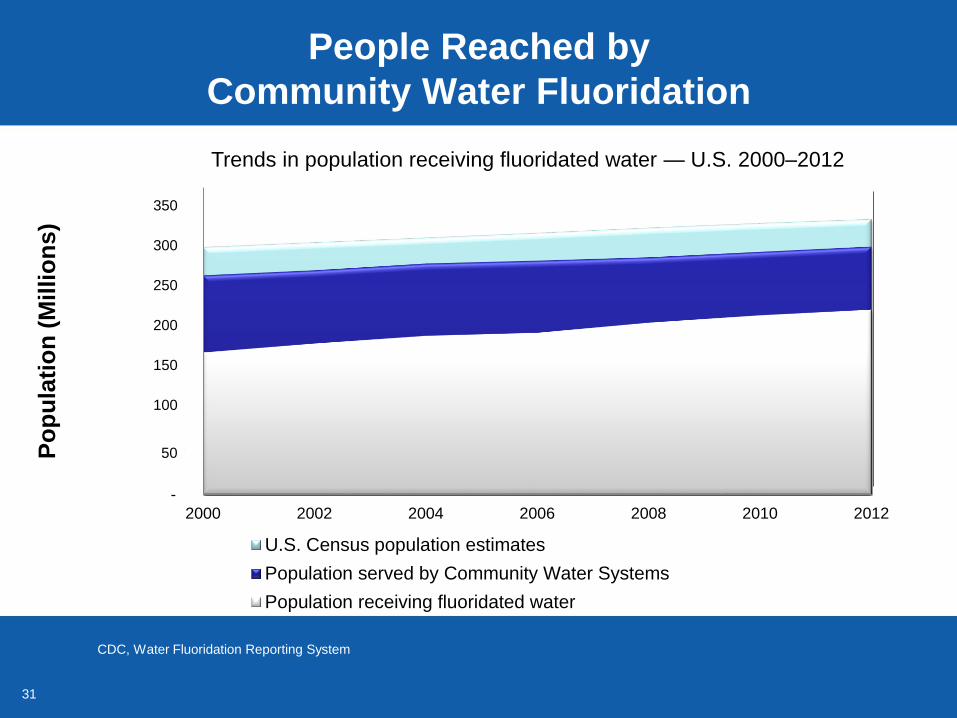
People Reached by
Community Water Fluoridation
-
50,000,000
100,000,000
150,000,000
200,000,000
250,000,000
300,000,000
350,000,000
2000 2002 2004 2006 2008 2010 2012
Po
pu
lati
on
(M
illi
on
s)
Trends in population receiving fluoridated water — U.S. 2000–2012
U.S. Census population estimates
Population served by Community Water Systems
Population receiving fluoridated water
CDC, Water Fluoridation Reporting System
50
100
150
200
250
300
350

I-Smile Activities
•
••
•
•
•
Care Coordination and Public Dental Educational Network
Oral Screening and Risk Assessment Determine future dental disease risk, current oral health status, and level of care needed for each child
Provide training on screening and fluoride varnish technique for non-dental healthcare providers
24 Licensed dental hygienists cover 22 regions,
within Iowa which includes all 99 counties
Public Health Supervision Rules under the Iowa
Dental Board allows expanded functions for
hygienists outside the traditional dental office

I-Smile Background Activities
••
•
•
•
Preventive Oral Health Services Fluoride varnish
Dental Sealants
Cleanings
School dental screenings
Locations: child health clinics, WIC clinics, Head Start centers, child care centers, schools
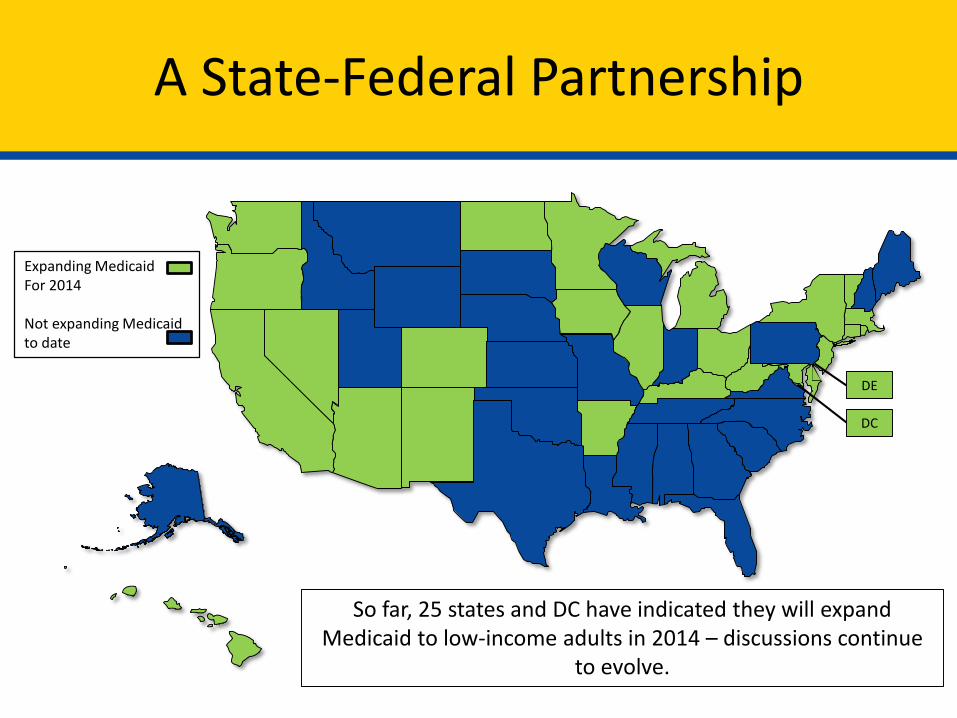
A State-Federal Partnership
DC
DE
Expanding Medicaid For 2014
Not expanding Medicaid to date
So far, 25 states and DC have indicated they will expand Medicaid to low-income adults in 2014 – discussions continue
to evolve.