healthy people statistical notes · healthy people statistical notes . ... centers for disease...
TRANSCRIPT
Healthy People Statistical Notes Number 27 February 2016
Measuring Progress Toward Target Attainment and the Elimination of Health Disparities in Healthy People 2020 by Makram Talih, Ph.D.; and David T. Huang, Ph.D., M.P.H., C.P.H., Office of Analysis and Epidemiology
Abstract
Introduction—Healthy People is an initiative of the U.S. Department of Health and Human Services that provides science-based, 10-year national objectives for improving the health of all Americans. As in the previous three decades, Healthy People 2020 (HP2020) has established overarching goals and objectives, and is monitoring progress toward the attainment of its targets as well as the elimination of health disparities among population groups. This Statistical Note discusses the HP2020 measurement practices, contrasting them with those that were in place in Healthy People 2010 (HP2010) and highlighting their strengths and limitations.
Objective—This Statistical Note documents the HP2020 methodology for measuring progress toward target attainment and the elimination of health disparities, with a particular focus on methodological considerations for the interpretation of findings.
Progress toward target attainment— For HP2020, the “percent of targeted change achieved” still measures movement of objectives that are moving from their baselines toward their targets. However, for objectives moving away from their baselines and targets, the
U.S. DEPARCe
“absolute value of the percent change from baseline” is used to measure movement. In addition, unlike in HP2010, both the extent of the movement and its statistical significance (when measures of variability are available) are used to determine progress status in HP2020 (e.g., “improving,” “little or no detectable change,” or “getting worse”).
Comparisons to the best group rate— As in HP2010, all groups composing a population domain (e.g., race and ethnicity, education, or income) are compared to the group with the “best” (i.e., most favorable or least adverse) rate. However, HP2020 uses the ratio instead of the percent difference between the rates. In addition, HP2020 objectives that are expressed in terms of favorable outcomes to be increased no longer need to be re-expressed using the complementary adverse outcomes for comparisons to the best group rate.
Measures of overall health disparity— In addition to detailed comparisons to the best group rate, HP2020 provides measures that quantify the degree of disparity overall across all groups composing a population domain. Unlike in HP2010, where a single relative measure, the summary index, was used, HP2020 uses three measures that include
TMENT OF HEALTH AND HUMAN Snters for Disease Control and Prevention
National Center for Health Statistics
both absolute and relative measures of overall disparity: a) the simple difference between the highest and lowest rates, irrespective of intermediate rates; b) the ratio between the highest and lowest rates, irrespective of intermediate rates; c) and a summary rate ratio between the best group rate and the average rate for all other groups in a population domain. For objectives expressed in terms of adverse outcomes, the HP2010 “index of disparity” is obtained by subtracting 1 from the HP2020 summary rate ratio and multiplying by 100.
Conclusion—The multipronged approach to measurement in HP2020 addresses some of the complex methodological issues and limitations identified in the past decade as well as elsewhere in the literature.
Keywords: Healthy People objectives • measurement • population subgroups • health equity
ERVICES
2
Acknowledgments
The following individuals and teams have either contributed to the development of the Healthy People 2020 (HP2020) measures presented in this report or provided feedback that improved the presentation: Robert Francis, Jr. and the Health Promotion Statistics Branch (HPSB) programming team at NCHS; Jeffrey N. Pearcy and the HPSB research team; Carter R. Blakey, Deborah Hoyer, and the Office of Disease Prevention and Health Promotion’s Community Strategies Division at the U.S. Department of Health and Human Services; and Rebecca Hines, Richard J. Klein, and Diane M. Makuc (consultants).
Introduction This Statistical Note describes the Healthy People 2020
(HP2020) methodology for measuring progress toward target attainment and the elimination of health disparities, with a particular focus on methodological issues. The HP2020 measurement practices are contrasted with those in place for the Healthy People 2010 (HP2010) decade; see Statistical Note No. 25, Measuring Progress in Healthy People 2010 (1), as well as the Healthy People 2010 midcourse and final reviews (2,3).
Healthy People is an initiative of the U.S. Department of Health and Human Services (HHS) that provides science-based, 10-year national objectives for improving the health of all Americans. For three decades, Healthy People has established benchmarks and monitored progress over time to “encourage collaborations across communities and sectors, empower individuals toward making informed health decisions, and measure impact of prevention activities”; see http://www.healthypeople.gov/2020/About-Healthy-People. Healthy People 2020, the fourth decade of the initiative, was launched in December 2010.
Overarching goals The four overarching goals established for HP2020 are to:
● Attain high-quality, longer lives free of preventable disease, disability, injury, and premature death.
● Achieve health equity, eliminate disparities, and improve the health of all groups.
● Create social and physical environments that promote good health for all.
● Promote quality of life, healthy development, and healthy behaviors across all life stages.
Measurable objectives and targets There are more than 1,200 objectives in HP2020 spanning
42 topic areas, including just over 1,000 that were measurable as of June 2015. Each measurable objective has a nationally representative data source, baseline value, and target for specific improvements to be achieved by the year 2020. A few objectives have nationally representative data, yet they are tracked only for informational purposes, so they do not have 2020 targets. Just over 200 developmental objectives do not have baseline data, yet they have a potential data source and are included in HP2020 to highlight their public health importance and are expected to become measurable over the course of the decade.
Prior to their potential inclusion in HP2020, objectives are drafted by subject matter experts from various federal agencies. The proposed objectives are made available for public comment and are reviewed by the Healthy People Federal Interagency Workgroup. All objectives are approved by HHS before being added to the HP2020 initiative.
Whenever possible, targets for the HP2020 objectives are set using science-based methods, such as:
● Modeling
● Projecting trends
●Knowledge of scientific findings and current interventions
In the absence of adequate data, knowledge, or expertise, HP2020 targets generally are set using a projected 10% improvement relative to their baseline values. On a case-bycase basis, other target-setting methods are used as appropriate (e.g., minimal statistical significance; total elimination; maintaining baseline level; maintaining consistency with national programs, regulations, policies, or laws; or retention of HP2010 targets).
Complete information about HP2020, including the initiative’s history, its overarching goals, and objectives, is available from http://www.healthypeople.gov.
Population subgroups Measurable HP2020 objectives that are population-based
include data by demographic and socioeconomic categories, where available. For example, Table 1 shows HP2020 demographic and socioeconomic categories used to tabulate national data from the National Health Interview Survey (NHIS), which is the data source for over 100 measurable population-based HP2020 objectives.
HP2020 strives for consistency in tracking population groups; however, population categories may vary by data source or by objective, due to survey design, data collection constraints, or other considerations. Therefore, HP2020 population categories used to tabulate national data from data
Healthy People 2020 Statistical Notes

Table 1. Main population categories for HP2020 objectives from the National Health Interview Survey
Population categories Population categories
Total
Sex Female Male
Race and ethnicity American Indian or Alaska Native only Asian only Native Hawaiian or Other Pacific Islander only Black or African American only White only Two or more races Hispanic or Latino Not Hispanic or Latino
Black or African American only, not Hispanic or Latino White only, not Hispanic or Latino
Age group (years) Under 18
0–4 5–11 12–17
18–44 18–24 25–44
45–64 45–54 55–64
65 and over 65–74 75–84 85 and over
Educational attainment (persons aged 25 and over) Less than high school High school Some college Associate’s degree Four-year college degree Advanced degree
Family income (percent of poverty threshold) Less than 100% 100%–199% 200%–399% 400%–599% 600% and above
Family type Single Single parent with children Married couple or partners Two parent family with children Other
Country of birth United States Outside United States
Disability status Persons with activity limitations Persons without activity limitations
Geographic location Metropolitan Nonmetropolitan
Health insurance status (persons under age 65) Insured
Private Public
Uninsured
Marital status (persons aged 18 and over) Married Cohabiting partner Divorced or separated Widowed Never married
NOTE: Additional population categories may be added as needed.
SOURCE: CDC/NCHS, HP2020 database.
sources other than NHIS may differ from those listed in Table 1.
HP2020 population categories differ from those used in HP2010:
● Education and income. Both education and income are included in HP2020 data tables when they are available. In HP2010 data tables, only one of these variables typically was reported, even if the data source provided both. In addition, both education and income have a more granular disaggregation in HP2020 than that used in HP2010.
● New category options in HP2020. A number of options have been added to data tables in HP2020. Whereas some of these options were included in HP2010 when data were available (e.g., age, disability status, health insurance status, geographic location, and sexual orientation), other
Healthy People 2020 Statistical Notes
options are new for HP2020 (e.g., country of birth, family type, and marital status).
Several population categories may be limited to persons of a specific age group (e.g., educational attainment, marital status, veteran status, and health insurance status). The age groups that apply to these categories are specific to each objective and may vary by data source. Caution must be used when comparing data for population categories that use different age limits or when comparing to the total population.
Data may be either unavailable or not collected for population categories not shown in the HP2020 data tables. However, if the data for a population subgroup have been collected and analyzed but do not meet the criteria for statistical reliability, data quality, or confidentiality, the data are suppressed and marked accordingly in the data tables.
Detailed information about data suppression as well as additional considerations related to the demographic and
3

socioeconomic categories used in HP2020 are forthcoming from: http://www.cdc.gov/nchs/healthy_people/hp2020/ hp2020_data_issues.htm.
Multipronged Measure of Progress Toward HP2020 Targets
For HP2010 objectives that had at least two data points, the “percent of targeted change achieved” was used to quantify progress toward target attainment, unless the target had been met or exceeded at baseline. The formula for the “percent of targeted change achieved” was as follows:
Percent of Most recent value – Baseline value targeted change = × 100.
HP2010 target – Baseline value achieved
The “percent of targeted change achieved” expressed the difference between the baseline and the most recent value as a percent of the targeted change between the baseline and the HP2010 target. The “percent of targeted change achieved” was used to compare how much of the targeted change was achieved for an objective relative to other HP2010 objectives. For more information about the measurement of progress toward target attainment in HP2010, see Appendix I.
As learned in the Healthy People 2010 Final Review (3), there are various limitations to using the “percent of targeted change achieved” as the sole measure of progress toward target attainment, some of which are listed here:
● The “percent of targeted change achieved” is calculated using only the target, baseline, and most recent data points. Fluctuations during the intervening years are not considered.
● The number of years between the baseline and most recent data points might vary between objectives (e.g., data systems may have different data collection frequencies).
● Two objectives may be identical in their “percent of targeted change achieved,” even though they differ in the amount of both the targeted and realized change from baseline.
● Objectives moving away from their targets and those whose targets are exceeded at the baseline yield a negative “percent of targeted change achieved” value, and these negative values are difficult to interpret.
For HP2020, the “percent of targeted change achieved” still quantifies progress for objectives that are moving toward their targets. However, for objectives moving away from their baselines and targets, the “absolute value of the percent change from baseline” is used to measure movement. An objective that moves away from its baseline and target would
4
need to make up the deficit from baseline in addition to the desired targeted change once the baseline value is regained.
In HP2010, the amount and statistical significance of the “percent of targeted change achieved” were not considered in determining an objective’s progress status. For HP2020, both the extent of the movement and its statistical significance (when measures of variability are available) are used to determine an objective’s progress status. Thus, in addition to HP2020 objectives where the values at baseline and most recent data points are equal, those objectives with available standard errors for which movement was not statistically significant, and those with no available standard errors for which movement was less than 10%, are all qualified as having demonstrated “little or no detectable” change.
Classification of objective progress status in HP2020 HP2020 objectives are classified according to the status
of their progress toward their targets or away from their baselines, as shown in Table 2.
Determination of objective progress status in HP2020
Objectives that met or exceeded their targets ● When the desired direction is increase, an objective has
met or exceeded its target at the most recent data point if most recent value ≥ HP2020 target.
● When the desired direction is decrease, an objective has met or exceeded its target at the most recent data point if most recent value ≤ HP2020 target.
HP2020 objectives that met or exceeded their targets at the most recent data point are designated by a TARGET MET progress status indicator. Even though statistical significance, when measures of variability are available, is not factored into the determination of the TARGET MET status, the movement is still evaluated for statistical significance; see Table 3 for an example.
Objectives moving toward their targets
Direction ● When the desired direction is increase, an objective is
moving toward its target at the most recent data point if baseline value < most recent value < HP2020 target.
● When the desired direction is decrease, an objective is moving toward its target at the most recent data point if baseline value > most recent value > HP2020 target.
Healthy People 2020 Statistical Notes

Table 2. Classification of HP2020 objectives, by progress status
Objective status Short explanation
TARGET MET Target met or exceeded
IMPROVING Movement is toward the target and is either: – Statistically significant when measures of variability are available. – OR – Ten percent or more of the targeted change when measures of variability are unavailable.
LITTLE OR NO Objective demonstrates little or no detectable DETECTABLE CHANGE change, because either:
– Movement toward the target is not statistically significant when measures of variability are available. – OR – Movement is toward the target but the objective has achieved less than 10% of the targeted change when measures of variability are unavailable. – OR – Movement away from the baseline and target is not statistically significant when measures of variability are available. – OR – Movement is away from the baseline and target but the objective has moved less than 10% relative to its baseline when measures of variability are unavailable. – OR – No change between baseline and most recent data point.
GETTING WORSE Movement is away from the baseline and target and is either: – Statistically significant when measures of variability are available. – OR – Ten percent or more relative to the baseline when measures of variability are unavailable.
BASELINE ONLY Baseline data only; progress cannot be assessed.
INFORMATIONAL Objective is informational (does not have a target).
DEVELOPMENTAL Objective is developmental (does not have baseline data).
SOURCE: CDC/NCHS, HP2020 database.
Extent of movement toward target For HP2020 objectives that had not already met or
exceeded their targets at baseline, the “percent of targeted change achieved” measures the extent of movement toward the target. It is given by:
Percent of Most recent value – Baseline value targeted change = × 100.
HP2020 target – Baseline value achieved
Statistical significance for objectives moving toward, or meeting or exceeding their targets In HP2010, statistical significance of the “percent
of targeted change achieved” was not evaluated when measures of variability were available. Instead, the statistical significance of the simple difference “most recent value – baseline value” was assessed to determine whether the change from baseline to the most recent value was statistically significant, irrespective of the target.
In HP2020, statistical significance of the “percent of targeted change achieved” is evaluated using Taylor linearization when measures of variability are available. A one-sided 0.05-level test is used.
When measures of variability are available, the IMPROVING status indicator is designated for a statistically significant “percent of targeted change achieved,” regardless of the amount of the change, whereas the LITTLE OR NO DETECTABLE CHANGE status indicator is designated for a “percent of targeted change achieved” that is not statistically significant, regardless of the amount of the change.
Several steps are required to evaluate statistical significance:
Step 1. The “percent of targeted change achieved” (or “progress quotient,” PQ) is based on the ratio of the simple difference SDt = Rt – Rb between the rate Rt at time t and the rate Rb at baseline and the targeted change SDT = RT – Rb between the target rate RT and the rate Rb at baseline:
SDtPQ = × 100.SDT
Because the “percent of targeted change achieved” is used only for HP2020 objectives that are moving toward, or meeting or exceeding their targets, PQ ≥ 0.
Step 2. The relative standard error (RSE) of the above ratio is computed based on the RSE of the numerator and the denominator. The RSE for the numerator, SDt , is calculated as:
SE2t + SE2
bRSESDt = ,| Rt – Rb |
Healthy People 2020 Statistical Notes
where SEt is the standard error at time t and SEb is the standard error at baseline.
Step 3. The RSE for the denominator, SDT , is calculated as:
SEbRSESDT= ,
| RT – Rb |
because the target RT does not contribute to the variability of the targeted change; it is constant.
Step 4. An approximate RSE for the PQ is computed using a first-order Taylor series linearization of the variance of the ratio of two random variables, with numerator and denominator RSEs, above:
2 2RSEPQ = RSESDt + RSESDT .
5
This approximation assumes the simple difference SDt is independent of the targeted change SDT .
Step 5. An approximate standard error SEPQ for the PQ is given by SEPQ = RSEPQ × PQ.
Step 6. Statistical significance of the PQ is assessed using the statistic z = PQ/SEPQ. Because PQ ≥ 0, statistical significance is based on a one-sided test, which, assuming normality, compares the value of z to 1.64485 for a 0.05-level test.
When measures of variability are unavailable, the IMPROVING status indicator is designated for objectives that are moving toward their targets and for which the “percent of targeted change achieved” is 10% or more. Objectives for which the “percent of targeted change achieved” is 100% or more have met or exceeded their targets and are designated as TARGET MET.
Objectives moving away from their baselines and targets
Direction ● When the desired direction is increase, an objective is
moving away from its baseline and target at the most recent data point if most recent value < HP2020 target and most recent value < baseline value.
● When the desired direction is decrease, an objective is moving away from its baseline and target at the most recent data point if most recent value > HP2020 target and most recent value > baseline value.
Extent of movement away from baseline Movement away from baseline is quantified using:
Most recent Baseline–Absolute value of value value percent change = × 100. from baseline Baseline value
A percent change from baseline of 10% or more in absolute value means that the objective is at least 10% in deficit relative to its baseline. Such an objective would need to make up the deficit from baseline in addition to the desired targeted change once the baseline value is regained.
Statistical significance for objectives moving away from their baselines and targets
When measures of variability are available, the GETTING WORSE status indicator is designated for a statistically significant “absolute value of percent change from baseline,” regardless of the value, whereas the LITTLE OR NO DETECTABLE CHANGE status indicator is designated for a percent change from baseline that is not statistically
6
significant, regardless of the value; for an example, see Table 3.
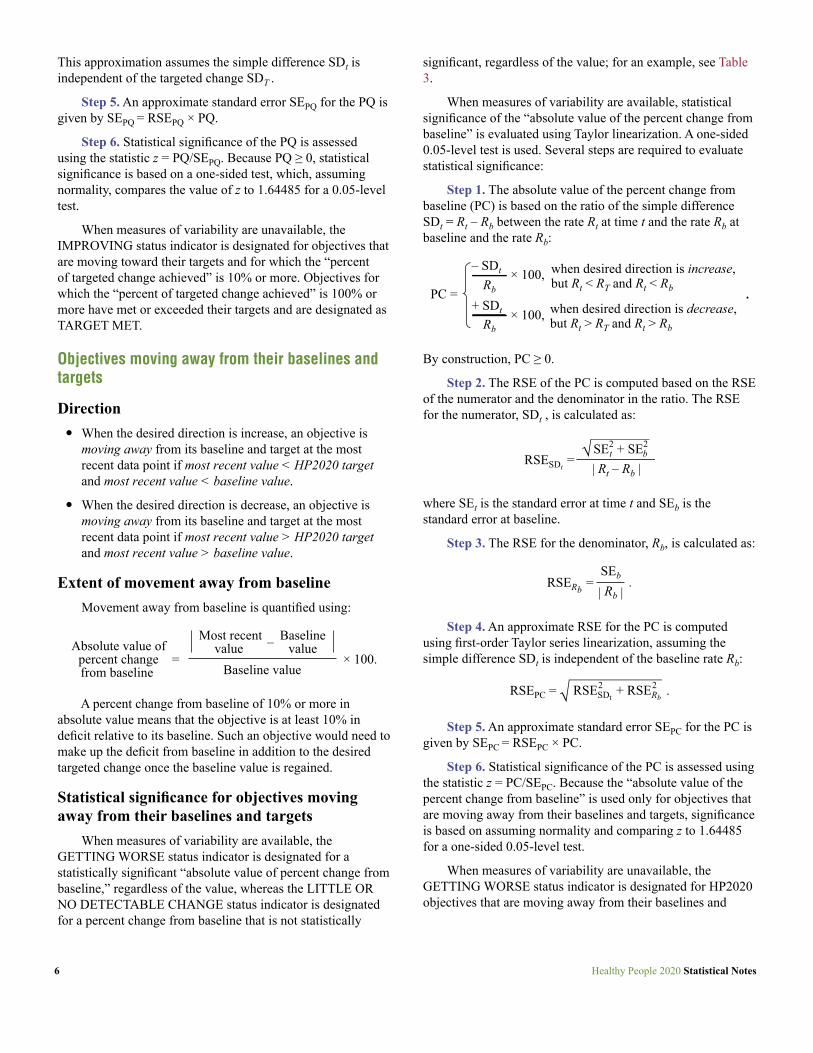
When measures of variability are available, statistical significance of the “absolute value of the percent change from baseline” is evaluated using Taylor linearization. A one-sided 0.05-level test is used. Several steps are required to evaluate statistical significance:
Step 1. The absolute value of the percent change from baseline (PC) is based on the ratio of the simple difference SDt = Rt – Rb between the rate Rt at time t and the rate Rb at baseline and the rate Rb:
– SDt when desired direction is increase,× 100,Rb but Rt < RT and Rt < RbPC = .
+ SDt when desired direction is decrease,× 100,Rb but Rt > RT and Rt > Rb
By construction, PC ≥ 0.
Step 2. The RSE of the PC is computed based on the RSE of the numerator and the denominator in the ratio. The RSE for the numerator, SDt , is calculated as:
SE2 t + SEb
2
RSESDt =
| Rt – Rb |
where SEt is the standard error at time t and SEb is the standard error at baseline.
Step 3. The RSE for the denominator, Rb, is calculated as:
SEbRSERb = .| Rb |
Step 4. An approximate RSE for the PC is computed using first-order Taylor series linearization, assuming the simple difference SDt is independent of the baseline rate Rb:
2 2RSEPC = RSESDt + RSERb
.
Step 5. An approximate standard error SEPC for the PC is given by SEPC = RSEPC × PC.
Step 6. Statistical significance of the PC is assessed using the statistic z = PC/SEPC. Because the “absolute value of the percent change from baseline” is used only for objectives that are moving away from their baselines and targets, significance is based on assuming normality and comparing z to 1.64485 for a one-sided 0.05-level test.
When measures of variability are unavailable, the GETTING WORSE status indicator is designated for HP2020 objectives that are moving away from their baselines and
Healthy People 2020 Statistical Notes
targets and for which the “absolute value of the percent change from baseline” is 10% or more.
Objectives for which progress toward target attainment cannot be assessed
Progress toward target attainment cannot be assessed when only baseline data are available, the target was met at baseline, or the objective’s desired direction is to “maintain the baseline.” In addition, progress toward target attainment is not assessed when an objective is informational and does not have a target (e.g., PH-7.3, Increase the proportion of population-based HP2020 objectives for which national data are available by socioeconomic status).
Illustration of HP2020 classification of objective status
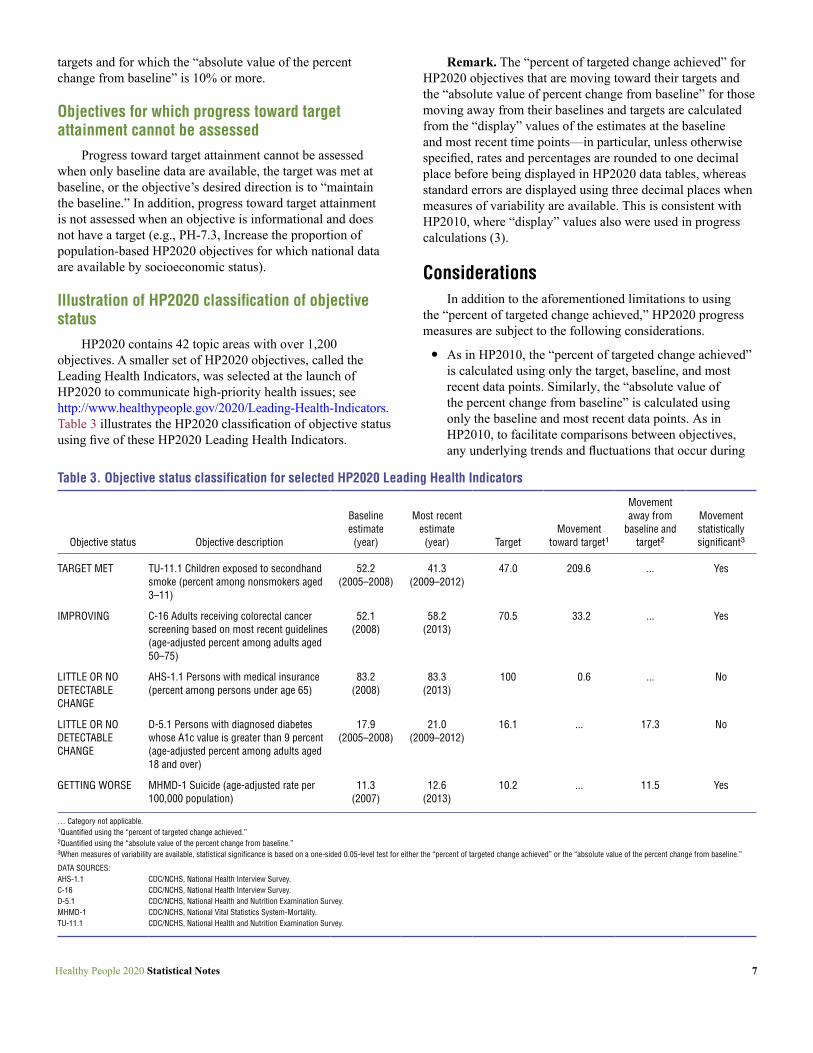
HP2020 contains 42 topic areas with over 1,200 objectives. A smaller set of HP2020 objectives, called the Leading Health Indicators, was selected at the launch of HP2020 to communicate high-priority health issues; see http://www.healthypeople.gov/2020/Leading-Health-Indicators. Table 3 illustrates the HP2020 classification of objective status using five of these HP2020 Leading Health Indicators.
Table 3. Objective status classification for selected HP2020 Lea
Objective status Objective description
Baseline estimate (year)
TARGET MET TU-11.1 Children exposed to secondhand smoke (percent among nonsmokers aged 3–11)
52.2 (2005–2008)
IMPROVING C-16 Adults receiving colorectal cancer screening based on most recent guidelines (age-adjusted percent among adults aged 50–75)
52.1 (2008)
LITTLE OR NO AHS-1.1 Persons with medical insurance 83.2 DETECTABLE CHANGE
(percent among persons under age 65) (2008)
LITTLE OR NO DETECTABLE CHANGE
D-5.1 Persons with diagnosed diabetes whose A1c value is greater than 9 percent (age-adjusted percent among adults aged 18 and over)
17.9 (2005–2008)
GETTING WORSE MHMD-1 Suicide (age-adjusted rate per 100,000 population)
11.3 (2007)
… Category not applicable. 1Quantified using the “percent of targeted change achieved.” 2Quantified using the “absolute value of the percent change from baseline.” 3When measures of variability are available, statistical significance is based on a one-sided 0.05-level test for e
DATA SOURCES: AHS-1.1 CDC/NCHS, National Health Interview Survey. C-16 CDC/NCHS, National Health Interview Survey. D-5.1 CDC/NCHS, National Health and Nutrition Examination Survey. MHMD-1 CDC/NCHS, National Vital Statistics System-Mortality. TU-11.1 CDC/NCHS, National Health and Nutrition Examination Survey.
Healthy People 2020 Statistical Notes
Remark. The “percent of targeted change achieved” for HP2020 objectives that are moving toward their targets and the “absolute value of percent change from baseline” for those moving away from their baselines and targets are calculated from the “display” values of the estimates at the baseline and most recent time points—in particular, unless otherwise specified, rates and percentages are rounded to one decimal place before being displayed in HP2020 data tables, whereas standard errors are displayed using three decimal places when measures of variability are available. This is consistent with HP2010, where “display” values also were used in progress calculations (3).
Considerations In addition to the aforementioned limitations to using
the “percent of targeted change achieved,” HP2020 progress measures are subject to the following considerations.
● As in HP2010, the “percent of targeted change achieved” is calculated using only the target, baseline, and most recent data points. Similarly, the “absolute value of the percent change from baseline” is calculated using only the baseline and most recent data points. As in HP2010, to facilitate comparisons between objectives, any underlying trends and fluctuations that occur during
ding Health Indicators
Movement Most recent
estimate (year) Target
Movement toward target1
away from baseline and
target2
Movement statistically significant3
41.3 (2009–2012)
47.0 209.6 ... Yes
58.2 (2013)
70.5 33.2 ... Yes
83.3 100 0.6 ... No (2013)
21.0 (2009–2012)
16.1 ... 17.3 No
12.6 (2013)
10.2 ... 11.5 Yes
ither the “percent of targeted change achieved” or the “absolute value of the percent change from baseline.”
7

the intervening years are not considered—because the number and spacing of data points between the baseline and most recent data points vary between objectives.
● As in HP2010, two objectives that are moving toward their targets may be identical in the “percent of targeted change achieved” even though they differ in the amount of the absolute change from baseline. Similarly, two objectives that are moving away from their baselines may be identical in the “absolute value of the percent change from baseline” even though they differ in the amount of the absolute change from baseline.
● The two measures of progress in HP2020—“percent of targeted change achieved” for objectives moving toward their targets and “absolute value of percent change from baseline” for objectives moving away from their baselines—are not comparable because they use different measurement standards—targeted change versus baseline value. For example:
o Objective MHMD-1 is getting worse, having increased by 1.3 percentage points from its baseline—a percent change from baseline of 11.5% in magnitude (Table 3).
o C-16 is improving, having increased by 6.1 percentage points from its baseline—realizing 33.2% of the targeted 18.4 percentage point change from baseline.
o If, instead, C-16 had achieved just 11.5% of its targeted change from baseline, then it would have increased by only 2.1 percentage points. Thus, even though the “percent of targeted change achieved” for C-16 would be equal to the “absolute value of the percent change from baseline” for MHMD-1, 11.5%, the amount of the absolute change from baseline for C-16 would be over 1.5 times that for MHMD-1 (2.1 versus 1.3 percentage points).
Measures of Health Disparities in HP2020
This section describes the measurement of health disparities and changes in disparities over time in HP2020. Detailed information on evaluating the statistical significance of the HP2020 health disparities measures when measures of variability are available is provided. The HP2020 disparities measures are also related to the corresponding HP2010 measures, which are described in Appendix II.
Motivation for adopting revised health disparities measures in HP2020
As is recognized in the Healthy People 2010 Final Review and established elsewhere in the literature, there are
8
important technical and conceptual considerations in the measurement and tracking of health disparities (3–7). Some of the considerations that were particularly relevant to the HP2010 health disparities measures and that have provided the impetus for developing the HP2020 health disparities measures are outlined below.
● The percent difference (PD) relative to the best group rate was measured only for adverse outcomes in HP2010; see Appendix II. Those dichotomous objectives that had been expressed in terms of favorable outcomes were re-expressed using the complementary adverse outcome for the purpose of computing the PD relative to the best group rate.
● Because the best group rate is theoretically achievable by other groups associated with a given population characteristic, the PD relative to the best group rate can highlight an opportunity for improvement (7). However:
o In HP2010, concerns about the stability of the best group rate, and, therefore, the reliability of disparities findings based on the percent differences from the best group rate, led to imposing a standard of reliability on its selection. When estimates of variability were available, the RSE of the rate identified as the best group rate was required to be less than 10%; if it was not, then the next best rate with RSE < 10% was used as the reference for evaluating disparities. As a result, the percent differences that were presented in Healthy People 2010 Final Review tended to be smaller than if this reliability standard had not been applied (3).
o The PD expresses disparity for the comparison group as a percent difference relative to the best group rate. However, to highlight opportunities for improvement, lack of parity with the best group rate is more readily expressed using the percent difference relative to the comparison group itself. For example, in 2008, approximately 28% of the American Indian or Alaska Native population under age 65 did not have health insurance, compared with 12% of the non-Hispanic white population under age 65 (best group rate; HP2010 objective 1-1). Thus, relative to the best group rate, PD = 133%. However, to express the amount by which the uninsurance rate among the American Indian or Alaska Native population under age 65 would need to be reduced in 2008 to achieve parity with the best group rate, the percent difference relative to the comparison group would be useful: 57%.
● In part for simplicity, but also in part due to the 10% reliability standard imposed on the best group rate, the standard error SEPD for the PD was not used in HP2010 for assessing the statistical significance of the percent difference, PD. Instead, the simple difference, SD, was tested for significance, and the PD was flagged whenever the SD was statistically significant at the 0.05 level (1).
Healthy People 2020 Statistical Notes

●Measures of health disparities reflect implicit value judgments and trade-offs, particularly in the choice of the reference for evaluating disparities, whether to measure disparities using the absolute or the relative scale, and whether to weight population groups equally or according to their size. These as well as other conceptual issues in the measurement of health disparities are discussed elsewhere; see (4,6,7).
Because findings of health disparities in HP2010, especially when using the relative scale, could be affected by whether an objective was expressed in terms of the favorable health outcome or its adverse complementary outcome (3,4), HP2020 set out to construct measures of health disparities that explicitly accounted for an objective’s directionality. In addition, to account for some of the conceptual issues around absolute versus relative disparities, HP2020 uses a suite of measures that includes both absolute and relative measures of overall disparity. The HP2020 approach to measuring health disparities using a suite of measures is consistent with current practices; for example, it is consistent with the National Cancer Institute’s health disparities calculator (8,9).
Comparisons to the best group rate in HP2020
HP2020 rate ratio (RRg)
Definition Let RB denote the best group rate and Rg denote any other
group’s rate. The rate ratio Rg /RB (a common relative measure in the epidemiologic literature) for comparing Rg to RB can be modified to yield the following pairwise measure, which will be referred to as the HP2020 rate ratio and denoted as RRg:
RB RgRRg = max , .Rg RB
Note that regardless of whether the objective is expressed as a favorable outcome to be increased—in which case RRg = RB /Rg—or as an adverse outcome to be decreased—for which RRg = Rg /RB— the HP2020 rate ratio RRg is constructed such that RRg ≥ 1.
Statistical significance When measures of variability are available, statistical
significance is based on assuming normality and comparing the test statistic to 1.64485 for a one-sided 0.05-level test. Because the distribution of the rate ratio is typically skewed to the right, the natural logarithm transformation is applied first, as described below.
When RB and Rg have standard errors SEB and SEg , respectively, and are assumed independent, an approximate
Healthy People 2020 Statistical Notes
standard error of the natural logarithm of the RRg is evaluated using the formula:
2 2SEB SEg
RB + Rg
.SEln(RRg) =
One-sided significance test for RRg
● Testing RRg = 1 versus RRg > 1 is equivalent to testing
ln(RRg) = 0 versus ln(RRg) > 0.
● The statistic for testing ln(RRg) = 0 versus ln(RRg) > 0 is given by:
z = ln(RRg)/SEln(RRg).
● The rate ratio RRg is statistically significant at the 0.05 level if z > 1.64485.
One-sided confidence interval for RRg
● The upper limit (UL) is computed via the inverse transformation as follows:
UL = exp{ln(RRg) + 1.64485 × SEln(RRg)}.
●A 95% confidence interval for RRg has lower limit = 1.000 and upper limit = UL.
Relation to percent difference from best group rate
The percent difference was used for comparisons to the best group rate in HP2010; see Appendix II.
Objectives expressed in terms of adverse outcomes
For objectives expressed in terms of adverse outcomes to be reduced, the HP2020 rate ratio RRg is given by RRg = Rg /RB. The HP2010 percent difference PDg relative to the best group rate is seen as:
PDg = (RRg – 1) × 100.
Thus, the HP2010 percent difference PDg is obtained by subtracting 1 from the HP2020 rate ratio RRg and multiplying by 100 when objectives are expressed in terms of adverse outcomes.
Objectives expressed in terms of favorable outcomes
For objectives expressed in terms of favorable outcomes to be increased, the rate ratio RRg is given by RRg = RB /Rg. In HP2010, the percent difference PDg was calculated using the complementary adverse outcome, with rates ŘB and Řg. For example, the AHS-1.1 objective shown in Table 4 has the lowest uninsurance rate ŘB = 5.2% (100 – 94.8), realized
9

by persons aged 25 to under 65 with an advanced degree, whereas the uninsurance rate for those with less than a high school education, say, is Řg = 43.3% (100 – 56.7). The HP2010 percent difference PDg is given by:
Řg – ŘBPDg = × 100.
ŘB
Because the difference Řg – ŘB between the adverse rates is the same as the difference RB – Rg between the favorable rates, it follows that the HP2010 percent difference PDg can be expressed as:
RB 1PDg = × 1 – × 100.
RRgŘB
Thus, the mathematical relationship between the HP2010 percent difference PDg and the HP2020 rate ratio RRg is nonlinear when objectives are expressed in terms of favorable outcomes to be increased.
HP2020 measures of overall health disparity
In addition to the detailed comparisons to the best group rate that the HP2020 rate ratio RRg facilitates, HP2020 provides measures that quantify the degree of disparity overall across all groups composing a population domain (e.g., race and ethnicity, education, or income). Unlike in HP2010, where a single relative measure, the summary index, was used (see Appendix II), HP2020 uses three measures that include both absolute and relative measures of overall disparity:
● The maximal rate difference, defined as the simple difference between the highest and lowest rates, irrespective of intermediate rates.
● The maximal rate ratio, defined as the ratio between the highest and lowest rates, irrespective of intermediate rates.
● The summary rate ratio, defined using a ratio between the best group rate and the average rate for all other groups in a population domain—as seen below, for objectives expressed in terms of adverse outcomes, the HP2010 summary index is obtained by subtracting 1 from the HP2020 summary rate ratio and multiplying by 100.
The maximal rate difference is useful for tracking changes over time. Tracking the maximal rate difference over time allows the analyst to determine whether, overall, the absolute difference between the highest and lowest rates is decreasing. While this does not capture whether the population health outcome overall is improving, it does allow the analyst to evaluate overall progress toward eliminating disparities, because as the absolute difference between the highest and lowest rates decreases toward 0, all of the
10
pairwise absolute differences between population subgroups will tend to 0.
Additionally, the maximal rate ratio is useful for comparing objectives that are measured on different scales.
Even though their simplicity is appealing, the maximal rate difference and maximal rate ratio are not designed to summarize “typical” or average disparities well, because they do not take into account any of the intermediate rates (10). Instead, the HP2020 summary rate ratio, introduced below, extends the HP2010 index of disparity (4,5) and focuses on a ratio between the best group rate and the average for all other groups, resulting in a more conservative measure of overall health disparity.
Maximal rate difference (RDmax)
Definition Let RB denote the best group rate and RW denote the worst
group rate. The maximal rate difference (RDmax) is an absolute measure of health disparities that compares the highest and lowest group rates in the population for a given characteristic. RDmax is calculated as follows:
RDmax = max{RB – RW, RW – RB}.
Irrespective of whether an objective is expressed in terms of a favorable outcome to be increased—in which case RRmax = RB – RW—or an adverse outcome to be decreased— from where RRmax = RW – RB—the maximal rate difference RDmax remains nonnegative.
Statistical significance When RB and RW have associated standard errors SEB and
SEW, respectively, the standard error of RDmax is approximated using the following formula, which assumes the two rates are independent:
= SEB 2 + SEW
2 .SERDmax
One-sided significance test for RDmax
● The statistic for testing RDmax = 0 versus RDmax > 0 is given by:
z = RDmax /SERDmax
● The maximal rate difference RDmax is statistically significant at the 0.05 level if z > 1.64485.
One-sided confidence interval for RDmax
● The UL is computed as follows:
UL = RDmax + 1.64485 × SERDmax .
Healthy People 2020 Statistical Notes

● A 95% confidence interval for RDmax has lower limit = 0.000 and upper limit = UL.
Maximal rate ratio (RRmax)
Definition Using the same notation as above, the maximal rate ratio
is defined as:
RB RWRRmax = max , .RW RB
As with the HP2020 rate ratio RRg, note that, regardless of whether the objective is in terms of a favorable outcome to be increased or in terms of an adverse outcome to be reduced, RRmax ≥ 1.
Statistical significance As with the HP2020 rate ratio RRg , when measures of
variability are available, the natural logarithm transformation is applied. Using the same notation as above and, again, assuming the two rates are independent, an approximate standard error of the natural logarithm of RRmax is given by:
SEB 2 SEW
2
SEln(RRmax) = + .RB RW
One-sided significance test for RRmax
● Testing RRmax = 1 versus RRmax > 1 is equivalent to testing
ln(RRmax) = 0 versus ln(RRmax) > 0.
● The statistic for testing ln(RRmax) = 0 versus ln(RRmax) > 0 is given by:
z = ln(RRmax)/SE ln(RRmax) .
● The maximal rate ratio RRmax is statistically significant at the 0.05 level if z > 1.64485.
One-sided confidence interval for RRmax
● As before, the UL is computed via the inverse transformation, as follows:
UL = exp{ln(RRmax) + 1.64485 × SE ln(RRmax)}.
● A 95% confidence interval for RRmax has lower limit = 1.000 and upper limit = UL.
Healthy People 2020 Statistical Notes
HP2020 summary rate ratio (RRave)
Definition Given that there are K – 1 groups other than the one
identified as having the best group rate, compute their average rate RA by using the following summation formula:
R1+ R2 + ... + RK – 1 = .RA K _ 1
Continuing with the same notation as previously described, the HP2020 summary rate ratio is defined as:
RB RARRave = max , .RA RB
As with the HP2020 rate ratio RRg and the maximal rate ratio RRmax, irrespective of the objective’s directionality, the HP2020 summary rate ratio RRave is such that RRave ≥ 1.
Statistical significance In HP2010, the statistical significance of the HP2010
summary index of disparity was assessed using resampling techniques because it was not directly available. In HP2020, when measures of variability are available, the evaluation of statistical significance and confidence intervals for the HP2020 summary rate ratio RRave proceeds instead according to the following analytic steps:
Step 1. Assuming the group rates are independent and that K ≥ 3, the standard error SEA of RA is evaluated using the following summation formula, which yields an unbiased estimate of SEA:
2 2 2SE1 + SE2 + … + SEK – 1SEA = ,
K – 2
Step 2. Once RA and SEA are obtained, determining statistical significance of the summary rate ratio RRave proceeds as before. The standard error of the natural logarithm of RRave is approximately:
SEB 2 SEA
2
SEln(RRave) = + .RB RA
One-sided significance test for RRave
● Testing RRave = 1 versus RRave > 1 is equivalent to testing
ln(RRave) = 0 versus ln(RRave) > 0.
● The statistic for testing ln(RRave) = 0 versus ln(RRave) > 0 is computed:
z = ln(RRave)/SE ln(RRave).
11

● The summary rate ratio RRave is statistically significant at the 0.05 level if z > 1.64485.
One-sided confidence interval for RRave
● The UL is computed via the inverse transformation:
UL = exp{ln(RRave) + 1.64485 × SE ln(RRave)}.
● A 95% confidence interval for RRave has lower limit = 1.000 and upper limit = UL.
Relation to HP2010 summary index The index of disparity (IDisp) was the single summary
measure of health disparities used in HP2010; see Appendix II.
Objectives expressed in terms of adverse outcomes
For objectives expressed in terms of adverse outcomes to be reduced, the HP2020 rate ratio RRg for each of the K – 1 groups other than the “best” group is given by RRg = Rg /RB . Similarly, the HP2020 summary rate ratio RRave is given by RRave = RA /RB. Thus,
1 K – 1 K – 1 K – 1 ∑ g = 1Rg ∑ g = 1RRg
= =RRave RB K – 1
The HP2010 summary index IDisp is obtained by subtracting 1 from the HP2020 summary rate ratio RRave and multiplying by 100 when objectives are expressed in terms of adverse outcomes. Indeed:
K – 1 K – 1PDg ∑ (RRg – 1) × 100 ∑ g = 1 g = 1IDisp = = = (RRave –1) × 100.K _ 1 K _ 1
Objectives expressed in terms of favorable outcomes
For objectives expressed in terms of favorable outcomes to be increased, the HP2020 rate ratio RRg for each of the K – 1 groups other than the “best” group is given by RRg = RB /Rg. Similarly, the summary rate ratio RRave is given by RRave = RB /RA. In HP2010 the percent difference PDg and summary index IDisp were calculated using the complementary adverse outcomes, with rates ŘB and Řg. Using the expression for the percent difference PDg of the adverse complementary outcomes derived previously, the HP2010 summary index IDisp can be written as:
K – 1 11RBIDisp = × 1 – × 100 . K – 1 g = 1 RRgŘB
Note that the average of the reciprocals of the rate ratios RRg in this last expression is not equal to the reciprocal of the average or summary rate ratio RRave; thus, the HP2010
12
summary index IDisp cannot be directly related to the HP2020 summary rate ratio RRave when objectives are expressed in terms of favorable outcomes to be increased.
Two examples from the HP2020 health disparities tool
The following examples from the HP2020 online health disparities tool, released in spring 2015, serve to illustrate the HP2020 disparities measures; see http://www.healthypeople.gov.
Education disparities in medical insurance for persons aged 25 to under 65, 2013
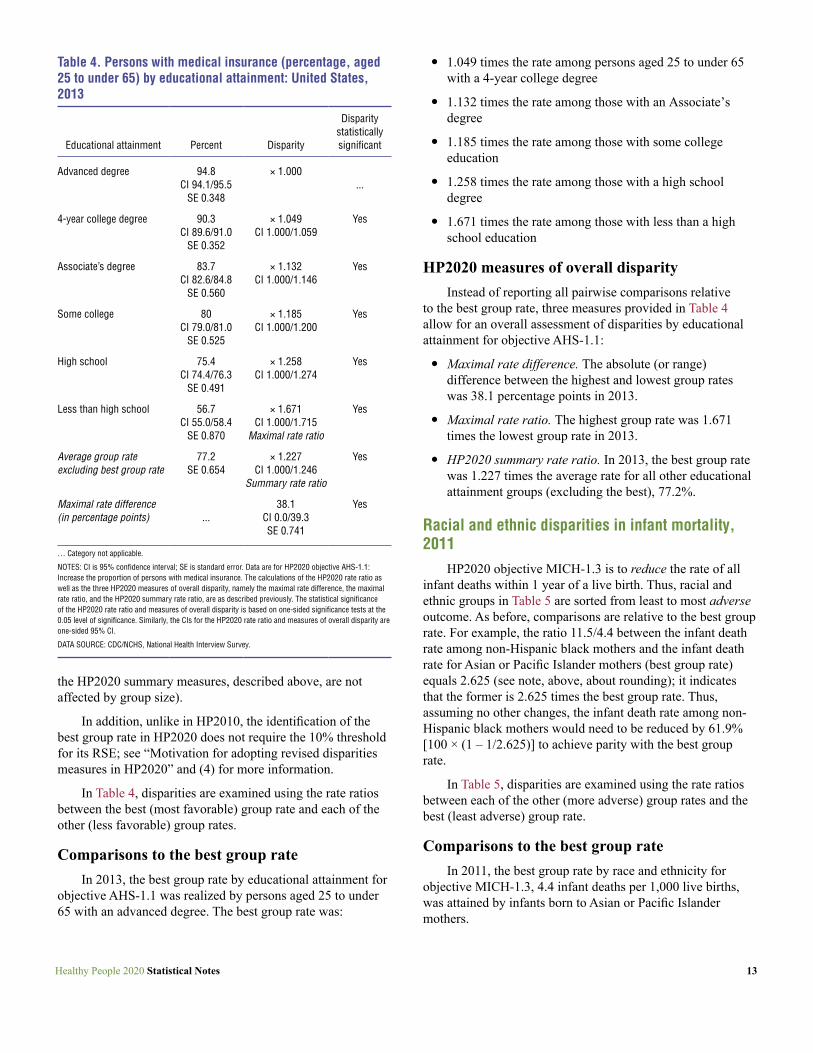
HP2020 AHS-1.1 objective is to increase the proportion of persons with medical insurance. Accordingly, educational attainment groups in Table 4 are sorted from most to least favorable outcome; here, that is the percentage of persons aged 25 to under 65 in a given group with medical insurance in 2013.
As in HP2010, HP2020 uses the group with the most favorable (best) rate to highlight opportunities for improvement. Thus, all insurance rates in Table 4 are compared with the best group rate. For example, the ratio 94.8/56.7 between the insurance rate for persons aged 25 to under 65 with an advanced degree (best group rate) and the insurance rate for those with less than a high school education equals 1.671 (see note, below, about rounding); it indicates that the best group rate is 1.671 times the insurance rate among persons aged 25 to under 65 with less than a high school education. Said another way, assuming no other changes, the increase in insurance coverage that would be needed among persons aged 25 to under 65 with less than a high school education to achieve parity with those with an advanced degree (best group) is 67.1% [(1.671 – 1.000) × 100].
Remark. All disparity calculations in Table 4 are applied to the unrounded values of the estimates and their standard errors that are available in the HP2020 database. Thus, after rounding to three decimals, values displayed in Table 4 for rate ratios may differ from the results of calculations that use the displayed values of the estimated rates in Table 4. This departs from HP2010, where rounded “display” values were used in disparity calculations (3).
In particular, working with the unrounded values of the estimates and their standard errors (when available) allows more possibilities for breaking ties in the ranking of rates from highest to lowest. For example, if, even after comparing the rates using their unrounded values, two groups are tied for the highest, most favorable rate, the group with the smaller standard error is selected as the “best” rate when measures of variability are available. (If measures of variability are unavailable, then a tie in the unrounded values of two rates may be resolved using group size or any other characteristic;
Healthy People 2020 Statistical Notes
2013
Table 4. Persons with medical insurance (percentage, aged 25 to under 65) by educational attainment: United States,
Educational attainment Percent Disparity
Disparity statistically significant
Advanced degree 94.8 CI 94.1/95.5
SE 0.348
× 1.000 ...
4-year college degree 90.3 CI 89.6/91.0
SE 0.352
× 1.049 CI 1.000/1.059
Yes
Associate’s degree 83.7 CI 82.6/84.8
SE 0.560
× 1.132 CI 1.000/1.146
Yes
Some college 80 CI 79.0/81.0
SE 0.525
× 1.185 CI 1.000/1.200
Yes
High school 75.4 CI 74.4/76.3
SE 0.491
× 1.258 CI 1.000/1.274
Yes
Less than high school 56.7 CI 55.0/58.4
SE 0.870
× 1.671 CI 1.000/1.715
Maximal rate ratio
Yes
Average group rate excluding best group rate
77.2 SE 0.654
× 1.227 CI 1.000/1.246
Summary rate ratio
Yes
Maximal rate difference 38.1 Yes (in percentage points) ... CI 0.0/39.3
SE 0.741
… Category not applicable.
NOTES: CI is 95% confidence interval; SE is standard error. Data are for HP2020 objective AHS-1.1: Increase the proportion of persons with medical insurance. The calculations of the HP2020 rate ratio as well as the three HP2020 measures of overall disparity, namely the maximal rate difference, the maximal rate ratio, and the HP2020 summary rate ratio, are as described previously. The statistical significance of the HP2020 rate ratio and measures of overall disparity is based on one-sided significance tests at the 0.05 level of significance. Similarly, the CIs for the HP2020 rate ratio and measures of overall disparity are one-sided 95% CI.
DATA SOURCE: CDC/NCHS, National Health Interview Survey.
the HP2020 summary measures, described above, are not affected by group size).
In addition, unlike in HP2010, the identification of the best group rate in HP2020 does not require the 10% threshold for its RSE; see “Motivation for adopting revised disparities measures in HP2020” and (4) for more information.
In Table 4, disparities are examined using the rate ratios between the best (most favorable) group rate and each of the other (less favorable) group rates.
Comparisons to the best group rate In 2013, the best group rate by educational attainment for
objective AHS-1.1 was realized by persons aged 25 to under 65 with an advanced degree. The best group rate was:
Healthy People 2020 Statistical Notes
● 1.049 times the rate among persons aged 25 to under 65 with a 4-year college degree
● 1.132 times the rate among those with an Associate’s degree
● 1.185 times the rate among those with some college education
● 1.258 times the rate among those with a high school degree
● 1.671 times the rate among those with less than a high school education
HP2020 measures of overall disparity Instead of reporting all pairwise comparisons relative
to the best group rate, three measures provided in Table 4 allow for an overall assessment of disparities by educational attainment for objective AHS-1.1:
● Maximal rate difference. The absolute (or range) difference between the highest and lowest group rates was 38.1 percentage points in 2013.
● Maximal rate ratio. The highest group rate was 1.671 times the lowest group rate in 2013.
● HP2020 summary rate ratio. In 2013, the best group rate was 1.227 times the average rate for all other educational attainment groups (excluding the best), 77.2%.
Racial and ethnic disparities in infant mortality, 2011
HP2020 objective MICH-1.3 is to reduce the rate of all infant deaths within 1 year of a live birth. Thus, racial and ethnic groups in Table 5 are sorted from least to most adverse outcome. As before, comparisons are relative to the best group rate. For example, the ratio 11.5/4.4 between the infant death rate among non-Hispanic black mothers and the infant death rate for Asian or Pacific Islander mothers (best group rate) equals 2.625 (see note, above, about rounding); it indicates that the former is 2.625 times the best group rate. Thus, assuming no other changes, the infant death rate among non-Hispanic black mothers would need to be reduced by 61.9% [100 × (1 – 1/2.625)] to achieve parity with the best group rate.
In Table 5, disparities are examined using the rate ratios between each of the other (more adverse) group rates and the best (least adverse) group rate.
Comparisons to the best group rate In 2011, the best group rate by race and ethnicity for
objective MICH-1.3, 4.4 infant deaths per 1,000 live births, was attained by infants born to Asian or Pacific Islander mothers.
13
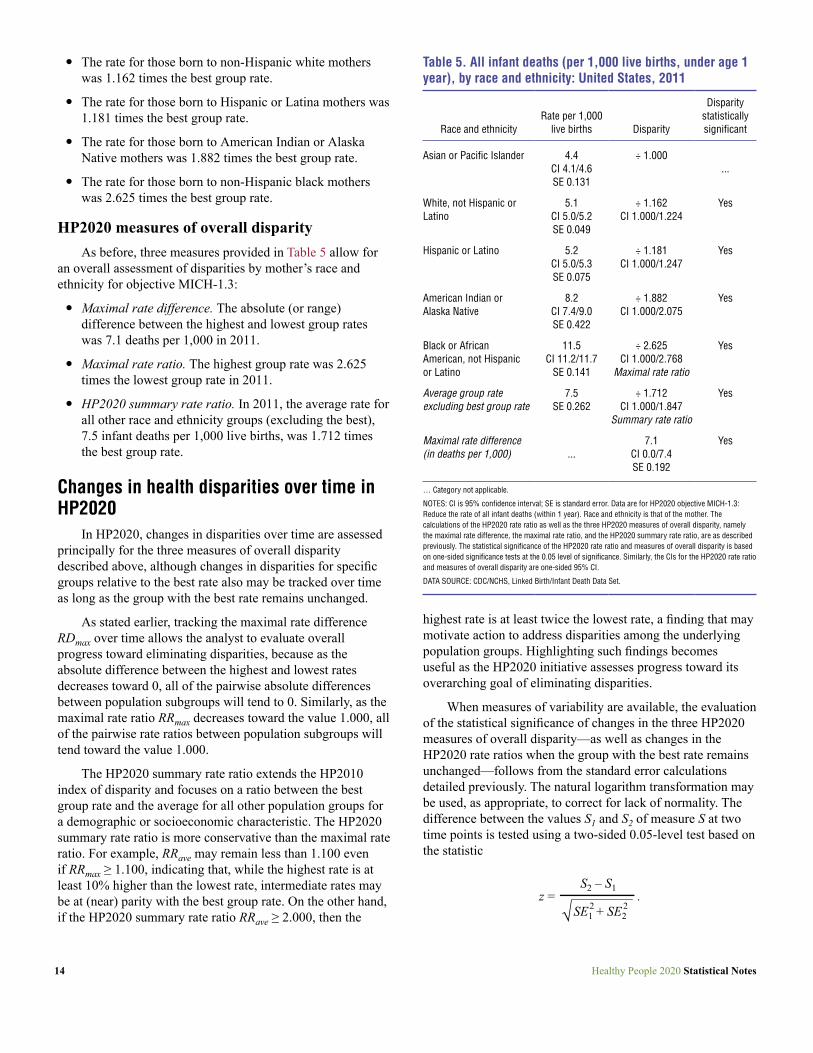
Table 5. All infant deaths (per 1,000 live births, under age 1 year), by race and ethnicity: United States, 2011
Disparity Rate per 1,000 statistically
Race and ethnicity live births Disparity significant
Asian or Pacific Islander
White, not Hispanic or Latino
Hispanic or Latino
American Indian or Alaska Native
Black or African American, not Hispanic or Latino
Average group rate excluding best group rate
Maximal rate difference (in deaths per 1,000)
4.4 CI 4.1/4.6 SE 0.131
5.1 CI 5.0/5.2 SE 0.049
5.2 CI 5.0/5.3 SE 0.075
8.2 CI 7.4/9.0 SE 0.422
11.5 CI 11.2/11.7
SE 0.141
7.5 SE 0.262
...
÷ 1.000 ...
÷ 1.162 Yes CI 1.000/1.224
÷ 1.181 Yes CI 1.000/1.247
÷ 1.882 Yes CI 1.000/2.075
÷ 2.625 Yes CI 1.000/2.768
Maximal rate ratio
÷ 1.712 Yes CI 1.000/1.847
Summary rate ratio
7.1 Yes CI 0.0/7.4 SE 0.192
… Category not applicable.
NOTES: CI is 95% confidence interval; SE is standard error. Data are for HP2020 objective MICH-1.3: Reduce the rate of all infant deaths (within 1 year). Race and ethnicity is that of the mother. The calculations of the HP2020 rate ratio as well as the three HP2020 measures of overall disparity, namely the maximal rate difference, the maximal rate ratio, and the HP2020 summary rate ratio, are as described previously. The statistical significance of the HP2020 rate ratio and measures of overall disparity is based on one-sided significance tests at the 0.05 level of significance. Similarly, the CIs for the HP2020 rate ratio and measures of overall disparity are one-sided 95% CI.
DATA SOURCE: CDC/NCHS, Linked Birth/Infant Death Data Set.
● The rate for those born to non-Hispanic white mothers was 1.162 times the best group rate.
● The rate for those born to Hispanic or Latina mothers was 1.181 times the best group rate.
● The rate for those born to American Indian or Alaska Native mothers was 1.882 times the best group rate.
● The rate for those born to non-Hispanic black mothers was 2.625 times the best group rate.
HP2020 measures of overall disparity As before, three measures provided in Table 5 allow for
an overall assessment of disparities by mother’s race and ethnicity for objective MICH-1.3:
● Maximal rate difference. The absolute (or range) difference between the highest and lowest group rates was 7.1 deaths per 1,000 in 2011.
● Maximal rate ratio. The highest group rate was 2.625 times the lowest group rate in 2011.
● HP2020 summary rate ratio. In 2011, the average rate for all other race and ethnicity groups (excluding the best), 7.5 infant deaths per 1,000 live births, was 1.712 times the best group rate.
Changes in health disparities over time in HP2020
In HP2020, changes in disparities over time are assessed principally for the three measures of overall disparity described above, although changes in disparities for specific groups relative to the best rate also may be tracked over time as long as the group with the best rate remains unchanged.
As stated earlier, tracking the maximal rate difference RDmax over time allows the analyst to evaluate overall progress toward eliminating disparities, because as the absolute difference between the highest and lowest rates decreases toward 0, all of the pairwise absolute differences between population subgroups will tend to 0. Similarly, as the maximal rate ratio RRmax decreases toward the value 1.000, all of the pairwise rate ratios between population subgroups will tend toward the value 1.000.
The HP2020 summary rate ratio extends the HP2010 index of disparity and focuses on a ratio between the best group rate and the average for all other population groups for a demographic or socioeconomic characteristic. The HP2020 summary rate ratio is more conservative than the maximal rate ratio. For example, RRave may remain less than 1.100 even if RRmax ≥ 1.100, indicating that, while the highest rate is at least 10% higher than the lowest rate, intermediate rates may be at (near) parity with the best group rate. On the other hand, if the HP2020 summary rate ratio RRave ≥ 2.000, then the
14
highest rate is at least twice the lowest rate, a finding that may motivate action to address disparities among the underlying population groups. Highlighting such findings becomes useful as the HP2020 initiative assesses progress toward its overarching goal of eliminating disparities.
When measures of variability are available, the evaluation of the statistical significance of changes in the three HP2020 measures of overall disparity—as well as changes in the HP2020 rate ratios when the group with the best rate remains unchanged—follows from the standard error calculations detailed previously. The natural logarithm transformation may be used, as appropriate, to correct for lack of normality. The difference between the values S1 and S2 of measure S at two time points is tested using a two-sided 0.05-level test based on the statistic
S2 – S1 z = .
SE12 + SE2
2
Healthy People 2020 Statistical Notes

Considerations Findings of health disparities in HP2020 remain subject
to the following considerations:
● The HP2020 rate ratio RRg is constructed in such a way that its numerical value remains greater than or equal to one regardless of whether an objective is expressed in terms of a favorable outcome or its complementary adverse outcome. Nonetheless, the substantive interpretation of the HP2020 rate ratio changes with the directionality of the objective:
o For objectives expressed in terms of adverse outcomes, the HP2020 rate ratio RRg expresses the factor by which the rate for the comparison group g would need to be divided to achieve parity with the best group rate. For objectives expressed in terms of favorable outcomes, the HP2020 rate ratio RRg expresses the factor by which the rate for the comparison group g would need to be multiplied to achieve parity with the best group rate.
o In particular, as seen above, whereas the mathematical relationship between the HP2020 rate ratio RRg and the HP2010 percent difference PDg relative to the best group rate is linear for objectives expressed in terms of adverse outcomes, the relationship is nonlinear for objectives expressed in terms of favorable outcomes.
● Users should be aware that all disparity calculations are based on the unrounded values of the estimates and their standard errors that are available in the HP2020 database. Thus, rate ratios calculated from values displayed in HP2020 data tables may differ from those that use the unrounded values and are found in the online HP2020 disparities tool.
● As stated earlier, working with the unrounded values of the estimates and their standard errors (when available) allows tie-breaking in the ranking of group rates from highest to lowest. For example, if, even after comparing rates using their unrounded values, two groups are tied for the most favorable rate, the group with the smallest standard error is selected as “best” group rate. In addition, unlike in HP2010, the identification of the best group rate does not require the 10% threshold for its RSE.
● The standard error calculations for the HP2020 rate ratio and measures of overall disparity are conditional on the reliability of the observed rank order of the groups, including the “correct” identification of groups with highest and lowest rates. Yet, just as in HP2010, the ordering itself is not treated as random, only the rates are. Indeed, the conditional variance of the maximal rate difference RDmax differs from the unconditional variance of the difference max{Rg} – min{Rg}, where the particular groups that achieve the highest and lowest
Healthy People 2020 Statistical Notes
rates are not identified in advance. Similar considerations apply to the maximal rate ratio RRmax (in relation to the ratio max{Rg}/min{Rg}), as well as to the HP2020 summary rate ratio RRave. Related methods for estimating confidence intervals for ranks of rates have been developed (11). Whereas such methods may prove useful in assessing the reliability of group ranks, including the best group rate, they are yet to be implemented in HP2020, due to their computational complexity.
Conclusion This Statistical Note documents the HP2020 methodology
for measuring progress toward target attainment and the elimination of health disparities.
For HP2020, the “percent of targeted change achieved” still measures movement of objectives that are moving from their baseline toward their targets. However, for objectives moving away from their baselines and targets, the “absolute value of the percent change from baseline” is used to measure movement. In addition, unlike in HP2010, both the extent of the movement and its statistical significance (when measures of variability are available) are used in HP2020 to determine an objective’s progress status (e.g., “improving,” “little or no detectable change,” or “getting worse”).
As in HP2010, all groups composing a population domain (e.g., race and ethnicity, education, or income) are compared with the group with the “best” (i.e., most favorable or least adverse) rate. However, HP2020 uses the ratio instead of the percent difference between the rates. In addition, HP2020 objectives that are expressed in terms of favorable outcomes to be increased no longer need to be re-expressed using the complementary adverse outcomes for comparisons relative to the best group rate. However, whereas the mathematical relationship between the HP2020 rate ratio RRg and the HP2010 percent difference PDg relative to the best group rate is linear for objectives expressed in terms of adverse outcomes, the relationship is nonlinear for objectives expressed in terms of favorable outcomes.
In addition to detailed comparisons to the best group rate, HP2020 provides measures that quantify the degree of disparity overall across all groups composing a population domain. Unlike in HP2010, where a single relative measure, the summary index, was used, HP2020 uses three measures that include both absolute and relative measures of overall disparity: a) the simple difference between the highest and lowest rates, irrespective of intermediate rates; b) the ratio between the highest and lowest rates, irrespective of intermediate rates; c) and a summary rate ratio between the best group rate and the average rate for all other groups in a population domain. However, whereas the HP2010 summary index is obtained by subtracting 1 from the HP2020 summary
15

Table 6. Classification of HP2010 objectives, by progress status
Objective status Short explanation
TARGET MET Target met or exceeded.
IMPROVING Movement is toward the target.
DEMONSTRATED NO Objective demonstrates no change between the CHANGE baseline and most recent data point.
GETTING WORSE Movement is away from the target.
BASELINE ONLY Baseline data only; progress cannot be assessed (with the exception of objectives which have met or exceeded their targets at the baseline).
DEVELOPMENTAL Objective is developmental (does not have baseline data).
SOURCE: CDC/NCHS, HP2010 database.
rate ratio and multiplying by 100 for objectives expressed in terms of adverse outcomes, the HP2010 summary index and HP2020 summary rate ratio are not directly comparable for objectives expressed in terms of favorable outcomes.
The multipronged approach to measurement of progress toward target attainment and elimination of health disparities in HP2020 addresses some of the complex methodological issues and limitations identified in the past decade as well as elsewhere in the literature.
Appendix I. Measure of Progress Toward HP2010 Targets This appendix briefly describes measurement of progress
toward target attainment in HP2010, which provided the impetus for developing the HP2020 progress measures presented.
Classification of objective progress status in HP2010 In HP2010, objectives were classified according to the
status of their progress toward or away from their targets; see Table 6. As discussed below, even though informative with regard to the sustainability of change from baseline, the magnitude of the “percent of targeted change achieved”— also referred to as the “progress quotient” (1)—as well as its statistical significance (when measures of variability were available) were not factored into the determination of the objective progress status for HP2010 objectives.
Determination of objective progress status in HP2010
Objectives for which progress could be assessed
Target met HP2010 objectives with at least two data points were
categorized as TARGET MET if one of the following scenarios applied:
● When the desired direction was increase, most recent value ≥ HP2010 target.
● When the desired direction was decrease, most recent value ≤ HP2010 target.
Similarly, HP2010 objectives with only baseline data were categorized as TARGET MET if one of the following scenarios applied:
● When the desired direction was increase, baseline value ≥ HP2010 target.
16
● When the desired direction was decrease, baseline value ≤ HP2010 target.
Improving HP2010 objectives with at least two data points were
categorized as IMPROVING if one of the following scenarios applied:
● When the desired direction was increase, baseline value < most recent value < HP2010 target.
● When the desired direction was decrease, baseline value > most recent value > HP2010 target.
Demonstrated no change HP2010 objectives with at least two data points were
categorized as DEMONSTRATED NO CHANGE if baseline value = most recent value.
Getting worse HP2010 objectives with at least two data points were
categorized as GETTING WORSE if one of the following scenarios applied:
● When the desired direction was increase, most recent value < HP2020 target and most recent value < baseline value.
● When the desired direction was decrease, most recent value > HP2020 target and most recent value > baseline value.
Extent of movement toward target attainment For HP2010 objectives that had at least two data points,
the “percent of targeted change achieved” was used to quantify progress, unless the target had been met or exceeded
Healthy People 2020 Statistical Notes
at baseline. The formula for the “percent of targeted change achieved” was as follows:
Percent of Most recent value – Baseline value targeted change = × 100.
HP2010 target – Baseline value achieved
The “percent of targeted change achieved” expressed the difference between the baseline and the most recent value as a percent of the targeted change between the baseline and the HP2010 target.
HP2010 objectives that had a “percent of targeted change achieved” of 100% or more were categorized as TARGET MET. Objectives that had a positive “percent of targeted change achieved” that was less than 100% were categorized as IMPROVING. Otherwise, as stated earlier, the amount of “percent of targeted change achieved” was not considered for determining progress status.
HP2010 objectives that were moving away from their targets and those whose targets had been exceeded at baseline yielded negative “percent of targeted change achieved” values. Although such negative values were reported in the Healthy People 2010 Midcourse Review (2), they were not included in the Healthy People 2010 Final Review because of the difficulties that arose in their interpretation (3). Instead, for such objectives, the reader is urged to examine the difference between baseline and most recent values to assess progress.
Objectives for which progress could not be assessed
HP2010 objectives where the target had been met or exceeded at baseline did not use the “percent of targeted change achieved” when assessing progress because they resulted in infinite and negative values, respectively. These HP2010 objectives were simply categorized as TARGET MET, assuming the most recent data point met or exceeded the target.
Also, developmental HP2010 objectives, which had no data, and baseline-only HP2010 objectives, which only had one data point, were generally not included in assessments of progress. An exception was made for baseline-only HP2010 objectives with targets that had been met or exceeded at baseline; these objectives were categorized as TARGET MET, as stated above.
Appendix II. Health Disparities Measurement in HP2010
This appendix describes measurement of health disparities and changes in disparities over time in HP2010. The features and limitations of the HP2010 health disparities
Healthy People 2020 Statistical Notes
measures provided the impetus for developing the HP2020 health disparities measures presented.
Comparisons to the best group rate in HP2010
Percent difference The percent difference (PD) was used for comparisons to
the best group rate in HP2010.
Definition The formula for the percent difference PDg from the best
group rate for a group g is as follows: Rg – RB
PDg = × 100 ,RB
where RB is the best group rate and Rg is the rate for group g for a particular characteristic.
Some HP2010 objectives were expressed in terms of favorable outcomes that were to be increased, whereas others were expressed in terms of adverse outcomes that were to be reduced. To facilitate comparison of disparities across different HP2010 objectives, the PD was measured only for adverse outcomes in HP2010; as a result, the PD remained nonnegative. Those dichotomous objectives that were expressed in terms of favorable outcomes were re-expressed using the complementary adverse outcome for the purpose of computing the PD, although they were not otherwise restated or changed (3,4).
For example, HP2010 objective 1-1, to increase the proportion of persons with health insurance (e.g., 72% of the American Indian or Alaska Native population under 65 had health insurance in 2008), was expressed in terms of the percentage of persons without health insurance (e.g., 100% – 72% = 28% of the American Indian or Alaska Native population under 65 did not have health insurance in 2008) when the PD was calculated (3).
Statistical significance When measures of variability were available, the
statistical significance of the simple difference Rg – RB between the group rates was assessed using the following statistic:
Rg – RB z = ,
SEg 2 + SEB
2
where SEg was the standard error of the rate for group g and SEB was that of the best group rate.
17

This formula assumes the two groups are independent. Because the difference Rg – RB remained nonnegative, a one-tailed test was employed to assess statistical significance. When z > 1.64485, the simple difference Rg – RB between the two group rates was statistically significant at the 0.05 level.
In HP2010, when the simple difference Rg – RB between the two group rates was statistically significant at the 0.05 level, the percent difference PDg for group g relative to the best group rate was flagged, even though the latter was not tested directly (1).
HP2010 measure of overall health disparity
HP2010 summary index (“Index of Disparity”) When more than two groups are associated with a given
population characteristic, such as race and ethnicity, income, or education, a summary index provides an assessment of overall disparity at a point in time and whether, overall, disparities are increasing or decreasing.
Definition The formula for the HP2010 summary index, also known
as the index of disparity (IDisp), is:
K – 1∑ g = 1 PDgIDisp = ,K – 1
where PDg is the percent difference from the best group rate for each of the groups of interest (g = 1, 2,…, K), and K is the number of groups composing the population domain of interest (1,5).
Standard error When measures of variability were available, the standard
error of the HP2010 summary index was evaluated using a resampling procedure. This procedure used the rate and standard error for each group to re-estimate each group rate 25,000 times assuming a random normal distribution. Based on these group rates, 25,000 estimates of the summary index were generated, and the distribution of these estimates was used to estimate the standard error of the summary index (1).
Changes in health disparities over time in HP2010
When data beyond the baseline were available, change in the PD over time was estimated by subtracting the PD at baseline from the PD at the most recent data point. The change was expressed in percentage points: positive differences represented an increase in disparity, and negative differences represented a decrease in disparity.
18
Change in percent difference over time for specific groups
Comparisons over time were made only when data were available for the same groups defined in the same way at the baseline and most recent data points. In particular, the group with the best rate was required to remain unchanged for comparisons of the PD over time to be meaningful (3).
Statistical significance When measures of variability are available, several steps
are required to evaluate statistical significance of a change in the PD over time (1):
Step 1. The PD is rewritten in terms of the simple difference SDg = Rg – RB between the rates:
SDgPDg = × 100 ,RB
Step 2. The relative standard error (RSE) of the ratio in the above expression is computed based on the RSE of the numerator and the denominator. The RSE for the numerator, SDg , is calculated as:
2 2SEg + SEBRSESDg = ,
Rg – RB
Step 3. The RSE of the best group rate in the denominator of the above ratio is given by:
SEBRSEB = .RB
Step 4. An approximate RSE for the PD is calculated as follows:
2 2RSEPDg = RSESDg
+ RSEB .
This approximation assumes the simple difference, SDg , is independent of the best group rate, RB.
Step 5. An approximate standard error for the PD is given by:
SEPDg = RSEPDg
× PDg .
Step 6. The statistical significance of a change in the PD over time is assessed using the statistic
PDg,1 – PDg,0 z = ,
2 2SEPDg,1 + SEPDg,0
where PDg,1 is the percent difference at the most recent time point, PDg,0 is the percent difference at baseline, SEPDg,1
is the
Healthy People 2020 Statistical Notes
standard error of the percent difference at the most recent time, and SEPDg,0 is the standard error of the percent difference at baseline.
Change in summary index over time Comparisons over time were made only when data were
available for the same groups defined in the same way at the baseline and most recent data points.
Statistical significance The resampling procedure described previously was used
to estimate standard errors for the summary index at the baseline and most recent time points (1). When measures of variability were available, the statistical significance of a change in the summary index over time was assessed using the statistic:
IDisp1 – IDisp0 z = , 2 2SEIDisp1
+ SEIDisp0
where IDisp1 is the summary index at the most recent time point, IDisp0 is the summary index at baseline, SEIDisp1
is the standard error of the summary index at the most recent time point, and SEIDisp0
is the standard error of the summary index at baseline.
As with the change in the pairwise PD, because the value of the summary index IDisp could either increase or decrease, a two-tailed test was employed to assess statistical significance: A value of |z| > 1.96 indicated that the change in the summary index was statistically significant at the 0.05 level.
References 1. Keppel KG, Pearcy JN, Klein RJ. Measuring progress
in Healthy People 2010. Statistical Notes, no. 25. Hyattsville, MD: National Center for Health Statistics. 2004.
2. U.S. Department of Health and Human Services. Healthy People 2010 midcourse review. Washington, DC: U.S. Government Printing Office. 2006.
3. National Center for Health Statistics. Healthy People 2010 final review. Hyattsville, MD. 2012.
4. Keppel K, Pamuk E, Lynch J, et al. Methodological issues in measuring health disparities. National Center for Health Statistics. Vital Health Stat 2(141). 2005.
5. Pearcy JN, Keppel KG. A summary measure of health disparity. Public Health Rep 117(3):273–80. 2002.
Healthy People 2020 Statistical Notes
6. Harper S, King NB, Meersman SC, Reichman ME, Breen N, Lynch J. Implicit value judgments in the measurement of health inequalities. Milbank Q 88(1):4–29. 2010.
7. Penman-Aguilar A, Talih M, Huang D, Moonesinghe R, Bouye K, Beckles G. Measurement of health disparities, health inequities, and social determinants of health to support the advancement of health equity. J Public Health Manag Pract 22(Suppl 1):S33–42. 2016.
8. Breen N, Scott S, Percy-Laurry A, Lewis D, Glasgow R. Health disparities calculator: A methodologically rigorous tool for analyzing inequalities in population health. Am J Public Health 104(9):1589–91. 2014.
9. Harper S, Lynch J. Selected comparisons of measures of health disparities: A review using databases relevant to Healthy People 2010 cancer-related objectives. NCI Cancer Surveillance Monograph Series, No. 7. NIH Pub. No. 07–6281. Bethesda, MD: National Cancer Institute. 2007.
10. WHO. Handbook on health inequality monitoring with a special focus on low- and middle-income countries. Geneva, Switzerland: WHO Press. 2013. Available from: http://www.who.int/gho/health_equity/handbook/en/.
11. Zhang S, Luo J, Zhu L, Stinchcomb DG, Campbell D, Carter G, et al. Confidence intervals for ranks of age-adjusted rates across states or counties. Stat Med 33(11):1853–66. 2014.
19
U.S. DEPARTMENT OF HEALTH & HUMAN SERVICES
Centers for Disease Control and Prevention National Center for Health Statistics 3311 Toledo Road, Room 5491 Hyattsville, MD 20782–2064
FIRST CLASS MAIL POSTAGE & FEES PAID
CDC/NCHS PERMIT NO. G-284
OFFICIAL BUSINESS PENALTY FOR PRIVATE USE, $300
Suggested citation Talih M, Huang DT. Measuring progress toward target attainment and the elimination of health disparities in Healthy People 2020. Healthy People Statistical Notes, no 27. Hyattsville, MD: National Center for Health Statistics. 2016.
National Center for Health Statistics Charles J. Rothwell, M.S., M.B.A., Director Nathaniel Schenker, Ph.D., Deputy Director Jennifer H. Madans, Ph.D., Associate Director for
Science
Office of Analysis and Epidemiology Irma E. Arispe, Ph.D., Director Makram Talih, Ph.D., Associate Director for
Science
CS261587