healthy recipe recommendation using nutrition and ratings
TRANSCRIPT

Healthy Recipe Recommendation using Nutrition and Ratings Models
Yew Siang Tang, Anita Hanzhi Zheng, Nicholas LaiStanford University
Abstract
We propose a three-part algorithm to provide health-ier and tastier recipe alternatives given a person’s foodpreferences. The first part consists of developing a nu-tritional model using linear regression to understand theoverall nutritional content of a recipe given its ingre-dients. The second part consists of modelling a user’srating scores using a graph neural network (GNN) oningredient-recipe and recipe-user bipartite graphs. Wecombine these two models to enable us to evaluate thehealthiness and tastiness of novel recipes according tousers’ preferences. We show that our GNN approachtowards the ratings model achieves strong performanceand provide compelling qualitative results of our recom-mended recipes.
IntroductionThe problem of how to cook good food and make it nutritioushas existed for as long as humans have existed. For thousandsof years, the main ways people learned about great dishes andrecipes was either through trial and error or word of mouth,and neither method took much direct consideration of a dish’snutrition value. Today’s technological advances have madeit possible to leverage other people’s food preferences to notonly suggest dishes one might like, but also craft them in sucha way that they satisfy the nutritional requirements peopleneed on a daily basis. As this problem can be expressed as agraph between users, recipes, and ingredients, we think wecan use modern techniques in machine learning and graphtheory to suggest better recipes than many standard systemsfor rating recipes.
In particular, we have decided to focus mostly on the rela-tionships between ingredients, recipes, and users to create ourrecommendation system, as we think these are the most perti-nent parts of a recipe with regards to recommending healthyand tasty recipes. We have also decided to separate modelingnutrition of recipes from modeling tastiness of recipes, asnutritional data in general tends to be less subjective and eas-ier to reason about than rating data. Finally, we have chosento emphasize comprehensibility and flexibility of our mod-els over exhaustiveness, as we think that ultimately anyone
Copyright c© 2019, Association for the Advancement of ArtificialIntelligence (www.aaai.org). All rights reserved.
should be able to use our recommendations, if not build asimilar system themselves.
With this framework in mind, we can create suitable nutri-tion and ratings models which properly leverage relationshipsbetween users, recipes and recipe ingredients, the details ofwhich are explained more fully under Method.
Related WorkFlavor Network and the Principles of Food PairingFlavor networks (Ahn et al. 2011) is a less technical yetstill rigorous paper which presents fairly standard statisticalanalysis on the graph of ingredient networks. The formulaNs(R) = 2
nR(nR–1)
∑i,j∈R,i 6=j |Ci ∩ Cj | is used to repre-
sent the mean number of shared compounds, and base manymeasures used in the paper on this metric, including contribu-tion and authenticity. Evaluating this metric with a z-test, thepaper has found that ingredient pairs in North America tendto share more compounds while East Asian cuisines tend toshare fewer compounds than expected by chance, and thedistribution of NS values forms an approximately normaldistribution.
Graphs are also presented which show that certain ingre-dients have especially high usage, such as garlic, scallion,tomato, and olive oil. The number of ingredients per recipeforms an approximately beta distribution with respect to P(s),and the rank and frequency distribution per cuisines lookremarkably similar to a Zipf-Mandelbrot curve.
Recipe Recommendation Using Ingredient NetworksRecipe Recommendation Using Ingredient Networks byTeng, Lin, and Adamic (Teng, Lin, and Adamic 2012) parsesthe unstructured text of recipes and user reviews on All-recipes.com, and constructs two types of networks that reflectdifferent relationships between ingredients, so as to captureusers’ knowledge about how to combine ingredients.
The first type of network, namely the complement network,captures which ingredients tend to co-occur frequently us-ing pointwise mutual information, defined as PMI(a, b) =
log p(a,b)p(a)p(b) . They show that the network is largely composed
of two large communities, savory and sweet, and that the max-imum PMI of a recipe is very slightly positively correlatedwith its average rating.

Graph Node Count Edge Count Average clustering coefficient Average degree
Ratings graph 51,987 133,459 N/A 4.55 (user out-degree)5.88 (recipe in-degree)
Ingredients graph 10,874 269,962 0.868 49.65
Table 1: Statistics for ratings and ingredients graphs
The second type of network, namely the substitute networkderived from user generated suggestions for modifications,is a weighted directed graph where the weight of edge froma to b denotes the proportion of substitutions of ingredienta that suggest ingredient b. It can be decomposed into manycommunities of functionally equivalent ingredients and cap-tures users’ preference for healthier variants of a recipe. Tenget al. demonstrate that the substitute network encodes users’ingredient preference.
With these networks, Teng et al. also conduct experimentsusing stochastic gradient boosting trees, showing that reciperatings can be predicted by features from combinations ofingredient networks and nutrition information with accuracy0.792, with most predictive power coming from the ingredientnetworks.
Exploiting Food Choice Biases for Healthier RecipeRecommendationElsweiler et al. (Elsweiler, Trattner, and Harvey 2017) wantto improve the recipe recommendation / ranking process toinclude the health information of the dishes so that users aregiven tasty and healthy recipes. In this problem setting, a userhas a desired dish on their mind and finds recipes on onlinerecipe recommendation systems. This problem is challengingbecause popular and highly-rated recipes correlate positivelywith high fat, sugar and calorie content, i.e. tasty food tendsto be nutritionally poorer.
To recommend dishes that balance tastiness with healthi-ness, the authors substitute a user’s desired recipe with similarrecipes of higher nutritional content and at least an equivalentrating in the recipes database, using cosine similarity to filterout dissimilar recipes and recipes with lower ratings. In addi-tion to developing a recipe substitution system, the authorsstudy the ability of people to judge fat content of recipes andtheir biases in their selection of recipes, finding that peopleimplicitly prefer fatty food but yet are not able to distinguishthe fat content between foods. In their findings, they describehow food titles and images can bias people in their perceptionof fat content and simple low-level food image features canbe highly predictive of food preferences.
General Limitations of Existing MethodsBased on the previous papers, we have found that these meth-ods either analyze but do not recommend recipes, disregardnutritional information, are difficult to comprehend by usersor are constrained to suggesting only recipes that are withindatabases. We believe that we can use our knowledge aboutmachine learning on graphs to allow us to create a betterrecipe model which accounts for both nutrition and taste.
In order to do this, we made a few key choices to improve
the model. To start, we have decided to assume that recipesare bags of ingredients, to improve one’s encoding of, say,dietary restrictions or personal preferences. We have alsodecided not to focus on cultural characteristics of food, aswe have seen that past papers have undertaken such anal-ysis with data heavily biased towards European and NorthAmerican dishes. Furthermore, we have included a meansto generate new recipe “substitutes” as part of the algorithm,as our project intends to find healthier alternatives to recipescurrently existing in cookbooks. Above all, we made thesechoices so our output model should be understandable tolaypeople, even if the means of obtaining such a model issomewhat technical.
DatasetOur dataset, from Kaggle, consists of about 50,000 recipesscraped from allrecipes.com, with each recipe containingthe name and ID on the website, the average rating overall the reviews on the website, an accompanying image onthe website, the ingredients used for the recipe, the cookingdirections, and the nutrition content; most relevant for ouruse case will be the dish name, the recipe’s ingredients, thereview data, and the nutrition. The nutrition data consists ofa dictionary corresponding to the standard nutrition contenttables found to the side of most American food products, andthe review data consists of user IDs with review score andtimestamp per dish.
Preprocessing Ingredient ListsThe following are examples of user-provided ingredients:[sauerkraut drained, Granny Smith apples sliced, large onion,caraway seeds, apple cider divided, brown sugar, Rub:, Thaiseasoning, salt, garlic powder, ground black pepper, bonelesspork loin roast][kielbasa (Polish) sausage (such as Hillshire Farm R©), grapejelly, bottles barbeque sauce]
As the ingredients are specified differently by online users,there is significant noise. For example, both ‘large onion’ and
‘sliced onion’ are different descriptions used to refer to thesame ingredient ‘onion’. In order to make use of the recipes,we need to extract only the relevant ingredient informationfrom noisy user-provided ingredient lists. We used a combi-nation of heuristics and Natural Language Processing toolsto trim ingredient strings to their fundamental ingredients.
First, we removed unrelated characters and special symbolssuch as : and R©. Then, we used regular expressions to re-move bracketed comments so that ‘kielbasa (Polish) sausage(such as Hillshire Farm R©)’ becomes ‘kielbasa sausage’. Fi-nally, we made use of the Python Natural Language Toolkit(NLTK) library to filter words according to high-level con-

Figure 1: Word cloud of ingredient counts Figure 2: Ingredient co-occurence graph Figure 3: Ingredient clustering coefficientvs degree
Figure 4: User degree Figure 5: Recipe degree Figure 6: Ingredient degree
Figure 7: Ingredients PageRank cumula-tive distribution
Figure 8: User average rating Figure 9: Recipe average rating
cepts. Specifically, we use a Part-Of-Speech (POS) taggerand keep only nouns. Therefore, ‘Granny Smith apples sliced’becomes ‘Granny Smith apples’. This greatly increases theaccuracy of our ingredient retrieval and allows us to constructa high quality ingredients vocabulary as seen in Fig 1. Never-theless, we can still improve further on this step to properlyexpress tokens such as ‘ounce club soda’ as ‘club soda’.
Data StatisticsFor our initial analysis, we constructed a ratings (also recipe-user) graph which is a bipartite graph with users and recipesas nodes in different partitions, and directed weighted edgesrepresenting the ratings that users give for recipes. Addition-ally, we constructed an ingredients complement graph whichis an undirected graph with ingredients as nodes, and edgesrepresenting the PMI between two ingredients as defined inRecipe Recommendation Using Ingredient Networks. Note
that the ingredients complement graph is only for analysisand not used in the subsequent GNN algorithm. We generateda large number of different data statistics for each graph, andwe present some of the more meaningful ones here. Some ofthe basic ones are shown in Table 1.
Our initial analysis consisted of creating degree distribu-tions for the user data, recipe data, and ingredient data, ascaptured in the ratings graph and the ingredients complementgraph (see Figure 4, 5, 6).
Based on an initial analysis, it seems that the ingredientcomplement graph may have an unusual data distribution, asone would expect the degree distribution to be approximatelylinear on a log-log distribution, as was the case for usersand recipes (and most distributions). However, this mighthave been due to different sources of error: we could haveallowed for false positives or negatives in our preprocessing,the ingredient lists may be an incomplete representation of

Figure 10: User average rating vs number of ratings Figure 11: Recipe average rating vs number of ratings
Figure 12: Word cloud of inferred ingredients’ carbohydratescontent
Figure 13: Word cloud of inferred ingredients’ protein content
a recipe in real life, or we may be using ingredient datafrom people who have biases towards certain ingredients,particularly Western ones. As we’ll discuss later, having anunobjective dataset presents a host of problems which makedrawing conclusions hard. In that context, statistics suchas the average clustering coefficient and average degree foringredients may not mean much until we take a closer lookat our data pipeline.
To better understand the ingredients graph, we created aingredient co-occurence graph (Figure 2), which is the top20 ingredients over all recipes in terms of total co-occurencewith other ingredients. The radius of each circle stands fortotal co-occurences with other ingredients, and the widthof any edge stands for the raw count of co-occurences be-tween the two ingredients. This figure demonstrates that ouringredients graph is mostly making sense for the commoningredients, since most of the thick connections in the figuremake sense and the common ingredients on the figure areactually common in life. We then plotted the relationship
between clustering coefficient and ingredient degree (Figure3), which behaves as expected by showing the decline ofclustering coefficients as degree increases. Furthermore, wecomputed the PageRank for each ingredient and plotted thecumulative distribution of PageRank (7). This shows thatmost ingredients have similarly small PageRank, while asmall number have much larger PageRank, which furtherimplies that ingredient PageRanks approximately follow apower law distribution.
For the ratings graph, we wanted to further understanddistribution of user/recipe’s average ratings. So we plotted thedistribution of each user’s average ratings (Figure 8), as wellas the distribution of each recipe’s average ratings (Figure9). We then plotted the relationship between user/recipe’saverage rating and the number of ratings it has given/received(see 10, 11). As is shown by these diagrams, most userstend to give high ratings to recipes, and most recipes tend toreceive high ratings. Further, low average ratings tend to onlyoccur when a user/recipe has a very limited number of ratings.

This matches our intuition that a user is usually more likelyto give positive ratings than negative ones, but this tendencymight cause some class imbalance issues in our predictiontask because the dataset is skewed towards high ratings.
Problem StatementIn this work, we want to make novel recipe recommendationsthat are both healthy and tasty. We define a recipe by itslist of ingredients and it is novel if the recipe is not foundwithin our dataset. A recipe’s healthiness can be determinedby its amount of healthy vs unhealthy nutrients (such asproteins vs sodium) while its tastiness can be approximatedby the average ratings provided by a large number of users.However, because we are interested in making novel reciperecommendations where these recipes are out of our dataset,we cannot simply retrieve the nutrition content and ratingsof these recipes. Consequently, we have to infer both thehealthiness and tastiness of novel recipes through nutritionand ratings models that compute the nutritional content ofa recipe and the rating that a user would give the reciperespectively. Then, with these models, we are able to makegood healthy recipe recommendations by evaluating novelrecipes attained through different combinations of ingredientsand optimizing for a healthiness and tastiness score.
MethodNutrition ModelIn order to evaluate whether a recipe R is healthy, we need toknow the nutritional content H(R) of the ingredients withineach recipe. While recipe datasets might provide an aggre-gate nutritional content, they do not reveal the individualcomponents contributed by each ingredient. Therefore, ifthe ingredients were changed, the nutritional content willnot longer be valid. Even if we used a known database ofingredients’ nutritional content to facilitate the change of in-gredients, we will also need to know the mass of ingredientsin the recipe. Since we know neither the ingredient mass norindividual ingredient nutrition content, we cannot computenew recipes’ nutritional content.
We propose to solve the above problem by approximatingH(R) with our nutrition model H(R) = Rx, where R ∈RNR×NI is our full recipe sparse matrix where the entry Rij
indicates whether the ingredient Ij is present in the recipe Ri,and x ∈ RNI×h is the vector that represents the h nutritionalcontents of an ingredient. As x should be non-negative inall components, we cannot simply solve the linear equationRx = y as it can lead to negative x components. Therefore,we solve the following constrained optimization problem,
argminx
1
2||Rx− y||2
subject to x ≥ 0(1)
where y ∈ RNI×h is the actual nutrition content of the recipe.To evaluate the nutritional content of a candidate recipe Ri ∈RNI , we can simply return the dot product H(Ri) = RT
i x.Note that in this linear formulation, each ingredient is
assumed to have the same nutritional content over all the
different recipes. While this assumption is not true sincedifferent recipes use different amounts of ingredients, it isstill a sound and useful assumption since it finds the mostlikely nutritional content given all the recipes. It is reasonableto assume that the nutritional contributions of broccoli andpasta in different recipes are unlikely to differ substantially.Additionally, it will allow us to tackle the noise inherent inthe nutritional content provided by recipe databases.
Ratings Model
The ratings model predicts a user’s rating on a recipe whengiven the history of the user’s past ratings and the ratingsof all other users. If the recipe is within our database andhas been rated by other users before, then it corresponds tothe standard recommendation systems that commonly usecollaborative filtering algorithms. However, because we wantto recommend novel recipes that are not within the database,these algorithms will fall short. To tackle this novel reciperatings prediction task, we want to create a ratings modelwith several desiderata:
• The model should exploit the graph structure between in-gredients, recipes and users to have a deeper understandingof the relationships. Specifically, there are two bipartitegraphs, an ingredient-recipe graph where each recipe islinked to its component ingredients and a recipe-user graphwhere each edge represents the rating that the user havefor the recipe.
• There should not be any retraining when there are newusers or new recipes, because a novel recipe recommenda-tion algorithm will likely encounter many new users andnew recipes, and retraining in order to perform inferenceon them would make the application prohibitively slowand expensive.
Graph Neural Network Given the above desiderata, wedesign a graph neural network model based on a modificationof the GraphSAGE algorithm on top of the ingredient-recipeand recipe-user bipartite graphs (as seen in the left of Figure14) towards the problem of novel recipe rating prediction.Formally, let uv , rv , su,v denote the user v, recipe v and therating that user u gives for recipe v. We have a target user u∗and a target recipe r∗, and we would like to infer su∗,r∗ , therating that user u∗ has for recipe r∗. There are three stages inthe forward pass of the algorithm and we shall describe theprocedure and training using Figure 14:
Stage I Recipe vectors (2nd from left): We want to collectinformation about the recipes that our target user u∗ haverated before in order to understand user u∗’s recipe and in-gredient preferences. Specifically, we aggregate ingredientembeddings information to understand what constitute therecipes, and we collect average rating information about therecipes and the target user’s rating information about therecipes to understand how the user’s preferences might differfrom majority preferences. The resulting recipe vector −→rencapsulates this information. For v ∈ NRU (u∗), v 6= r∗,

3
2
1
2
43
1
2
3
1
Ingredients Users
Stage I: Recipe vectors
3
2
1
2
43
1
2
3
1
Ingredients Users
Original
5
4
4
5
3
2
5
4
4
5
3
2
3
2
1
2
43
1
2
3
1
Ingredients Users
Stage III: Prediction
5
4
4
5
3
2
3
2
1
2
43
1
2
3
1
Ingredients Users
Stage II: Personalization vector
5
4
4
5
3
2
RecipesRecipes RecipesRecipes
Figure 14: Training of GNN on ingredients, recipe and users data.
Ingredients Users
Stage I: Recipe vectors
3
2
1
2
4
3
1
2
3
1
Ingredients Users
New Recipe
5
4
4
5
3
2
Ingredients Users
Stage III: Prediction
Ingredients Users
Stage II: Personalization vector
RecipesRecipes RecipesRecipes
4
3
2
1
2
4
3
1
2
3
15
4
4
5
3
2
4
3
2
1
2
4
3
1
2
3
15
4
4
5
3
2
4
3
2
1
2
4
3
1
2
3
15
4
4
5
3
2
4
Figure 15: Inference on new recipes (purple node) which are not in the training data.
−→rv = MLP1
([AGG({−→im,∀m ∈ NIR(v)}); su∗,v;
Mean({sm,v,∀m ∈ NRU (v)})])
,
(2)
where NIR(v) and NRU (v) are the neighbors of v in theingredient-recipe and recipe-user graphs respectively,
−→iv is
the shallow ingredient embedding for ingredient v that al-lows us to capture the semantics of the ingredient, AGG isthe mean and max aggregation function for messages fromneighbors, and MLPk is the kth multi-layer perceptron thatextracts a high dimensional feature representation for ourinputs.
Stage II Personalization vector (3rd from left): In the pre-vious stage, we have computed individual recipe vectors fromthe ingredient embeddings and it has some personalizationelement through the ratings score. We will now aggregate theinformation from each of these recipes that have been ratedby the target user u∗ to compute a personalization vector
−→u∗ = MLP2
(AGG({−→rm,∀m ∈ NRU (u∗),m 6= r∗})
)(3)
for the user. This vector represents the user’s preferencesand can be used to model the user’s predictions on newrecipes. Note that we can generate this personalization vectoras soon as the user has given a rating on a single recipe in ourdatabase.
Stage III Prediction (4th from left): Finally, we combinethe information about the recipe from aggregation of theingredient embedding information, personalization vector ofthe target user −→u∗ and rating information of other users bypassing them through a MLP network which will predict
su∗,r∗ = MLP3
([AGG({−→im,∀m ∈ NIR(r∗)});−→u∗;
Mean({sm,r∗ ,∀m ∈ NRU (r∗),m 6= u∗})])
,
(4)
the estimate of the rating of user u∗ on r∗.Training Loss: During training, we use CE, the cross en-
tropy loss, on our predicted probability distribution su∗,r∗against the true distribution su∗,r∗ .
L = CE(su∗,r∗ , su∗,r∗) (5)
Inference on novel recipes (Figure 15): The updatedgraph on the left shows what happens when there is a newrecipe (purple node), note that there are no ratings from users

into the new recipe. The figure shows that we can performthe same three stage computation to predict user 2’s rating onthe new recipe (red line). Even when there are new recipes ornew users, we can build the computational graph on the flyand perform inference with a single forward pass.
Recipe Recommendation Using Nutrition andRatings ModelsAfter we have our nutrition model and ratings model, we canmake use of these two models to generate healthy and tastyrecipes. To achieve this goal, for any user U and given anyrecipe R, we can define an objective function
G(R) = H(R) + c · Rating(R,U).
Here, Rating(R,U) is the rating U gives to R, and c > 0is a constant picked by user depending on user’s preference.H(R) is the nutrition value we intend to optimize for (somevalue that satisfies “the higher the better”, e.g. how muchprotein the recipe provides). This nutrition value can be acombination of different nutrition values. For instance, ifone wants to have a low sugar and low sodium diet, thenone could set H(R) = −Sodium(R) − Sugar(R), whereSodium(R) and Sugar(R) are the sodium and sugar contentof R, respectively. For our needs, because we are mainlylooking at four types of nutrition values (fat, protein, sodium,sugar), we set
H(R) = c1 · Fat(R) + c2 · Protein(R)
+ c3 · Sodium(R) + c4 · Sugar(R),(6)
where c1, c2, c3, c4 are constants that a user can pick depend-ing on its own needs. Typically, c1, c3, c4 ≤ 0 and c2 ≥ 0because one wants to minimize fat, sodium and sugar contentwhile maximizing protein content.
One way we can maximize this objective function is bygreedily swapping ingredients already in the recipe with otheringredients for at most K times, so as to maximize this objec-tive function. This greedy approach might not give a globallyoptimal recipe, but it is can be interpreted easily and is highlyefficient in terms of run-time.
In this way, we can help create and recommend recipes thatsuit one’s taste and health needs. In terms of evaluation, wemainly use qualitative metrics to evaluate our result in reciperecommendation because of the subjectivity of the good-ness of recipes and because we are generating novel healthyrecipes which are unlikely to be in the recipe database.
ResultsIn our evaluation, we test the prediction performance of ourratings model by computing error metrics such as mean abso-lute error and root mean squared error on the actual ratings ofrecipe-user pairs in the test set. We will be comparing our rat-ings model with the collaborative filtering baselines and weknow that our ratings model is good when we achieve lowererror rates. While we are interested in evaluating the qualityof recipes generated against baseline recipe substitution meth-ods in (Elsweiler, Trattner, and Harvey 2017), it is difficult todo so because of the subjectivity of the goodness of recipes,and because we are generating novel healthy recipes that are
unlikely to be in the recipe database. Accordingly, we havechosen to focus more on qualitative results from our method.
Nutrition ModelAs discussed above, we built a linear model in order to inferthe nutritional content of ingredients which is not available inthe dataset. The following word clouds in Figures 12 and 13are visualizations of the inferred nutritional contents for dif-ferent ingredients using our linear model. For each ingredientin the word cloud of a nutrient, the size of the ingredient isproportional to the amount of the nutrient for that ingredient.We observe that pastry, rice and bun are in the carbohydratesword cloud and different steaks and chickens dominating theprotein word cloud, which is generally in line with what weexpect.
Ratings Model
Algorithm vs Metric MAE RMSEKNN CF (Memory-based) 0.614 0.885SVD CF (Model-based) 0.617 0.819
GraphSAGE on bipartite graphs 0.463 0.934
Table 2: Ratings prediction performance on test set.
Ratings prediction is a popular task that is commonly tack-led by collaborative filtering algorithms. We implementedtwo collaborative filtering algorithms to predict ratings ofusers on unseen recipes given how they have rated otherrecipes in the past. The two baselines are: a memory-basedmethod using K-Nearest Neighbours (KNN) and a model-based method using Singular Value Decomposition (SVD).In Table 2, we show the results on two metrics, Mean Ab-solute Error (MAE) and Root Mean Squared Error (RMSE).It can be observed that the performance of both methodsare fairly even on MAE but SVD CF outperforms KNN CFslightly with lower error on RMSE by 0.819 to 0.885. OurGraphSAGE-based method outperforms the collaborativebaselines on MAE by a decent margin of around 0.150 butperforms slightly worse on RMSE, suggesting that our al-gorithm might have substantial error for a minority of theexamples, but it produces less error for majority of the exam-ples.
Recipe Recommendation using Nutrition andRatings ModelsTo recommend healthy and tasty recipes using our nutritionmodel and ratings models, as stated previously, we try tomaximize
G(R) = H(R) + c · Rating(R,U),
where
H(R) = c1 · Fat(R) + c2 · Protein(R)
+ c3 · Sodium(R) + c4 · Sugar(R),(7)
In practice, because using the ratings model to generateratings Rating(R,U) takes a considerable amount of time,
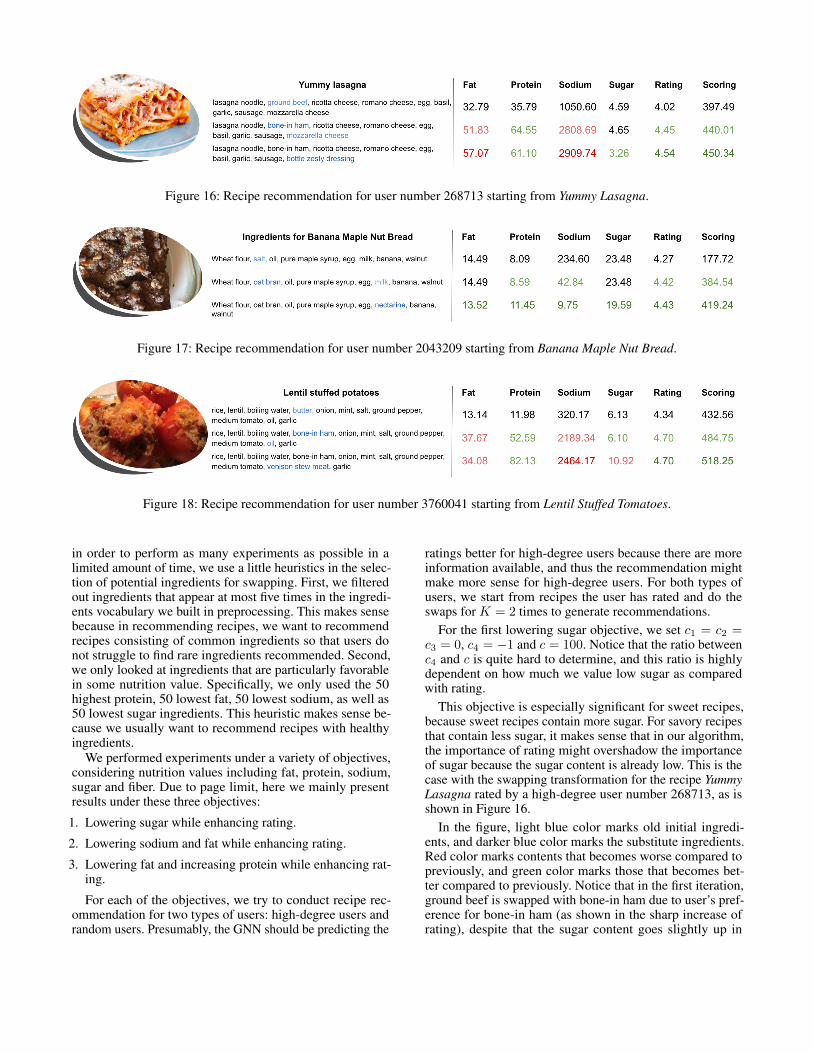
Figure 16: Recipe recommendation for user number 268713 starting from Yummy Lasagna.
Figure 17: Recipe recommendation for user number 2043209 starting from Banana Maple Nut Bread.
Figure 18: Recipe recommendation for user number 3760041 starting from Lentil Stuffed Tomatoes.
in order to perform as many experiments as possible in alimited amount of time, we use a little heuristics in the selec-tion of potential ingredients for swapping. First, we filteredout ingredients that appear at most five times in the ingredi-ents vocabulary we built in preprocessing. This makes sensebecause in recommending recipes, we want to recommendrecipes consisting of common ingredients so that users donot struggle to find rare ingredients recommended. Second,we only looked at ingredients that are particularly favorablein some nutrition value. Specifically, we only used the 50highest protein, 50 lowest fat, 50 lowest sodium, as well as50 lowest sugar ingredients. This heuristic makes sense be-cause we usually want to recommend recipes with healthyingredients.
We performed experiments under a variety of objectives,considering nutrition values including fat, protein, sodium,sugar and fiber. Due to page limit, here we mainly presentresults under these three objectives:
1. Lowering sugar while enhancing rating.
2. Lowering sodium and fat while enhancing rating.
3. Lowering fat and increasing protein while enhancing rat-ing.
For each of the objectives, we try to conduct recipe rec-ommendation for two types of users: high-degree users andrandom users. Presumably, the GNN should be predicting the
ratings better for high-degree users because there are moreinformation available, and thus the recommendation mightmake more sense for high-degree users. For both types ofusers, we start from recipes the user has rated and do theswaps for K = 2 times to generate recommendations.
For the first lowering sugar objective, we set c1 = c2 =c3 = 0, c4 = −1 and c = 100. Notice that the ratio betweenc4 and c is quite hard to determine, and this ratio is highlydependent on how much we value low sugar as comparedwith rating.
This objective is especially significant for sweet recipes,because sweet recipes contain more sugar. For savory recipesthat contain less sugar, it makes sense that in our algorithm,the importance of rating might overshadow the importanceof sugar because the sugar content is already low. This is thecase with the swapping transformation for the recipe YummyLasagna rated by a high-degree user number 268713, as isshown in Figure 16.
In the figure, light blue color marks old initial ingredi-ents, and darker blue color marks the substitute ingredients.Red color marks contents that becomes worse compared topreviously, and green color marks those that becomes bet-ter compared to previously. Notice that in the first iteration,ground beef is swapped with bone-in ham due to user’s pref-erence for bone-in ham (as shown in the sharp increase ofrating), despite that the sugar content goes slightly up in

the first iteration. In general, this swap makes sense becausebone-in ham and ground beef are comparable ingredients,while the user prefers the former over the latter.
Besides lowering sugar, lowering fat, lowering sodium andincreasing proteins are the important things to do. Underthese guidelines, we set up the second and third objectives.In the second lowering fat and sodium objective, we set c1 =−1, c3 = −1, c2 = c4 = 0 and c = 100. An example of thisis done on the recipe Banana Maple Nut Bread for anotherhigh-degree user number 2043209, as shown in Figure 17.
From this visualization, we can see that the two swaps con-ducted are salt to oat bran and milk to nectarine, respectively.Almost all nutrition values are changing in the favorable di-rections during the two swaps, and the resulting recipe alignswith human tastes and habits. This aligns with the fact thatuser number 2043209 is the user with the most ratings, andthus the GNN has a better embedding for it.
For the third objective, we set c3 = c4 = 0, c1 = −1,c2 = 1 and c = 100. In this objective, the naive choicepicked by this algorithm is often replacing high-fat ingredi-ents (e.g. butter, oil) with high-protein meat (e.g. ham, stewmeat). This makes sense to some extent because this servesour nutrition goal while maintaining some savory tastes. How-ever, in actual cooking, it might not be a practical choice toadd meat instead of oil in recipes. Here is one of such exam-ples: recipe Lentil Stuffed Tomatoes rated by a random usernumber 3760041, as shown in Figure 18. We can see that inboth swaps fatty ingredients got swapped with high-proteinmeat. Innately, it is harder to do recipe recommendation forrandom users than for high-degree users because there is lessinformation available.
In general, our recipe recommendation algorithm is per-forming in a reasonable way in coming up with healthy andhigh-rating recipes, although we are not sure about the actualpracticality of the new recipes we generated.
ConclusionIn this project, we proposed a three-part algorithm to predictusers’ ratings on recipes and recommend healthier and tastieralternative recipes. We constructed a nutrition model that as-signs various nutrition values to ingredients using constrainedoptimization of a linear model. We also designed and traineda GNN model to predict a user’s rating score for a recipebased on an ingredient-recipe graph and a recipe rating graphwe built from the recipe rating dataset. These two modelswere then combined to make novel recipe recommendationsfor users. With a greedy algorithm, we generated and visu-alized some reasonable and novel recipes for various users.With our algorithm, we hope that food recommendation cango beyond standard recipes within databases to innovativerecipes which are better in both health and taste.
ContributionsYew Siang: Report writing, Dataset preprocessing, Collabo-rative filtering baselines, Nutrition model, Formulation andimplementation of GNN-based ratings model.Anita: Report writing, inspecting data, generating data statis-tics and visualizations, implementation of recipe recommen-
dation using nutrition and ratings models, poster.Nicholas: Report writing, generating data statistics and vi-sualizations, poster, debugging, brainstorming the problemspace, cooking knowledge
ReferencesAhn, Y.-Y.; Ahnert, S. E.; Bagrow, J. P.; and Barabasi, A.-L. 2011. Flavor network and the principles of food pairing.Bulletin of the American Physical Society 56(1).Elsweiler, D.; Trattner, C.; and Harvey, M. 2017. Exploit-ing food choice biases for healthier recipe recommendation.Proceedings of the 40th International ACM SIGIR Confer-ence on Research and Development in Information Retrieval575–584.Teng, C.-Y.; Lin, Y.-R.; and Adamic, L. A. 2012. Reciperecommendation using ingredient networks. Proceedings ofthe 3rd Annuasl ACM Web Science Conference (WebSci’12)298–307.