heartsine technologies ltd
TRANSCRIPT

Observations of Pulse Wave Velocity prior to and following induced Ventricular
Fibrillation and Pacing in a porcine model
REBECCA DI MAIO, Ph.D.
Clinical Research Manager, HeartSine Technologies Ltd

Contents• Key Facts about Cardiovascular Diseases and
SCA• Guideline Updates…..2010• Pulse Wave Velocity Study
– Previous Work – Introduction– Methods– Results– Conclusions
KEY FACTS...
– In the UK 1,750 people die of sudden cardiac arrest each week*
– Over 70% of the deaths occur out of hospital
– The first guidelines on CPR produced in 1966 – discouraging the bystander CPR
– It wasn’t until 1994 with the “Good Samaritan Act” that bystander CPR was actively encouraged

CVD VERSUS CANCER DEATHS
Recent Guideline Updates
– 1992: The first ILCOR guidelines, designed to ensure international consensus on resuscitation
– 2000: Emphasis on public access defibrillation – 2005: ERC and AHA updated to emphasize the
importance of effective chest compressions
– 2008: AHA introduce the “hands-only” protocol to further minimize interruptions
*CH&S CVD Update 2008
2010 ERC and AHA GuidelinesMain Changes to 2005 guidelines:
• Dispatchers should be trained to interrogate callers with strict protocols to understand their symptoms, helping rescuers to recognise an unresponsive victim, absence of breathing or abnormality of breathing (importance of gasping)
• All rescuers, trained or not, should provide chest compressions to victims of a depth of at least 5cm and at a rate of 100 compressions per minute.
– Note: depth has increased from a max of 5cm to a min of 5cm (AHA state at least 2 inches)
• Interruptions to compressions should be minimized, trained rescuers should provide ventilations in addition to chest compressions.
• Telephone guided chest compressions is encouraged for untrained rescuers (note this has changed from 2005 for ERC guidelines as Europe did not adopt the "hands-only" policy in 2008)
• They encourage the use of CPR feedback systems for rescuers. – A system that allows recording and data retrieval is preferable to enable
trainers to use as quality monitoring tool (Note our system has this capability - CPR-Advisor 500P but we can also analyse patient cases offline for US customers to offer some feedback on CPR quality).
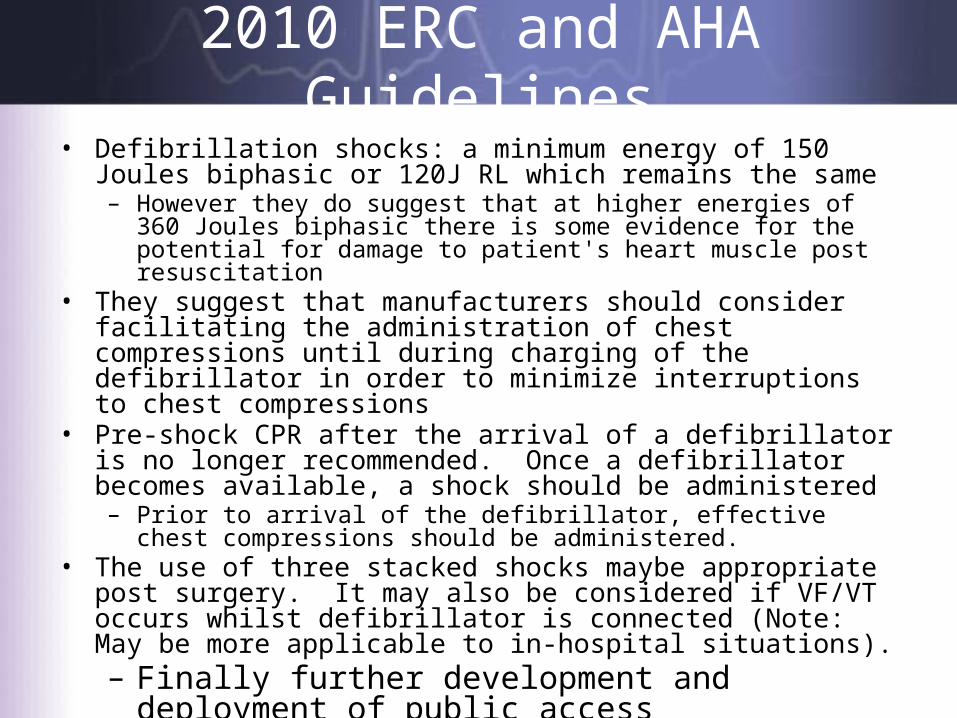
2010 ERC and AHA Guidelines• Defibrillation shocks: a minimum energy of 150 Joules biphasic or 120J RL
which remains the same– However they do suggest that at higher energies of 360 Joules biphasic there
is some evidence for the potential for damage to patient's heart muscle post resuscitation
• They suggest that manufacturers should consider facilitating the administration of chest compressions until during charging of the defibrillator in order to minimize interruptions to chest compressions
• Pre-shock CPR after the arrival of a defibrillator is no longer recommended. Once a defibrillator becomes available, a shock should be administered – Prior to arrival of the defibrillator, effective chest compressions should be
administered. • The use of three stacked shocks maybe appropriate post surgery. It may
also be considered if VF/VT occurs whilst defibrillator is connected (Note: May be more applicable to in-hospital situations).– Finally further development and deployment of public
access defibrillators are encouraged!
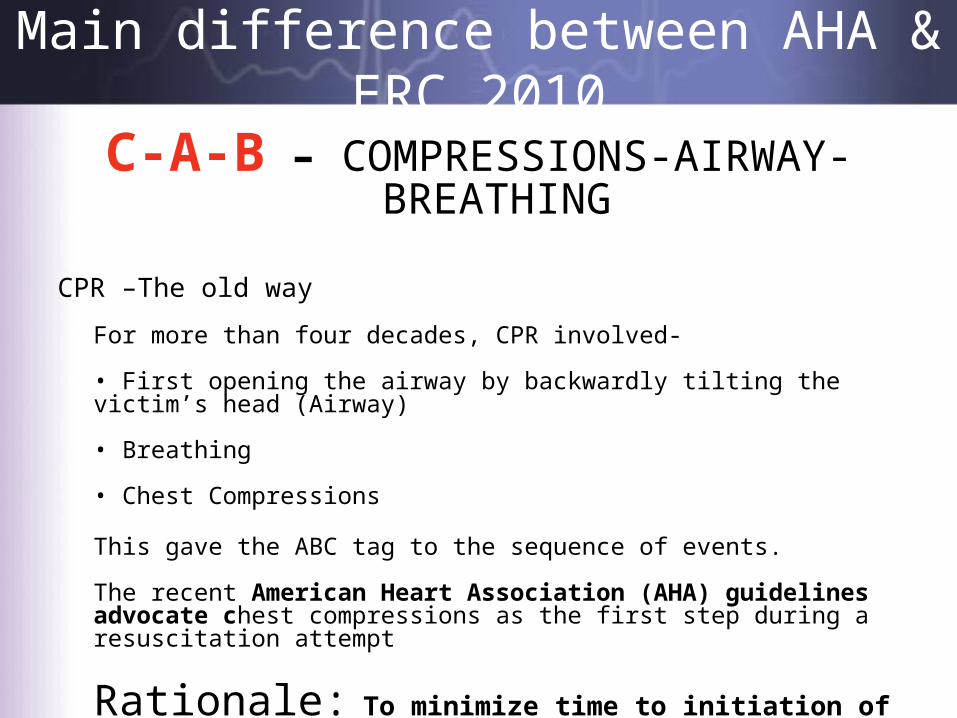
Main difference between AHA & ERC 2010
C-A-B – COMPRESSIONS-AIRWAY-BREATHING
CPR –The old way
For more than four decades, CPR involved-
• First opening the airway by backwardly tilting the victim’s head (Airway)
• Breathing
• Chest Compressions
This gave the ABC tag to the sequence of events.
The recent American Heart Association (AHA) guidelines advocate chest compressions as the first step during a resuscitation attempt
Rationale: To minimize time to initiation of chest compressions!
Previous Work• The use of pulse wave velocity as an index of arterial elasticity and stiffness, as
determined from the time delay between the foot of pulse pressure waves recorded at two different sites and the distance between those recording sites, has been extensively analysed
• In fact, it has been well established that PWV in an elastic tube is related to the elastic properties of the wall.
– This has been analysed from the theoretical and experimental points of view in a number of studies performed on fluid filled tubes, excised segments of arteries and in intact human subjects
– These physical concepts have been formalized in many mathematical models, where thick-walled viscoelastic tube
• The study of models, taking into account the main features of the human arterial tree, confirmed that the PWV given by the Moens-Korteweg equation or the Branwell-Hill equation presents a good approximation and evaluation
• Most notably McLaughlin et al describe the pulse wave velocity determination based on the measurement of two pulse waves at two different positions, such as the radial artery and the brachial artery in the same piezoelectric system used in this chapter
– The pulse wave velocity values obtained using a piezoelectric system are noted to be slightly higher but similar to published literature
Introduction
• When blood flows at higher pressures this in turn increases the strength of the palpable pulse – Pulse wave velocity (PWV) is the propagation of the deformation of
the arterial wall– In the aorta ejection of blood dilates the aortic wall and generates a
pressure wave which impacts directly on the arterial wall causing the aforementioned deformation which can be measured non-invasively using pulse wave velocity
• In this study we hoped to observe changes in PWV following the induction of pacing and VF as it was assumed that the amount of deformation decreases as the artery becomes less pulsatile – This is likely to be due to diminished blood pressure as a result of the
patient becoming haemodynamically compromised
Methodology
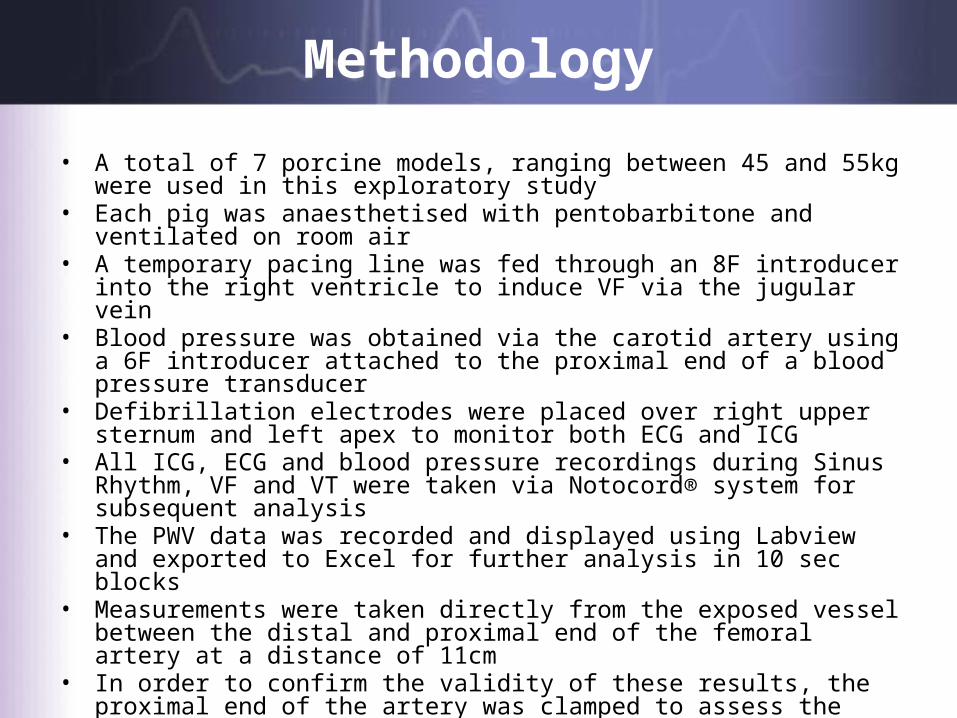
• A total of 7 porcine models, ranging between 45 and 55kg were used in this exploratory study
• Each pig was anaesthetised with pentobarbitone and ventilated on room air • A temporary pacing line was fed through an 8F introducer into the right ventricle
to induce VF via the jugular vein • Blood pressure was obtained via the carotid artery using a 6F introducer attached
to the proximal end of a blood pressure transducer• Defibrillation electrodes were placed over right upper sternum and left apex to
monitor both ECG and ICG• All ICG, ECG and blood pressure recordings during Sinus Rhythm, VF and VT were
taken via Notocord® system for subsequent analysis• The PWV data was recorded and displayed using Labview and exported to Excel for
further analysis in 10 sec blocks • Measurements were taken directly from the exposed vessel between the distal
and proximal end of the femoral artery at a distance of 11cm• In order to confirm the validity of these results, the proximal end of the artery was
clamped to assess the effects of interrupting blood flow on PWV
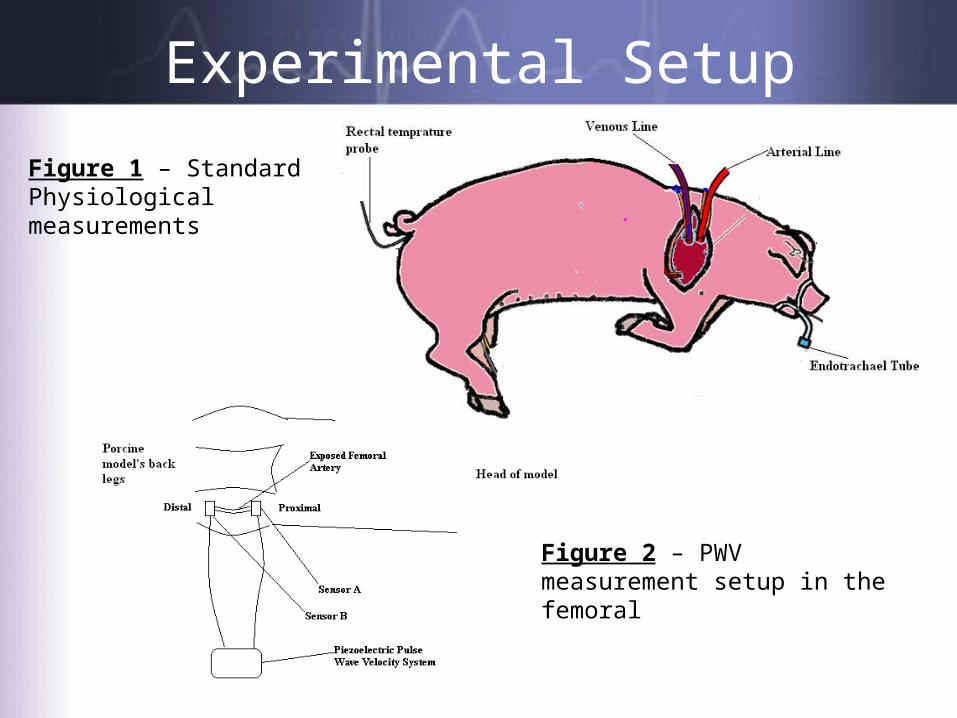
Experimental Setup
Figure 1 – Standard Physiological measurements
Figure 2 – PWV measurement setup in the femoral

Data Analysis
Table 1(a) - Signal outputs illustrating the methodology used to calculate distance between piezoelectric signal A and signal B and thereby the pulse wave velocity (m/s)

Data Analysis
Table 1(b) – Sample conversion table to determine pulse wave velocity from the pre-determined distance between pulses (as illustrated in 1(a)) and the distance between sensors (measured at outset of experiment – distal and proximal sensors)
Results
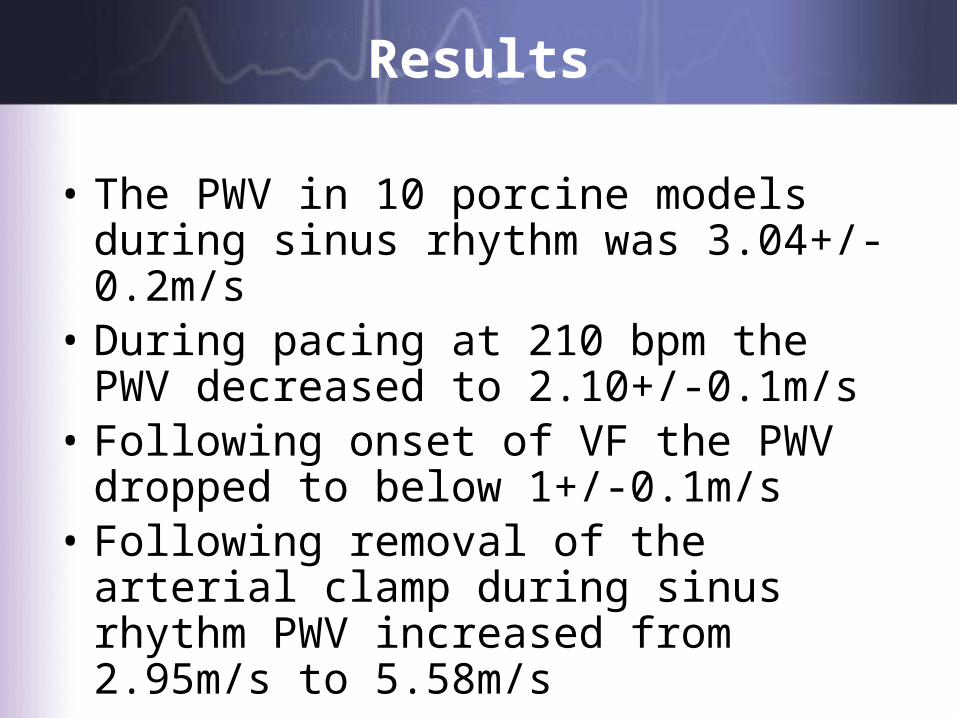
• The PWV in 10 porcine models during sinus rhythm was 3.04+/-0.2m/s
• During pacing at 210 bpm the PWV decreased to 2.10+/-0.1m/s
• Following onset of VF the PWV dropped to below 1+/-0.1m/s
• Following removal of the arterial clamp during sinus rhythm PWV increased from 2.95m/s to 5.58m/s
Results
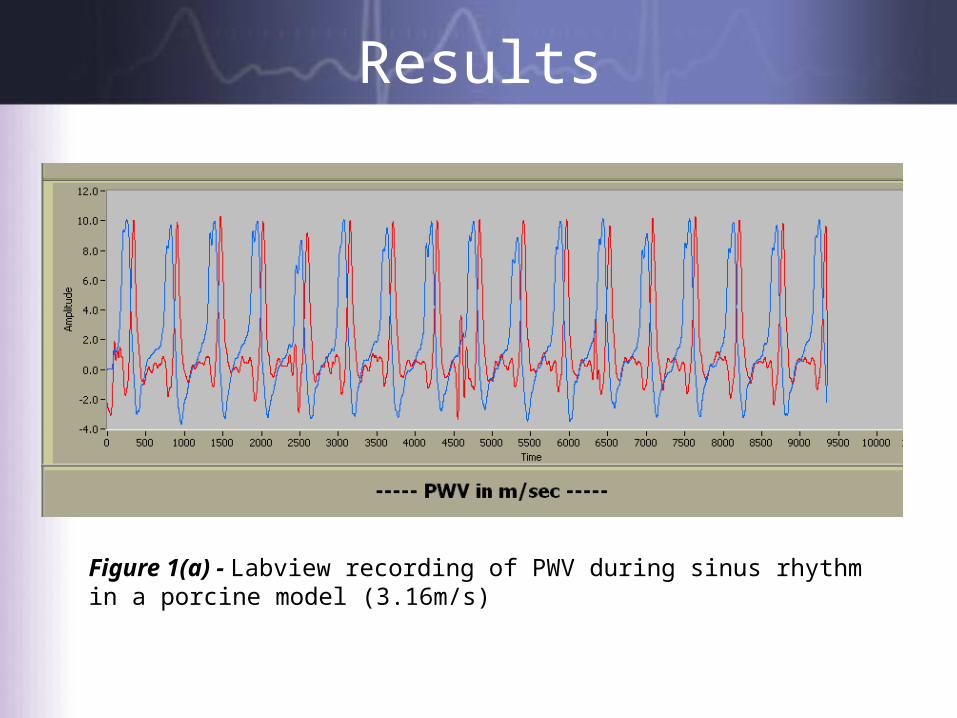
Figure 1(a) - Labview recording of PWV during sinus rhythm in a porcine model (3.16m/s)
Results
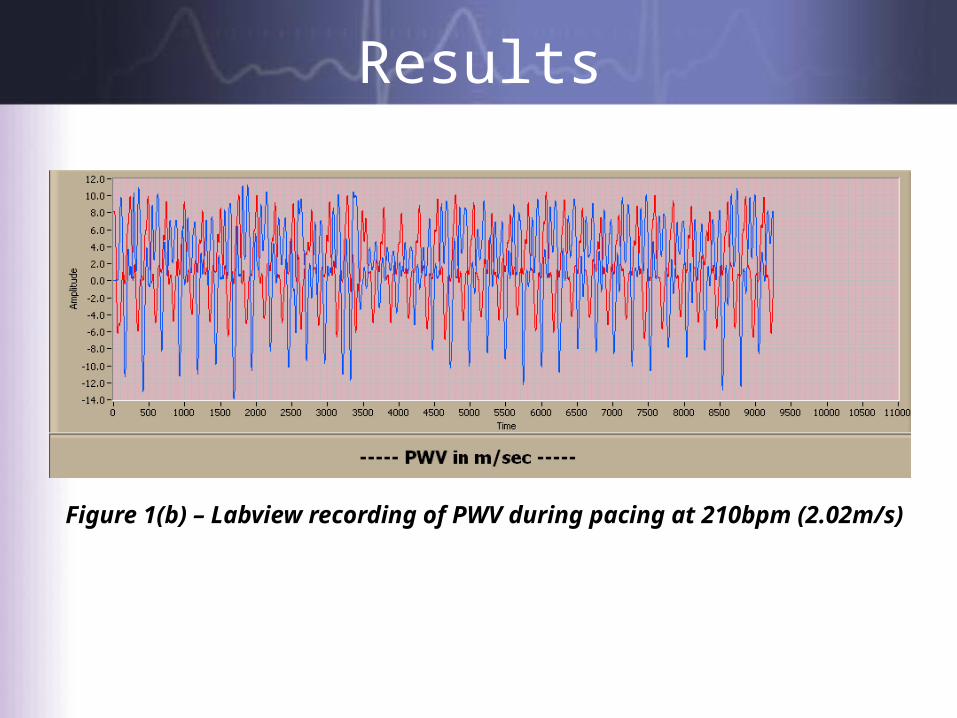
Figure 1(b) – Labview recording of PWV during pacing at 210bpm (2.02m/s)
Results
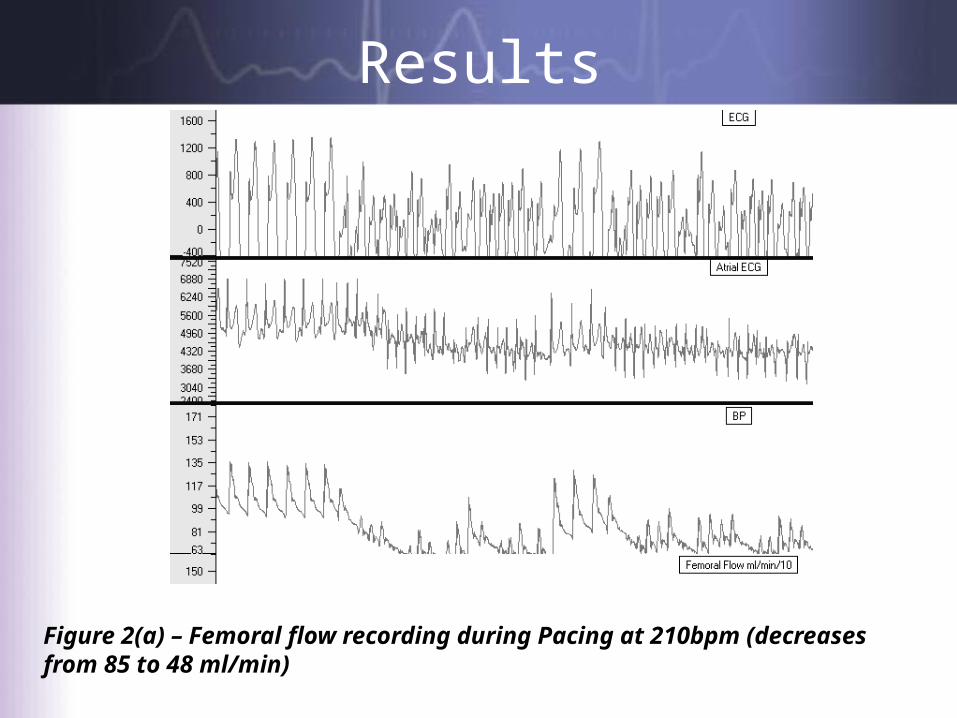
Figure 2(a) – Femoral flow recording during Pacing at 210bpm (decreases from 85 to 48 ml/min)
Results
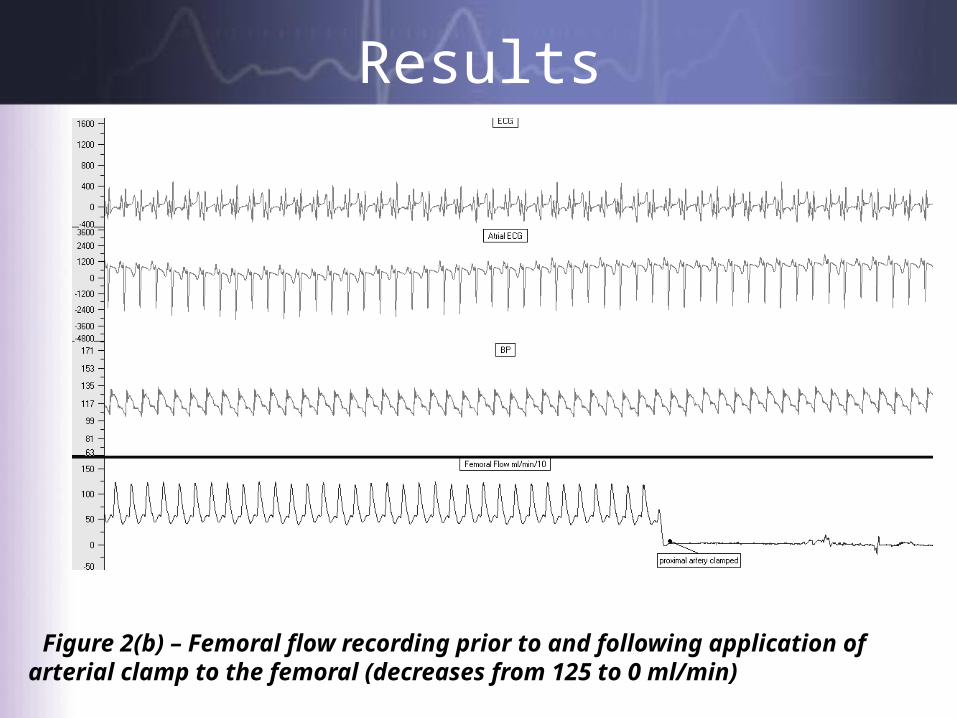
Figure 2(b) – Femoral flow recording prior to and following application of arterial clamp to the femoral (decreases from 125 to 0 ml/min)
Conclusions
PWV is a potential physiological indicator of VT and VF onset Pulse wave velocity decreases significantly following the onset
of cardiac arrest and during simulated non-shockable VT Results from clamping the proximal femoral artery indicate
that the PWV readings were due to blood flow rather than localised effects
The system is small and lightweight and therefore ideal as a non-invasive tool in the diagnosis of life threatening VF and VT in an out-of-hospital setting

Thank you for yourattention
Any Questions?