heat flux measurements and their uncertainty in a large ... · heat flux measurements and their...
TRANSCRIPT

Heat Flux Measurements and Their
Uncertainty in a Large-Scale Fire Test
Cecilia Lam and Elizabeth Weckman
Symposium on Uncertainty in Fire Standards
and What to Do About It
June 16, 2011 - Anaheim, CA

Introduction
• Heat flux measurement environments
may be dominated by radiation or a
combination of radiation and convection
Radiation-dominant Radiation and convection
Objective
• To highlight potential sources of uncertainty
in heat flux measurements by comparing
data taken with different types of heat flux
gage in a wind-blown fire environment

Test Facility
Large-scale test enclosure
Wind generation system

Experimental Setup, Plan View
x
y
2m dia. fuel pan
Exit plane of
fan plenumRaised floor surround
Upwind floor
extension
x = 1.5m
3m
2m
4m
6m 8m 9.2m
1m
y = 0m
2m
3m
-1m
-2m
-3m
Thermocouple rake
Group of heat
flux sensors,
x = 2.64m
Wind
direction

Heat Flux Gages
Gardon
Gage
Hemispherical
Heat Flux Gage
(HFG)
Directional Flame
Thermometer (DFT)
Thermocouple
Wind

Gardon Gauge
• Sensing area
• Ø 25 mm
• Sensitivity ≈ 9.8 (kW/m2)/mV
• Absorptivity = 0.94
• Body
• Water-cooled
• Ø 25 mm by 25 mm
deep
Ø 25 mm
Source: Robertson, A.F. and Ohlemiller, T.J., 1995, Low Heat-Flux
Measurements: Some Precautions, Fire Safety Journal, 25, 109-124.

Directional Flame Thermometer (DFT)
• 2 sensor plates
• 120 mm × 120 mm × 3.2 mm
• Inconel
• Thermocouple at centre of
each unexposed side
• Pyromark black paint
(ε = 0.85)
• Body
• 12 mm thick, 7% dense
FeCrAlM felt insulation
120 mm
totalQ
Thermocouples
Inconel sensor plate
Metal felt insulation
Inconel sensor plate

DFT Analysis
• One-dimensional inverse heat conduction
program (IHCP1D*)
totalQ
sensor plate
insulation
T(t) prescribed as
boundary condition
T(t) input to
IHCP1D program
* Beck, J.V., 1999, User’s Manual for IHCP1D, Beck Engineering Consultants Company, Okemos, MI, 7th edition, 62 pp.

Hemispherical Heat Flux Gauge (HFG)
• Sensor plate
• Ø 50 mm by 0.25 mm
• Stainless steel
• Thermocouple at centre
of unexposed side
• Pyromark
black paint
• Body
• Steel cylinder
filled with
insulation
102 mm
102 mm
Ø 50 mm
Stainless steel
sensor plate Lytherm insulation
Thermocouple
totalQ
Ceramic fibre
insulation
Stainless steel plate
Steel cylinder
Stainless steel plate
Stainless steel plate

HFG Analysis
• One-dimensional thermal response model*
sensor plate
insulation
T(t) input to model
totalQ
adiabatic boundary
condition
* Blanchat, T.K., Humphries, L.L. and Gill, W., 2002, “Sandia Heat Flux Gauge Thermal Response and Uncertainty Models,” Thermal
Measurements: The Foundation of Fire Standards, ASTM Special Technical Publication 1427, American Society for Testing and
Materials, West Conshohocken, PA, pp. 81-110.

Typical Heat Flux Time Traces
0 100 200 300 400 500 600
Time (s)
-50
0
50
100
150
200
250
He
at
Flu
x (
kW
/m2)
Gardon (total heat flux)
DFT (total heat flux)
HFG (total heat flux)

3 m/s wind, x = 2.64 m
0
50
100
150
200
250
-2 m -1 m 0 m 1 m 2 m
y
Incre
ase i
n T
ota
l H
eat
Flu
x
(kW
/m^
2)
Gardon
DFT
HFG
Typical Time-Averaged Heat Flux
HFG
n/a

Correcting Differences in Gage Position
• HFG and Gardon data corrected to location of DFT
y = 0 m y = ±1 m y = ±2 m
RadiationRadiation,
convectionRadiation
1
4
4
4
44
f
f
ffg
ffgffg
rad
T
TT
T
TTTQ
gf
gf
gfgf
conv
TT
T
TTh
TThTTThQ
1
4
4
4
44
f
f
ffg
ffgffg
rad
T
TT
T
TTTQ
1
F
F
FE
FEEFQrad
-0.1 0 0.1
y (m)
0.05
0.1
0.15
z (
m)
820
830
840
850
860
870
880
deg. C

Typical Results for y = ±2 m
y = +/- 2 m, 3 m/s Wind
Radiation < 15 kW/m2
-100%
-50%
0%
50%
100%
150%
200%
250%
300%
predicted measured predicted measured
y = -2 m y = 2 m
Perc
en
t D
iffe
ren
ce in
Heat
Flu
x R
ela
tive t
o D
FT
Gardon HFG
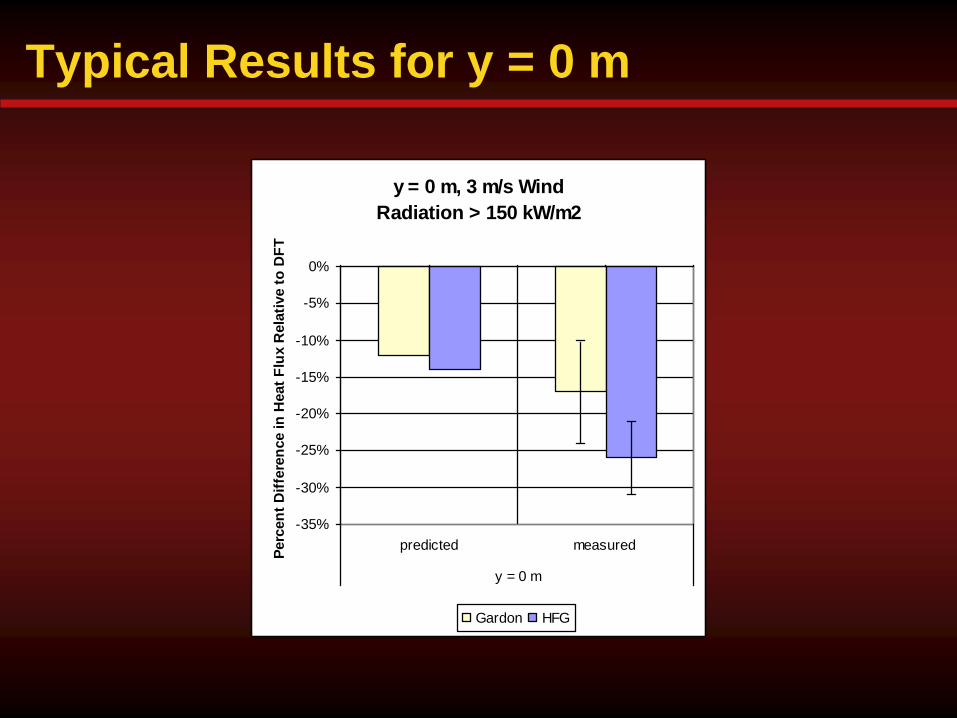
Typical Results for y = 0 m
y = 0 m, 3 m/s Wind
Radiation > 150 kW/m2
-35%
-30%
-25%
-20%
-15%
-10%
-5%
0%
predicted measured
y = 0 m
Perc
en
t D
iffe
ren
ce in
Heat
Flu
x R
ela
tive t
o D
FT
Gardon HFG

Potential Sources of Bias
Source: Robertson, A.F. and Ohlemiller, T.J., 1995, Low Heat-Flux
Measurements: Some Precautions, Fire Safety Journal, 25, 109-124.
Stainless steel
sensor plate Lytherm insulation
Thermocouple
totalQ
Ceramic fibre
insulation
Stainless steel plate
Steel cylinder
Stainless steel plate
Stainless steel plate
totalQ
Thermocouples
Inconel sensor plate
Metal felt insulation
Inconel sensor plate
Gardon:DFT:
HFG:
totalQ

Typical Results for y = ±1 m
y = +/-1 m, 3 m/s Wind
Radiation + Convection
-50%
0%
50%
100%
150%
200%
predicted
ΔQrad
predicted
ΔQconv
measured predicted
ΔQrad
predicted
ΔQconv
measured
y = -1 m y = 1 m
Perc
en
t D
iffe
ren
ce in
Heat
Flu
x R
ela
tive t
o D
FT
Gardon HFG
HFG
n/a
HFG
n/a
HFG
n/a

y = +/-1 m, 3 m/s Wind
Radiation + Convection
-50%
0%
50%
100%
150%
200%
predicted
ΔQrad
predicted
ΔQconv
measured predicted
ΔQrad
predicted
ΔQconv
measured
y = -1 m y = 1 m
Perc
en
t D
iffe
ren
ce in
Heat
Flu
x R
ela
tive t
o D
FT
Gardon HFG
HFG
n/a
HFG
n/a
HFG
n/a
Additional Source of Bias – Gardon
Source: Robertson, A.F. and Ohlemiller, T.J., 1995, Low Heat-Flux Measurements: Some
Precautions, Fire Safety Journal, 25, 109-124.
Temperature profile
under shear flow

Conclusions
• At high heat flux levels (> 150 kW/m2) with little
convection, use DFT or Gardon gage
• Can also use HFG, but may be affected by conduction
losses from sensor plate to gage housing
• At low heat flux levels (< 15 kW/m2), use gages
that best approximate the surface of interest
• Differences in gage surface temperature can cause
large differences in convective response (up to 200%)
• In mixed radiative-convective environments, don’t
use Gardon gage
• Lower surface temperature due to water-cooling
• Decreased sensitivity to convection

Acknowledgements
• Natural Sciences and Engineering
Research Council of Canada
• Canada Foundation for Innovation
• Ontario Innovation Trust (Canada)
• Sandia National Laboratories (USA)