heavy metals in paddy fields in taiwan: chemical behavior in soil...
TRANSCRIPT

Uitloop 0 lijn 0 195 mm0 15 mm 0 84 mm10 mm 15 mm 20 mm 5 mm
C.L. ChuP. F.A.M. RömkensH.Y. Guo
Alterra-rapport 1823, ISSN 1566-7197
Heavy metals in paddy fields in Taiwan: chemical behavior in soil and uptake by brown rice

Heavy metals in paddy fields in Taiwan: chemical behavior in soil and uptake by brown rice

2 Alterra-rapport 1823
Commissioned by BO International programme number BO-010-006-119

Heavy metals in paddy fields in Taiwan: chemical behavior in soil and uptake by brown rice C.L. Chu† P.F.A.M. Römkens H.Y. Guo
Alterra-rapport 1823 Alterra, Wageningen, 2009

4 Alterra-rapport 1823
ABSTRACT Chu, C.L., P.F.A.M. Römken & H.Y. Guo, 2009. Heavy metals in paddy fields in Taiwan: chemical behavior in soil and uptake by brown rice. TARI – Taichung and Alterra, Wageningen, Alterra-rapport 1823. 112 blz.; 25 figs.; 41 tables; 119 refs. Levels of cadmium (Cd), chromium (Cr), copper (Cu), nickel (Ni), lead (Pb) and zinc (Zn) were measured in 19 individual paddy fields in Taiwan. Total, reactive, and available metal levels were measured using Aqua Regia, 0.43 N HNO3, 0.1 M HCl, 0.05 M EDTA and 0.01 M CaCl2. Total metal levels ranged from below background levels to polluted and were highly heterogeneous across most fields. In general levels of metals in the soil decreased with an increase in distance from the water inlet which suggests that most metals originate from the irrigation water. Availability as measured by 0.01 M CaCl2 could be predicted well (Cd, Ni, Zn) by a Freundlich model similar to the one used in non-tropical soils. The fit of models for Cu and Pb was poor due to the lack of data on dissolved organic carbon (DOC). For Cr no fit was obtained at all. Uptake of Cd by rice was highly correlated to the availability as measured by CaCl2. Uptake models based on either the CaCl2 extractable Cd and Zn in soil solution, or a combination of the reactive Cd content in combination with pH and CEC proved equally suitable to predict Cd in rice. The impact of pH and, to a lesser extent, CEC urges the need to considere both properties when deriving soil quality standards (SQS). Uptake by rice by Indica species was markedly higher than that of Japonica although uptake by roots proved to be similar between both species. This suggests that differences between Japonica and Indica are more related to internal redistribution rather than differences in root uptake processes. Using the models, user friendly tools are designed allowing farmers and policy makers alike to evaluate the quality of the soil for a specific cultivar. This allows for a more accurate assessment of the suitability of the soil to be used for rice cropping compared to present soil standards based on Aqua Regia or HCl. As such the approach can be transferred easily to other countries as well based on a limited number of field tests. Keywords: bioavailability, cadmium, food safety, paddy fields, risk assessment, soil pollution, Taiwan, rice ISSN 1566-7197 The pdf file is free of charge and can be downloaded via the website www.alterra.wur.nl (go to Alterra reports). Alterra does not deliver printed versions of the Alterra reports. Printed versions can be ordered via the external distributor. For ordering have a look at www.boomblad.nl/rapportenservice.
© 2009 Alterra P.O. Box 47; 6700 AA Wageningen; The Netherlands
Phone: + 31 317 484700; fax: +31 317 419000; e-mail: [email protected] No part of this publication may be reproduced or published in any form or by any means, or stored in a database or retrieval system without the written permission of Alterra. Alterra assumes no liability for any losses resulting from the use of the research results or recommendations in this report. [Alterra-rapport 1823/July/2009]

Contents
Preface 7
Preface (continued) 9
Summary 13
1 Introduction 15
2 Description of sites and methods used in the field study 17 2.1 Location of sampling plots and cultivars used in the study 17 2.2 Soil pretreatment and chemical analyses 18 2.3 Plant pretreatment and chemical plant analyses 19 2.4 Conceptual framework to describe metal pools in soil according to their chemical availability. 19 2.5 Statistical analysis: soil – solution equilibrium 20 2.6 Statistical analysis: soil - plant equilibrium 21
3 Heavy metals in Paddy fields: overview of soil data 23 3.1 Soil properties of the fields included in the study 23 3.2 Heavy metal levels in soil 24
3.2.1 Total heavy metal content 27 3.2.2 Reactive metal pools 29 3.2.3 Actual available metal pools and solid-solution partitioning models 33 3.2.4 Effect of sampling time on the directly available metal pools and on solid-solution partitioning models 38
3.3 Mechanistic modeling of the availability of rice in soils 41 3.4 Conclusions 42
4 Uptake of metals by rice 45 4.1 General quality assessment of rice grown on study locations 45 4.2 Transfer of Cd from soil to roots and shoot-root ratios 48 4.3 Models to describe Cd uptake by rice: why? 49 4.4 Regression models to predict Cd levels in rice grain 50 4.5 Effect of time of harvest on the uptake of Cd by rice 53
5 Assessment of soil tests and soil-plant models to evaluate soil quality of paddy fields in relation to rice grain quality 57 5.1 Evaluation of the suitability of standards and models to test soils 57 5.2 Alternative soil standards based on soil tests with AR and HCl 60 5.3 Conclusions 61
6 Uncertainty of models to predict Cd uptake by rice 63 6.1 Introduction 63 6.2 Materials and Methods 64 6.3 Statistical approach to derive SQS based on soil to plant transfer

6 Alterra-rapport 1823
models 65 6.4 Results 65
6.4.1 Derivation of soil plant transfer models for different extracts 65 6.4.2 Soil quality standards (SQS) for individual cultivars 68 6.4.3 Assessment of soil quality based on the P50, P90 or P95 percentile SQS 72
7 Tools to assist farmers and policy makers to evaluate soil quality for rice cropping 77 7.1 Introduction 77 7.2 Look-up tables 77 7.3 Soil specific evaluation 80 7.4 Issues to be considered when using average field data 82
8 Conclusions and Recommendations 83
References 85
Appendices 1 Overview of model coefficients used to calculate Cd in brown rice from soil data (soil model) 93 2 Look-up tables for individual cultivars 95 3 Overview of soil data per site 97 4 Overview of plant data 105 5 Theory behind the derivation of P50, P90 and P95 confidence levels of soil
quality standards 111

Alterra-rapport 1823 7
Preface
This report is dedicated to the memory of Chien-Liang Chu who tragically lost his life due to a fatal traffic accident on May 3rd 2009. Without his help this study would not have been possible.
C.L. Chu


Alterra-rapport 1823 9
Preface (continued)
Rice is an important food crop in Taiwan. Historically, a large part of the rice consumed in the country has been produced locally in Taiwan. However, due to industrial activities across Taiwan, soil heavy metal levels (especially cadmium -Cd- and lead -Pb-) have increased which results in an increasing number of samples that do not meet the food quality standard for rice from the EU/WHO1 (0.2 mg kg-1) or even the Japanese/Taiwan standard of 0.4 mg kg-1. This increased uptake by rice is largely due to the increased level of metals in the soil. In Taiwan atmospheric deposition (Pb) and the use of contaminated irrigation water (Cd) are important sources which have resulted in the observed increase of metal levels in soil. This stresses the need for specific soil quality standards that can be used to identify soils where the quality is insufficient for being used for rice cropping. Present soil quality standards appear not to be protective enough since in many cases Cd levels in rice exceed food quality standards although the soil Cd level is below the standard of 5 mg kg-1 which is used for arable soils in Taiwan. Ideally, soil quality standards (SQS) for agriculture are based on the relationship between the quality of soil and that of the product grown on the soil. To establish such relationships, data on both soil and crop are needed as well as information on the availability of metals in the soil. To address these issues a large field study has been performed at 19 sites. In total 12 varieties of rice have been grown on a range of soils which reflect the range in heavy metals currently present in soils in Taiwan. The reason for studying different varieties, is that uptake of Cd strongly depends on the variety. Varieties that accumulate Cd are, therefore not suitable for being used on Cd rich soils, while species that do not accumulated can be grown safely. The aims of this study are to: 1. Establish the availability of metals in soil for plant uptake. This will be
accomplished by measuring the metal content in different extracts including strong acid (Aqua Regia, AR), dilute hydrochloric or nitric acid (0.1 M HCl, 0.43 M HNO3), synthetic chelates (EDTA) and neutral salt solutions (0.01 M CaCl2). These data will be used to evaluate whether the availability of metals can be estimated using one or more of the extracts mentioned here. It also can be used to assess whether methods used in different countries are comparable.
1 Recently the WHO/FAO food standard of 0.2 mg kg-1 is raised to 0.4 mg kg-1 but with reservations
from representatives from the EU and other countries. However, in the remainder of this report we will often refer to the (old) WHO standard of 0.2 mg kg-1

10 Alterra-rapport 1823
2. Establish the relationship between the heavy metal content in the soil and the uptake by 12 different varieties of rice. Based on the results the varieties will be grouped relative to their suitability for being used on polluted soils.
3. Develop tools for end-users (farmers, policy makers) that enable them to evaluate the quality of local fields. At present existing soil quality guidelines are insufficient to make an accurate assessment of the soil quality and rice crops often do not meet the food quality standards used in Taiwan.
Ultimately the data will be used to construct models to predict uptake of Cd from soil by the cultivars tested here. These models will be used to derive more meaningful soil quality standards to be used across Taiwan. The approaches tested here are similar to the ones currently applied in the Netherlands. As such, the concept allows for the derivation of standards to be used on a national level (generic standards) as well as standards or soil testing values on a local scale. Also, easy to use tools (so-called ‘look-up’ tables) will be developed to help farmers to decide which cultivars can be grown safely (if any) and if soil management (including lime application) can be used to improve soil conditions to such an extent that Cd levels in rice will remain below the food quality standard used in Taiwan. The approach is designed such that the set-up of the fieldwork can be applied in other areas of Asia as well which yields model parameters for cultivars used in other countries. Ideally, the methodology can be used to derive a framework for soil policy in the light of food safety which has a common basis but allows for regional standards. How to read this report Chapter 2 contains information on the location of the sites included in the study, analytical procedures and the models developed to predict uptake of metals by rice. Chapter 3 contains all results of the soil and soil solution data. This includes results from all metals which were analyzed initially (Cu, Cr, Ni, Pb and Zn). Data on the total metal content in the fields as well as the reactive and available metal content are described. Models to predict the availability are discussed with an emphasis on Cd. Chapters 4 discusses the major findings regarding the levels of Cd in rice and models to predict the transfer of Cd from soil into the rice grain. Chapter 5 contains the results from an analysis on the accuracy of soil tests and models to predict whether or not a soil is suitable for rice cropping. Also alternatives for the standards based on Aqua Regia and HCl are discussed. In chapter 6 a discussion on the reliability of the models to predict Cd in rice is presented. Chapters 3 to 6 contain all experimental results and reflect the scientific knowledge gained by this study. Aim of this study was to help policy makers and farmers alike make better decisions on the soil use. Therefore chapter 7 is dedicated to the practical application of the results. Here we will present applicable tools derived from the data and models to assist non-scientists in decision making on whether or not a soil can be used safely.

Alterra-rapport 1823 11
All soil, plant and model data are summarized in 4 appendices in the back of the report. The results presented in chapters 3 to 7 reflect the contents of three scientific papers which have been published or submitted recently in the following papers as well: Römkens, P.F.A.M., Guo, H.Y., Chu, C.L., Liu, T.S., Chiang, C.F., Koopmans, G.F.
2009. Characterization of soil metal pools in paddy fields in Taiwan: chemical extraction and solid-solution partitioning. J Soils Sediments (2009) 9:216–228.
Römkens, P.F.A.M., H.Y. Guo, C.L. Chu, T.S.Liu, C.F. Chiang, and G.F.
Koopmans. 2009. Prediction of Cadmium uptake by brown rice and derivation of soil-plant transfer models to improve soil protection guidelines. Environmental Pollution 157 (2009) 2435–2444.
Römkens, P.F.A.M. D.J. Brus, G.F. Koopmans, H.Y. Guo, C.L. Chu, T.S.Liu, and
C.F. Chiang. Derivation of probabilistic local soil quality standards for paddy fields using soil to plant transfer models and 0.01 M CaCl2 extracts. Submitted for publication in Environmental Pollution.
Acknowledgements The authors thank Dr T.S. Liu, Mr C.F. Chiang, Dr. D. Brus and Dr. G.F Koopmans for their contributions to this report. Also we thank EPA for the financial support to perform this study and financially supporting the field visits by P. Römkens to Taiwan. The financial means to complete this report have been supplied by the Dutch Ministry of Agriculture, Nature Conservation and Food Protection (LNV), BO Program ‘Internationaal’ , BO-010-006-119.


Alterra-rapport 1823 13
Summary
A large field study was conducted in 2005 – 2006 to measure the degree of contamination with heavy metals (HM) in paddy fields across the western plains of Taiwan. The second goal was to establish relationships between soil and the levels of HM in rice. The aim is to use such relationships to derive more meaningful soil protection guidelines for paddy fields and to construct easy to use tools for farmers and local policy makers to assess the suitability of paddy fields for rice cropping. Below the main findings are summarized, first results from the soil inventory are presented followed by results on rice and the relationship between soil and rice. Summary for major findings on HM in soils: HM levels in paddy fields are highly variable within a single field and between
fields; The in-field variation is related to the distance of the irrigation water inlet and
levels of most HM decrease with an increasing distance from the inlet; The between-field variation is related to the vicinity of different types of industry
and even within one community clear differences between the source of the HM can be found based on the ratio of HM in the soil;
Total HM levels extracted by Aqua Regia exceed current limits for arable soils; The amount of HM extracted by dilute acids (0.43 N HNO3 or 0.1 M HCl) or
EDTA are comparable, difference between HNO3 and HCl are small and both acids can be used to obtain an estimate of the reactive Cd content of the soil;
The ratio of reactive (as determined by dilute acids) and total HM content is comparable to those found in soils from the EU;
The availability of HM as measured by 0.01 M CaCl2 can be modeled quite well (except for Cr) using the reactive metal content, soil pH and CEC.
Only for Cu and Pb the models seem to be less accurate probably because no information on the levels of Dissolved Organic Matter (DOM) is available.
The models to describe the 0.01 M CaCl2 extractable metal content in paddy soils are comparable to those derived for soils from Belgium and the Netherlands. This suggests that the chemical behavior of metals in paddy fields during the drained periods is comparable to that in well-drained soils from moderate climates.
Summary of major findings on HM in rice with emphasis on Cd: Uptake of Cd by rice strongly depends on the cultivar: levels of Cd in Indica type
cultivars exceed that of Japonica type species; Even at low soil Cd levels (below 0.5 mg kg-1) levels of Cd in Indica rice species
exceed the food quality standard of 0.4 mg kg-1 ; Levels of Cd in brown rice are highly correlated to those in the roots; The amount of Cd in roots can be explained largely by the variation in the amount
of Cd and Zn in the 0.01 M CaCl2 extract; For the species tested in this study Zn reduces the sorption of Cd to the root
leading to lower levels of Cd in the rice grain;

14 Alterra-rapport 1823
The significant relation between Cd (and Zn) in the 0.01 M CaCl2 extract and levels in roots and rice grain, suggests that the total amount taken up by the rice plant largely depends on the chemical availability of Cd in the soil which can be predicted well by the Cd content of the soil, pH and CEC.
Summary of major findings on soil quality guidelines and tools developed in this study Current soil quality guidelines used in Taiwan (5 mg kg-1 for Aqua Regia or 2 mg
kg-1 for 0.1 M HCl) are too high to safeguard the quality of rice; a large number of soil samples with Cd below the (soil) standard have high (> food quality standard) levels of Cd in rice;
The use of pH and CEC when evaluating the suitability of soils for the production of rice leads to accurate assessments of the quality of the rice;
For soils with a pH of more than 6, fixed standards (1 or 2 mg kg-1 based on HCl) can be used for Japonica but these are not suitable for Indica;
Alternatively, soil tests based on a single extract with 0.01 M CaCl2 are also suitable to evaluate the quality of the soil for rice cropping;
The models developed and calibrated in this field study can be used to construct look-up tables which show the suitability of a specific soil for individual cultivars depending on the level of Cd in soil and pH
Differences in uptake of Cd by various cultivars can be used as a tool by farmers to select those cultivars that can be grown safely on a specific soil.
To obtain an accurate prediction of the suitability of a specific paddy field as whole for rice cropping, careful sampling schemes are essential due to the large observed variation in both Cd in soil and in the crop. Despite the fact that the models are good compared to previously published models from the literature, the uncertainty is still too large to obtain accurate predictions for individual samples.
Recommendations for policy regarding Cd in paddy fields This study clearly reveals that the levels of Cd in rice exceed current food quality standards even though in many cases the soil Cd content is below the soil quality standard. This indicates that the present soil standard of 5 mg kg-1 is too high. For Japonica which is less sensitive regarding uptake of Cd from soil, a standard of 2 mg kg-1 in clayey soils with a pH of 6 or higher seems protective enough. This is however true only for the food quality standard of 0.4 mg kg-1 which is currently being used in Taiwan. If the food quality standard is reduced to 0.2 mg kg-1 (current level used in the EU), the allowed Cd content in the soil obviously will be lower as well. For soils with a lower pH or lower clay content, as well as for soils used for Indica species, fixed soil standards are not suitable since they do not account for the strong impact of pH on the level of Cd in grains of brown rice. For those soils or rice varieties, the pH and CEC have to be considered. The use of crop specific look-up tables can be of help to assess whether or not the combination of the pH and the Cd content leads to Cd in rice below or above the food quality standard.

Alterra-rapport 1823 15
1 Introduction
Soil pollution in industrialized countries is of growing concern in relation to human health. Emission by industry (atmospheric, waste water and solid waste) as well as agriculture (manure disposal, hoof disinfection solutions, and medicinal waste material) has resulted in an increase in the content of many contaminants in soil. Especially metals like Cd pose a significant threat since this metal not only is toxic for animals and plants alike, it can also be taken up by various important food crops such as rice and wheat. To protect human health food quality standards are in place, which for rice vary between 0.2 mg kg-1 (EU standard as well as former WHO/FAO standard) and 0.4 mg kg-1 (Japanese/Taiwan standard and revised WHO standard). Due to soil pollution, soil Cd levels have increased all over the world which can result in an increase in uptake of Cd by arable crops as well. Especially in areas with high atmospheric deposition from industry (especially non-Ferro industry like Zn smelters) levels in soil have reached excessive levels. Usually Cd background levels in soil are low (less than 0.5 mg kg-1 depending on the parent material) but all over the world levels of more than 500 mg kg-1 have been reported although these levels are confined to hot spots. Estimates of the background levels for Cd in Taiwan are as low as 0.16 mg kg-1 (Yang and Chang, 2005) and soils with Cd levels higher than 0.64 mg kg-1 can be considered as polluted (Yang and Chang, 2005). However, levels between 1 and 20 mg kg-1 have become more and more common near industrial areas. At these levels, uptake of Cd by rice can result in Cd grain levels beyond the food quality standard. Major sources of heavy metals in Taiwan include direct deposition from the atmosphere near industrial zones, but more important is the use of polluted irrigation water. Untreated waste water from cities and industries has been used for decades to irrigate rice fields. A large part of the metals in the water is bound to some form of organic colloidal material which, after being led onto the field, deposits at the soil. Due to the limited solubility, metals are retained in the topsoil and can be taken up by plants depending on the geochemical availability and the plants selected. In many countries including Taiwan, soil standards have been developed to protect the ecosystem and human health. One of the problems with soil quality standards is that they do not, or only to a limited extent address the specific protection of the quality of arable products. In many cases these soil protection levels are related to direct effects on human health and not so much related to the quality of arable crops. Hence, to assess whether or not a soil is suitable for the production of specific crops like rice it is necessary to study the relationship between the soil ánd the crop of interest. Based on the results from such studies (which until now are rather scarce) specific target levels for agricultural soils can be developed. At present soil quality standards are in place. Soil Cd levels of more than 5 mg kg-1
(farmland, other soil use 20 mg kg-1) are considered dangerous and have to be reported (EPA, 2006). Aside from the standard based on the total amount in soils

16 Alterra-rapport 1823
(Aqua Regia, AR) also a proposal for a standard of 2 mg kg-1 based on 0.1 M HCl was put forward (Chen, 2000). It has become clear however, that the measurement of the total amount in soil is not always relevant since some part of the heavy metal content is not available for plant uptake. The use of dilute acids to measure the fraction of metals which can be taken up by plants instead of the total metal content is an option to correct for this. However, differences between plant species or varieties cause a large range in uptake by crops from similar soils. To derive meaningful standards for metals in soils, therefore, it is imperative to study the uptake in a wide range of soil including different varieties of crops. Measurements of soil properties such as pH and organic matter in addition to the metal content in the soil is important as well since differences in uptake are often related to differences in soil type. For several crops it has been documented that Cd uptake from a sandy soil with a low organic matter content at pH 4.5 exceeds that from soils at pH levels above 5 or 6. The aim of this study was to include those variables that affect the level of Cd in the crop which includes both differences in soil type and differences in uptake (species). Aside from this, different extracts are tested to evaluate which ones are most suitable to predict Cd levels in crops. Here, 3 extracts are tested (apart from the total metal content measured by Aqua Regia) that are commonly used to measure the availability of metals in soil: 0.1 M HCl (currently used in Taiwan), 0.43 N HNO3 (currently used in the Netherlands) en 0.05 M EDTA which is often used in plant uptake studies. Apart from these strong extracts also a salt solution (0.01 M CaCl2) is used to determine the amount of Cd that is believed to be available for plant uptake in a specific year. Apart from soil data, levels of Cd in various parts of rice plants (root, stem, leaf, husk and rice grain) are measured to assess the relation between soil quality and uptake by the crop. The data will allow for the development of models that predict both the chemical availability of Cd in paddy soils as well as models that predict the uptake of Cd by rice. In this report we focus on the quality of the rice grains since this is the plant part which is used for human consumption. Ultimately the results of this study will be used to derive soil quality standards that are protective enough to ensure the farmer that the rice grown on the soil indeed meets the food quality standard. A different approach to avoid excess uptake of Cd by rice is to select those rice cultivars which do not accumulate Cd. Especially in moderately polluted soils, crop (or cultivar) selection seems a good way to be able to use the soil in a safe way. Both approaches (soil tests and crop selection) will be discussed here.

Alterra-rapport 1823 17
2 Description of sites and methods used in the field study
2.1 Location of sampling plots and cultivars used in the study
In 2005 and 2006, soil samples were taken from 19 different paddy fields across the western plains in Taiwan. The fields were located in the towns of Chang Hua (CH, 3 fields), Ho Mei (HM, 3 fields), Lu Kang (LK, 2 fields), Hsin Chu (HC, 3 fields) and Pa-Deh (PD, 8 fields). In figure 2.1, an overview of the communities were the fields are located is shown. These plots were selected based on the known history of soil pollution and include both sites known to be heavily polluted (e.g. the PD fields) but also relatively clean sites with low metal levels in soil (such as the LK sites).
HC
PD
CH HM LK
Figure 2.1 Map of Taiwan and the location of the communities where the paddy fields used in this study are located (PD: Pa-Deh city, Tao-Yuan county; HC: Hsin-Chu city, Hsin-Chu county; CH: Chang-Hua city; HM: Ho-Mei city, LK: Lu-Kang city; the latter three communities are all located in Chang-Hua county)
Soils in these parts of Taiwan are mostly developed in unconsolidated river sediments in flat to undulating areas. All paddy fields were used for rice cropping prior to the fieldwork done described in this report. At each field, 12 cultivars of Indica and Japonica rice plant species were planted on plots with 5 to 9 replicates for each cultivar (depending on the size of the field, schematically shown in figure 2.2) to account for the high spatial variability of the metal levels in soil across the paddy field. In table 2.1 an overview of the cultivars used is shown.

18 Alterra-rapport 1823
Table 2.1 List of rice cultivars and number of samples for each cultivar.
Cultivar Cultivar name Family Number of samples
1 Tainung no.70 Japonica 277 2 Taiken no.8 Japonica 278 3 Tainung no.72 Japonica 278 4 Kaohsiung no.143 Japonica 278 5 Taitung no.30 Japonica 277 6 Tainung Sen no.20 Indica 277 7 Tainung no.71 Japonica 278 8 Tainung no.67 Japonica 278 9 Kaohsiung Sen Yu no.1151 Indica 210 10 (A) Taichung Sen Waxy no.1 Indica 278 11 (B) Taichung Sen no.10 Indica 278 12 (C) Kaohsiung no.144 Japonica 211
The total number of plots per field thus ranged from 60 (i.e., 5 replicates times 12 cultivars) to 108 (i.e., 9 replicates times 12 cultivars). Since the fields are different in size and shape, the size of the individual plots ranged from 1 to 2 m (width) by 9 to 11 m (length) depending on the total size of the field. Each plot was sampled twice during the year in May and November. In 2005, the CH, LK and HM fields were sampled while the HC and PD fields were sampled in 2006, which results in a database containing 3265 individual sampling data. Soil samples were taken from the topsoil (0–25 cm) from each plot using a hand auger at time of harvest when the paddy field was drained. Within each plot, up to 25 soil samples were taken at random across the plot and mixed manually resulting in a mixed sample of approximately 3 to 4 kg of field-moist soil.
Rice Variety (1 through 12)
Plo
t num
ber
1 2 3 4 5 6 7 8 9 10(A) 11(B) 12(C)123456789
Figure 2.2 Schematical lay-out of the fields included in the 2005 and 2006 fieldwork. Note that not all fields include 9 sections (ranging from 5 to 9 depending on the size of the field).
2.2 Soil pretreatment and chemical analyses
After collection of field-moist samples, soil samples were air-dried in air-conditioned rooms with a dehumidifier during 96 hr at 25 to 30°C. Dried soil samples were passed through a 2-mm sieve. After drying, the remaining moisture content was measured at 105°C to calculate the dry matter content. Total metal pools in air-dried

Alterra-rapport 1823 19
samples were determined by extraction with AR using a microwave digestion device (Lamothe et al., 1986). After destruction, extracts were filtered through a filter with a pore size of 2.5 µm (Whatman no.42), and analyzed for Cd, Cr, Cu, Ni, Pb, and Zn by an inductively coupled plasma-atomic emission spectrometer (ICP-AES). The reactive metal pool was measured by three reagents: (i) 0.43 M HNO3 (Houba et al., 1997), (ii) 0.1 M HCl (Nelson et al., 1959), and (iii) 0.05 M EDTA in the Na form (Na2-EDTA2H2O; Tiwari and Kumar 1982). All extractions were performed at a soil to solution ratio of 1:10 (w:v) for 1 hr. After shaking, all extracts were filtered (Whatman no.42), and metal concentrations were measured by ICP-AES. The directly available metal pool was measured by extraction with 0.01 M CaCl2 according to Houba et al. (2000). After shaking for 2 hr on a table-top shaker, extracts were filtered (Whatman No.42 filters), and metal concentrations were measured by ICP-AES. The pH was measured directly in CaCl2 extracts prior to filtration. SOM was determined by loss-on-ignition after heating at 400°C for 8 hr (US-EPA, 2002). CEC was determined using 1 M NH4OAc buffered at pH 7.0 (USDA 1996). Clay content was measured by laser spectroscopy (Xu 2000). SOM, pH and CEC were analyzed in all soil samples but clay content was only measured on a limited number of samples from each field. 2.3 Plant pretreatment and chemical plant analyses
Root tissues were washed with tap water and subsequently rinsed with de-ionized water. Large root and plant (stem, leave) tissue samples were shortened using a ceramic knife. Root, stem, leaves, husk and unpolished rice samples were dried at 70ºC for about 96 hr and ground to powder using a titanium-coated blade mill. Dried plant (except rice) material was digested with an acid mixture containing concentrated HNO3 and HClO4 mixed at a ratio of 5:1 (v:v) at 140ºC for 2 hr followed by a second step at 170ºC for 1 hr. After filtration (Whatman no. 42), Cd concentration in plant digests were measured by ICP-AES. Chemical analysis of rice grains was done on unpolished or brown rice grain samples. Dried rice grain material was digested using concentrated HNO3 at room temperature overnight. Subsequently, H2O2 was added followed by a second digestion in a microwave oven at 180ºC for 20 min. After filtration (Whatman no. 42), Cd concentrations in the extracts were determined by ICP-MS. Quality of the crop and soil analyses was monitored by including blanks and extracts obtained from soil or plant reference materials in each batch. 2.4 Conceptual framework to describe metal pools in soil according
to their chemical availability.
The concept of availability of metals in soils has gained considerable attention during the last few decades. It is clear that not all metals (and organic contaminants alike) are equally availably for uptake by plants or leaching to ground- and surface waters. To improve risk assessment approaches it is therefore imperative to find methods that are able to more specifically measure the available fractions in soil. In this report

20 Alterra-rapport 1823
we want to assess to what extent the behavior of heavy metals in soils can be characterized according to the scheme illustrated in figure 2.3. Ultimately the goal is to link plant uptake to the pools characterized by the methods as mentioned in figure 2.3
Total metal pool in soil (AR/HF/XRF)
Reactive Pool
(0.43 M HNO3, 0.1 M HCl, 0.05 M EDTA)
Directly Available Pool
(0.01 M CaCl2)
Inert, non-reactivePool
Very slow release(weathering)
Chemical equilibrium(adsorption/precipitation)
Adsorbed/reactive precipitates Soil solutionCrystalmatrix
Figure 2.3 methods used in this report to measure different fractions of metals in soil ranging from inert (not available) to directly available for plant uptake.
Please note that the size of the individual pools is not according to scale and may differ depending on the metal of interest. A rather fast (hours to days) equilibrium is assumed to exist between the reactive metal pool and the directly available pool. The release of metals from the inert fraction on the other hand is very slow (years to decades) and is mainly due to weathering of soil minerals. Total metal content can be measured by extraction of soil with Aqua Regia (AR) or hydrofluoric acid (HF) or by X-ray fluorescence (XRF). Reactive metal pool can be determined by extraction of soil with 0.43 M HNO3, 0.1 M HCl or 0.05 M EDTA, whereas the directly available metal pool can be determined by extraction with 0.01 M CaCl2. The methods actually used in the study are included because they are either commonly used in current legislation (like Aqua Regia for the total metal content and 0.1 HCl for the reactive part) or because it has been shown experimentally that the methods appear suitable (like 0.01 M CaCl2 for the directly available pool and 0.43 HNO3 for the reactive fraction). 2.5 Statistical analysis: soil – solution equilibrium
Multiple linear regression analysis was performed to derive the solid-solution partition models of metals. All data were log-transformed (except for pH) prior to the regression. An extended Freundlich equation was used to relate the directly available metal pool to the reactive metal pool in combination with soil properties like pH and CEC. This approach has been used previously by several authors and was able to explain a large part of the observed variability in the solubility of metals like Cd, Zn, Cu and Pb (Römkens et al., 2004; Ingwersen and Streck 2006; Meers et al., 2007; Koopmans et al., 2008a). log[Me-CaCl2] = intercept + apH + blog[CEC] + clog[Me-reactive pool] [2.1]

Alterra-rapport 1823 21
With [Me-CaCl2] directly available metal pool extracted with 0.01 M CaCl2 in
mg kg-1; pH pH in the 0.01 M CaCl2 extracts; [CEC] cation exchange capacity in cmol(+) kg-1; [Me-reactive pool] reactive soil metal content determined by extraction with
either HCl, HNO3 or EDTA in mg kg-1. SOM was not included in Eq. 2.1, because its contribution to the regression in addition to CEC appeared to be not significant. The CEC alone is able to represent the exchange capacity of the soil and as such includes the contribution from different soil components such as SOM, clay and amorphous Al and Fe oxides. All regression analyses and further statistical tests were carried out using Genstat (version 11.1) 2.6 Statistical analysis: soil - plant equilibrium
Accumulation of Cd in rice grains can be related to the available Cd and Zn pool in soil (0.01M CaCl2):
10log[Cd-rice grains] = intercept + a 10log[Cd-CaCl2] b 10log[Zn-CaCl2] [2.2] Combining eqs. [2.1] and [2.2] results in a soil-plant transfer function (McGrath et al., 2000; Efroymson et al., 2001; Krauss et al., 2002; Brus et al., 2005; Japenga et al., 2007): 10log[Cd-grain] = intercept + f10log[Cd-HNO3] + gpH + h10log[CEC] [2.3] In this report, we use eqs. [2.2] and [2.3] to predict Cd levels in rice grains. We use the terms ‘CaCl2-model’ or ‘soil solution model’ for eq. [2.2] and ‘HNO3-model’ or ‘soil to plant relationship’ for eq. [2.3]. Relationships were derived for each cultivar separately and for the combined data for Japonica or Indica cultivars. All regression analyses and further statistical tests were carried out using Genstat (version 11.1)

Alterra-rapport 1823 23
3 Heavy metals in Paddy fields: overview of soil data
In this chapter, data on the level of soil pollution will be presented. Aside from Cd also other metals including Cu, Pb, Zn, Ni and Cr were measured and will be included here. The remainder of the report will focus on Cd since this element is of prime importance in relation to food safety. 3.1 Soil properties of the fields included in the study
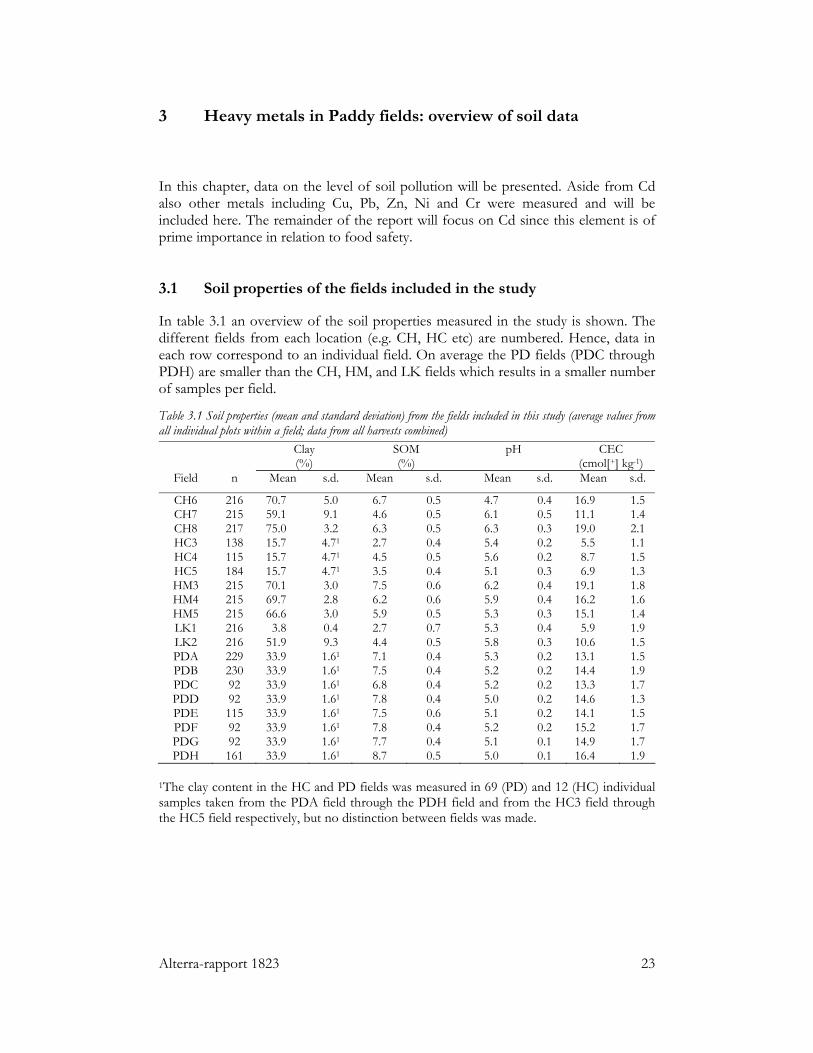
In table 3.1 an overview of the soil properties measured in the study is shown. The different fields from each location (e.g. CH, HC etc) are numbered. Hence, data in each row correspond to an individual field. On average the PD fields (PDC through PDH) are smaller than the CH, HM, and LK fields which results in a smaller number of samples per field.
Table 3.1 Soil properties (mean and standard deviation) from the fields included in this study (average values from all individual plots within a field; data from all harvests combined)
Clay (%)
SOM (%)
pH
CEC (cmol[+] kg-1)
Field n Mean s.d. Mean s.d. Mean s.d. Mean s.d.
CH6 216 70.7 5.0 6.7 0.5 4.7 0.4 16.9 1.5 CH7 215 59.1 9.1 4.6 0.5 6.1 0.5 11.1 1.4 CH8 217 75.0 3.2 6.3 0.5 6.3 0.3 19.0 2.1 HC3 138 15.7 4.71 2.7 0.4 5.4 0.2 5.5 1.1 HC4 115 15.7 4.71 4.5 0.5 5.6 0.2 8.7 1.5 HC5 184 15.7 4.71 3.5 0.4 5.1 0.3 6.9 1.3 HM3 215 70.1 3.0 7.5 0.6 6.2 0.4 19.1 1.8 HM4 215 69.7 2.8 6.2 0.6 5.9 0.4 16.2 1.6 HM5 215 66.6 3.0 5.9 0.5 5.3 0.3 15.1 1.4 LK1 216 3.8 0.4 2.7 0.7 5.3 0.4 5.9 1.9 LK2 216 51.9 9.3 4.4 0.5 5.8 0.3 10.6 1.5 PDA 229 33.9 1.61 7.1 0.4 5.3 0.2 13.1 1.5 PDB 230 33.9 1.61 7.5 0.4 5.2 0.2 14.4 1.9 PDC 92 33.9 1.61 6.8 0.4 5.2 0.2 13.3 1.7 PDD 92 33.9 1.61 7.8 0.4 5.0 0.2 14.6 1.3 PDE 115 33.9 1.61 7.5 0.6 5.1 0.2 14.1 1.5 PDF 92 33.9 1.61 7.8 0.4 5.2 0.2 15.2 1.7 PDG 92 33.9 1.61 7.7 0.4 5.1 0.1 14.9 1.7 PDH 161 33.9 1.61 8.7 0.5 5.0 0.1 16.4 1.9
1The clay content in the HC and PD fields was measured in 69 (PD) and 12 (HC) individual samples taken from the PDA field through the PDH field and from the HC3 field through the HC5 field respectively, but no distinction between fields was made.

24 Alterra-rapport 1823
The soils included in the study possess a rather wide range in texture, ranging from sandy soils (LK1) to heavy clay soils (HM plots and CH plots). The pH varies widely from acid (CH6) to near neutral (CH8), although most of the soils in this study tend to be slightly acid with pH values ranging between 5 and 6 with 25% of the samples having a pH value below 5.1. SOM levels are fairly comparable and range from less than 3% in the LK1 and HC3 plot to almost 9% in the PDH plot. CEC values can be classified broadly into two groups, soils with a rather low CEC around 5 cmol(+) kg-1 (HC and LK1 plots) and soils with CEC values around 15 cmol(+) kg-1. Differences in CEC were closely linked those in the SOM content as is shown in figure 3.1 which reflects the impact of SOM on the capacity of the soil to bind cations.
CEC = 2.7xOM - 1.5
R2 = 0.86
0
5
10
15
20
25
2 3 4 5 6 7 8
Organic Matter (%)
CE
C (
cmo
l+ kg
-1)
Figure 3.1. Relation between organic matter (median value per site) and CEC (median value per site)
Soil pH had little effect on CEC which is not surprising since CEC was measured at pH 7 in all soils using a buffered NH4OAc solution. The range in soil properties within each field is limited as is indicated by the low standard deviation. As such, the ranges found for these soil properties are comparable to those measured by others within paddy rice fields (e.g., He et al., 2006; Simmons et al., 2008) and reflect the ranges in soil properties commonly observed. 3.2 Heavy metal levels in soil
An overview of the amount of metals present in the soils studied is shown in table 3.2 and graphically in figure 3.2.

Alterra-rapport 1823 25
Table 3.2 Overview of the total, reactive and directly available metal pools in all 19 fields as measured by extraction with Aqua Regia (AR; total metal content), 0.1 M HCl, 0.43 M HNO3 or 0.05 M EDTA (reactive metal pool), and 0.01 M CaCl2 (directly available pool)
Percentiles of HM content in various extracts (mg kg-1)
Metal Extract n Min. 5% 25% 50% Mean2 75% 95% Max.
Soil quality standard1
(mg kg-1) Cd AR 3265 0.06 0.21 0.39 0.64 3.8 5.3 14.9 29.4 5.0 HCl 3250 0.01 0.11 0.22 0.41 3.0 4.3 12.1 25.7 HNO3 3266 0.08 0.13 0.22 0.41 3.1 4.6 12.3 20.6 EDTA 3265 0.05 0.11 0.21 0.39 2.3 3.6 9.1 16.4 CaCl2 3255 0.001 0.004 0.01 0.04 0.29 0.46 1.3 3.2 Cr AR 3265 38.9 47.2 54.8 80.0 94.4 112.4 203.9 483.0 250 HCl 2560 0.01 0.13 0.89 2.1 2.9 3.5 9.1 31.6 HNO3 3265 0.93 1.8 2.6 4.9 7.2 8.3 22.2 82.4 EDTA 2072 0.004 0.1 0.63 1.1 1.5 1.9 4.0 9.2 CaCl2 2567 < 0.001 0.002 0.01 0.02 0.02 0.02 0.04 0.2 Cu AR 3265 22.9 29.9 55.0 101.5 123.9 150.4 312.1 903.5 200 HCl 3265 6.7 11.3 22.6 50.9 64.7 73.3 180.9 640.3
HNO3 3265 9.8 14.5 27.8 60.3 74.4 86.5 199.8 635.8 EDTA 3265 5.0 12.9 24.0 56.4 70.5 86.5 193.2 539.3 CaCl2 2776 < 0.001 0.008 0.03 0.07 0.18 0.18 0.73 9.2
1Soil monitoring value for cropped soils used at present in Taiwan (EPA 2006). 2All elements have a log-normal distribution, which results in a large difference between the median and the average value.

26 Alterra-rapport 1823
Table 3.2 Continued
Percentiles of HM content in various extracts (mg kg-1)
Metal Extract n Min. 5% 25% 50% Mean2 75% 95% Max.
Soil quality standard1
(mg kg-1) Ni AR 3265 16.8 26.1 32.5 72.9 97.9 147.1 245.6 461.4 200 HCl 3265 0.83 2.1 3.9 23.9 23.9 39.5 59.4 101.7 HNO3 3265 1.7 2.7 4.9 27.3 26.8 44.7 64.8 102.2 EDTA 3265 0.80 2.1 4.1 22.7 23.9 40.1 60.3 89.1 CaCl2 3185 0.002 0.082 0.257 0.954 3.1 4.8 12.0 29.4 Pb AR 3265 10.8 21.2 30.9 48.8 164.4 194.1 665.5 1171.4 500 HCl 3262 0.30 4.7 7.8 13.6 84.6 83.7 389.1 821.7 HNO3 3265 6.7 12.0 17.5 26.2 110.4 127.3 476.7 755.6 EDTA 3265 2.0 7.8 11.9 19.8 92.3 109.0 400.7 624.9 CaCl2 2197 < 0.001 0.01 0.06 0.15 0.20 0.309 0.543 1.05 Zn AR 3265 63.1 99.1 197.1 277.2 311.7 386.3 666.5 1225.3 600 HCl 3265 11.9 22.8 41.7 60.8 77.7 97.0 179.5 537.3 HNO3 3265 17.3 25.7 49.8 70.8 90.4 111.8 209.5 574.2 EDTA 3265 10.7 20.1 36.0 54.5 68.6 86.4 160.6 383.6 CaCl2 3244 0.009 0.13 1.9 5.5 8.0 10.5 25.0 96.9
1Soil monitoring value for cropped soils used at present in Taiwan (EPA 2006). 2All elements have a log-normal distribution, which results in a large difference between the median and the average value.

Alterra-rapport 1823 27
0
100
200
300
400
500
600
700
800
900
1000
CH
6
CH
7
CH
8
HC
3
HC
4
HC
5
HM
3
HM
4
HM
5
LK
1
LK
2
PDA
PDB
PDC
PDD
PDE
PDG
PDH
Site
AR
(mg
kg-1
)
COPPER
0
50
100
150
200
250
300
350
400
450
500
CH
6
CH
7
CH
8
HC
3
HC
4
HC
5
HM
3
HM
4
HM
5
LK
1
LK
2
PDA
PDB
PDC
PDD
PDE
PDG
PDH
Site
AR
(mg
kg-1
)
NICKEL
0
200
400
600
800
1000
1200
1400
CH
6
CH
7
CH
8
HC
3
HC
4
HC
5
HM
3
HM
4
HM
5
LK
1
LK
2
PDA
PDB
PDC
PDD
PDE
PDG
PDH
Site
AR
(mg
kg-1
)
ZINC
0
200
400
600
800
1000
1200
1400
CH
6
CH
7
CH
8
HC
3
HC
4
HC
5
HM
3
HM
4
HM
5
LK
1
LK
2
PDA
PDB
PDC
PDD
PDE
PDG
PDH
Site
AR
(mg
kg-1
)
LEAD
0
5
10
15
20
25
30
35
CH
6
CH
7
CH
8
HC
3
HC
4
HC
5
HM
3
HM
4
HM
5
LK
1
LK
2
PDA
PDB
PDC
PDD
PDE
PDG
PDH
Site
AR
(mg
kg-1
)
CADMIUM
0
100
200
300
400
500
600
CH
6
CH
7
CH
8
HC
3
HC
4
HC
5
HM
3
HM
4
HM
5
LK
1
LK
2
PDA
PDB
PDC
PDD
PDE
PDG
PDH
Site
AR
(mg
kg-1
)
CHROMIUM
Figure 3.2 Heavy metal contents as measured by extraction with Aqua Regia in the 19 paddy fields used in this study. The boxes represent the 25 and 75 percentile levels whereas the solid Y-bars represent the minimum and maximum level found within each field. The dark bar within the box is equal to the median value (50 percentile). The dashed red lines represent the soil monitoring value for cropped land in Taiwan (EPA 2006).
3.2.1 Total heavy metal content
Total metal levels vary considerably between and within fields, and they range from background levels to levels beyond current soil quality standards used in Taiwan (EPA 2006; table 3.2). For the metals studied here, the number of soil samples with total metal contents in excess of the present soil monitoring values for cropped soils increases from 2.9% for Cr, 6.3% for Zn, 10.1% for Ni, 13.0% for Pb, 13.3% for Cu to 26.7% for Cd. Not all fields are equally polluted as is shown in figure 3.2. Total Cd and Pb contents are especially high in the PD fields whereas total Ni and Zn contents in the HM and LK fields exceed those of the other locations. Figure 3.2 not only illustrates the broad range in the total metal contents between fields but it also shows the broad range observed within each field. Within the HC3 field, for example, the total Cd content in soil ranges from 0.19 mg kg-1 to 6.8 mg kg-1. Likewise, the total Cd contents in the PDD and PDB fields, which range from 4.0 to 21.6 mg kg-1 and from 6.2 to 29.4 mg kg-1, respectively, are highly variable. Even within 50 m from the inlet, total Cd content decreases up to a factor of 35 (HC3 plot). This is illustrated as well in figure 3.3 which shows the maps of HCl extractable

28 Alterra-rapport 1823
Cd in the fields HC3 and HM3. Highest Cd levels are found close to the inlet of the irrigation water and Cd levels gradually decrease across the field. Similar trends in metal levels in soil within paddy fields have been observed by Simmons et al. (2005). Hence, the distance within a paddy field to the main inlet of irrigation water is crucial in relation to the metal levels observed in soil.
10 1500
55
10
1515
2020
2525
3030
3535
4040
4545
2050
50
0 0.3 0.6 0.9 1.2 1.5 1.8 2.1 2.5 2.7 3.0
Inlet of irrigation water
(mg kg-1)
meter
met
er
Figure 3.3 Spatial distribution of Cd as measured by extraction with 0.1 M HCl in the soil across field HM3 (left) and HC3 (right). The inlets for irrigation water are marked with a blue arrow. The scale is different in both fields (units in mg kg--1). Spatial distribution patterns were obtained by kriging of the individual data points from each field.
In contrast to the HM3 and HC3 fields, total Cd contents in the PDF, PDG, LK1, and CH6 fields contain much less variation (figure 3.2). In the CH, HM, and LK fields on the other hand, total Cu contents are highly variable, reflecting the apparent specific Cu emission of a nearby industry. In table 3.3, a correlation matrix between total metal contents is presented for all PD fields together. In these fields, Cd, Pb, Cu and Zn are likely to originate from the same source, because of the close correlation found between the total contents of these metals.
1
2
3
4
5
6
7
8
9
10
Inlet of irrigation water
0
10
20
30
40
60
50
met
er
meter
0 5 10
1
2
3
4
5
6
7
8
9
10
Inlet of irrigation water
0
10
20
30
40
60
50
met
er
meter
0 5 100 5 10

Alterra-rapport 1823 29
Table 3.3 Cross-correlation matrix of metals in soil in the Pah-Deh fields based on total metal contents as extracted with Aqua Regia
Cd Cr Cu Ni Pb Zn Cd 1.000 - - - - - Cr 0.1759 1.000 - - - - Cu 0.6432 0.1721 1.000 - - - Ni 0.1445 0.5240 0.1223 1.000 - - Pb 0.9109 0.1218 0.8115 0.1051 1.000 - Zn 0.8754 0.2179 0.9105 0.1578 0.9432 1.000
In the CH fields, however, Cu and Ni seem to be closely related. Indeed, a close correlation for Cu and Ni was found between the total contents of these metals within the CH fields, but it is different for the three individual fields within the Chang-Hua community (figure 3.4). Apparently, the polluted irrigation water entering the fields originates from different sources with Cu:Ni ratios decreasing in the order CH8 > CH7 > CH6. Hence, soil monitoring programs have to consider the heterogeneous nature of metal distribution between and within paddy fields in order to be able to accurately assess the biological risks related to metals in soil in industrialized areas like in Taiwan.
0
50
100
150
200
250
300
350
400
450
500
0 200 400 600 800 1000
Copper (mg kg-1)
Nic
kel
(mg
kg
-1) CH6
CH7
CH8
Log. (CH6)
Log. (CH7)
Log. (CH8)
Figure 3.4 Relationship between total Cu and Ni contents as measured by extraction with Aqua Regia in soil samples from the three Chang-Hua fields. The dotted lines represent a best-fit line.
3.2.2 Reactive metal pools
Amounts of metals extracted by HNO3, HCl, and EDTA are markedly smaller than those extracted by AR (table 3.2). Figure 3.5 and table 3.4 show the median ratio for the reactive metal pool extracted with HNO3, HCl or EDTA relative to the total metal content.

30 Alterra-rapport 1823
0.0
0.2
0.4
0.6
0.8
1.0
Cd Cu Pb Zn Ni Cr
metal
rati
o M
e[re
acti
ve]/
Me[
tota
l]HNO3
HCl
EDTA
Figure 3.5 Mean median ratio of reactive metal pool relative to the total metal content as found for 0.43 M HNO3, 0.1 M HCl, and 0.05 M EDTA. The error bars represent the standard deviation.
The size of the reactive metal pool relative to the total metal content decreases in the order Cd > Cu > Pb > Zn Ni >> Cr. Differences between HNO3, HCl, and EDTA are different for the metals measured in this study, although the amounts extracted with HNO3, HCl and EDTA are closely correlated (figure 3.6 and table 3.5)
Table 3.4. Ratio of 0.43 N HNO3 and Aqua Regia extractable metals in soil
Metal (0.43 N HNO3/AR)
Cu Zn Cd Cr Ni Pb
minimum 0.08 0.05 0.08 0.01 0.04 0.16
1% 0.44 0.14 0.31 0.02 0.12 0.32
average 0.61 0.24 0.68 0.07 0.27 0.58
median 0.60 0.23 0.68 0.07 0.27 0.57
99% 0.81 0.42 1.18 0.17 0.42 0.84
maximum 6.421 1.07 6.661 0.94 1.70 2.0611
1 Theoretically, the ratio of 0.43 HNO3/AR cannot exceed 1 since 0.43 N HNO3 only extracts a part of what is extracted by Aqua Regia. The number of samples for which the ratio 0.43 HNO3/AR exceeds 1 is however limited as appears also from figure 1 (few data are positioned above the 1:1 line).

Alterra-rapport 1823 31
Table 3.5 Correlation matrix of metals in soil as measured by extraction with Aqua Regia (AR), 0.43 M HNO3, 0.05 M EDTA, and 0.1 M HCl
MeAR MeHNO3 MeEDTA MeAR MeHNO3 MeEDTA Cd-AR 1.00 - - Zn-AR 1.00 - - Cd-HNO3 0.99 1.00 - Zn-HNO3 0.84 1.00 - Cd-EDTA 0.98 0.98 1.00 Zn-HCl 0.85 0.98 1.00 Cd-HCl 0.99 0.98 0.98 Zn-EDTA 0.83 0.97 0.97 Pb-AR 1.00 - - Ni-AR 1.00 - - Pb-HNO3 0.98 1.00 - Ni-HNO3 0.90 1.00 - Pb-EDTA 0.98 0.98 1.00 Ni-EDTA 0.86 0.98 1.00 Pb-HCl 0.95 0.94 0.95 Ni-HCl 0.89 0.99 0.98 Cu-AR 1.00 - - Cr-AR 1.00 - - Cu-HNO3 0.96 1.00 - Cr-HNO3 0.88 1.00 - Cu-EDTA 0.95 0.98 1.00 Cr-EDTA 0.69 0.82 1.00 Cu-HCl 0.96 0.98 0.98 Cr-HCl 0.85 0.92 0.84
Only for Cr, the amounts of this metal extracted with AR and EDTA are less strongly correlated. For Cd, Zn, and Ni, the amounts extracted with HNO3 are slightly, but significantly (p<0.001; based on two-sample paired T-test) larger than those extracted with HCl. For Pb, however, the difference is substantial and the amounts extracted with HNO3 are almost twice those extracted with HCl. Apparently, the stronger acidity of the HNO3 solution is able to release a significant part of Pb which cannot be extracted with HCl. The amounts of metals extracted by EDTA are always smallest as compared to those extracted with the other two extracts. Only for Cu and Pb, the amounts extracted with EDTA exceed those extracted with HCl. This difference may reflect the amount of these heavy metals adsorbed or bound to SOM which can be released by EDTA but not by HCl. Both Cu and Pb are known for their high affinity binding to organic ligands present in SOM as well as in dissolved organic carbon (DOC) in the soil solution (Weng et al., 2001; Qin et al., 2006; Koopmans et al., 2008b). For Cr, none of the three extracts tested here extracts significant amounts of this metal as compared to its total content. The maximum value of the amount of Cr extracted with HNO3, HCl or EDTA relative to the total content of this metal was 12%. Hence, Cr in the soils studied here is probably present in rather immobile and chemically inert fractions which can be dissolved only to a slight extent by extraction with HNO3, HCl or EDTA. The reactive pool of Pb, which is commonly considered a rather immobile metal (Tipping et al., 2006), is high relative to its total content with a median ratio equaling 61% while the relative sizes of the reactive Zn and Ni pools are much smaller. For Zn, a median ratio of only 23% of its reactive pool relative to its total content could be extracted with HNO3, which, for Zn, is the strongest of the three extracts tested here. Apparently, Zn and also Ni are mostly present in rather immobile and chemically inert fractions forms in the soils studied here. Both Zn and Ni are known for their tendency to become immobile due to fixation and surface precipitation of these metals on oxihydroxides (Singhal and Gupta 1978; Bruemmer et al., 1981; Elzinga and Sparks 1999; Buekers 2007). In contrast to Cr, Ni, and Zn, Cd remains highly available in the soils studied here which is in agreement with data from soils for moderate climate zones (McBride et al., 2006). For both HNO3 and HCl, more than 70% can be extracted from soil compared to its total content. In 5% of all soil

32 Alterra-rapport 1823
samples, the ratio of the reactive Cd pool relative to its total content increases to even more than 90%. Hence, Cd in these soils remains in a potentially available pool which can become available for uptake by rice plants on the long-term. The median value of 74% for Cd as measured by HNO3 is in close agreement with data from non-polluted soils from the Netherlands and Belgium (Römkens et al., 2004; Meers et al., 2007). Apparently, the chemical processes controlling the reactivity or binding of Cd to soil components like SOM and clay are comparable regardless the obvious differences between well-drained soils from moderate climate zones and the paddy field soils from Taiwan studied here. Also, the ratio of the reactive Pb, Zn, Cu, and Ni pools relative to the total contents of these metals was the same for the soils studied here and non-polluted non-tropical soils (Römkens et al., 2004; Meers et al., 2007).
0
200
400
600
800
1000
0 200 400 600 800 1000
Aqua Regia (mg kg-1)
0.43
N H
NO 3
(m
g k
g-1)
Copper
0
200
400
600
800
1000
1200
0 200 400 600 800 1000 1200
Aqua Regia (mg kg-1)
0.43
N H
NO 3
(m
g k
g-1)
Zinc
0
5
10
15
20
25
30
0 5 10 15 20 25 30
Aqua Regia (mg kg-1)
0.43
N H
NO 3
(m
g k
g-1)
Cadmium
0
100
200
300
400
500
0 100 200 300 400 500
Aqua Regia (mg kg-1)
0.43
N H
NO 3
(m
g k
g-1)
Chromium
0
100
200
300
400
500
0 100 200 300 400 500
Aqua Regia (mg kg-1)
0.43
N H
NO 3
(m
g k
g-1)
Nickel
0
200
400
600
800
1000
1200
0 200 400 600 800 1000 1200
Aqua Regia (mg kg-1)
0.43
N H
NO 3
(m
g k
g-1)
Lead
Figure 3.6. Relation between total (Aqua Regia) and reactive metal fraction (0.43 N HNO3), the solid line is the 1:1 line.

Alterra-rapport 1823 33
y = 0.8918x
R2 = 0.9591
0
100
200
300
400
500
600
700
0 100 200 300 400 500 600 700
HNO3 extractable (mg kg-1)
HC
l e
xtra
cta
ble
(m
g k
g-1
)
Copper
y = 0.8593x
R2 = 0.9635
0
100
200
300
400
500
600
700
0 100 200 300 400 500 600 700
HNO3 extractable (mg kg-1)
HC
l e
xtra
cta
ble
(m
g k
g-1
)
Zinc
y = 0.9574x
R2 = 0.9699
0
5
10
15
20
25
0 5 10 15 20 25
HNO3 extractable (mg kg-1)
HC
l ex
trac
tab
le (
mg
kg
-1)
Cadmium
y = 0.341x
R2 = 0.8759
0
10
20
30
40
50
60
70
80
90
0 10 20 30 40 50 60 70 80 90
HNO3 extractable (mg kg-1)
HC
l ex
trac
tab
le (
mg
kg
-1)
Chromium
y = 0.8949x
R2 = 0.9757
0
30
60
90
120
0 30 60 90 120
HNO3 extractable (mg kg-1)
HC
l ex
tra
ctab
le (
mg
kg
-1)
Nickel
y = 0.8198x
R2 = 0.892
0
100
200
300
400
500
600
700
800
900
0 100 200 300 400 500 600 700 800 900
HNO3 extractable (mg kg-1)
HC
l ex
tra
ctab
le (
mg
kg
-1)
Lead
Figure 3.7. Comparison between the metals extracted by 0.1 M HCl (Y-axis) and 0.43 N HNO3 (X-axis). The dotted line is the 1:1 line for comparison, the dashed line marks the regression line
3.2.3 Actual available metal pools and solid-solution partitioning models
The amounts of metals extracted with CaCl2 are much lower compared to the total contents or the reactive pools (table 3.2). Table 3.6 contains an overview of the average ratio of the directly available metal pool relative to the reactive metal pool as extracted with HNO3. Especially for Cd, Zn, and Ni, the directly available pool of metals is rather high relative to the reactive metal pool; approximately 10% of these metals can be considered to be directly available for uptake by rice plants. In contrast to this, the relative size of the directly available metal pool for Cu, Cr, and Pb is less than 0.3%, while the maximum value remains below 4%.

34 Alterra-rapport 1823
Table 3.6 Overview of the ratio of the directly available metal pool as measured by extraction with 0.01 M CaCl2 relative to the reactive metal pool as measured by extraction with 0.43 M HNO3
Ratio directly available metal pool/reactive metal pool (%)
Cu Zn Cd Cr Ni Pb
Minimum <0.1 <0.1 <0.1 <0.1 <0.1 <0.1
Median 0.1 7.9 8.8 0.2 7.1 0.1
Average 0.2 9.3 10.4 0.3 9.4 0.2
Maximum 2.7 75.0 65.8 3.3 77.1 3.8
Table 3.7 shows the results of the multiple regression analysis using equation [2.1]. Here, only the reactive metal pool as measured by extraction with HNO3 and soil properties like pH and CEC were used as input parameters.
Table 3.7 Regression coefficients of the Freundlich equation to predict the size of the 0.01 M CaCl2-extractable metal pool using 0.43 M HNO3 and soil properties like pH and CEC as input parameters
Regression coefficients Metal
n
Intercept a (pH)
b (CEC)
c (HNO3)
R2
se(Y-est)
Cd 3255 2.64 -0.53 -0.80 0.96 92.9 0.22 Cu 2776 0.16 -0.38 -1.18 1.17 58.7 0.38
Cr 2567 -1.12 -0.05 -0.59 0.17 9.9 0.41
Ni 3185 2.73 -0.58 -0.95 1.22 86.0 0.27
Pb 2197 -1.69 -0.02 -0.28 0.65 46.7 0.40
Zn 3244 4.57 -0.88 -1.25 1.16 80.3 0.30
For Cd, Zn, and Ni, the main part of the observed variation in the directly available metal pool as measured by extraction with CaCl2 can be explained by these parameters as is shown in figure 3.8 as well.

Alterra-rapport 1823 35
0.0001
0.001
0.01
0.1
1
10
100
0.0001 0.001 0.01 0.1 1 10
Cd CaCl2-data (mg kg-1)
Cd
CaC
l 2 m
odel
fit
(mg
kg-1
)
Cadmium
0.001
0.01
0.1
1
10
100
1000
0.01 0.1 1 10 100
Zn CaCl2-data (mg kg-1)
Zn
CaC
l 2 m
odel
fit
(mg
kg-1
)
Zinc
0.001
0.01
0.1
1
10
100
1000
0.001 0.01 0.1 1 10 100
Ni CaCl2-data (mg kg-1)
Ni C
aCl 2
mod
el f
it (m
g kg
-1)
Nickel
0.001
0.01
0.1
1
10
0.0001 0.001 0.01 0.1 1 10
Cu CaCl2-data (mg kg-1)
Cu
CaC
l 2 m
odel
fit
(mg
kg-1
)
Copper
0.01
0.1
1
0.01 0.1 1
Pb CaCl2-data (mg kg-1)
Pb C
aCl 2
mod
el f
it (m
g kg
-1)
Lead
Figure 3.8 Measured data of metals in the 0.01 M CaCl2 extracts versus model fit based on Eq. 2.1. The solid line indicates the 1:1 line, while the dotted lines are equal to Y-est +/- 2se(Y-est) which is approximately equal to the 95%-confidence interval of the predicted mean levels

36 Alterra-rapport 1823
For Cr, Cu, and Pb, much less of the variation in the directly available metal pool was explained by the reactive metal pool, pH and CEC. Apparently, the parameters included here are not the only ones controlling the solid-solution partitioning of Cu, Pb and especially of Cr. For Cu and Pb, the role of DOC is important in the prediction of the solubility of these elements (Weng et al., 2002; Römkens et al., 2004; Koopmans et al., 2008b). In this study, however, DOC was not measured which partly explains the rather low explained variability of the directly available Cu and Pb pools. For Cr, the model as such is not an appropriate one since Cr behaves rather different being an anion and prone to precipitation and dissolution processes even at low concentrations. Neither the reverse effect of pH on the solid-solution partitioning for anions compared to cations nor the precipitation phenomena are accounted for in the Freundlich equation (Eq. 2.1). A further analysis of the data revealed that Zn had a significant influence on the amounts of Cd, Ni and to a lesser extent also of Cu extracted with CaCl2. Since Zn and Cd have similar affinity for sorption sites in soils (McBride 1994), an increase in the available pool of Zn should induce competition between these metals for sorption leading to higher directly available Cd levels in soil as measured by extraction with CaCl2. Including Zn in the regression indeed improved the model even further (R2 = 0.95; se(Y-est) = 0.19) as is shown for Cd in Eq. [3.1]: log[Cd-CaCl2] = 0.83
- 0.29pH - 0.50log[CEC] + 0.91log[Cd-HNO3] + 0.29log[Zn-CaCl2] [3.1]
With [Zn-CaCl2] directly available metal pool extracted with 0.01 M CaCl2 in mg kg-1 For Ni and Cu, similar improvements were obtained upon inclusion of Zn in the regression (results not shown). For Pb and Cr, however, no effect of Zn was observed. Apparently, Pb and Zn do not compete for the same sorption sites in paddy soils, whereas a strong competition effect was found to exist between Cd, Ni and to a lesser extent for Cu on the one hand and Zn on the other for sorption to the soil solid phase. In table 3.8, results of the multiple regression analysis are presented when using all soil tests (i.e., AR, HNO3, HCl, and EDTA) only for Cd, Ni, and Zn. For Pb and Cr, and to a lesser extent also for Cu, the error of prediction using HNO3 was high (table 3.8), but the use of other soil tests like AR, HCl, and EDTA did not improve this (results not shown). The data presented in table 3.8 indicate that the use of HCl or HNO3 and, for Ni even EDTA, result in comparable regression coefficients for the prediction of the directly available metal pool in soil. This is not surprising considering the similarity between these soil tests in extracting metals from soil. Results from an all-subset analysis (Genstat 11.1) nevertheless showed that the combination of pH/CEC/HNO3 was the most significant model based on 3 terms.

Alterra-rapport 1823 37
After including Zn in the regression terms (equation 3.1) the best model still was the one using the 0.43 M HNO3 extractable pool. The use of AR results in both a lower R2 and a higher standard error of the predicted values which indicates that the prediction is less accurate. This is in line with the fact that AR extracts the inert fraction as well, as is shown in figure 3.6 and this inert fraction is thought not to be in equilibrium with the reactive or directly available metal pools. This effect is more pronounced for Ni and Zn for which also the difference between the reactive and total metal content was much larger than for Cd. For Cd, differences between model coefficients based on HNO3, HCl or EDTA are comparable to those for AR which shows that the reactive metal pool is closely related to the total metal content in the soil. Also for Cd, however, the model fit based on AR is less accurate compared to that based on HNO3, HCl or EDTA.
Table 3.8 Regression coefficients of the Freundlich equation to predict the size of the 0.01 M CaCl2 extractable metal pool based on Aqua Regia (AR), 0.43 M HNO3, 0.1 M HCl or 0.05 M EDTA and soil properties like pH and CEC (Eq. 2.1)
Regression coefficients Metal and extract
Intercept a (pH) b (CEC)
c (Reactive metal pool)
R2 se(Y-est)
Cd HNO3 2.64 -0.53 -0.80 0.96 92.9 0.22 HCl 2.69 -0.53 -0.83 0.96 92.8 0.23 EDTA 2.81 -0.53 -0.87 1.02 93.0 0.22 AR 2.58 -0.55 -0.79 1.04 91.2 0.25
Zn HNO3 4.57 -0.88 -1.25 1.16 80.3 0.30 HCl 4.54 -0.87 -1.21 1.16 80.7 0.30 EDTA 4.34 -0.83 -1.18 1.17 82.1 0.29 AR 4.65 -1.01 -1.18 1.12 74.1 0.35
Ni HNO3 2.73 -0.58 -0.95 1.22 86.0 0.27 HCl 2.88 -0.57 -0.98 1.16 86.2 0.27 EDTA 2.78 -0.55 -0.99 1.17 86.4 0.27 AR 2.01 -0.61 -1.63 1.67 77.3 0.35
For Cd, a similar regression analysis performed by Meers et al. (2007) resulted in remarkably similar model coefficients. Meers et al. (2007) used the total Cd content as extracted with AR instead of a reactive Cd pool to predict the directly available pool extracted with 0.01 M CaCl2 and obtained the following regression model for Cd: log[Cd-CaCl2] = 2.91 (0.26)
– 0.55 (0.04)pH – 0.94 (0.14)log(CEC) + 1.13 (0.06)[Cd-AR] [3.2]
With [Cd-CaCl2] directly available metal pool extracted with 0.01 M CaCl2 in
mg kg-1

38 Alterra-rapport 1823
pH pH in the 0.01 M CaCl2 extracts [CEC] cation exchange capacity in cmol(+) kg-1 [Cd-AR] total Cd determined by extraction with AR in mg kg-1
All coefficients related to soil properties are remarkably close with exactly the same effect of pH and only minor differences in the coefficients for the total Cd content and CEC (table 3.8). The higher model intercept of 2.91 derived by Meers et al. (2007) compared to the intercept of 2.58 from our data results in a significant overestimation of approximately a factor of 2 when applied to the data from this study. The slope of log-transformed data from this study, however, versus predicted log-transformed values using Eq. [2.1] is 0.93 with an R2 of 0.91 (results not shown). This suggests that the response of Cd in the CaCl2 extracts to changes in pH, CEC and even the total Cd content is the same in our data as in those obtained by Meers et al. (2007). 3.2.4 Effect of sampling time on the directly available metal pools and on
solid-solution partitioning models
Despite similar weather conditions in 2005 and 2006 (Central Weather Bureau 2008), significant differences in the directly available pools of most metals between the first harvest obtained in May and the second harvest obtained in November were obtained (table 3.9). For all metals in the PD fields, an increase in the directly available metal pools at the second harvest ranging from 0.05 (Pb) to 0.58 (Cu) log units. In the CH, HM, LK and HC fields, however, the reverse trend was observed and directly available metal pools at the first harvest exceeded those extracted at the second harvest, although differences were less pronounced compared to those obtained in the PD fields (table 3.9). Only for Pb, CaCl2-extractable metal levels at the second harvest exceeded those from the first harvest in all fields. Also, pH levels in all fields were higher at the second harvest compared to the first harvest which explains the larger size of the directly available metal pools in the CH, HM and LK fields at the first harvest but not in the PD fields. The higher pH at the second harvest fails to explain the higher CaCl2-extractable metal levels in the PD fields since the size of the directly available metal pool for metals like Cd, Zn and Ni usually decreases with an increase in pH (McBride, 1994). In addition to this, there were no statistically significant differences in either CEC or the reactive soil metal pools as measured by extraction with HNO3. Possibly dynamics in other soil parameters including DOC, salinity or redox potential which were not included in this study play an important role in the temporal variability of the directly available metal pools.

Alterra-rapport 1823 39
Table 3.9 Mean difference and 95% confidence interval of the directly available metal pool measured with 0.01 M CaCl2 in soil samples from harvest 1 (May) and harvest 2 (November). This difference was calculated as the size of the metal pool at harvest 1 minus the size of the metal pool at harvest 2.
CH, HM, and LK fields PD fields Mean 95%-
confidence interval
p Mean 95%-confidence
interval
p
Cd 0.091 0.08 - 0.11 <0.001 -0.20 -0.22 - -0.17 <0.001 Cu 0.11 0.08 - 0.14 <0.001 -0.58 -0.64 - -0.52 <0.001 Cr 0.06 0.02 - 0.11 <0.01 -0.34 -0.39 - -0.29 <0.001 Ni 0.05 0.03 - 0.08 <0.001 -0.12 -0.14 - -0.09 <0.001 Pb -0.18 -0.36 - -0.1 <0.001 -0.05 -0.07 - -0.02 <0.001 Zn 0.06 0.03 - 0.09 <0.001 -0.12 -0.13 - -0.10 <0.001 pH -0.09 -0.12 - -0.06 <0.001 -0.14 -0.16 - -0.12 <0.001
1 All data are based on differences between log transformed values. The significance of the differences between harvest 1 and 2 were calculated based on a paired two sample T-test.
The differences between the directly available metal pool at the first and the second harvest became evident after deriving separate solid-solution partitioning models for the data from these harvests as shown in table 3.10. Table 3.10 Regression coefficients of the Freundlich equation to predict the size of the 0.01 M CaCl2-extractable metal pool using 0.43 M HNO3 and soil properties like pH and CEC as input parameters (Eq. 1) at harvest 1 (H1) and at harvest 2 (H2)
Regression coefficients Metal Intercept a (pH) b (CEC) c (HNO3) R2 se(Y-est) Cd-H1&H2 2.64 -0.53 -0.80 0.96 92.9 0.22 Cd-H1 2.20 -0.47 -0.71 0.88 Cd-H2 3.17 -0.61 -0.88 1.05
Zn-H1&H2 4.57 -0.88 -1.25 1.16 80.3 0.30 Zn-H1 3.96 -0.77 -1.28 1.17 Zn-H2 5.32 -1.00 -1.20 1.14
Cu-H1&H2 0.16 -0.38 -1.18 1.17 58.7 0.38 Cu-H1 -1.22 -0.25 -1.26 1.55 Cu-H2 1.35 -0.52 -1.23 1.01
Ni-H1&H2 2.73 -0.58 -0.95 1.22 86.0 0.27 Ni-H1 2.07 -0.50 -0.87 1.31 Ni-H2 3.49 -0.67 -1.03 1.13
Pb-H1&H2 -1.69 -0.02 -0.28 0.65 46.7 0.40 Pb-H1 -1.41 -0.07 -0.48 0.73 Pb-H2 -1.79 0.00 (ns) -0.051 0.55
1Not significant
The data were split solely based on the time of sampling but no further distinction was made between fields. For all metals except Pb, the intercept increased between 0.97 (Cd) and 2.57 (Cu) log units. The ultimate effect of the time of harvest on the solubility of metals appeared to be most pronounced in the more polluted paddy fields where, for all metals, a clear increase in the size of the directly available pool was observed at the second harvest. This is schematically shown for Cd in figure 3.9

40 Alterra-rapport 1823
where the ratio of the directly available Cd pool at the second harvest relative to that obtained at the first harvest is plotted. For each combination of the reactive Cd pool and pH, the directly available Cd pool was calculated for both the first and second harvest, and plotted as a function of the reactive Cd pool and pH. This figure illustrates the overall effect of the time of harvest across all fields which is difficult to assess from the data points for each field alone. The increase in the directly available Cd pool at the second harvest is most pronounced in polluted soils with a reactive Cd pool > 1 mg kg-1 and a pH < 5.5. In contrast, whereas the opposite effect was observed at a higher pH or at a smaller reactive Cd pool. At present, it remains unclear as to what causes these changes in both pH and CaCl2-extractable metal levels but the observations clearly show that the dynamics of the directly available metal pools in paddy fields throughout the year can be considerable. Obviously, the change from reducing to oxidizing conditions and vice versa can result in long-lasting changes in the directly available pool of metals in soil. Further investigation on the controls of metal solubility under drained and water-logged conditions and its dynamics after changing from the anaerobic state of the soil to the aerobic state seems essential and can be the clue to understanding some of the contrasting results that have been obtained not only in this study but by others as well. Simmons et al. (2008), for example, showed that the availability of Cd in extracts from air-dried soils differed from that from field-moist samples. However, the direction of this change was different and depended on the type of extract used. Dissolved Cd concentrations in a 0.01 M CaCl2 extract decreased upon drying, but those in 0.05 M CaCl2 extracts increased upon drying. This shows that the time of sampling, conditions at the time of soil sampling, soil pretreatment and extraction procedure all affect the amounts of metals extracted by standard soil tests. Obviously, the usefulness of the available fraction of metals in soils in assessment of soil quality and biological risks is evident but these results suggest that the underlying mechanisms that control the amount of metals present in such extracts still require ample attention.
0
0.5
1
1.5
2
2.5
3
0.01 0.1 1 10 100
Reactive soil Cd (mg kg-1)
Cd
rat
io H
2:H
1
pH 4.5
pH 5.5
pH 6.5
pH 7.5
H2:H1 = 1 line
Figure 3.9 Difference in the size of the 0.01 M CaCl2-extractable Cd pool as measured at harvest 1 (H1) and at harvest 2 (H2)

Alterra-rapport 1823 41
3.3 Mechanistic modeling of the availability of rice in soils
The partition equations described in the previous sections suggest that the availability of Cd in the soil samples studied here is mainly controlled by sorption processes. To verify this hypothesis a mechanistic model has been applied where the solubility of Cd as measured in the CaCl2 extract was predicted by a previously calibrated model (Bonten et al., 2008). In this model sorption of Cd to different soil components like organic matter, iron oxides and clay is described taking into account sorption and precipitation processes. Also speciation in solution is considered (for example Cd binding to chlorine and dissolved organic carbon). Some data were not available, such as dissolved organic carbon and clay and these were estimated from either organic matter (DOC) or CEC (clay). pH CaCl2 was used as well as the 0.43 N HNO3 extractable mild content as the total Cd pool available for sorption processes. More details on the model used can be found in Weng et al. (2001) and Bonten et al. (2008). In figure 3.10 the predicted Cd concentration in CaCl2 is plotted against the measured concentration. Here, the amount in mg kg-1 has been converted to mol per liter based on the 1:10 soil-solution ratio of the extraction.
1.0E-10
1.0E-09
1.0E-08
1.0E-07
1.0E-06
1.0E-10 1.0E-09 1.0E-08 1.0E-07 1.0E-06
Cd measured (mol L-1)
Cd
mec
han
isti
c m
od
el (
mo
l L-1)
Figure 3.10. Measured versus predicted Cd concentration in all samples
Although there is a considerable scatter around the 1:1 line, the overall prediction range is in close agreement with measured data. Considering the fact that this model was not calibrated on the data from Taiwan, the fit is rather good. Also, the relation with predictions from the partitioning model is quite good as is shown in figure 3.11. The dotted line represents the 1:1 line, and most predicted values center around this line although there is a small tilt between both predictions. Nevertheless it confirms that the mechanistic model is able to predict the measured variability quite well. On the other hand it also shows that partitioning models which

42 Alterra-rapport 1823
can be easily derived from data from field studies are able to predict the availability of Cd in soils.
1.0E-10
1.0E-09
1.0E-08
1.0E-07
1.0E-06
1.0E-10 1.0E-09 1.0E-08 1.0E-07 1.0E-06
Cd Mechanistic model (mol L-1)
Cd
Fre
un
dlic
h m
od
el (
mo
l L-1)
Figure 3.11. Correlation between model predicted values from the partitioning model versus the mechanistic model
3.4 Conclusions
Due to the use of polluted irrigation water, metals in paddy fields in Taiwan have reached levels that exceed soil quality standards above which soil cleanup is required. The levels of all metals in the 19 field studied here are quite heterogeneous across the field and are always highest near the inlet of irrigation water. To assess the availability of metals in soil, different extraction methods were tested. Results indicated that methods used in the EU (HNO3), Australia (EDTA), and Taiwan (HCl) give comparable results, although HNO3 consistently extracts more metals from soil than HCl or EDTA. As such, all three soil tests can be used to predict the size of the directly available pool of Cd, Zn, and Ni and to a lesser extent also of Cu and Pb. The regression analysis nevertheless indicated that the combination of HNO3-extractable metals with CEC and pH is the most suitable one to explain the observed variation in the directly available metal pool. For Cr, no such relation could be obtained since the solubility of Cr is controlled by other processes as compared to cationic metals like Cd or Zn. For Cd, Ni, and Cu, a competition effect of Zn was observed with the size of the directly available Cd, Ni, and Cu pools increasing with an increase of the directly available Zn pool. The soils studied here have been developed under very different conditions compared to soils in moderate climate zones, but the variability in the directly available Cd, Zn, and Ni pools and to a lesser extent in the directly available Cu and Pb pools can be described well by solid-solution partitioning models similar to those published for non-paddy soils. There is a close agreement in the solid-solution partitioning model for Cd obtained here and those published by Römkens et al. (2004) and Meers et al. (2007). This suggests that processes that control the variability in the directly available Cd pool as measured by extraction with CaCl2 in drained paddy fields are comparable to those in soils from

Alterra-rapport 1823 43
moderate climate zones like Western Europe. This is an important finding since it suggests that knowledge and model concepts for metals which have been developed elsewhere can also be of use to predict the availability of metals in paddy fields. In this study, we focused on the prediction of the directly available metal pool under drained, oxidizing conditions since it has been suggested that the uptake of metals by rice is controlled largely during the period that the soil is drained (Simmons et al., 2008). It is known, however, that both the solubility and availability of metals decrease under reducing conditions when the soil is water-logged (Kashem and Singh 2004; Contin et al., 2007). The return to oxidizing conditions can lead to an increase in the availability and uptake of metals (Daum et al., 2001; Kelderman and Osman 2007), although the degree to which metals are bound or released by sulfides has been shown to be quite variable. Barret and McBride (2007) showed that an increase in the Cd:Zn ratio in soil reduced the metal scavenging effect of sulphides for Cd considerably. Charlatchka and Cambier (2000) even observed an initial increase in the solubility of metals after flooding of a soil due to dissolution of ferric and manganese oxides. These contrasting observations, together with the observed differences in the size of the directly available metal pool between the first and the second harvest, suggest that careful monitoring of soil conditions, metal ratio’s and time period of drainage is essential in order to better understand the dynamics of the availability and uptake of metals in paddy soils. The data collected here nevertheless illustrate that the use of a dilute acid extracts like 0.43 M HNO3 or 0.1 M HCl in combination with generally available soil properties like pH and CEC can be used to obtain a robust estimate of the availability of some of the most critical elements in relation to food safety and environmental effects (Cd, Zn, and Ni). To better explain the observed differences in the solubility of Cu and Pb, the influence of DOC needs to be considered. The final step is to link model concepts such as the ones described here to those that predict uptake by arable crops and/or leaching to ground- and surface waters on a regional scale as was recently accomplished for the Netherlands (de Vries et al., 2008). The data presented in this study will therefore be used to establish a link between the availability of metals in paddy fields and uptake by rice (see Chapter 4). The aim is to use such a concept to assess the suitability of contaminated land for rice cropping on a local and regional scale.


Alterra-rapport 1823 45
4 Uptake of metals by rice
4.1 General quality assessment of rice grown on study locations
Table 4.1 gives an overview of soil and rice data used in this study including ranges and minimum and maximum values. The data were sorted by rice cultivar because our aim is to relate the availability of Cd in soil to uptake by different cultivars and not so much to derive relationships for specific fields.
Table 4.1 Overview of pH, cation exchange capacity (CEC), soil organic matter (SOM), reactive (0.43 M HNO3) and total (Aqua Regia) soil Cd sorted by rice cultivar. Minimum and maximum values and median (in brackets) are presented
Cult. Family pH CEC
(cmol[+] kg-1)
SOM
(%)
Reactive Cd
(mg kg-1)
Total Cd
(mg kg-1)
1 Japonica 4.0 - 6.8 (5.4) 2.6 - 21.3 (14.4) 1.7 - 9.4 (6.5) 0.09 - 19.5 (0.39) 0.13 – 27.8 (0.60)
2 Japonica 4.1 - 7.2 (5.4) 3.1 - 21.1 (14.2) 1.6 - 8.9 (6.3) 0.09 - 16.4 (0.37) 0.09 – 18.8 (0.61)
3 Japonica 4.2 - 7.2 (5.4) 3.8 - 20.9 (14.1) 1.6 - 9.2 (6.5) 0.09 - 17.5 (0.41) 0.11 – 18.2 (0.65)
4 Japonica 3.8 - 7.2 (5.4) 4.1 - 21.8 (13.7) 2.0 - 9.5 (6.5) 0.09 - 15.0 (0.43) 0.07 – 17.4 (0.64)
5 Japonica 3.9 - 6.9 (5.4) 3.2 - 21.6 (14.2) 1.7 - 9.2 (6.5) 0.09 - 17.3 (0.40) 0.06 – 23.9 (0.59)
6 Indica 4.3 - 7.0 (5.4) 3.2 - 25.1 (14.5) 1.3 - 9.6 (6.4) 0.08 - 18.1 (0.43) 0.08 – 21.2 (0.71)
7 Japonica 4.2 - 6.8 (5.3) 3.3 - 24.2 (14.4) 2.2 - 9.3 (6.6) 0.09 - 19.1 (0.43) 0.13 – 25.9 (0.60)
8 Japonica 3.9 - 7.2 (5.4) 4.2 - 21.6 (14.0) 1.4 - 9.3 (6.6) 0.09 - 20.6 (0.44) 0.08 – 26.6 ( 0.66)
9 Indica 4.1 - 6.8 (5.4) 2.8 - 21.7 (14.8) 1.9 - 9.9 (6.1) 0.08 - 19.9 (0.33) 0.09 – 25.9 (0.57)
10 Indica 4.1 - 7.0 (5.3) 2.6 - 21.7 (14.0) 1.9 - 10.2 (6.5) 0.10 - 20.2 (0.43) 0.14 – 25.8 (0.71)
11 Indica 4.2 - 6.9 (5.4) 2.9 - 22.5 (14.5) 1.7 - 8.9 (6.3) 0.08 - 19.8 (0.41) 0.14 – 22.7 (0.70)
12 Japonica 4.0 - 6.8 (5.4) 3.0 - 20.5 (14.8) 1.9 - 9.0 (6.3) 0.08 - 12.6 (0.36) 0.13 – 16.8 (0.59)
Observed total Cd concentrations in soil range from less than 0.1 mg kg-1 to almost 30 mg kg-1 which covers the range from background levels to heavily polluted soils. In Taiwan, total Cd concentrations in soil below 0.4 mg kg-1 are considered background levels without a clear indication of anthropogenic pollution (Lin et al., 2002). As mentioned in chapter 3, a SQS of 5 mg kg-1 as determined by extraction with AR is used (EPA, 2006) to identify the suitability of land for agricultural purposes. According to this definition, almost 27% of the plots is unsuitable to serve as arable land. Although the ranges in soil properties including total Cd concentration in soil are rather similar for all rice cultivars, Cd levels in rice grains are quite different among the cultivars used in this study as is shown in table 4.2.

46 Alterra-rapport 1823
Table 4.2 Overview of Cd concentrations in roots and grains of rice cultivars used in this study. For Cd levels in roots, minimum and maximum values and median are presented (in brackets), while for Cd levels in rice grains the 25%- and 75%-percentiles are presented as well. For ratio of Cd levels in rice grains over roots, mean is presented. Numbers in Italics indicate Cd levels exceeding the food quality standard (FQS) of 0.2 mg kg-1 from the WHO while numbers in bold indicate levels exceeding the Japanese and Taiwanese FQS of 0.4 mg kg-1
Cultivar Family Cd roots (mg kg-1)
Cd rice grains (mg kg-1)
Ratio Cd rice
grains/roots minimum 25% median 75% maximum
1 Japonica 0.8 - 373.4 (8.0) 0.02 0.11 0.21 1.06 4.57 0.029 2 Japonica 0.5 - 181.3 (6.6) 0.01 0.11 0.23 1.15 6.00 0.037 3 Japonica 0.4 - 403.9 (9.7) 0.02 0.08 0.19 1.09 2.98 0.026 4 Japonica 0.5 - 198.5 (8.0) 0.01 0.09 0.19 0.97 4.47 0.029 5 Japonica 0.7 - 213.6 (8.8) 0.02 0.08 0.18 1.13 3.32 0.025 6 Indica 0.6 - 247.7 (6.5) 0.02 0.22 0.43 1.69 12.57 0.096 7 Japonica 0.6 - 175.2 (7.2) 0.02 0.10 0.20 1.31 3.71 0.030 8 Japonica 0.6 - 139.2 (5.4) 0.01 0.09 0.19 1.16 3.39 0.032 9 Indica 0.5 - 107.0 (6.2) 0.03 0.23 0.44 1.39 7.64 0.075 10 (A) Indica 0.5 - 161.8 (6.4) 0.04 0.25 0.60 3.65 25.32 0.092 11 (B) Indica 0.7 - 266.6 (9.6) 0.03 0.19 0.37 2.85 29.08 0.061 12 (C) Japonica 0.6 - 107.7 (4.6) 0.01 0.08 0.16 0.49 3.72 0.034

Alterra-rapport 1823 47
Cd accumulation in the rice grains of the Indica species tested here proved to be very high. For all Indica species tested here, median levels of Cd exceed the FQS of the WHO (i.e., 0.2 mg kg-1) and the FQS used in Japan and Taiwan (i.e., 0.4 mg kg-1). Hence, such Indica species are not suitable for cropping on soils affected by Cd pollution as has been previously reported by He et al. (2006). In contrast to the Indica species, Cd accumulation in rice grains in Japonica rice species is lower, although median levels found in the grain are close to or in excess of the FQS from the WHO as well. Apparently, the combination of elevated total Cd concentrations in soil and soil properties like pH and SOM results in an increased availability of Cd in soil, and, in turn, a higher uptake of Cd by rice plants. This is further illustrated in figures 4.1 and 4.2 which show the percentage of samples where Cd levels in rice grains exceed the FQS of 0.2 or 0.4 mg kg-1 at a given total Cd concentration in soil (figure 4.1) and the distribution of the Cd levels per cultivar (figure 4.2).
0%
10%
20%
30%
40%
50%
60%
70%
80%
90%
< 0.3 < 0.5 < 1.0 < 2.0 < 5.0 < max
Total soil Cd concentration (mg kg-1)
sam
ple
s >
FQ
S (
%)
Japonica IndicaFQS
0.2 mg kg-1
0%
10%
20%
30%
40%
50%
60%
70%
80%
90%
< 0.3 < 0.5 < 1.0 < 2.0 < 5.0 < max
Total soil Cd concentration (mg kg-1)
sam
ple
s >
FQ
S (
%)
Japonica IndicaFQS
0.4 mg kg-1
Figure 4.1. Percentage of samples where Cd concentration in rice grains exceeds the food quality standard (FQS) of 0.2 mg kg-1 from the WHO (left) and the Japanese and Taiwanese FQS of 0.4 mg kg-1 (right) at a given total Cd concentration in soil as measured by extraction with Aqua Regia for Japonica and Indica rice cultivars.
0%
20%
40%
60%
80%
100%
1 2 3 4 5 6 7 8 9 A B C
rice variety
fre
qu
en
cy
0.5 - 2.0
0.4 - 0.5
0.3 - 0.4
0.2 - 0.3
0.1 - 0.2
< 0.1
Figure 4.2. Levels of Cd in rice grains of the 12 cultivars grown in the study (level in mg kg-1) Even at total Cd levels in soil below 0.3 mg kg-1, still a large number of rice grain samples of both families does not meet the FQS. For Indica cultivars, for example,

48 Alterra-rapport 1823
this percentage ranges from 11.3% for the FQS of 0.4 mg kg-1 to 51.1% for the FQS of 0.2 mg kg-1. Apparently, Indica species cannot be grown safely in Cd-enriched soils without a considerable risk of exceeding the FQS of the WHO. Furthermore, a SQS of 5 mg kg-1 based on extraction of soil with AR used in Taiwan for arable land is insufficient as a tool to assess the suitability of soils for rice cropping. Even for Japonica cultivars, which accumulated significantly lower amounts of Cd, between 17% for a FQS of 0.4 mg kg-1 and 30% for a FQS of 0.2 mg kg-1 of all rice grain samples grown on soils with total Cd levels below 5 mg kg-1 do not meet the FQS. For Indica cultivars, these percentages increase even to 41% for a FQS of 0.4 mg kg-1 and to 73% for a FQS 0.2 mg kg-1. Clearly, SQS based on AR fails to assess the suitability of soils for rice cropping. These results clearly stress the need to develop alternative soil tests or soil-plant models to predict Cd uptake by rice plants in order to identify those soils where rice can be grown safely without a considerable risk of Cd levels in rice grains exceeding the FQS. 4.2 Transfer of Cd from soil to roots and shoot-root ratios
Uptake of contaminants from soil has to occur through root action and hence can only be realized through uptake from the soil solution. The first step is the transfer of metals from the soil solution onto the root surface followed by a translocation into the root. Despite the observed difference in Cd levels in Indica versus Japonica, uptake of Cd from soil by rice roots from all fields appeared to be equal for all cultivars tested here (table 4.2). No significant differences in Cd root levels between Indica and Japonica were observed. Mean Cd levels in roots from Indica species equaled 30.4 mg kg-1 whereas those for Japonica species equaled 30.6 mg kg-1 (LSD at the 5% level equals 3.1, taking into account differences across the field due to heterogeneity in soil Cd levels). Similar results were obtained by Liu et al. (2003) despite the fact that they used a spiked soil with up to 100 mg kg-1 Cd added in a highly mobile form. For all rice cultivars, the available Zn pool as determined by extraction with CaCl2 suppressed the transfer of Cd into the root (regression based on all data, regardless the cultivar): 10log[Cd-root] = 2.31 + 0.88 10log[Cd-CaCl2] – 0.38 10log[Zn-CaCl2]; [4.1] R2 = 0.85; se-Yest = 0.25 where [Cd-root] is the measured Cd content in the root in mg kg-1. This suggests that an increase of Zn reduces the Cd binding to the root surface of rice plants which is probably due to competition with Zn for similar sorption sites on the root surface. A similar effect of Zn on Cd root levels was observed by Liu et al. (2007). This finding suggests that Indica and Japonica cultivars tested in this study mainly differ in their ability to transfer Cd from the root into the shoot.

Alterra-rapport 1823 49
In contrast to the similarity in the Cd-root levels, the rice-root distribution coefficients, obviously, differ substantially between Japonica (mean rice - root ratio of 0.030 which is similar to reported values by Kukier and Chaney, 2002) and Indica (mean rice - root ratio of 0.082, LSD at 1% is equal to 0.007). Differences between individual Japonica or Indica species are also significant and range from 0.025 (C5) to 0.037 (C2) for Japonica cultivars and from 0.061 (C11) to 0.096 (C6.) The effect of Zn on uptake of Cd has been reported previously (Girling and Peterson, 1981; Hassan et al., 2006) although contrasting effects have been demonstrated as well depending on the levels of Zn and Cd in the soil and the Cd:Zn ratio for other crops as well (Kukier and Chaney, 2002; Dunbar, 2004). Cui et al. (2008) found a similar interaction between Cu and Cd, with Cd uptake decreasing at higher Cu addition levels. Liu et al. (2007) found that Zn in solution suppressed Cd in roots but increased Cd levels in rice. Several of the studies mentioned here, however, have disadvantages which hamper a clear evaluation of the results or a translation to field conditions. In most cases the available Cd pool was not actually measured (e.g. Liu et al., 2007). Likewise, soils are spiked with considerable amounts of Cd (e.g. Zhou et al., 2003; Diao et al., 2005; Li et al., 2005) to mimic uptake of Cd from polluted soils. The availability of Cd and Zn in freshly spiked soils, however, decreases over time and can thus be different from that in non-spiked soils (Naidu et al., 2003, Ma and Uren, 2006). Such changes over time clearly will affect the uptake of Cd by rice. Also hydroponic studies are often performed (Cui et al., 2008) where conditions clearly are different from those in the soil. It is therefore not surprising that results from different studies can differ substantially. In order to be able to translate experimental results to the field level, we therefore suggest that the experiments or monitoring studies performed should mimic conditions that prevail in the field. 4.3 Models to describe Cd uptake by rice: why?
Ultimately one of the major goals of this study is to assess whether it is possible to predict the quality of rice (grains) based on available soil data. At present, rice is tested after the harvest and depending on the quality it cannot be sold on the market if Cd in rice grains exceed the food quality standard. In the previous paragraph it became clear that current soil quality standards fail to identify those soils where rice will not meet the quality demanded by law. Obviously a suitable soil test or model based on easily available soil data would be much more efficient since this would allow to assess the quality or rice prior to seeding the plants. In paragraph 4.4 results from the model derivation are shown. Two types of models are tested as described in the materials and methods section. One is the direct relation between Cd in rice and Cd (and Zn) measured in the 0.01 M CaCl2 extract and the second model is to relate the soil properties (reactive Cd content, pH and CEC) to the measured Cd levels in rice (illustrated in figure 4.3). The advantage of the first approach (CaCl2 model) is that only one soil test is sufficient to predict the quality of the rice. The disadvantage is that at present, limited data on the CaCl2 extractable metals levels in paddy fields are available. This means that this approach cannot be applied on a regional scale

50 Alterra-rapport 1823
without first having to measure the CaCl2 extractable metal content. The second method based on soil properties does allow for a regional approach since many countries do have regional data on soil pH, CEC and some form of the reactive Cd content in soil. In Taiwan for example many soils are tested using 0.1 M HCl which can be used as a suitable indicator of the reactive soil Cd content as was shown in chapter 3.
Cd in soilExtraction by
0.43 HNO3 or 0.1 M HCl
Extraction by 0.01 M CaCl2
Extraction by Aqua Regia
(current standard)
Cd in rice grain
Poor relation
Model 1
Model 2
Figure 4.3 Schematic representation of the models used to predict Cd levels in rice. At the bottom the current approach based on AR is shown.
Both model 1 and 2 are based on the Freundlich equation which has been used previously for other crops as well: Model 1: 10log[Cd-rice grains] = intercept + a 10log[Cd-CaCl2] b 10log[Zn-CaCl2] Model 2: 10log[Cd-grain] = intercept + f10log[Cd-HNO3] + gpH + h10log[CEC] Ultimately these models can be used to calculate critical levels in soil beyond which Cd in rice exceeds the food quality standard 4.4 Regression models to predict Cd levels in rice grain
In table 4.3, regression coefficients of the CaCl2-model (i.e., model 1) and the HNO3-model (i.e., model 2) are shown for all individual rice cultivars as well for all Japonica species or all Indica species grouped together. The overall model performance for the individual rice cultivars for both models was rather good with small but significant differences between model coefficients for different cultivars. Apart from HNO3, HCl and EDTA were used as well to estimate the reactive metal pool in the HNO3-model. However, the combination of the reactive Cd pool as measured by extraction with HNO3 and pH and CEC proved to be the most significant model (results not shown). In the remainder of the study, therefore, the results of the soil test based on HNO3 will be used for the reactive soil Cd pool. Both the CaCl2-model and the HNO3-model for individual Japonica cultivars outperformed those of the individual Indica cultivars as indicated by a higher R2 value and lower standard errors of the predicted Y-values. The model for all Japonica cultivars or for all Indica

Alterra-rapport 1823 51
cultivars grouped together has a good performance as well. Model coefficients for both the reactive Cd pool and pH in the HNO3-model are surprisingly close for all rice cultivars with marginal, non-significant differences between the Japonica and Indica cultivars. The significance of the CEC is lower than for pH and for the reactive Cd pool, (results not shown), although CEC is significant at the 1%-level for most cultivars except for the rice cultivars 4, 9 and 10. Addition of pH in the CaCl2-model did not improve the model performance (results not shown). Obviously, pH has a profound impact on the availability of Cd in soil solution in paddy fields (Römkens et al., 2009b), and the solubility of Cd and Zn clearly increase with a decrease in pH. Indeed, the HNO3-model shows increased levels of Cd in rice grains with a decrease in pH (table 4.3). When using the available Cd pool as measured by extraction with CaCl2 as in the CaCl2-model, however, this effect of pH is already accounted for since the Cd concentration in CaCl2 extracts is higher in samples from soils with a low pH. For this reason, pH does not contribute significantly to the regression of the CaCl2-model. According to the HNO3-model, the predicted Cd concentration in Indica cultivars is higher at similar HNO3-extractable Cd levels and pH and CEC as due to the higher intercept in the equation for all Indica cultivars grouped together as compared to the intercept found for all Japonica species. This similarity was also observed in the solution model which performs better compared to the soil model, more so for Japonica species than for Indica species (table 4.3). Again, model performance for Japonica species is slightly better than for Indica. Model coefficients for both Cd and Zn in solution are rather similar for Japonica and Indica and predicted Cd levels in rice differ mostly due to the higher off-set. In figure 4.4, all predicted values for Cd are shown for harvest 1 and harvest 2 based on the CaCl2 model for the main cultivars (Indica and Japonica) using Cd and Zn in the 0.01 M CaCl2 extract (equations from table 4.3). Data from both harvests can be explained by the model based on the amounts of Cd and Zn extracted by 0.01 M CaCl2. The 95% confidence interval roughly corresponds to a relative error of a factor of 2 on a linear scale.

52 Alterra-rapport 1823
Table 4.3. Regression coefficients of the CaCl2-model and the HNO3-model describing Cd accumulation in the grains of 12 rice cultivars used in this study.
Cultivar Family CaCl2-model (model 1) HNO3-model (model 2) Intercept Cd-CaCl2 Zn-CaCl2 R2 Se
(Y-est) Intercept Cd-
HNO3 pH CEC R2 Se
(Y-est) 1 J 0.54 0.78 -0.18 0.86 0.23 1.44 0.71 -0.24 -0.51 0.80 0.28 2 J 0.61 0.78 -0.28 0.88 0.21 0.74 0.70 -0.13 -0.43 0.81 0.25 3 J 0.58 0.82 -0.27 0.87 0.23 1.06 0.75 -0.22 -0.37 0.83 0.26 4 J 0.67 0.88 -0.32 0.88 0.22 0.94 0.79 -0.22 -0.261 0.82 0.28 5 J 0.51 0.79 -0.24 0.89 0.21 1.36 0.74 -0.22 -0.60 0.85 0.24 6 I 0.84 0.73 -0.27 0.73 0.32 1.32 0.71 -0.18 -0.44 0.69 0.34 7 J 0.72 0.86 -0.32 0.89 0.21 0.631 0.79 -0.13 -0.37 0.85 0.24 8 J 0.59 0.83 -0.36 0.87 0.22 0.85 0.72 -0.17 -0.41 0.79 0.28 9 I 0.75 0.65 -0.24 0.66 0.30 0.94 0.62 -0.15 -0.241 0.68 0.30 10 I 1.03 0.80 -0.29 0.77 0.32 1.33 0.78 -0.19 -0.251 0.79 0.30 11 I 1.06 0.89 -0.37 0.76 0.34 1.11 0.86 -0.16 -0.31 0.78 0.33 12 J 0.69 0.85 -0.28 0.82 0.23 0.75 0.74 -0.13 -0.53 0.79 0.25 All J 0.60 0.82 -0.28 0.86 0.23 0.97 0.74 -0.18 -0.43 0.81 0.27 All I 0.94 0.78 -0.30 0.73 0.33 1.20 0.76 -0.17 -0.32 0.74 0.33
1Significance of the coefficient exceeds 5%, all other coefficients are significant at p < 0.001.

Alterra-rapport 1823 53
0.01
0.1
1
10
100
0.01 0.1 1 10 100
Cd rice data (mg kg-1)
Cd
ric
e m
od
elf
it (
mg
kg-1
)
Harvest 1
Harvest 2
1:1 line
95% low er limit
95% upper limit
Figure 4.4. Measured versus predicted levels of Cd in rice for the first harvest and the second harvest. The dotted lines are equal to the predicted value 2 se(Y-est), which is approximately equal to the 95% confidence interval of the mean.
4.5 Effect of time of harvest on the uptake of Cd by rice
The rice grain samples from this study were collected during four consecutive harvests in 2005 and 2006. Differences between years proved to be non-significant, but significant (P < 0.001) differences between the two harvests obtained within one year were observed as is illustrated by the regression coefficients for each harvest (table 4.4).
Table 4.4 Regression coefficients of the CaCl2-model and the HNO3-model describing Cd accumulation in the grains of all Japonica cultivars or of all Indica cultivars grouped together at the first (May) and at the second harvest (November)
Family Harvest CaCl2-model
(month) Intercept Cd-CaCl2 Zn-CaCl2 R2 se(Y-est) Japonica 5 0.55 0.83 -0.27 85.4 0.22 Japonica 11 0.68 0.81 -0.30 89.2 0.21 Indica 5 0.78 0.79 -0.25 85.3 0.23 Indica 11 1.24 0.85 -0.33 74.5 0.34
HNO3 model Intercept Cd-
HNO3 pH CEC1 R2 se(Y-est)
Japonica 5 1.04 0.70 -0.16 -0.71 81.2 0.25 Japonica 11 1.04 0.80 -0.24 -0.13 87.3 0.23 Indica 5 1.71 0.69 -0.24 -0.57 80.8 0.27 Indica 11 1.32 0.89 -0.23 ns 81.2 0.29
1CEC = cation exchange capacity measured at pH 7

54 Alterra-rapport 1823
Cd concentrations in rice grains were, on average, higher in at the second harvest compared to those of the first harvest (P < 0.001), despite the wide range in Cd levels in rice grains among the rice cultivars. The differences between the first and second harvest are illustrated in figure 4.5 for paddy fields LK2 and PDE; the LK2 field can be considered as non-polluted because total Cd concentration is lower than the Taiwanese background level of 0.4 mg kg-1, while the PDE field is heavily polluted with total Cd concentration up to 30 mg kg-1. For both fields, average Cd concentration in rice grains of Japonica cultivars was 1.6 to 2.4 times higher at the second harvest compared to those at the first harvest. For the Indica cultivars, average Cd levels were 1.8 to 2.5 times higher at harvest 2 compared to those at harvest 1. However, this trend was not observed for all rice cultivars. At the LK2 field, for example, Cd uptake by cultivars 2 and 5 were not different between both harvests. In the PDE field, Cd accumulation in rice grains of cultivar 11 was even lower at the second harvest compared to Cd accumulation of this cultivar at the first harvest.
0
0.1
0.2
0.3
1 2 3 4 5 6 7 8 10 11
Rice Cultivar
Cd
ric
e g
rain
(m
g k
g-1)
LK2
0
1
2
3
4
5
6
7
8
9
1 2 3 4 5 6 7 8 10 11
Rice Cultivar
Cd
ric
e g
rain
(m
g k
g-1)
PDE
Figure 4.5. Difference in Cd concentration in rice grains between the first harvest (May) and the second harvest (November) at two paddy fields with contrasting total Cd concentration. The LK2 field has a relatively low total Cd concentration in soil whereas the PDE field has a relatively high total Cd concentration. Note the difference in the scale on the Y-axis. No results are shown for rice cultivars 9 and 12 since they were not cropped twice each year.
Although it is difficult to explain differences between harvests without additional data on factors like weather and irrigation data, the observed increase in Cd-uptake at time of harvest two largely coincides with an increase in the available Cd pool which was observed as well. The increase in the available Cd-pool could not be explained from the soil data, but it is likely that differences in temperature, rainfall or the duration of the drainage period of the soil prior to the harvest contribute to this difference. It does show, however, that the available pool for Cd throughout the year can vary which has an effect on the quality of rice originating from the same location. To evaluate to what extent the quality of rice fails to meet the FQS at either H1 or H2, data from H1 and H2 from each sampling plot (1442 combinations) were paired. Rice samples from 133 plots (9.2%) exceeded the Taiwan food standard at H2 but not at H1. Since the available Cd levels at H2 generally exceeded those in samples taken at H1, the reverse effect was almost not observed; only 18 samples out of all
Alterra-rapport 1823 55
1442 pairs (1.2%) exceeded the 0.4 mg kg-1 standard for rice at H1 where they remained below the 0.4 mg kg-1 level at H2. The remainder of the samples either was always below (786 plots, 54.5%) or above (505 plots, 35%) the 0.4 mg kg-1 standard for rice. Our findings reported here both support and contradict recent findings from a comparable field study conducted by Simmons et al. (2008) who found that, in agreement with our data, uptake of Cd by rice could be predicted well by the amount of Cd measured in a dilute CaCl2 extract (0.1 M). However, the relation between Cd in rice (2 cultivars only) and Cd in the CaCl2 extract was found only using field-moist soil samples. After drying, Simmons et al. (2008) did not find significant relationships between Cd-CaCl2 and Cd in rice grains. Apparently, air-drying altered conditions in the soil samples to such an extent that the availability of Cd was affected when compared to field-moist soils in the study by Simmons et al. (2008). Whether this difference between air-dried and field moist soils is due to the higher ionic strength used by Simmons et al. (2008) or other factors (including soil type and the length of the draining period previous to harvest) remains unclear.


Alterra-rapport 1823 57
5 Assessment of soil tests and soil-plant models to evaluate soil quality of paddy fields in relation to rice grain quality
5.1 Evaluation of the suitability of standards and models to test soils
The main goal of SQS is to assess whether a soil can be used safely for the production of specific food crops. Here we evaluate whether present SQS in Taiwan are protective enough to ensure that soils that meet the SQS indeed are suitable for rice cropping. Both the SQS of 5 mg kg-1 (AR) and the proposed SQS of 2 mg kg-1 (0.1 M HCl) are used for this evaluation. For each soil sample, measured Cd concentrations in soil with AR or 0.1 M HCl are compared to the aforementioned SQS and based on the outcome of this comparison, the soil is either classified as suitable (soil-Cd < SQS; category A and C) or unsuitable (soil-Cd > SQS; category B and D). Subsequently, measured Cd rice concentrations grown on the same plot are compared to the FQS. This determines whether the soil test was correct (category A and D) or incorrect (category B and C). The FQS used here include the WHO standard (0.2 mg kg-1) and the standard used in Japan and Taiwan (0.4 mg kg-1). The outcome of this evaluation can be summarized as: IF(soil-Cd < SQS)AND(Cd-rice grains < FQS): Category A
(correct, soil = suitable) IF(soil-Cd > SQS)AND(Cd-rice grains < FQS): Category B
(false negative) IF(soil-Cd < SQS)AND(Cd-rice grains > FQS): Category C
(false positive) IF(soil-Cd > SQS)AND(Cd-rice grains > FQS): Category D
(correct, soil suitable) The CaCl2-model and the HNO3-model are used to perform the same evaluation. Both models are applied to all paired soil – rice samples to predict the Cd level in rice grains. The predicted Cd rice levels are subsequently compared to the FQS. Predicted Cd rice levels are either lower or higher than the FQS and a combination of model predictions and measured Cd rice levels are used to classify all samples as A, B, C, or D: IF(Cd-rice grains model<FQS) AND(Cd-rice grains<FQS): Category A (correct, soil = suitable) IF(Cd-rice grains model>FQS)AND(Cd-rice grains<FQS): Category B (false negative) IF(Cd-rice grains model<FQS)AND(Cd-rice grains>FQS): Category C (false positive) IF(Cd-rice grains model>FQS)AND(Cd-rice grains>FQS): Category D (correct, soil suitable)

58 Alterra-rapport 1823
In summary, samples in category A and D are predicted correctly, whereas samples in category B and C are predicted incorrectly. False positives (C) are particularly undesirable because soil tests or soil-plant models suggest that rice can be grown safely whereas measured Cd rice levels exceed the FQS. False negatives are wrongly classified as unsuitable for rice cropping but rice samples do meet the FQS after all. Sample classifications (A, B, C, and D) of measured Cd concentration in rice grains and those based on soil tests or soil-plant models are summarized in table 5.1.
Table 5.1 Overview of the assessment of soil quality using either soil tests or the CaCl2-model and the HNO3-model to predict the quality of rice grains. Soil tests used are Aqua Regia (AR) and HCl with soil quality standards of 5 and 2 mg kg-1, respectively. Food quality standard (FQS) of 0.2 mg kg-1 from the WHO and the Japanese and Taiwanese FQS of 0.4 mg kg-1 are used. Model-I or model-A refers to whether the model was derived for individual (I) cultivars or for all (A) cultivars of Japonica or Indica species grouped together.
% classified as A,B,C,D FQS: 0.2 mg kg-1
% classified as A,B,C,D FQS: 0.4 mg kg-1
A B C D A B C D
Method All cultivars together
Rice grain data 41.2 - - 58.8 55.8 - - 44.2
AR 41.2 0.0 33.3 25.5 55.6 0.3 18.9 25.2
HCl 40.7 0.5 23.7 35.1 55.0 0.9 9.4 34.7
CaCl2-model-I 35.5 5.7 7.8 51.0 53.7 2.1 4.3 39.8
CaCl2-model-A 35.2 6.0 7.9 50.9 53.5 2.4 4.2 39.9
HNO3-model-I 35.2 6.1 7.6 51.2 53.1 2.8 4.4 39.7
HNO3-model-A 35.6 5.6 7.5 51.3 52.6 3.3 4.7 39.4
Data Japonica species only
Rice grain data 51.4 - - 48.6 61.7 - - 38.3
AR 51.4 0.0 22.5 26.1 61.4 0.4 12.5 25.8
HCl 50.7 0.7 12.7 35.9 60.5 1.2 2.8 35.4
CaCl2-model-I 48.3 3.1 8.7 39.9 61.1 0.7 1.2 37.0
CaCl2-model-A 48.3 3.1 8.8 39.8 61.1 0.6 1.3 37.0
HNO3-model-I 48.7 2.7 8.1 40.5 61.2 0.6 1.3 37.0
HNO3-model-A 49.0 2.4 8.2 40.4 61.2 0.6 1.3 37.0
Data Indica species only
Rice grain data 21.4 - - 78.6 46.0 - - 54.0
AR 21.4 0.0 56.5 22.1 46.0 0.0 31.9 22.1
HCl 21.4 0.0 47.8 30.7 45.8 0.2 23.5 30.5
CaCl2-model-I 10.1 11.3 6.5 72.1 40.7 5.3 11.2 42.8
CaCl2-model-A 9.3 12.1 6.4 72.2 39.8 6.3 10.8 43.2
HNO3-model-I 8.2 13.2 7.0 71.6 38.6 7.4 11.5 42.5
HNO3-model-A 8.9 12.5 6.6 72.0 36.9 9.1 12.4 41.6

Alterra-rapport 1823 59
Between 41% (FQS 0.2 mg kg-1) and 56% (FQS 0.4 mg kg-1) met the FQS. An ideal soil test would predict these percentages, with 41% and 56% of all samples classified as A versus and 44% and 59% as D. This is not the case as is shown in table 5.1 for both the FQS of 0.2 and 0.4 mg kg-1. The SQS of 5 mg kg-1 for AR is the worst method to test the quality of paddy soils. Between 19% for a FQS of 0.4 mg kg-1 and 33% for a FQS of 0.2 mg kg-1 are categorized as C. These soils are classified as suitable for rice cropping whereas in fact Cd concentrations in rice grains exceed the FQS. This confirms that accumulation of Cd in grains of rice grown on soils with a Cd concentration below 5 mg kg-1 often leads to Cd levels in rice grains that exceed the FQS. The SQS of 2 mg kg-1 (0.1 M HCl) performs rather good compared to the SQS of 5 mg kg-1 based on AR; for the FQS of 0.4 mg kg-1, only 9% of the samples is classified as C. However, using the 0.2 mg kg-1 WHO standard the HCl soil test results in a significant underestimation of Cd in rice grains, and 24% of the samples are classified as C. Data in table 5.1 illustrate the considerable differences in accumulation of Cd in rice grains between cultivars of Japonica and Indica, because the number of rice grain samples with Cd levels higher than the FQS is much higher for the latter. For both soil tests used here, the number of samples classified into category C is much higher for Indica than for Japonica. The CaCl2-model as well as the HNO3-model give a close to perfect assessment of the suitability of the soil for rice cropping with only 1% of the samples classified in category C at the FQS of 0.4 mg kg-1. At a FQS of 0.2 mg kg-1, the number of samples classified into this category increases to 8 to 9%. For Indica cultivars, the number of samples classified into category C increases as compared to Japonica cultivars for both FQS values used here, but it still is much lower than for the soil tests based on AR and HCl. Furthermore, only minor differences were found between the number of samples classified into category C when using the CaCl2-model and HNO3-model based on individual Japonica and Indica cultivars or when based on all Japonica cultivars or all Indica cultivars grouped together. This demonstrates again the minor differences in the behavior of different rice cultivars of Japonica and of Indica varieties with regard to Cd accumulation in rice grains (table 5.1). Obviously, differences between both varieties are much larger, as has been demonstrated previously. In summary, the CaCl2-model and the HNO3-model perform equally well and clearly outperform the soil tests based on AR and HCl test where the number of erroneously classified samples is roughly 50% higher compared to both soil-plant models. When considering the number of chemical soil analyses needed to use the CaCl2-model and the HNO3-model, the use of the CaCl2 model seems most attractive because only a single extraction with CaCl2 is needed to assess the quality of paddy soils for rice cropping whereas the HNO3-model requires both an extraction of soil with HNO3 and measurement of pH and CEC. On the other hand, in many countries data on the reactive metal pool and pH and CEC may be available which then can be used directly without the need for additional analyses.

60 Alterra-rapport 1823
5.2 Alternative soil standards based on soil tests with AR and HCl
The SQS currently used in Taiwan based on AR and as proposed for HCl are insufficient to assess the quality of paddy soils for rice cropping compared to the performance of the soil-plant models (table 5.1). Nevertheless, the use of fixed SQS values in combination with routinely applicable soil tests is very practical. A possible solution to test whether this would be feasible is to lower the SQS based on AR or HCl, and to assess the performance of these soil tests with respect to the number of samples classified into category C. Hence, the number of samples in category C, being the most serious error, was calculated at ‘new’ SQS based on AR and HCl ranging from 0.5 to 5 mg kg-1. In table 5.2, the results of this analysis are shown for both the FQS of 0.2 and 0.4 mg kg-1.
Table 5.2 Effect of alternative soil quality standards (SQS in mg kg-1) for soil tests like Aqua Regia (AR) and HCl on the number of soil samples incorrectly classified as safe (category C). Current SQS standards are 5 mg kg-
1 for AR and 2 mg kg-1 for HCl. % classified in category C at FQS 0.2 mg kg-1
SQS AR HCl
All Japonica Indica All Japonica Indica
0.5 10.2 4.6 21.8 17.2 8.2 36.8
1 19.0 9.5 39.9 20.5 10.1 43.2
2 21.7 11.1 44.9 23.7 12.7 47.8
3 24.7 13.8 48.7 26.4 15.7 49.8
5 33.3 22.5 56.5 38.9 27.9 62.0
% classified in category C at FQS 0.4 mg kg-1
SQS AR HCl
All Japonica Indica All Japonica Indica
0.5 2.5 0.4 6.4 5.3 0.9 14.3
1 6.1 1.1 16.8 7.0 1.1 19.5
2 7.6 1.4 20.6 9.4 2.8 23.5
3 10.5 3.9 24.2 12.2 5.9 25.4
5 18.9 12.5 31.9 24.5 18.0 37.5
Reducing the SQS for AR from 5 to 0.5 mg kg-1 would decrease the number of soil samples for all rice cultivars in category C from 19 to 2.5% at a FQS of 0.4 mg kg-1 and from 33 to 10% at a FQS of 0.2 mg kg-1. This performance is close to the performance of the CaCl2-model and the HNO3-model (table 5.1). However, reducing the SQS for AR to 0.5 mg kg-1 has the side-effect of increasing the number of soil samples incorrectly classified as unsuitable for rice cropping whereas the Cd concentration in rice grains in meets the FQS (category B). The percentage of samples in category B increases to 20% at the SQS of 0.5 mg kg-1 based on AR. A possible compromise resulting in a clear reduction of samples classified in category C without being too protective is a SQS of 2 mg kg-1. At least for the FQS of 0.4 mg kg-1, this seems an appropriate level for the Japonica cultivars tested here, because the

Alterra-rapport 1823 61
number of soil samples classified into category C amounts to 1.1% whereas the number of soil samples classified into category B amounts to 1% as well. For the Indica cultivars, however, there seems to be no suitable level based on AR resulting in an acceptable assessment of soil quality. At the FQS level of 0.2 mg kg-1 neither AR nor HCl SQS are accurate whereas both the CaCl2-model (or soil test) or the HNO3-model provide reliable alternatives to assess the suitability of the soil for rice cropping. 5.3 Conclusions
Uptake of Cd by 12 different rice varieties grown on non- to moderately polluted soils in Taiwan results in a significant number of rice samples that do not meet current food quality standards. Even at soil Cd levels far below current soil quality standards, Cd levels in Japonica and especially Indica species exceed both the WHO and Japanese food quality standard. This stresses the need for alternative testing methods that do consider the availability of Cd rather than the total Cd content of the soil. Multiple regression analysis indeed confirmed that uptake of Cd was highly correlated to the available Cd and Zn pool in soils which was measured in a 0.01 M CaCl2 extract. A soil-to-plant regression model accounting for differences in pH and CEC of the soil was equally good at simulating the range of Cd measured in rice. Apparently, the 0.01 M CaCl2 extractable Cd pool measured at the time of harvest, when the soil is drained, is a good indicator of the amount of Cd taken up by the plant. This has been suggested by others as well who call this period of drainage the critical stage because the filling of the rice grain takes place during this period (Simmons et al., 2008). Despite the fact that the samples in our study were air-dried, there was a highly significant relationship between Cd in the CaCl2 extract and Cd levels in both roots and rice which seems to contradict results by Simmons et al. (2008). In the study by Simmons et al. (2008) relations were only obtained when using field-moist soil. Whether this is related to the different behavior or even toxic effects of Cd in extremely polluted soils studied by Simmons et al. (2008) or differences between cultivars, remains unclear. In-situ measurements of the changes in the solubility and speciation of Cd in paddy soils and its effects on Cd uptake by rice plants are needed to further address this discrepancy. In contrast to fixed soil standards, soil-to-plant models and the solution model were able to accurately identify those soils were food quality standards will be exceeded in rice. Especially at the WHO standard of 0.2 mg kg-1 both the soil-to-plant and the solution model were still able to discriminate between soils suitable and those not suitable for rice cropping whereas the soil standards based on AR or HCl failed to do so in a large number of samples. In this paper the model concepts were used merely to assess whether or not rice can be grown on a specific soil. The approach can be used as well to derive soil specific target levels and regional risk maps which is another obvious advantage compared to single standards based on the analysis of the total metal content. Uptake models also allow for the region-specific calculation of exposure of human beings feeding from

62 Alterra-rapport 1823
specific areas as was shown by Thornton et al. (2008) or Brus et al. (2009). Obviously model parameters applied in these studies and those obtained here are not necessarily valid for all cultivars grown in paddy fields elsewhere, but as such, the approach can be adapted rather easily based on a limited number of soil and plant samples taken from specific sites or regions. This study nevertheless also confirms that differences between cultivars or even during the year can be significant and have to be considered when assessing the suitability of soils for rice cropping.

Alterra-rapport 1823 63
6 Uncertainty of models to predict Cd uptake by rice
6.1 Introduction
Soil pollution is a world-wide problem affecting the quality of both the terrestrial and aquatic environment. Transfer of contaminants from soil into the food chain is of growing concern due to rising levels of pollutants in food crops (Zhen et al., 2007; Grant and Sheppard, 2008). Uptake of Cd from soil by vegetables or rice is the starting point of an important exposure pathway for human beings (Muchuweti et al., 2006; Khan et al., 2008; Kobayashi et al., 2008; Franz et al., 2008). To protect the general public from elevated exposure to Cd through ingestion of food, soil quality standards (SQS) have been developed. Ideally, SQS represent relevant upper limits for metals and organic compounds in soils to ensure the production of crops that meet food quality standards set by WHO or individual countries. At present, most SQS are still based on the total contaminant content in soil (Carlon, 2007) although plant uptake depends on the availability in soil rather that the total content (Simmons et al., 2008; Römkens et al., 2009a). SQS based on the total content often do not account for differences in the availability of contaminants in soil and it is, therefore, not surprising to observe that SQS vary greatly across the world. SQS for Cd for example range from less than 1 mg kg-1 (e.g. China: 0.6 mg kg-1; NEPAC, 1996) to more than 10 mg kg-1 in some EU countries (Carlon, 2007). Across the EU alone, Cd SQS related to intermediate ‘warning’ levels range from 0.5 mg kg-1 in Denmark to 20 mg kg-1 in Germany (Carlon, 2007). This range is mainly due to both different concepts used to link an undesired effect (exposure, ecotoxicology, leaching etc.) to a level in soil, as well as differences in soil type across the EU. Revisions of frameworks for risk assessment hence should consider the concept of (bio)availability rather that the total metal content (Fairbrother et al., 2007). (Bio)availability of metals like Cd depends on soil properties like acidity (pH) and the content of metal sorbing soil compounds including organic matter and clay content (Brus et al., 2005; Chaudri et al., 2007, Römkens et al., 2009b). The key for improving SQS therefore, is to develop tools that link the chemical availability in soil to levels of Cd in those parts of plants that are consumed by human beings. Both empirical as well as mechanistic models are currently being developed to bridge the gap from chemical speciation in the soil to levels of contaminants in plants. Mechanistic models like the Free Ionic Activity Model (FIAM) applied for Cu (Sauvé et al., 1996), or the Biotic Ligand Model applied to predict toxicity for Cu and Ni (Thakali et al., 2006) need to be improved before application on a field scale. Their main limitation is that both types of models focus on uptake processes by roots and transfer into above ground parts is not yet accounted for. François et al. (2009) demonstrated that empirical models outperformed models based on the predicted free metal activity in the soil solution to predict the Cd content in wheat. Also in studies by Efroymson ( 2001), Chaudri et al. (2007), Brus et al. (2009), Römkens et al. (2009b) empirical soil to plant transfer models using pH, CEC and the reactive soil Cd content were able to predict the metal content in arable crops including rice rather accurately. Aside from

64 Alterra-rapport 1823
such transfer models, the chemical availability of Cd in soils measured by dilute salt solutions (e.g. 0.01 M CaCl2) appears to be correlated well to Cd levels in rice grain (Simmons et al., 2008, Römkens et al., 2009b). Both soil-plant transfer models and the CaCl2 model were able to identify with sufficient accuracy (> 90%) those soils where Cd levels in rice did not meet the food quality standard (FQS) applied in Taiwan (0.4 mg kg-1 for brown rice). In contrast to these modeling approaches, classic SQS based on the total metal content failed to identify 40 to 50% of all soils were measured levels of Cd in rice exceeded the FQS (Römkens et al., 2009a). Despite the fact that soil-plant relationships have been derived for several crops across the world, few examples exist where such relationships are actually used to derive national or local SQS. Existing examples include the calculation of soil specific standards for Cd in wheat in the Netherlands and Australia (Brus et al., 2005; McLaughlin et al., 2006) and for Pb in wheat in the UK (Chaudri et al., 2007) but applications for important food crops like rice are still lacking. The aim of this paper is apply soil to plant transfer models as well as the CaCl2 model to derive SQS for 12 different rice cultivars grown under field conditions in Taiwan (Römkens et al., 2009a and b). Based on a method described by Brus et al. (2005), model uncertainty is taken into account which allows for the calculation of a 90% or 95% confidence level. To illustrate the possibilities of the approach, soil data from Taiwan are used to construct regional SQS maps. Based on soil pH and CEC, a critical Cd content can be calculated for each cell on the map resulting in a regional risk assessment tool. Such maps can be used by regional planners and farmers to identify potential risk areas related to Cd levels in rice. Obviously the model results presented here are not necessarily valid for all rice growing areas across Asia, but we show that this concept can be adapted easily to be applied elsewhere to obtain more realistic SQS. 6.2 Materials and Methods
In 2005 and 2006, more than 3000 samples of soil and rice were taken from 19 different paddy fields across Taiwan. A detailed description of the location of the fields, soil types, methods used and levels of Cd in soil and rice is given by Römkens et al. (2009a). Based on the results from the field study, soil to plant relationships for 11 different Japonica or Indica type cultivars were derived according to:
10log[Cdrice grain] = Constant + a 10log[Cd-soil] + b pH0.01M Ca + c 10log[CEC] [6.1] With: Cdrice grain = measured Cd content in rice grain (mg kg-1) Cd-soil = Cd content in soil based on extraction by Aqua Regia (AR),
0.43 M HNO3, and 0.1 M HCl; all extracts expressed in mg kg-1. pH0.01M Ca = pH measured in an 0.01 M CaCl2 extract CEC = cation exchange capacity (cmol (+) kg-1) Constant, a, b, c = regression coefficients

Alterra-rapport 1823 65
For all cultivars results of eq. [6.1] were calculated using Aqua Regia (AR), 0.43 N HNO3, and 0.1 M HCl. Estimates of the Cd content in rice grains were also obtained using a 0.01 M CaCl2 extract (Römkens et al., 2009b):
]log[Zn ]log[Cd Constant ]log[Cd22 CaC1
10CaC1
10grain rice
10 ba [6.2]
Where
2CaC1Cd = Cd content in soil measured in 0.01 M CaCl2 in mg kg-1
2CaC1Zn = Zn content in soil measured in 0.01 M CaCl2 in mg kg-1
Coefficients for eq. [6.1] (for HNO3) and eq. [6.2] are listed in Römkens et al. (2009b) and in appendix 2. 6.3 Statistical approach to derive SQS based on soil to plant transfer
models
In this study eq. [6.1] and eq. [6.2] are used to derive SQS for Cd in soil based on the relation between Cd in soil and Cd in rice grains. The first model is a Freundlich equation similar to the ones used by Adams et al. (2004), Simmons et al. (2008), and Brus et al. (2008) although the choice of soil properties included can vary. Both models are derived by OLS (Ordinary Least Square fitting) in Genstat version 11.1. The equations are derived for 12 individual cultivars included in the field study as well as for all Japonica (C1, C2, C3, C4, C5, C7, C8, C12) or Indica (C6, C9, C10, C11) combined. Using the appropriate FQS for Cd in rice (WHO: 0.2; Japan/Taiwan: 0.4 mg kg-1), a SQS for Cd (depending on pH and CEC) or in the CaCl2 extract can be derived after rearranging equation [6.1] and [6.2] and back transformation to a linear scale. Obviously, models that relate the Cd content in rice to that in soil or a soil extract are not perfect. In fact, the SQS derived from equation [6.1] or [6.2] by definition equals the P50 which means that the predicted Cd content in rice at the calculated SQS has a chance of 50% to exceed the FQS. Depending on the quality of the model, the distribution of the predicted levels can be narrow (good model) or wide. To correct for model uncertainty in order to reduce errors in the prediction of the suitability of soils, probabilistic SQS can be derived based on eq. [6.1] (Brus and Jansen, 2004; Brus et al., 2005). Based on the model uncertainty, the P90 and P95 can be calculated. At the P90 (or P95) the chance that the rice still exceeds the food quality criteria is less than 10% (P90) or 5% (P95). 6.4 Results
6.4.1 Derivation of soil plant transfer models for different extracts
Both AR and HCl are, at present, used in various countries including Taiwan to

66 Alterra-rapport 1823
evaluate the quality of soils in relation to land use. Elsewhere, also 0.43 N HNO3 is used as a measure of the reactive metal content in soils. Coefficients of soil plant transfer models (Constant, a, b, and c) for HNO3 were listed in Römkens et al (2009a); in tables 6.1 and 6.2, coefficients of eq. [6.1] for AR and HCl are listed. The coefficients for the HNO3 model are included for comparison. The coefficients in table 6.1 are for either Japonica or Indica species together, whereas table 6.2 lists the coefficients for the 12 individual cultivars.
Table 6.1. Coefficients of the soil to plant transfer model (eq. 6.1) for Japonica and Indica for models using Aqua Regia (AR), 0.43 N HNO3 and 0.1 M HCl.
Model coefficients
extract Constant Cd pH CEC R2 Se-Yest
Japonica AR 0.93 ± 0.07 0.80 ± 0.01 -0.19 ± 0.01 -0.44 ± 0.04 79.8 0.276
HNO3 0.98 ± 0.07 0.74 ± 0.01 -0.18 ± 0.01 -0.43 ± 0.04 81.4 0.265
HCl 1.01 ± 0.07 0.73 ± 0.01 -0.18 ± 0.01 -0.46 ± 0.04 80.8 0.269
Indica AR 1.17 ± 0.10 0.83 ± 0.02 -0.20 ± 0.02 -0.30 ± 0.06 72.9 0.333
HNO3 1.20 ± 0.10 0.76 ± 0.02 -0.17 ± 0.02 -0.32 ± 0.05 73.9 0.326
HCl 1.25 ± 0.10 0.75 ±0.02 -0.18 ± 0.02 -0.33 ± 0.05 73..6 0.328
As was shown for HNO3 previously by Römkens et al. (2009a) results for Japonica and Indica for AR and HCl are quite good when using in equation [6.1]. An extraction using HNO3 proved to be the most accurate but differences between HNO3 and HCl are small as is indicated by the coefficients of eq. [6.1] in table 6.1. This is not surprising since both HNO3 and HCl extract almost identical amounts of Cd from soil (Römkens et al., 2009b). Differences in model coefficients between individual cultivars are somewhat more pronounced especially those for CEC (table 6.2) although the difference between Japonica and Indica exceeds that of difference between individual Japonica or Indica species.

Alterra-rapport 1823 67
Table 6.2. Coefficients of the soil to plant transfer model (eq.6.1) for individual Japonica (J) and Indica (I) cultivars for Aqua Regia (AR), and 0.1 M HCl.
Extracts used to determine the metal content Cult. Family AR 0.1 M HCl
Constant a AR
b pH
c CEC
R2
Se Constant a HCl
b pH
c CEC
R2
se (Y-est)
1 J 1.37 0.76 -0.25 -0.53 79.4 0.28
1.38 0.67 -0.23 -0.50 77.9 0.29 2 J 0.63 0.75 -0.13 -0.42 77.1 0.2
80.75 0.70 -0.12 -0.46 80.0 0.26
3 J 0.92 0.82 -0.20 -0.43 81.4 0.27
1.04 0.74 -0.20 -0.39 82.6 0.26
4 J 0.89 0.84 -0.23 -0.26* 80.0 0.29
0.94 0.79 -0.21 -0.30 81.9 0.27
5 J 1.32 0.77 -0.24 -0.57 82.7 0.26
1.44 0.74 -0.23 -0.63 84.6 0.25
6 I 1.33 0.76 -0.21 -0.38 66.3 0.36
1.44 0.70 -0.20 -0.42 69.1 0.34
7 J 0.54* 0.84 -0.14 -0.32 83.2 0.26
0.73 0.79 -0.13 -0.41 84.8 0.24
8 J 0.94 0.78 -0.20 -0.46 78.5 0.29
0.92 0.72 -0.17 -0.46 79.1 0.28
9 I 0.95 0.68 -0.18 -0.22** 68.1 0.30
0.98 0.61 -0.15 -0.27* 67.6 0.30
10 I 1.34 0.86 -0.23 -0.23* 77.8 0.31
1.36 0.79 -0.20 -0.26** 78.9 0.30
11 I 0.97 0.96 -0.17 -0.32 78.3 0.33
1.11 0.86 -0.16 -0.33 77..9 0.33
12 J 0.76 0.81 -0.15 -0.54 76.8 0.26
0.86 0.71 -0.13 -0.58 77.7 0.25 t value < 0.05; ** t value < 0.1; all other parameters t < 0.001

68 Alterra-rapport 1823
6.4.2 Soil quality standards (SQS) for individual cultivars
One of the key features using soil to crop models is the derivation of cultivar specific critical SQS for Cd. Figure 6.1 illustrates the differences in P50 levels obtained for all 12 cultivars included in this study at pH 5 (left panel) and pH 7 (right panel) for a sandy soil (open bars) and clay soil (closed bars). Figure 6.1 clearly reveals the elevated uptake of Cd by Indica-type cultivars. SQS for Indica range from less than 0.3 mg kg-1 in sandy soils at pH 5 to approximately 1.0 mg kg-1 at pH 7 in clay soils. Figure 6.1 also illustrates that the use of the models based on all data from Japonica or Indica as presented in table 6.1 gives a good approximation of the average SQS for either Japonica or Indica. For nationwide applications it seems justified to use the overall Japonica or Indica model rather than models for individual cultivars. For local applications on the other hand, specific models can be used if the cultivars match the ones included in this study.
Figure 6.1. P50 SQS for individual Japonica and Indica-type cultivars at pH 5 (left hand panel) and pH7 (right hand panel) in a sandy (CEC = 5 cmol kg-1) and clay soil (CEC = 20 cmol kg-1).
Impact of model uncertainty on the SQS In table 6.3, calculated values of the P50, P90, and P95 SQS for Cd are listed for a sandy soil (CEC = 5 cmol kg-1) and clay soil (CEC=20 cmol kg-1). Here, eq. [6.1] was used based on Aqua Regia extractable metals in soil. Soil pH ranged from 4.5 to 7. The results are based on the combined equations for either Japonica or Indica species.
0.0
0.5
1.0
1.5
2.0
2.5
1 2 3 4 5 6 7 8 9 10 11 12
Cultivar
P50
- S
QS
(m
g k
g-1 A
R)
Sand
Clay
pH 5
0.0
1.0
2.0
3.0
4.0
5.0
6.0
7.0
8.0
9.0
1 2 3 4 5 6 7 8 9 10 11 12
Cultivar
P50
- S
QS
(m
g k
g-1 A
R)
Sand
Clay
pH 7

Alterra-rapport 1823 69
Table 6.3. Calculated P50, P90 and P95 SQS (Aqua Regia in mg kg-1) based on the average models for either Japonica or Indica for a sandy soil (CEC = 5 cmol+ kg-1) and a clay soil (CEC = 20 cmol+ kg-1)
Japonica Sand Clay pH P50 P90 P95 P50 P90 P95 4.5 0.73 0.37 0.26 1.46 0.75 0.53 5 0.97 0.50 0.35 1.94 0.99 0.70 5.5 1.28 0.65 0.46 2.56 1.31 0.92 6 1.69 0.87 0.61 3.39 1.73 1.22 6.5 2.24 1.15 0.81 4.49 2.29 1.61 7 2.97 1.51 1.06 5.94 3.03 2.13 Indica Sand Clay pH P50 P90 P95 P50 P90 P95 4.5 0.28 0.13 0.09 0.44 0.20 0.13 5 0.37 0.17 0.11 0.58 0.26 0.18 5.5 0.49 0.22 0.15 0.76 0.35 0.23 6 0.64 0.29 0.19 1.00 0.46 0.30 6.5 0.84 0.38 0.25 1.31 0.60 0.40 7 1.10 0.50 0.33 1.73 0.79 0.52
Critical levels (P50) for Cd in soil range from more than 5 mg kg-1 at pH 7 for Japonica to less than 0.3 mg kg-1 for Indica in sandy soils at pH 4.5. This large range clearly shows that the impact of soil acidity and, to a lesser extend, soil texture has a profound impact on the quality of soil regarding the Cd content of rice. As such it confirms conclusions from previous studies (Simmons et al., 2008; Römkens et al., 2009a) suggesting that fixed soil standards for a wide range of soils are inappropriate. Also, it clearly shows that the SQS of 5 mg kg-1 currently applied in Taiwan is not protective enough and only suitable for clay soils at near neutral pH. Results from other field and pot trials indeed confirm that for vegetables, wheat and rice alike, SQS can be below 0.5 mg kg-1. Shentu et al. (2008) obtained critical soil Cd levels ranging from 0.1 to 0.5 mg kg-1 for vegetables using the total soil Cd content. Brus et al. (2005) obtained critical soil levels for Cd ranging from 0.5 to 1.5 mg kg-1 for wheat grown under moderate climate conditions. For field-grown wheat, critical Cd levels in soil ranged from 0.3 mg kg-1 at pH 4.5 in a sandy soil to 1.0 mg kg-1 in clay soils at pH 7 (McLaughlin et al., 2006). These studies all suggest that differences between soils which can be characterized by differences in pH and CEC need to be considered to obtain realistic SQS. For Japonica a reduction of the SQS to 2 mg kg-1 seems appropriate in most soils as long as the soil pH is higher than 6. For Indica species on the other hand a fixed SQS of 0.5 to 1.0 is needed in soils with pH 6 or higher. For both Japonica and Indica, both CEC and pH have a pronounced effect on the level of the SQS although the impact of pH exceeds that of CEC as is illustrated in figure 6.2.

70 Alterra-rapport 1823
0.0
0.5
1.0
1.5
2.0
2.5
3.0
3.5
4.0
4.5
0 10 20 30
CEC (cmol(+) kg-1)
Cd-
criti
cal A
qua
Reg
ia (
mg
kg-1)
pH 4.5
pH 5.5
pH 6.5
0.0
0.1
0.2
0.3
0.4
0.5
0.6
0.7
0.8
0.9
1.0
0 10 20 30
CEC (cmol(+) kg-1)
Cd-
criti
cal A
qua
Reg
ia (
mg
kg-1)
Indica(Aqua Regia)
pH 4.5
pH 5.5
pH 6.5Japonica(Aqua Regia)
Figure 6.2. Effect of pH and CEC on the SQS (P50) for Japonica (left) and Indica (right) based on eq. 1 using AR.
The effect of CEC is more pronounced at high pH where SQS at pH 6.5 increase from 1.0 in soils with a CEC below 5 cmol kg-1 to 4.0 in soils with a CEC of 30 cmol kg-1. Table 6.3 clearly illustrates the impact of model uncertainty on the P90 and P95 values. Based on the soil extraction by AR, P90 values for the combined models are approximately half the value of P50 values. Levels of the P95 SQS range from 0.3 to 0.4 times the value of the P50. For Indica this means that reducing the error in the SQS to 5% results in an SQS value of less than 0.1 mg kg-1 at pH 4.5 to about 0.3 mg kg-1 at pH 7. This is equivalent to the natural background level of Cd in most soils around the world and illustrates the fact that for some crops including brown rice, uptake of Cd can be high even at low Cd levels in soil. This is in line with findings on Cd uptake by vegetables in non-tropical areas like Belgium and the Netherlands where Cd levels in leek and scorzonera exceeded current EU food quality standards (Rietra and Römkens, 2007) in soils below generally accepted background levels (Brus et al., 2009). Although the low levels of the P95 SQS illustrate that levels of Cd in crops can exceed the FQS, P50 SQS are most commonly used in relation to crop protection (e.g. Shintu et al., 2008). Although the use of a P95, SQS level warrants the production of crops that meet the FQS in 19 out 20 cases, application on a national level will result in a large number of sites that are incorrectly qualified as unsuitable. SQS at or below generally accepted background levels imply that even clean soils are not suitable for crop production. The fact that there is a risk that crops exceed FQS at low soil Cd levels seems unavoidable and is related to specific properties of crops like brown rice and vegetables including leek and scorzonera. P50 SQS levels on the other hand seem more suitable as a first screening level and have proven to be rather successful in identifying those soils where rice indeed did not meet FQS (Römkens et al., 2009b).

Alterra-rapport 1823 71
SQS based on CaCl2 extracts The link between CaCl2 extractable Cd and Zn on one hand and the levels of Cd in rice grain on the other has been established by various authors (Simmons et al., 2005; Römkens et al., 2009b). This link can be used to derive critical levels in such extracts beyond which the Cd level in rice exceeds the food quality standard. The obvious advantage of such critical limits is that only one soil test has to be performed that serves as indicator for the quality of rice. The study by Römkens et al. (2009b) clearly showed that the available Zn fraction measured in the CaCl2 extract suppressed the level of Cd in rice. Hence, the critical Cd level depends on the available Zn fraction. In table 6.4 critical limits for Cd in the 0.01 M CaCl2 extract are listed for Japonica and Indica as a function of the available Zn content. In the database used to derive the soil plant relationships based on CaCl2, the 10 to 90 percentile extractable Zn content ranged from 0.3 to 20 mg kg-1. This range was used to derive critical Cd levels in soil as listed in table 6.4. Here, average models for all Japonica or Indica species were used. Figure 6.3 shows the effect of Zn on the critical (P50) level of Cd for all individual 12 cultivars. Critical levels for Japonica exceed those of Indica by a factor of approximately 4 (table 6.4) and range from less than 0.05 mg kg-1 at very low Zn levels in soil to more than 0.15 mg kg-1 in soils with 20 mg kg-1 extractable Zn. This clearly illustrates the considerable influence of Zn on the uptake of Cd by rice studied here. If the model without considering the impact of Zn is used to calculate critical Cd levels in 0.01 M CaCl2, the fixed critical Cd content is equal to 0.10 mg kg-1 for Japonica and 0.027 mg kg-1 for Indica. This is very close to the values reported in table 6.4 based on the average Zn content in all samples from the database which ranges from 3.6 mg kg-1 for the plots used to grow Japonica rice and 3.9 mg kg-1 for Indica. When used to evaluate the suitability of soils for rice cropping, the accuracy of the assessment obviously increases when using the extractable Zn content as well. After all, the local critical limit for Cd including Zn, varies up to 50% of the level of the P50 value compared to the model without Zn. Due to model uncertainty the P90 level for Japonica type rice species is roughly equal to 0.58 times the P50 level. For Indica type cultivars, most models proved to be somewhat less accurate and P90 levels are approximately 0.4 to 0.45 times the P50 level. P95 levels are approximately 0.45 times the P50 level for Japonica and 0.28 times the P50 level for Indica. Differences between individual Japonica or Indica species (figure 6.4) are less pronounced. Only for cultivar 8 (Japonica) the critical levels seem higher compared to the other Japonica species. For Indica, all species tested here behave more or less similar with only minor differences between individual cultivars. Again, these results suggest that the use of a single model based on either Japonica or Indica will give a rather accurate assessment of the critical limit of Cd in soil as measured by CaCl2. As such the use of a single extract has its merits compared to the soil plant relationships, which requires the input of both soil pH and CEC. Especially the latter is more laborious to measure whereas the 0.01 M CaCl2 is a rather robust method (Houba et al., 2000) which also has been promoted as an appropriate technique to assess the availability of other metals as well (Brand et al., 2009).

72 Alterra-rapport 1823
Table 6.4 Overview of P50, P90 and P95 levels for the critical Cd content in 0.01 M CaCl2 (in mg kg-1) for Japonica and Indica species.
Critical Cd content in 0.01 M CaCl2 extract Japonica Indica Zn (mg kg-1) P50 P90 P95 P50 P90 P95 0.3 0.040 0.024 0.018 0.012 0.005 0.004 0.5 0.047 0.028 0.021 0.015 0.006 0.004 0.8 0.055 0.032 0.025 0.018 0.008 0.005 1.3 0.065 0.038 0.029 0.021 0.009 0.006 2.0 0.076 0.045 0.034 0.025 0.011 0.007 3.2 0.089 0.052 0.040 0.030 0.013 0.009 5.0 0.104 0.061 0.046 0.036 0.016 0.010 7.9 0.122 0.072 0.054 0.042 0.019 0.012 12.6 0.143 0.084 0.064 0.051 0.022 0.014 20.0 0.168 0.099 0.075 0.060 0.027 0.017 No Zn 0.101 0.046 0.031 0.027 0.008 0.005
Japonica
0
0.1
0.2
0.3
0 5 10 15 20 25
Zn in CaCl2 extract (mg kg-1)
Cri
tica
l Cd
co
nte
nt
(mg
kg
-1)
C1
C2
C3
C4
C5
C7
C8
C12
Japonica
Indica
0
0.1
0.2
0.3
0 5 10 15 20 25
Zn in CaCl2 extract (mg kg-1)
Cri
tica
l Cd
co
nte
nt
(mg
kg
-1)
C6
C9
C10
C11
Indica
Figure 6.4. Critical Cd content in the 0.01 M CaCl2 extract for 8 Japonica type cultivars (left) and 4 Indica type cultivars within the 10-90% range of the extractable Zn content (0.3 to 20 mg kg-1). The figures have the same scale to facilitate comparison between Japonica and Indica.
6.4.3 Assessment of soil quality based on the P50, P90 or P95 percentile
SQS
As shown in tables 6.3 and 6.4, P90 or even P95 SQS levels are substantially lower compared to the P50 value. One of the aims of the research was to minimize the erroneous assessment of soils using fixed standards. The results shown in Römkens et al (2009a) clearly show that soil plant relationships are far more accurate in determining whether a soil is suitable for rice cropping or not. Here we assess whether the P90 or even the P95 should be used in assessing soil quality or that a P50 is suitable as well. To do so, all samples were classified according to the method described by Römkens et al. (2009a). In short, soil plant models are used to assess whether the soil is suitable or not comparing the predicted outcome of the model with the actual quality of rice from the same sample. To do so, the calculated P50,

Alterra-rapport 1823 73
P90, and P95 SQS values for the CaCl2 and soil model were used to derive regression functions that calculate the P50, P90 and P95 SQS based on either the Zn measured in CaCl2 or a combination of pH and CEC for the soil –plant model. In table 6.5 the coefficients of these equations are listed. The only difference between the three uncertainty levels is the constant in the equation; all coefficients of variables included are similar.
Table 6.5 Regression functions to calculate P50, P90 and P95 SQS from CEC and pH (soil model) or CaCl2 extractable Zn (CaCl2 model).
Soil plant model Japonica Indica Constant CEC pH Constant CEC pH P50 -1.85 0.585 0.246 -2.11 0.422 0.226 P90 -2.15 0.585 0.246 -2.47 0.423 0.226 P95 -2.30 0.586 0.246 -2.66 0.423 0.227 CaCl2 model Japonica Indica Constant Zn Constant Zn P50 -1.22 0.346 -1.72 0.383 P90 -1.45 0.346 -2.07 0.383 P95 -1.58 0.346 -2.26 0.383
For each sample from the database, the P50, P90 and P95 SQS of Cd in soil (HNO3 model) or CaCl2 was calculated. Subsequently the SQS value thus calculated was compared to the actual Cd content of the soil or the Cd content in the CaCl2 extract. This results in an assessment of the soil quality which then can be validated using the measured Cd content in rice grains. In table 6.6 the results of this assessment are shown listing the number of samples that are qualified correctly, which means that the soil test correctly predicts whether the rice is above or below the FQS, and the samples which are qualified incorrectly. The latter samples include those where the soil test indicates that the rice is of insufficient quality whereas in fact the Cd content in rice meets the FQS and the samples where the rice is predicted to meet the FQS whereas the actual Cd content in rice exceeds the FQS. For comparison this table also includes the same assessment based on the HCl and AR soil test used at present in Taiwan. The results in table 6.6 show that models are clearly better compared to fixed soils tests although 2 mg kg-1 HCl test for Japonica seems acceptable. However, using the P90 or even P95 level up to 42% of all Indica samples is incorrectly classified as not suitable which renders large areas as seemingly at risk whereas in fact the quality of rice will meet the FQS.

74 Alterra-rapport 1823
Table 6.6 Assessment of the accuracy of the P50, P90 and P95 SQS to identify soils unsuitable for rice cropping
SOLUTION MODEL SOIL MODEL
A B C D A B C D
P50 All 53.6% 3.3% 4.5% 38.6% 54.5% 2.4% 4.2% 39.0%
Japonica 61.3% 0.5% 1.1% 37.0% 61.2% 0.6% 1.1% 37.0%
Indica 36.8% 9.2% 11.9% 42.1% 39.8% 6.2% 10.8% 43.2%
P90 All 46.5% 10.4% 1.4% 41.8% 45.9% 11.0% 1.0% 42.1%
Japonica 61.1% 0.8% 1.1% 37.0% 59.2% 2.7% 1.0% 37.2%
Indica 14.7% 31.3% 2.0% 52.1% 17.0% 29.0% 1.0% 53.0%
P95 All 40.6% 16.3% 0.9% 42.2% 38.0% 18.8% 0.6% 42.5%
Japonica 57.1% 4.7% 1.0% 37.1% 53.7% 8.2% 0.7% 37.4%
Indica 4.6% 41.4% 0.6% 53.4% 4.1% 41.9% 0.4% 53.6%
AR soil test HCl soil test
A B C D A B C D
All 56.7% 0.3% 18.5% 24.6% 56.6% 0.4% 9.3% 33.8%
Japonica 61.5% 0.4% 12.3% 25.7% 61.4% 0.5% 2.7% 35.3%
Indica 46.1% 0.0% 31.8% 22.0% 46.1% 0.0% 23.5% 30.4% Although both the soil model and the CaCl2 model at the P50 level perform much better compared to fixed soil standards, there is still a number of samples (11 to 12% for Indica) where the Cd content in rice exceeds the P50 FQS although models predict it to fall below this standard (category C). Using a P90 or even P95 SQS substantially reduces the samples in category C to less than 2% which means that only one in 50 samples will fail the FQS despite having a soil Cd level below the calculated SQS. However, the obvious disadvantage of P90 and P95 SQS for field applications is the considerable increase in the number of samples incorrectly classified as non-suitable whereas in fact the rice will meet the FQS. At the P95 level, up to 42% of Indica rice samples and 8% of Japonica rice samples is predicted not to meet the FQS at the given soil Cd level or the amount of Cd in the CaCl2 extract whereas in fact the data indicate that the rice meets the criteria. Reducing the number of soils that fail to be identified by models as not-safe by increasing the confidence level of the SQS (P90 or P95) invariably leads to an increase in the number of soils qualified as not-suitable whereas in fact they are suitable for rice production. As such P50 SQS levels seem to represent an acecptable compromise to identify soils not suitable for crop prodcution without being too strict. The use of P90 and P95 SQS levels on one hand identifies those soils which are suitable for crop production but it also would erroneously identify a large number of fields as potentially not safe for use. Conclusions Soil specific SQS vary widely due differences in pH and CEC and range from less
than 0.3 for Indica species in sandy soils to more than 5 in clay soils at neutral pH values;

Alterra-rapport 1823 75
Model uncertainty leads to 50% (P90) or 65% (P95) reduction of SQS compared to P50;
On average SQS for Japonica should be reduced at least to 2 mg kg-1 for clay soils and 0.5 mg kg-1 for Indica at pH 7 if no correction for pH or CEC is applied;
Differences between individual cultivars are limited, large differences however exist between Japonica and Indica;
Application of soil-plant models on a regional scale is easy and can be used as first assessment for potential risks. High variability of Cd in soil however makes regional maps not reliable for application on a local scale (unless local data are available obviously)
Derivation of a single standard based on CaCl2 seems promising but few data are available as of now (in contrast to AR/pH/CEC which are available on regional scale);
Effect of Zn on uptake of Cd is pronounced and should be considered, which is easy due to the fact that both Cd and Zn can be measured in one extract (0.01 M CaCl2)
P90 and especially P95 SQS lead to unacceptable high numbers of samples which are unnecessarily disqualified as not suitable. P50 levels seem to represent an acceptable compromise.


Alterra-rapport 1823 77
7 Tools to assist farmers and policy makers to evaluate soil quality for rice cropping
7.1 Introduction
At present, few tools are available that can be used by either farmers or policy makers to evaluate the quality of local fields used for agricultural purposes. As such, the models described in chapter 4 can be used to construct easy to use tools that enable the user to decide on the quality of the soil. This concept which has been developed for similar problems with Cd polluted soils in the Netherlands is based on the relationship between soil properties (including the Cd content) and the Cd content in rice. The user only has to fill in some basic properties including the pH, CEC and Cd content of the soil. Often these data are available and if not, are rather easy to obtain. Here we present two types of output, the so-called ‘look-up table’ which shows the suitability of the soil for a specific cultivar in the form of a color-table, and output generated by an Excel file for specific evaluation of various cultivars. 7.2 Look-up tables
Look-up tables present an overview of the suitability of a range of soils (that is, a range in the Cd-level in the soil and pH). This concept is based on the soil (HNO3) model but can be used for Aqua Regia or HCl as well. Obviously, the parameters used in the model have to be derived for the correct soil analysis (i.e. HNO3, HCl or Aqua Regia). For every combination of pH, CEC and Cd content in the soil, the model calculates the level of Cd in the rice, either for the mixed models (Japonica or Indica) or for individual cultivars as was discussed in chapter 4 (table 4.3): Cd-rice = Intercept + a· pH + b· log CEC + c· log[Cd-soil] [7.1] In Appendix 1 all model coefficients (intercepts, values for a, b and c) are listed for all extracts (Aqua Regia, HNO3 and HCl). Obviously, care should be taken to use the appropriate set of coefficients when dealing with a specific extract. To make the table flexible, the user can define the range of interest in pH and Cd-level in the soil which the table should reflect. The results are then plotted in a square matrix as is shown in figure 7.1. Here the following soil properties were used: pH range: 5 – 7 Cd-soil range: 0.2 – 2 mg kg-1 based on HCl

78 Alterra-rapport 1823
Obviously the table looks different when using other combinations of ranges in pH and Cd-soil. In figure 7.1 the models for Japonica and Indica are used, tables can be constructed for individual cultivars as well. The color scheme in figure 7.1 is chosen as follows to reflect the predicted quality of rice: Green fields: combination of pH and Cd-soil will result in rice of sufficient
quality, the Cd level will be below the food quality standard (in this case we used a critical level of Cd in rice of 0.4 mg kg-1 which is currently used in Taiwan)
Red fields: combination of pH and Cd-soil will results in rice of insufficient quality, the rice will contain more than 0.4 mg kg-1
Yellow fields: this combination results in a Cd level in rice close to the food quality standard used (in this case 0.4 mg kg-1). The model uncertainty does not allow for a specific evaluation.
Japonica Indica
pH range pH range
5 5.2 5.4 5.6 5.8 6 6.2 6.4 6.6 6.8 7 5 5.2 5.4 5.6 5.8 6 6.2 6.4 6.6 6.8 7
0.2 0.13 0.12 0.11 0.10 0.09 0.08 0.08 0.07 0.07 0.06 0.06 0.2 0.31 0.29 0.27 0.24 0.23 0.21 0.19 0.18 0.17 0.15 0.14
0.4 0.21 0.19 0.17 0.16 0.15 0.14 0.12 0.11 0.11 0.10 0.09 0.4 0.50 0.47 0.43 0.40 0.37 0.34 0.31 0.29 0.27 0.25 0.23
0.6 0.28 0.25 0.23 0.21 0.20 0.18 0.17 0.15 0.14 0.13 0.12 0.6 0.68 0.63 0.58 0.53 0.49 0.46 0.42 0.39 0.36 0.33 0.31
Cd-soil 0.7 0.34 0.31 0.29 0.26 0.24 0.22 0.20 0.19 0.17 0.16 0.15 0.7 0.84 0.77 0.71 0.66 0.61 0.56 0.52 0.48 0.44 0.41 0.38
0.9 0.40 0.37 0.34 0.31 0.28 0.26 0.24 0.22 0.20 0.19 0.17 0.9 0.99 0.91 0.84 0.78 0.72 0.66 0.61 0.57 0.52 0.48 0.45
1.1 0.46 0.42 0.39 0.35 0.33 0.30 0.27 0.25 0.23 0.21 0.20 1.1 1.13 1.04 0.96 0.89 0.82 0.76 0.70 0.65 0.60 0.56 0.511.3 0.51 0.47 0.43 0.40 0.36 0.33 0.31 0.28 0.26 0.24 0.22 1.3 1.27 1.17 1.08 1.00 0.92 0.85 0.79 0.73 0.67 0.62 0.581.5 0.56 0.52 0.48 0.44 0.40 0.37 0.34 0.31 0.29 0.26 0.24 1.5 1.40 1.29 1.20 1.11 1.02 0.94 0.87 0.81 0.74 0.69 0.641.6 0.61 0.56 0.52 0.48 0.44 0.40 0.37 0.34 0.31 0.29 0.26 1.6 1.53 1.41 1.31 1.21 1.12 1.03 0.95 0.88 0.81 0.75 0.69
1.8 0.66 0.61 0.56 0.51 0.47 0.43 0.40 0.37 0.34 0.31 0.29 1.8 1.66 1.53 1.41 1.31 1.21 1.12 1.03 0.95 0.88 0.81 0.75
2.0 0.71 0.65 0.60 0.55 0.51 0.47 0.43 0.39 0.36 0.33 0.31 2.0 1.78 1.64 1.52 1.40 1.30 1.20 1.11 1.02 0.95 0.87 0.81 Figure 7.1 ‘Look-up table’ for Japonica (left) and Indica (right) for soils with pH levels from 5 – 7 and HCl extractable Cd soil from 0.2 to 2.0 mg kg-1 (CEC of the soil was set at 10 cmol+ kg-1).
Figure 7.1 clearly illustrates the considerable difference between Japonica and Indica in terms of Cd accumulation and the importance of pH when dealing with risk assessment. Japonica species can be cultivated safely up to 1 mg kg-1 in near neutral soil. Below pH 6 the risk that Cd levels in rice exceed the 0.4 food quality limit increases. Indica species on the other hand can be cultivated safely only in soils with a Cd content of less than 0.4 mg kg-1 or even 0.2 below pH 6. This shows that, in line with the results presented in chapter 4 that in polluted soils (Cd-soil > 1 or 2 mg kg-1) Indica species are not suitable. This again also confirms that existing soil quality guidelines used at present in Taiwan (5 mg kg-1 for Aqua Regia and 2 mg kg-1 for HCl) are too high to safeguard the quality of rice. To illustrate this, look-up tables for soils with a Cd content ranging from 1 to 5 mg kg-1 are shown (based on extraction with Aqua Regia).

Alterra-rapport 1823 79
Japonica IndicapH range pH range
5 5.2 5.4 5.6 5.8 6 6.2 6.4 6.6 6.8 7 5 5.2 5.4 5.6 5.8 6 6.2 6.4 6.6 6.8 7
1.0 0.33 0.30 0.27 0.25 0.23 0.21 0.19 0.18 0.16 0.15 0.13 1.0 0.78 0.71 0.65 0.60 0.55 0.50 0.46 0.42 0.38 0.35 0.32
1.4 0.43 0.39 0.36 0.33 0.30 0.27 0.25 0.23 0.21 0.19 0.18 1.4 1.03 0.94 0.86 0.79 0.72 0.66 0.60 0.55 0.50 0.46 0.42
1.8 0.52 0.48 0.44 0.40 0.37 0.34 0.31 0.28 0.26 0.23 0.21 1.8 1.27 1.16 1.06 0.97 0.89 0.81 0.74 0.68 0.62 0.56 0.52
Cd-soil 2.2 0.61 0.56 0.51 0.47 0.43 0.39 0.36 0.33 0.30 0.28 0.25 2.2 1.50 1.37 1.25 1.15 1.05 0.96 0.87 0.80 0.73 0.67 0.61
2.6 0.70 0.64 0.59 0.54 0.49 0.45 0.41 0.38 0.34 0.31 0.29 2.6 1.72 1.57 1.44 1.31 1.20 1.10 1.00 0.92 0.84 0.76 0.70
3.0 0.79 0.72 0.66 0.60 0.55 0.50 0.46 0.42 0.39 0.35 0.32 3.0 1.94 1.77 1.62 1.48 1.35 1.24 1.13 1.03 0.94 0.86 0.793.4 0.87 0.80 0.73 0.67 0.61 0.56 0.51 0.47 0.43 0.39 0.36 3.4 2.15 1.97 1.80 1.64 1.50 1.37 1.25 1.14 1.04 0.95 0.873.8 0.95 0.87 0.79 0.73 0.66 0.61 0.56 0.51 0.47 0.43 0.39 3.8 2.36 2.15 1.97 1.80 1.64 1.50 1.37 1.25 1.15 1.05 0.964.2 1.03 0.94 0.86 0.79 0.72 0.66 0.60 0.55 0.50 0.46 0.42 4.2 2.56 2.34 2.14 1.95 1.79 1.63 1.49 1.36 1.24 1.14 1.04
4.6 1.11 1.01 0.93 0.85 0.77 0.71 0.65 0.59 0.54 0.50 0.45 4.6 2.76 2.52 2.31 2.11 1.92 1.76 1.61 1.47 1.34 1.23 1.12
5.0 1.18 1.08 0.99 0.90 0.83 0.76 0.69 0.63 0.58 0.53 0.48 5.0 2.96 2.70 2.47 2.26 2.06 1.88 1.72 1.57 1.44 1.31 1.20 Figure 7.2 ‘Look-up table’ for Japonica (left) and Indica (right) for soils with pH levels from 5 – 7 and Aqua Regia extractable Cd soil from 1 to 5 mg kg-1 (CEC of the soil was set at 10 cmol+ kg-1).
Figure 7.2 confirms that Indica species are unsuitable for use on these soils, all combinations of Cd-soil and pH will most likely result in rice which contains more than 0.4 mg kg-1. For Japonica on the other hand, the look-up table shows that at pH levels higher than 6, the quality of Japonica rice probably is sufficient in soils with Cd levels below 2 mg kg-1. Between pH 5 and 6, the soils should contain less than 1.5 mg kg-1 (approximately) to be suitable for rice cropping. Again, the influence of pH is pronounced and should be taken into account to make safe decisions on whether or not to grow rice on this soil. The model used here also includes the CEC of the soil. In soils with a low CEC such as sandy soils, Cd uptake is higher compared to uptake from clay soils with a much higher CEC. This is illustrated in figure 7.3 for Japonica species. Here, the effect of CEC is illustrated for a soil with a CEC of 7 cmol(+) kg-1 which is roughly equivalent to the soils from the HC fields versus a soil with a CEC of 20 cmol(+) kg-1 which was found in the HM3 soil (table 2.1)
Japonica, CEC 7 cmol kg-1 Japonica, CEC 20 cmol kg-1
pH range pH range
5 5.2 5.4 5.6 5.8 6 6.2 6.4 6.6 6.8 7 5 5.2 5.4 5.6 5.8 6 6.2 6.4 6.6 6.8 7
1.0 0.38 0.35 0.32 0.29 0.27 0.25 0.22 0.21 0.19 0.17 0.16 1.0 0.24 0.22 0.20 0.18 0.17 0.15 0.14 0.13 0.12 0.11 0.10
1.4 0.50 0.46 0.42 0.38 0.35 0.32 0.29 0.27 0.25 0.22 0.21 1.4 0.32 0.29 0.26 0.24 0.22 0.20 0.18 0.17 0.15 0.14 0.13
1.8 0.61 0.56 0.51 0.47 0.43 0.39 0.36 0.33 0.30 0.27 0.25 1.8 0.39 0.35 0.32 0.29 0.27 0.25 0.23 0.21 0.19 0.17 0.16
2.2 0.72 0.66 0.60 0.55 0.50 0.46 0.42 0.39 0.35 0.32 0.29 2.2 0.45 0.41 0.38 0.35 0.32 0.29 0.26 0.24 0.22 0.20 0.19
2.6 0.82 0.75 0.69 0.63 0.57 0.53 0.48 0.44 0.40 0.37 0.34 2.6 0.52 0.47 0.43 0.40 0.36 0.33 0.30 0.28 0.25 0.23 0.21
3.0 0.92 0.84 0.77 0.70 0.64 0.59 0.54 0.49 0.45 0.41 0.38 3.0 0.58 0.53 0.48 0.44 0.41 0.37 0.34 0.31 0.28 0.26 0.24
3.4 1.02 0.93 0.85 0.78 0.71 0.65 0.60 0.54 0.50 0.46 0.42 3.4 0.64 0.59 0.54 0.49 0.45 0.41 0.37 0.34 0.31 0.29 0.26
3.8 1.11 1.02 0.93 0.85 0.78 0.71 0.65 0.60 0.54 0.50 0.46 3.8 0.70 0.64 0.59 0.54 0.49 0.45 0.41 0.37 0.34 0.31 0.29
4.2 1.20 1.10 1.01 0.92 0.84 0.77 0.70 0.64 0.59 0.54 0.49 4.2 0.76 0.69 0.63 0.58 0.53 0.48 0.44 0.41 0.37 0.34 0.31
4.6 1.30 1.18 1.08 0.99 0.91 0.83 0.76 0.69 0.63 0.58 0.53 4.6 0.81 0.75 0.68 0.62 0.57 0.52 0.48 0.44 0.40 0.36 0.33
5.0 1.38 1.27 1.16 1.06 0.97 0.89 0.81 0.74 0.68 0.62 0.57 5.0 0.87 0.80 0.73 0.67 0.61 0.56 0.51 0.47 0.43 0.39 0.36 Figure 7.3 ‘Look-up table’ for Japonica for soils with pH levels from 5 – 7 and Aqua Regia extractable Cd soil from 1 to 5 mg kg-1. CEC of the soil was set at 7 (left) and 20 (right) cmol+kg-1.
The data in figure 7.3 illustrate that in clay soils (CEC = 20), Japonica species can be grown safely up to Cd levels of 3 mg kg-1 provided that the soil pH is close to 7. In sandy soils on the other hand an upper limit of 2 mg kg-1 at pH 7 should not be exceeded.

80 Alterra-rapport 1823
Figure 7.3 also shows a second use of look-up table which is the evaluation of soil management. Lime application for example to increase soil pH can be an option to reduce the uptake of Cd from soil. Increasing soil pH from values around 5 to 6 or higher in a clay soil (right table in figure 7.3) that contains 2 mg kg-1 Cd would reduce the uptake from soil to such an extent that rice will meet the food quality criteria. This on the other hand also indicates that small increases in soil pH are usually not sufficient to improve the quality of rice. Especially in acid soils, an increase in soil pH from levels below 5 to more than 6 would require a large amount of lime which is not a suitable option. Look-up tables nevertheless can be used to assess whether or not correction of soil pH is an option to reduce Cd uptake by the cultivar of choice. The examples included here are merely meant to illustrate some of the differences between cultivars and impact of soil properties (and changes therein) on the Cd uptake by rice. The user can define his or her boundary conditions in terms of cultivars used, pH, soil Cd levels and CEC. Here we presented look-up tables based on the models for Japonica and Indica (all data combined for the two species) but such tables can be constructed for individual cultivars as well using the coefficients listed in Appendix 1. In Appendix 2 an example is shown for all 12 cultivars studied here. As such differences between the individual Japonica (or Indica) cultivars are small compared to the large difference between Japonica and Indica cultivars. 7.3 Soil specific evaluation
Instead of look-up tables, a farmer is merely interested if his or her soil is suitable for a specific cultivar. In this case, there is no need to construct a look-up table from which the soil of interest can be evaluated. In this case a soil-specific evaluation can be performed indicating the suitability of the local soil for one or more varieties available in the database. The farmer has to fill in the soil properties required including: 1. soil metal content in mg kg-1 2. extraction method (choice of Aqua Regia, HNO3, or HCl) 3. soil pH 4. CEC in cmol(+)kg-1 Using the appropriate model coefficients listed in Annex 1, the predicted level of Cd in rice is then reported for each cultivar separately as well as for the Japonica and Indica model as is illustrated in table 7.1

Alterra-rapport 1823 81
Table 7.1 Site specific evaluation of soil quality
Soil Characteristics (to be filled in)
Cd-soil 0.63 mg kg-1
extract HNO3
pH 5
CEC 10 cmol(+)kg-1
Suitability Assessment of soil for Cd-rice
Japonica 0.30 mg kg-1
Indica 0.74 mg kg-1
Cultivar
Tainung No.70 Japonica 0.37 mg kg-1
Taiken No.8 Japonica 0.33 mg kg-1
Tainung No.72 Japonica 0.29 mg kg-1
Kaohsiung No.143 Japonica 0.28 mg kg-1
Taitung No.30 Japonica 0.31 mg kg-1
Tainung Sen No.20 Indica 0.72 mg kg-1
Tainung No.71 Japonica 0.30 mg kg-1
Tainung No.67 Japonica 0.27 mg kg-1
Kaohsiung Sen Yu No.1151 Indica 0.67 mg kg-1
Taichung Sen Waxy No.1 Indica 0.89 mg kg-1
Taichung Sen No.10 Indica 0.66 mg kg-1
Kaohsiung No.144 Japonica 0.27 mg kg-1
Table 7.1 illustrates the differences between Japonica and Indica; for the soil given here, Indica species clearly are not suitable. For Japonica species a mixed result can be obtained. Overall, Cd levels in Japonica will be close to the food quality (average 0.3 mg kg-1) but in this case cultivar 8 and 12 (Tainung no. 67 and Kaoshiung 144) appear to be more suitable compared to for example cultivar 1 (Tainung no. 70). Again, a safety margin was considered and it can be seen from the coloring of the table that there is a reasonable chance that all Japonica species will meet the 0.4 mg kg-1 food quality standard. If the farmer has a choice however, it seems best to choose those cultivars which accumulate the least Cd for the soil under consideration.

82 Alterra-rapport 1823
7.4 Issues to be considered when using average field data
An important issue that needs to be considered is the heterogeneity of the Cd content of the fields (illustrated in figure 3.3). In the majority of the fields the Cd content decreases across the field with an increasing distance from the inlet. Soil sampling procedures to assess the average quality of the field need to take into account this heterogeneity to avoid erroneous results. Samples taken close to the inlet probably contain (much) more Cd compared to those taken at the opposite end of the field. In contrast to the samples included in this study where each individual sample was treated as a soil sample that represents a soil, the farmer is interested merely in the quality of the rice from the entire field (mixed). This means that the soil sample used to determine the soil quality should reflect this average quality. Considering the large variability encountered here, this requires that samples have to be taken from the entire field before mixing it into one sample that represents the average quality across the field.

Alterra-rapport 1823 83
8 Conclusions and Recommendations
Revision of current soil quality standards for agricultural soils The data presented in chapter 3 and 4 clearly show that current soil quality standards used to distinguish clean from polluted soils are not protective enough. The soil monitoring value of 5 mg kg-1 based on Aqua Regia leads to a large number of cases where Cd levels in rice are (far) higher than the allowed 0.4 mg kg-1 currently used as the food quality standard in Taiwan. The 2 mg kg-1 standard based on 0.1M HCl works better for Japonica species but still results in a large number of samples for Indica that contain too much Cd. Alternative soil standards based on either Aqua Regia or HCl should not exceed 2 mg kg-1 as was shown in chapter 5 (table 5.1 and 5.2). Such tests then are only suitable for Japonica species and not for Indica. Even a soil standard of 0.5 mg kg-1 still results in a considerable number of samples of Indica rice samples that do not meet the food quality standard. Application of models to derive soil-specific testing values. Results in chapter 4 clearly show that soil properties like pH and CEC have a large influence on the availability of Cd in the soil. Based on the metal content alone, the uptake of Cd by rice cannot be predicted accurately enough as was discussed previously. However, when using soil pH and CEC in combination with the amount of metals extracted by either HCl or HNO3 the availability of Cd can be assessed rather easily (Chapter 4). This results in a significant improvement of the prediction of Cd in rice and a clear reduction of the number of samples that were incorrectly classified as either suitable or unsuitable. The advantage of the application of such models is that they require relatively little information (pH and CEC) which can be obtained from soil maps or local soil investigations. The approach is very suitable for application on a regional or even national scale to identify areas where rice cropping should be monitored more closely. Use of CaCl2 for soil testing: advantage and disadvantages Instead of a soil test based on Aqua Regia or HCl, the use of 0.01 M CaCl2 seems much more appropriate for either Japonica or Indica species, at least for the ones tested here. The use of CaCl2 does account for differences in the availability of heavy metals in soil which is not the case when using acid soil extracts. Based on CaCl2 extractions no additional soil properties need to be measured since CaCl2 does reflect differences between soil types (as expressed by differences in pH, CEC, organic matter etc.). The results presented in this report are based on CaCl2 extracts performed on dried soil samples (air dried). Results obtained in other field studies seem to indicate that there can be an effect of drying of soil samples on the relationship between soil extractable Cd and uptake by rice. In this study the soil in the immediate vicinity of the rice root (rhyzosphere) soil was sampled which may explain why there is a close match despite drying the samples. If possible, soil samples should be taken from the rhyzosphere.

84 Alterra-rapport 1823
The CaCl2 test is not so much suitable for regional studies as is the case of the soil models but it is especially suitable for local testing of soils where no information is available yet or to focus on areas that have been identified (by the risk maps constructed using the soil-rice model) as potentially not suitable. Careful sampling of local soils from selected fields is then crucial due to the large variability of the Cd content across many fields. Design of user-friendly tools to assess local soil quality for rice cropping Based on the soil-rice models, simple easy-to-use look-up tables can be constructed which enables the owner of a site to assess quickly whether or not a specific soil or field is suitable for one or more varieties to be grown. Based on the list of cultivars studied so far, farmers can choose to use those cultivars which accumulate the least amount of Cd. Extension of the method to other regions in South East Asia At present different approaches are used to determine the suitability of soils for agriculture. In most countries, either in Asia, the EU or elsewhere, the total metal content is still most commonly used to evaluate the suitability of soils for agriculture, housing or industry. This report shows, if anything, that considering the availability of metals (in this case Cd) in soil results in a considerably improvement of soil testing. The approach described here based on soil-plant models currently is being implemented in soil policy in several EU countries (Germany, the Netherlands) and seems quite appropriate for rice cropping as well as indicated by the results in this study. In fact the similarity in the behavior of Cd in paddy fields compared to that in soils from the EU was striking. Nevertheless, soils will be different in countries across Asia, but the approach nevertheless can be implemented rather easily based on a limited number of carefully selected field studies. Selection criteria include soil properties (range in soil types), degree of contamination (clean to polluted) and the rice-varieties used in each country. Research questions that need to be addressed Although it seems that the chemical behavior of Cd in paddy fields as well as the uptake of Cd by rice is rather similar compared to soils and crops from non-tropical countries, several aspects still need to be considered. This includes: 1. The observed difference in the availability of Cd between harvest 1 (May) and 2
(November) and the resulting increase in Cd uptake at harvest 2. Several reasons (difference in temperature, rainfall, and fertilization) can be mentioned but proof is lacking.
2. The apparent difference between results from this study and the one performed by Simmons et al (2008) where extracts with CaCl2 only showed a significant relationship with Cd in rice when using field moist soil. In our study rhyzosphere soil was used which may explain the better fit. This nevertheless suggests that in order to obtain suitable relationships between soil extractable Cd and Cd in rice, clear sampling protocols need to be established.

Alterra-rapport 1823 85
References
Arao, T. and Ishikawa, S., 2006. Genotypic differences in Cd concentration and distribution of soybean and rice. Japan Agricultural Research Quarterly 40, 21–30.
Adams, M.L., Zhao, F.J., McGrath, S.P., Nicholson, F.A. and Chambers, B.J. Predicting Cadmium Concentrations in Wheat and Barley Grain Using Soil Properties (2004) Journal of Environmental Quality, 33 (2), pp. 532-541.
Barrett K.A. and McBride M.B., 2007. Dissolution of zinc-cadmium sulfide solid solutions in aerated aqueous suspension. Soil Sci Soc Am J 71:322–328.
Bonten, L.T.C., Groenenberg J.E., Weng L. and Riemsdijk W.H. van, 2008. Use of speciation and complexation models to estimate heavy metal sorption in soils. Geoderma, 146:303-310.
Brand, E., Peijnenburg W., Groenenberg B., Vink J., Lijzen J., Hulscher D. ten, Jonker C., Römkens P. and Roex E., 2009. Towards implementation of bioavailability mesaurements in the Dutch regulatory framework. RIVM report 711701084/2009, RIVM, Bilthoven, the Netherlands, 80 pp.
Bruemmer G.W., Gerth J. and Tiller K.G, 1981. Reaction kinetics of the adsorption and desorption of nickel, zinc and cadmium by goethite. I. Adsorption and diffusion of metals. J Soil Sci 39:37-52.
Brus D.J. and M.J.W. Jansen, 2004 Uncertainty and Sensitivity Analysis of Spatial Predictions of Heavy Metals in Wheat. J. Environ. Qual. 33:882-890.
Brus, D.J., Z. Li, J. Song, G.F. Koopmans, E.J.M. Temminghoff, X. Yin, C. Yao, H. Zhang, Y. Luo and J. Japenga, 2009. Predictions of Spatially Averaged Cadmium Contents in Rice Grains in the Fuyang Valley, P.R. China. J. Environ. Qual. 38: 1126-1136.
Brus, D.J., Gruijter J.J. de and Römkens P.F.A.M., 2005. Probabilistic quality standards for heavy metals in soil derived from quality standards in crops. Geoderma 128:301– 311.
Buekers J., 2007. Fixation of cadmium, copper, nickel and zinc in soil: kinetics, mechanisms and its effect on metal bioavailability. PhD thesis no. 754, Catholic University Leuven, Leuven, Belgium.
Cai, S., Hu Z., Zhong X., Ye Z., Xu H., Liu Y., Rongi J., Zhang W. and Zhang F., 1990. Cd exposure and health effects among residents in an irrigation area with ore dressing wastewater. Science of the Total Environment 90, 67-73.
Carlon, C. (Ed.), 2007. Derivation methods of soil screening values in Europe. A review and evaluation of national procedures towards harmonization. European Commission, Joint Research Centre, Ispra, EUR 22805-EN, 306 pp.
Central Weather Bureau, 2008. Climate statistics. Central Weather Bureau of Taiwan, No. 64, Gongyuan Road, Taipei, Taiwan 10048, R.O.C. http://www.cwb.gov.tw/eng/statistics/statistics.htm.
Charlatchka R. and Cambier P., 1999. Influence of reducing conditions on solubility of trace metals in contaminated soils. Water Air Soil Pollut 118:143–167.

86 Alterra-rapport 1823
Chaudri A, McGrath S., Gibbs P., Chambers B., Carlton-Smith C., Godley A., Bacon J., Campbell C. and Aitken M., 2007.Cadmium availability to wheat grain in soils treated with sewage sludge or metal salts. Chemosphere 66 (2007) 1415–1423.
Chen, Z.S., 1991. Cadmium and lead contamination of soils near plastic stabilizing materials producing plants in Northern Taiwan. Water, Air, and Soil Pollution 57-58, 745-754.
Chen, Z.S., Tsai, C.C. and Tsui, C.C., 1999. Proposal regulation of soil pollutants in Taiwan soils. In: Chen, Z.S. (Ed.)., Proceedings of 6th Workshop on Soil Pollution and Prevention: Soil Remediation Techniques on Soils Contaminated by Organic Pollutants, Taipei, Taiwan, ROC, pp. 169-207. (In Chinese, with English abstract).
Choudhary, M., Bailey, L.D., Grant C.A. and Leisle D., 1995. Effect of Zn on the concentration of Cd and Zn in plant tissue of two Durum wheat lines. Canadian Journal of Plant Science 75, 445-448.
Clayton P.M. and Tiller K.G., 1979. A chemical method for the determination of heavy metal content of soils in environmental studies. Technical paper no. 41, Division of Soils, CSIRO Australia.
COA, 2008. Food supply and utilization 2005. Council of Agriculture, Taipei, Taiwan. Available at http://eng.coa.gov.tw (checked October 30, 2008).
Colombo C. and Van Den Berg C.M.G., 1998. Determination of trace metals (Cu, Pb, Zn and Ni) in soil extracts by flow analysis with voltammetric detection. Int J Environ Anal Chem 71:1-17.
Contin M., Mondini C., Leita L. and De Nobili, M., 2007. Enhanced soil toxic metal fixation in iron (hydr)oxides by redox cycles. Geoderma 140:164–175.
Cui, Y., Zhang, X., Zhu, Y., 2008. Does copper reduce Cd uptake by different rice genotypes? Journal of Environmental Sciences 20, 332-338.
Das, P., Samantaray, S., Rout, G.R., 1997. Studies on Cd toxicity in plants. A Review. Environmental Pollution 98, 29-36.
Daum D., Bogdan K., Schenk M.K., Merkel D., 2001. Influence of the field water management on accumulation of arsenic and cadmium in paddy rice. In: Horst et al. (Eds.): Plant nutrition - food security and sustainability of agro-ecosystems through basic and applied research, Kluwer, pp 290-291.
De Vries W., Curlík J., Murányi A., Alloway B., J.E Groenenberg, 2005. Assessment of relationships between total and reactive concentrations of Cd, Cu, Pb and Zn in Hungarian and Slovakian soils. Ekológia 24:152-169
De Vries W., Römkens P.F.A.M., Bonten L.T.C., 2008. Spatially explicit integrated risk assessment of present soil concentrations of Cd, Pb, Cu and Zn in the Netherlands. Water Air Soil Pollut 191:199-215.
Degryse, F., Broos, K., Smolders, E., Merckx, R., 2003. Soil solution concentration of Cd and Zn can be predicted with a CaCl2 soil extract. European Journal of Soil Science 54, 149-157.
Diao, W.P., Ni, W.Z., Ma, H.Y., Yang, X.E., 2005. Cd Pollution in paddy soil as affected by different rice (Oryza sativa L.) cultivars. Bulletin of Environmental Contamination and Toxicology 75, 731-738.
Dudka S., Miller W.P., 1999. Accumulation of potentially toxic elements in plants and their transfer to human food chain. J Environ Sci Health B 34:681–708.

Alterra-rapport 1823 87
Dunbar, K.R., 2004. Uptake and partitioning of Cd in two cultivars of potato (Solanum tuberosum L.). Ph.D. thesis, University of Adelaide, School of Earth and Environmental Sciences, Adelaide, Australia, 123 p.
Efroymson, R. A., B. E. Sample, and G. W. Suter II, 2001. Uptake of inorganic chemicals from soil by plant leaves: regressions of field data. Environ. Toxicol. Chem. 20:2561-2571.
Elzinga E.J., Sparks D.L., 1999. Nickel sorption mechanisms in a pyrophyllite–montmorillonite mixture. J Colloid Interf Sci 213:506–512.
EPA, 2006. Regulations governing the preliminary assessment of soil and groundwater pollution control sites. Environmental Protection Administration order Huan-Shu-Tu-Tzu no.0950023629, March 29, 2006.
Fairbrother, A. R. Wenstel, K. Sappington, and W. Wood, 2007. Framework for Metals Risk Assessment. Ecotoxicology and Environmental Safety 68 (2007) 145–227.
François, M., Grant, C., Lambert, R. Sauvé, S., 2009. Prediction of cadmium and zinc concentration in wheat grain from soils affected by the application of phosphate fertilizers varying in Cd concentration. Nutr Cycl Agroecosyst 83:125–133.
Franz, E., Römkens, P.F.A.M., van Raamsdonk, L., van der Fels-Klerx, I., 2008. A chain modeling approach to estimate the impact of soil cadmium pollution on human dietary exposure. Journal Food Protection 71, 2504-2513.
Fu J, Zhou Q., Liu J., Liu W., Wang T., Zhang Q., Jiang G., 2008. High levels of heavy metals in rice (Oryza sativa L.) from a typical E-waste recycling area in southeast China and its potential risk to human health. Chemosphere 71:1269-1275.
Girling, C.A., Peterson, P.J., 1981. The significance of the Cd species in uptake and metabolism of cd in crop plants. Journal of Plant Nutrition 1981, 707-720.
Grant C.A., Sheppard S.C., 2008. Fertilizer Impacts on Cadmium Availability in Agricultural Soils and Crops. Journal Human and Ecological Risk Assessment 14: 210 – 228.
Guo, H.Y., Liu, T.S., Chu, C.L., Chiang, C.F., 2007. Prediction of heavy metals uptake by different rice species in paddy soils near contaminated sites of Taiwan. In: Proceedings of the International Workshop of ESAFS 8: New Solutions to Soil Pollution and Distribution, Bioavailability and Management of Heavy Metals, October 22-23, 2007, Tsukuba, Japan, pp. 95-116.
Hassan, M.J., Zhu, Z., Ahmad, B., Mahmood, Q., 2006. Influence of Cd toxicity on rice genotypes as affected by Zn, sulfur and nitrogen fertilizers. Caspian Journal of Environmental Sciences 4, 1-8.
He J, Zhu C., Ren Y., Yan Y., Jiang D., 2006. Genotypic variation in grain Cd concentration of lowland rice. J Plant Nutr Soil Sci 169:711–716.
Hochi, Y., Kido, T., Nogawa, K., Kito, H., Shaikh, Z.A., 1995. Dose-response relationship between total Cd intake and prevalence of renal dysfunction using general linear models. Journal of Applied Toxicology 15, 109-116.
Houba V.J.G., Van Der Lee J.J., Novozamsky I., 1997. Soil and Plant Analysis. Part 1: Soil Analysis Procedures. Wageningen University, Wageningen, the Netherlands.

88 Alterra-rapport 1823
Houba, V.J.G., Temminghoff, E.J.M., Gaikhorst, G.A., Van Vark, W., 2000. Soil analysis procedures using 0.01 M calcium chloride as extraction reagent. Commun. Soil Sci. Plant Anal. 31:1299–1396.
Hough R.L., Tye A.M., Crout N.M.J., McGrath S.P., Zhang H., Young S.D., 2005. Evaluating a ‘Free Ion Activity Model’ applied to metal uptake by Lolium perenne L. grown in contaminated soils. Plant Soil 270:1-12.
Hseh, Y.H., Wang, M.K., 1990. Soil survey on the potential contaminated sites of Taichung City, Taiwan, ROC. Project Report of Environmental Protection Bureau of Taichung City, Taiwan, 121 p.
Huang, Y.M., Huang, J.H., 1993. Monitoring studies of heavy metals in potential contaminated soils of Changhwa City. Taiwan, ROC. Project report of Environmental Protection Bureau of Chang Hwa County, Taiwan. (Unpub. mimeograph).
Ingwersen J, Streck T., 2006. Modeling the environmental fate of Cd in a large wastewater irrigation area. J Environ Qual 35:1702-1714.
Japenga, J., Koopmans, G.F., Song, J., Römkens, P.F.A.M., 2007. A feasibility test to estimate the duration of phytoextraction of heavy metals from polluted soils. International Journal of Phytoremediation 9, 115–132.
Kalis, E.J.J., Temminghoff, E.J.M., Visser, A., Van Riemsdijk, W.H., 2007. Metal uptake by Lolium perenne in contaminated soils using a four-step approach. Environmental Toxicology and Chemistry 26, 335-345.
Kashem M.A., Singh B.R., 2004. Transformations in solid phase species of metals as affected by flooding and organic matter. Commun Soil Sci Plant Anal 35:1435–1456.
Kelderman P., Osman A.A., 2007. Effect of redox potential on heavy metal binding forms in polluted canal sediments in Delft (The Netherlands). Wat Res 41:4251–4261.
Khan, S., Q. Cao, Y.M. Zheng, Y.Z. Huang, Y.G. Zhu, 2008. Health risks of heavy metals in contaminated soils and food crops irrigated with wastewater in Beijing, China. Environmental Pollution 152:686-692.
Kikuchi T., Okazaki M., Kimura S.D., Motobayashi T., Baasansuren J., Hattori T., Abe T., 2008. Suppressive effects of magnesium oxide materials on Cd uptake and accumulation into rice grains II: suppression of Cd uptake and accumulation into rice grains due to application of magnesium oxide materials. J Hazard Mat 154:294–299.
Kirkham, M.B., 2006. Cd in plants on polluted soils: Effects of soil factors, hyperaccumulation, and amendments. Geoderma 137, 19-32.
Kobayashi, E., Y. Suwazono, R. Hondab, M. Dochi, M. Nishijo, T. Kido, H. Nakagawa, 2008. Serial changes in urinary cadmium concentrations and degree of renal tubular injury after soil replacement in cadmium-polluted rice paddies. Toxicology Letters 176: 124–130.
Koopmans G.F., Schenkeveld W.D.C., Song J., Luo Y.M., Japenga J., Temminghoff E.J.M., 2008b. Influence of EDDS on metal speciation in soil extracts: measurement and mechanistic multicomponent modeling. Environ Sci Technol 42:1123–1130.

Alterra-rapport 1823 89
Koopmans, G.F., Römkens, P.F.A.M., Fokkema, M.J., Song, J., Luo, Y.M., Japenga, J., Zhao, F.J., 2008. Feasibility of phytoextraction to remediate Cd and Zn contaminated soils. Environmental Pollution 156, 905-914.
Krauss, M., Wolfgang, W., Kobza, J., Zech, W., 2002. Predicting heavy metal transfer from soil to plant: Potential use of Freundlich-type functions. Journal of Plant Nutrition and Soil Science 165, 3-8.
Krishnamurti, G.S.R., McArthur, D.F.E., Wang, M.K., Kozak, L.M., Huang, P.M., 2005. Biogeochemistry of soil Cd and the impact on terrestrial food chain contamination. In: Huang, P.M., Gobran, G.R. (Eds), Biogeochemistry of Trace Elements in the Rhizosphere, Elsevier, pp. 197-257.
Kukier, U., Chaney, R.L., 2002. Growing rice grain with controlled Cd concentrations. Journal of Plant Nutrition 25, 1793-1820.
Lamothe P.J., Fries T.L., Consul J.J., 1986. Evaluation of a microwave oven system for the dissolution of geologic samples. Anal Chem 58:1881–1886
Li P, Wang X.X., Zhang T.L., Zhou D.M., He Y.Q., 2009. Distribution and accumulation of Cu and Cd in soil-rice system as affected by soil amendments. Water Air Soil Pollut, 196:29–40.
Li, Z., Li, L., Pan, G., Chen, J., 2005. Bioavailability of Cd in a soil–rice system in China: Soil type versus genotype effects. Plant and Soil 271, 165-173.
Lin, C.W., 2002. Mapping soil lead and remediation needs in contaminated soils. Environmental Geochemistry and Health 24, 23-33.
Lin, Y.P., Teng, T.P., Chang, T.K., 2002. Multivariate analysis of soil heavy metal pollution and landscape pattern in Changhua county in Taiwan. Landscape and Urban Planning 62, 19-35.
Liu, J., Qian, M., Cai, G., Yang, J., Zhu, Q., 2007. Uptake and translocation of Cd in different rice cultivars and the relation with Cd accumulation in rice grain. Journal of Hazardous Materials 143, 443-447.
Liu, J., Zhu, Q., Zhang, Z., Xu, J., Yang, J., Wong, M.H., 2005. Variations in Cd accumulation among rice cultivars and types and the selection of cultivars for reducing Cd in the diet. Journal of the Science of Food and Agriculture 85, 47-153.
Lofts S., Spurgeon D.J., Svendsen C., Tipping E., 2004. Deriving soil critical limits for Cu, Zn, Cd, and Pb: a method based on free ion concentrations. Environ Sci Technol 38:3623-3631.
Lu LT, Chang I.C., Hsiao T.Y., Yu Y.H., Ma H.W., 2007. Identification of pollution source of Cd in soil. Application of material flow analysis and a case study in Taiwan. Environ Sci Pollut Res 14:49-59.
Ma, Y.B., Uren, N.C., 2006. Effect of aging on the availability of Zn added to a calcareous clay soil. Nutrient Cycling in Agroecosystems 76, 11-18.
McBride M.B., 1994. Environmental chemistry of soils. Oxford University Press. McBride M.B., Barrett K.A., Kim B., Hale B., 2006. Cd sorption in soils 25 years
after amendment with sewage sludge. Soil Sci 171:21-28. McGrath, S.P., Zhao, F.J., Dunham, S.L., Crosland, A.R., Coleman, K., 2000. Long-
term changes in the extractability and bioavailability of Zn and Cd after sludge application. Journal of Environmental Quality 29, 875-883.
McLaughlin, M.J. M. Whatmuff, M. Warne, D. Heemsbergen, G Barry, M. Bell, D. Nash, D. Pritchard. 2006. Field Investigation of Solubility and Food Chain

90 Alterra-rapport 1823
Accumulation of Biosolid-Cadmium Across Diverse Soil Types. Environ. Chem. 3, 428–432.
Meers E., Du Laing G., Unamuno V., Ruttens A., Vangronsveld J., Tack F.M.G., Verloo M.G., 2007. Comparison of cadmium extractability from soils by commonly used single extraction protocols. Geoderma 141:247–259.
Mohr, E.C.J., Van Baren, F.A., Van Schuylenborgh, J., 1972. Tropical Soils: A Conprehensive Study of Their Genesis. Mouton-Ichtiar Baru-Van Hoeve Press, Den Haag, the Netherlands, 481 p.
Muchuweti, M., J.W. Birkett, E. Chinyanga, R. Zvauya, M.D. Scrimshaw and J.N. Lester. 2006. Heavy metal content of vegetables irrigated with mixture of wastewater and sewage sludge in Zimbabwe: implications for human health. Agriculture, Ecosystem and Environment 112 (2006), pp. 41–48.
Naidu, R., Kookana, R.S., Rogers, S., Bolan, N.S., Adriano, D., 2003. Bioavailability of metals in the soil–plant environment and its potential role in risk assessment. In: Naidu, R., Gupta, V.V.S.R., Rogers, S., Kookana, R.S., Bolan, N.S., Adriano, D. (Eds.), Bioavailability, Toxicity, and Risk Relationships in Ecosystems. Science Publishers, Inc., Enfield, New Hampshire, pp. 46-81.
Nelson, J.L., Boawn L.C., Viets F.G .Jr., 1959. A method for assessing Zn status of soils using acid extractable Zn and ‘titratable alkalinity’ values. Soil Sci 88:275-283
NEPAC, 1995. Environmental quality standard for soils. GB 15618. National Environmental Protection Agency of China.
NPF, 2004. Exploration of preservation and utilization of hillside. Research report no. 093-004, National Policy Foundation, Taipei, Taiwan.
Peijnenburg W.J.G.M., Zablotskaja M., Vijver M.G., 2007. Monitoring metals in terrestrial environments within a bioavailability framework and a focus on soil extraction. Ecotoxicol Environ Saf 67:163–179.
Peijnenburg, W.J.G.M., Posthuma L., Zweers P.G.P.C., de Baerselman R., de Groot A.C., Van Veen R.P.M., Jager T., 1999. Prediction of metal bioavailability in Dutch field soils for the oligochaete Enchytraeus crypticus. Ecotoxicol. Environ Saf 43:170–186.
Pueyo M., Lopez-Sanchez J.F., Rauret G., 2004. Assessment of CaCl2, NaNO3, and NH4NO3 extraction procedures for the study of Cd, Cu, Pb and Zn extractability in contaminated soils. Anal Chim Acta 504:217–226.
Qin F., Wen B., Shan X-Q., Xie Y-N., Liu T., Zhang S-Z., Khan S.U., 2006. Mechanisms of competitive adsorption of Pb, Cu, and Cd on peat. Environ Pollut 144:669-680.
Rattan R.K., Datta S.P., Chhonkar P.K., Suribabu K., Singh A.K., 2005. Long-term impact of irrigation with sewage effluents on heavy metal content in soils, crops and groundwater - a case study. Agric Ecosyst Environ 109:310-322.
Rietra, R.P.J.J. and P.F.A.M. Römkens, 2007. Cadmium and zinc in soils and arable crops in the Kempen Area (NL) in 2006: results for schorzonera, carrots and leek (in Dutch). Alterra report no. 1422. Alterra, Wageningen UR, the Netherlands, 39 p.
Römkens P.F.A.M., Groenenberg J.E., Bril J., Vries W., 2004. Derivation of partition equations to calculate heavy metal speciation and solubility in soils. Report no. 305, Alterra, Wageningen, the Netherlands.

Alterra-rapport 1823 91
Römkens, P.F.A.M., H.Y. Guo, C.L. Chu, T.S.Liu, C.F. Chiang, and G.F. Koopmans. 2009a. Prediction of Cadmium uptake by brown rice and derivation of soil-plant transfer models to improve soil protection guidelines. Environmental Pollution 157 (2009) 2435–2444.
Römkens, P.F.A.M., Guo, H.Y., Chu, C.L., Liu, T.S., Chiang, C.F., Koopmans, G.F. 2009b. Characterization of soil metal pools in paddy fields in Taiwan: chemical extraction and solid-solution partitioning. Journal of Soils and Sediments 9:216–228.
Sauvé S, N Cook, W.H. Hendershot M.B. McBride, 1996. Linking plant tissue concentrations and soil copper pools in urban contaminated soils. Environmental Pollution 94 (2) 153-157.
Saxe J.K., Impellitteri C.A., Peijnenburg W.J.G.M., Allen H.E., 2001. Novel model describing trace metal concentrations in the earthworm, Eisenia Andrei. Environ Sci Technol 35: 4522-4529.
Schröder T.J., Hiemstra T., Vink J.P.M., Van Der Zee S.E.A.T.M., 2005. Modeling of the solid-solution partitioning of heavy metals and arsenic in embanked flood plain soils of the rivers Rhine and Meuse. Environ Sci Technol 39:7176-7184.
Shentu, J., Z. He, X. Yang, and T. Li, 2008. Accumulation Properties of Cadmium in a Selected Vegetable-Rotation System of Southeastern China. J. Agric. Food Chem., 2008, 56 (15), 6382-6388
Shimada, M., Piscator, T., Iwata-Nishino, H., 1977. Urine analysis for detection of Cd-induced renal changes, with special reference to β2-microglobulin. Environmental Research 13, 407-424.
Simmons R.W., Noble A.D., Pongsakul P., Sukreeyapongse O., Chinabut N., 2008. Analysis of field-moist Cd contaminated paddy soils during rice grain fill allows reliable prediction of grain Cd levels. Plant Soil 302:125–137.
Simmons R.W., Pongsakul P., Saiyasitpanich D., Klinphoklap S., 2005. Elevated levels of Cd and Zn in paddy soils and elevated levels of Cd in rice grain downstream of a Zn mineralized area in Thailand: implications for public health. Environ Geochem Health 27:501-511.
Singhal J.P., Gupta G.K., 1978. Reactions of zinc with acid and base saturated dickites. Clay Clay Miner 26:365-371.
Sun, H., Zhang, T.L., Sun, B., 2001. Assessment of pollution of heavy metals on paddy field with sewage irrigation in Guixi, Jiangxi province. Agro-environmental Protection 20, 405-407. (In Chinese, with English abstract).
Thakali, S., H. Allen, D. M Di Toro, A.A. Ponizovsky, C. R. Rooney, F.J. Zhao and S. P. McGrath, 2006. A terrestrial Biotic Ligand Model. 1 Development and Application to Cu and Ni Toxicities to Barley Root Elongation in Soils. Environmental Science and Technology 40, 7085-7093.
Thornton, I., Farago, M.E., Thums, C.R., Parrish, R.R., McGill, R.A.R., Breward, N., Fortey, N.J., Simpson, P., Young, S.D., Tye, A.M., Crout, N.M.J., Hough, R.L., Watt, J., 2008. Urban geochemistry: Research strategies to assist risk assessment and remediation of brownfield sites in urban areas. Environmental Geochemistry and Health 30, 565–576.
Tipping E., Lawlor A.J., Lofts S., Shotbolt L., 2006. Simulating the long-term chemistry of an upland UK catchment: heavy metals. Environ Pollut 141:139-150.

92 Alterra-rapport 1823
Tipping E., Rieuwerts J., Pan G., Ashmore MR, Lofts S, Hill MTR, Farago ME, Thornton I., 2003. The solid–solution partitioning of heavy metals (Cu, Zn, Cd, Pb) in upland soils of England and Wales. Environ Pollut 125:213–225.
Tiwari, R.C., Kumar, B.M., 1982. A suitable extractant for assessing plant-available copper in different soils (peaty, red and alluvial). Plant and Soil 68, 131-134.
Tsukahara T., Ezaki T., Moriguchi J., Furuki K., Shimbo S., Matsuda-Inoguchi N., Ikeda M., 2002. Rice as the most influential source of Cd intake among general Japanese population. Sci Total Environ 305:41-51.
USDA, 1996. Soil Survey Laboratory Methods Manual. Soil Survey Investigations Report no. 42, USDA, Washington, D.C., US.
US-EPA, 2002. Methods for the determination of total organic carbon (TOC) in soils and sediments. NCEA-C-1282 EMASC-001, US-EPA, Las Vegas, US.
Wang, G.Q., Koopmans, G.F., Song, J., Temminghoff, E.J.M., Luo, Y.M., Zhao, Q.G., Japenga, J., 2007. Mobilization of heavy metals from contaminated paddy soil by EDDS, EDTA, and elemental sulfur. Environmental Geochemistry and Health 29, 221-235.
Watanabe T., Zhang Z.W., Moon C.S., Shimbo S., Nakatsuka H., Matsuda-Inoguchi N., Higashikawa K., Ikeda M., 2000. Cadmium exposure of women in general populations in Japan during 1991-1997 compared with 1977-1981. Int. Arch. Occup. Environ. Health 73:26-34.
Weng L., Temminghoff E.J.M., Van Riemsdijk W.H., 2001. Contribution of individual sorbents to the control of heavy metal activity in sandy soil. Environ Sci Technol 35:4436 -4443.
Xu R., 2000. Particle characterization: light scattering methods. Particle Technology Series Vol 13, Kluwer Academic Publishers, Dordrecht, the Netherlands.
Yang, S.Y., Chang, W.L., 2005. Use of finite mixture distribution theory to determine the criteria of Cd concentrations in Taiwan farmland soils. Soil Science 170, 55-62.
Yu, H., Wang, J., Fang, W., Yuan, J., Yang, Z., 2006. Cd accumulation in different rice cultivars and screening for pollution-safe cultivars of rice. Science of the Total Environment 370, 302-309.
Zheng, N., Q. Wang, X. Zhang, D. Zheng, Z. Zhang, S. Zhang, 2007. Population health risk due to dietary intake of heavy metals in the industrial area of Huludao city, China Science of the Total Environment 387 (2007) 96–104.
Zhou, Q., Wang, X., Liang, R., Wu, Y., 2003. Effects of Cd and mixed heavy metals on rice growth in Liaoning, China. Soil and Sediment Contamination 12, 851-864.
Zhu, H.P., Zhang, L.J., Wu, W.G., 1992. A study on heavy metal content of soil in Taiwan. In: Proceedings of 3rd Workshop of Soil Pollution and Prevention, Taiwan, pp 1-14. (in Chinese).

Alterra-rapport 1823 93
Appendix 1 Overview of model coefficients used to calculate Cd in brown rice from soil data (soil model)
Table A1.1 Model coefficients of the soil-plant model to predict Cd levels in the grain of brown rice using Aqua Regia, 0.43 N HNO3 or 0.1 M HCl.
AR number Jap/Ind. Constant AR pH CEC Tainung No.70 1 J 1.37 0.76 -0.25 -0.53 Taiken No.8 2 J 0.63 0.75 -0.13 -0.42 Tainung No.72 3 J 0.92 0.82 -0.20 -0.43 Kaohsiung No.143 4 J 0.89 0.84 -0.23 -0.26 Taitung No.30 5 J 1.32 0.77 -0.24 -0.57 Tainung Sen No.20 6 I 1.33 0.76 -0.21 -0.38 Tainung No.71 7 J 0.54 0.84 -0.14 -0.32 Tainung No.67 8 J 0.94 0.78 -0.20 -0.46 Kaohsiung Sen Yu No.1151 9 I 0.95 0.68 -0.18 -0.22 Taichung Sen Waxy No.1 10 I 1.34 0.86 -0.23 -0.23 Taichung Sen No.10 11 I 0.97 0.96 -0.17 -0.32 Kaohsiung No.144 12 J 0.76 0.81 -0.15 -0.54 Japonica – all cultivars J 0.93 0.80 -0.19 -0.44 Indica – all cultivars I 1.17 0.83 -0.20 -0.30
Table A1.2 Model coefficients of the soil-plant model to predict Cd levels in the grain of brown rice using 0.43 N HNO3
0.43 N HNO3 Constant HNO3 pH CEC Tainung No.70 1 J 1.44 0.71 -0.24 -0.52 Taiken No.8 2 J 0.73 0.70 -0.13 -0.42 Tainung No.72 3 J 1.06 0.75 -0.22 -0.38 Kaohsiung No.143 4 J 0.94 0.79 -0.22 -0.26 Taitung No.30 5 J 1.36 0.74 -0.22 -0.60 Tainung Sen No.20 6 I 1.32 0.72 -0.18 -0.43 Tainung No.71 7 J 0.63 0.79 -0.13 -0.37 Tainung No.67 8 J 0.85 0.72 -0.17 -0.41 Kaohsiung Sen Yu No.1151 9 I 0.95 0.62 -0.15 -0.24 Taichung Sen Waxy No.1 10 I 1.33 0.78 -0.19 -0.25 Taichung Sen No.10 11 I 1.11 0.86 -0.16 -0.31 Kaohsiung No.144 12 J 0.76 0.74 -0.13 -0.53 Japonica – all cultivars J 0.98 0.74 -0.18 -0.43 Indica – all cultivars I 1.20 0.76 -0.17 -0.32

94 Alterra-rapport 1823
Table A1.3 Model coefficients of the soil-plant model to predict Cd levels in the grain of brown rice using 0.1 M HCl.
0.1 M HCl Constant HCl pH CEC Tainung No.70 1 J 1.38 0.67 -0.23 -0.50 Taiken No.8 2 J 0.75 0.70 -0.12 -0.46 Tainung No.72 3 J 1.04 0.74 -0.20 -0.39 Kaohsiung No.143 4 J 0.94 0.79 -0.21 -0.30 Taitung No.30 5 J 1.44 0.74 -0.23 -0.63 Tainung Sen No.20 6 I 1.44 0.70 -0.20 -0.42 Tainung No.71 7 J 0.73 0.79 -0.13 -0.41 Tainung No.67 8 J 0.92 0.72 -0.17 -0.46 Kaohsiung Sen Yu No.1151 9 I 0.98 0.61 -0.15 -0.27 Taichung Sen Waxy No.1 10 I 1.36 0.79 -0.20 -0.26 Taichung Sen No.10 11 I 1.11 0.86 -0.16 -0.33 Kaohsiung No.144 12 J 0.86 0.71 -0.13 -0.58 Japonica – all cultivars J 1.01 0.73 -0.18 -0.46 Indica – all cultivars I 1.25 0.75 -0.18 -0.33

Alterra-rapport 1823 95
Appendix 2 Look-up tables for individual cultivars
Cultivar 1 Cultivar 2
Cd-soil pH range Cd-soil pH range0.0 5 5.2 5.4 5.6 5.8 6 6.2 6.4 6.6 6.8 7 0.0 5 5.2 5.4 5.6 5.8 6 6.2 6.4 6.6 6.8 71.0 0.28 0.25 0.22 0.20 0.18 0.16 0.14 0.13 0.11 0.10 0.09 1.0 0.26 0.24 0.23 0.22 0.20 0.19 0.18 0.17 0.16 0.15 0.141.4 0.36 0.32 0.29 0.26 0.23 0.20 0.18 0.16 0.14 0.13 0.11 1.4 0.33 0.31 0.30 0.28 0.26 0.25 0.23 0.22 0.20 0.19 0.181.8 0.44 0.39 0.35 0.31 0.28 0.25 0.22 0.20 0.17 0.16 0.14 1.8 0.40 0.38 0.36 0.34 0.32 0.30 0.28 0.26 0.25 0.23 0.222.2 0.51 0.45 0.40 0.36 0.32 0.29 0.26 0.23 0.20 0.18 0.16 2.2 0.47 0.44 0.42 0.39 0.37 0.35 0.33 0.31 0.29 0.27 0.252.6 0.58 0.51 0.46 0.41 0.37 0.33 0.29 0.26 0.23 0.21 0.18 2.6 0.53 0.50 0.47 0.44 0.42 0.39 0.37 0.35 0.33 0.31 0.293.0 0.64 0.57 0.51 0.46 0.41 0.36 0.32 0.29 0.26 0.23 0.21 3.0 0.59 0.56 0.53 0.49 0.47 0.44 0.41 0.39 0.36 0.34 0.323.4 0.71 0.63 0.56 0.50 0.45 0.40 0.36 0.32 0.28 0.25 0.23 3.4 0.65 0.61 0.58 0.54 0.51 0.48 0.45 0.42 0.40 0.38 0.353.8 0.77 0.69 0.61 0.55 0.49 0.44 0.39 0.35 0.31 0.28 0.25 3.8 0.71 0.67 0.63 0.59 0.56 0.52 0.49 0.46 0.43 0.41 0.384.2 0.83 0.74 0.66 0.59 0.53 0.47 0.42 0.37 0.33 0.30 0.26 4.2 0.77 0.72 0.68 0.64 0.60 0.56 0.53 0.50 0.47 0.44 0.414.6 0.89 0.80 0.71 0.63 0.56 0.50 0.45 0.40 0.36 0.32 0.28 4.6 0.82 0.77 0.73 0.68 0.64 0.60 0.57 0.53 0.50 0.47 0.445.0 0.95 0.85 0.76 0.67 0.60 0.54 0.48 0.43 0.38 0.34 0.30 5.0 0.87 0.82 0.77 0.73 0.68 0.64 0.60 0.57 0.53 0.50 0.47
Cultivar 3 Cultivar 4
Cd-soil pH range Cd-soil pH range0.0 5.0 5.2 5.4 5.6 5.8 6.0 6.2 6.4 6.6 6.8 7.0 0.0 5.0 5.2 5.4 5.6 5.8 6.0 6.2 6.4 6.6 6.8 7.01.0 0.2 0.2 0.2 0.2 0.2 0.1 0.1 0.1 0.1 0.1 0.1 1.0 0.3 0.2 0.2 0.2 0.2 0.2 0.1 0.1 0.1 0.1 0.11.4 0.3 0.3 0.2 0.2 0.2 0.2 0.2 0.2 0.1 0.1 0.1 1.4 0.3 0.3 0.3 0.2 0.2 0.2 0.2 0.2 0.1 0.1 0.11.8 0.4 0.3 0.3 0.3 0.3 0.2 0.2 0.2 0.2 0.2 0.1 1.8 0.4 0.4 0.3 0.3 0.3 0.2 0.2 0.2 0.2 0.2 0.12.2 0.4 0.4 0.4 0.3 0.3 0.3 0.2 0.2 0.2 0.2 0.2 2.2 0.5 0.4 0.4 0.4 0.3 0.3 0.3 0.2 0.2 0.2 0.22.6 0.5 0.5 0.4 0.4 0.3 0.3 0.3 0.3 0.2 0.2 0.2 2.6 0.6 0.5 0.5 0.4 0.4 0.3 0.3 0.3 0.2 0.2 0.23.0 0.6 0.5 0.5 0.4 0.4 0.3 0.3 0.3 0.3 0.2 0.2 3.0 0.6 0.6 0.5 0.5 0.4 0.4 0.3 0.3 0.3 0.2 0.23.4 0.6 0.6 0.5 0.5 0.4 0.4 0.4 0.3 0.3 0.3 0.2 3.4 0.7 0.6 0.6 0.5 0.5 0.4 0.4 0.3 0.3 0.3 0.23.8 0.7 0.6 0.6 0.5 0.5 0.4 0.4 0.4 0.3 0.3 0.3 3.8 0.8 0.7 0.6 0.6 0.5 0.5 0.4 0.4 0.3 0.3 0.34.2 0.7 0.7 0.6 0.6 0.5 0.5 0.4 0.4 0.3 0.3 0.3 4.2 0.9 0.8 0.7 0.6 0.6 0.5 0.5 0.4 0.4 0.3 0.34.6 0.8 0.7 0.7 0.6 0.5 0.5 0.5 0.4 0.4 0.3 0.3 4.6 0.9 0.8 0.7 0.7 0.6 0.5 0.5 0.4 0.4 0.4 0.35.0 0.8 0.8 0.7 0.6 0.6 0.5 0.5 0.4 0.4 0.4 0.3 5.0 1.0 0.9 0.8 0.7 0.6 0.6 0.5 0.5 0.4 0.4 0.3
Cultivar 5 Cultivar 6
Cd-soil pH range Cd-soil pH range0.0 5.0 5.2 5.4 5.6 5.8 6.0 6.2 6.4 6.6 6.8 7.0 0.0 5.0 5.2 5.4 5.6 5.8 6.0 6.2 6.4 6.6 6.8 7.01.0 0.23 0.21 0.19 0.17 0.15 0.13 0.12 0.11 0.10 0.09 0.08 1.0 0.60 0.55 0.49 0.45 0.41 0.37 0.33 0.30 0.27 0.25 0.231.4 0.30 0.27 0.24 0.22 0.19 0.17 0.16 0.14 0.12 0.11 0.10 1.4 0.78 0.70 0.64 0.58 0.52 0.48 0.43 0.39 0.35 0.32 0.291.8 0.37 0.33 0.29 0.26 0.24 0.21 0.19 0.17 0.15 0.14 0.12 1.8 0.94 0.85 0.77 0.70 0.63 0.57 0.52 0.47 0.43 0.39 0.352.2 0.43 0.38 0.34 0.31 0.28 0.25 0.22 0.20 0.18 0.16 0.14 2.2 1.09 0.99 0.90 0.81 0.74 0.67 0.61 0.55 0.50 0.45 0.412.6 0.49 0.44 0.39 0.35 0.31 0.28 0.25 0.22 0.20 0.18 0.16 2.6 1.24 1.12 1.02 0.92 0.84 0.76 0.69 0.62 0.57 0.51 0.463.0 0.55 0.49 0.44 0.39 0.35 0.31 0.28 0.25 0.22 0.20 0.18 3.0 1.38 1.25 1.13 1.03 0.93 0.85 0.77 0.69 0.63 0.57 0.523.4 0.60 0.54 0.48 0.43 0.39 0.35 0.31 0.28 0.25 0.22 0.20 3.4 1.52 1.38 1.25 1.13 1.02 0.93 0.84 0.76 0.69 0.63 0.573.8 0.66 0.59 0.53 0.47 0.42 0.38 0.34 0.30 0.27 0.24 0.22 3.8 1.65 1.50 1.36 1.23 1.11 1.01 0.92 0.83 0.75 0.68 0.624.2 0.71 0.63 0.57 0.51 0.45 0.41 0.36 0.33 0.29 0.26 0.23 4.2 1.78 1.61 1.46 1.33 1.20 1.09 0.99 0.90 0.81 0.74 0.674.6 0.76 0.68 0.61 0.54 0.49 0.44 0.39 0.35 0.31 0.28 0.25 4.6 1.91 1.73 1.57 1.42 1.29 1.17 1.06 0.96 0.87 0.79 0.715.0 0.81 0.73 0.65 0.58 0.52 0.47 0.42 0.37 0.33 0.30 0.27 5.0 2.03 1.84 1.67 1.51 1.37 1.24 1.13 1.02 0.93 0.84 0.76
Cultivar 7 Cultivar 8
Cd-soil pH range Cd-soil pH range0.0 5.0 5.2 5.4 5.6 5.8 6.0 6.2 6.4 6.6 6.8 7.0 0.0 5.0 5.2 5.4 5.6 5.8 6.0 6.2 6.4 6.6 6.8 7.01.0 0.3 0.2 0.2 0.2 0.2 0.2 0.2 0.2 0.2 0.1 0.1 1.0 0.2 0.2 0.2 0.2 0.2 0.1 0.1 0.1 0.1 0.1 0.11.4 0.3 0.3 0.3 0.3 0.3 0.3 0.2 0.2 0.2 0.2 0.2 1.4 0.3 0.3 0.2 0.2 0.2 0.2 0.2 0.1 0.1 0.1 0.11.8 0.4 0.4 0.4 0.4 0.3 0.3 0.3 0.3 0.3 0.2 0.2 1.8 0.3 0.3 0.3 0.3 0.2 0.2 0.2 0.2 0.2 0.2 0.12.2 0.5 0.5 0.4 0.4 0.4 0.4 0.3 0.3 0.3 0.3 0.3 2.2 0.4 0.4 0.3 0.3 0.3 0.3 0.2 0.2 0.2 0.2 0.22.6 0.6 0.5 0.5 0.5 0.5 0.4 0.4 0.4 0.3 0.3 0.3 2.6 0.5 0.4 0.4 0.3 0.3 0.3 0.3 0.2 0.2 0.2 0.23.0 0.7 0.6 0.6 0.5 0.5 0.5 0.4 0.4 0.4 0.4 0.3 3.0 0.5 0.5 0.4 0.4 0.4 0.3 0.3 0.3 0.2 0.2 0.23.4 0.7 0.7 0.6 0.6 0.6 0.5 0.5 0.5 0.4 0.4 0.4 3.4 0.6 0.5 0.5 0.4 0.4 0.4 0.3 0.3 0.3 0.2 0.23.8 0.8 0.8 0.7 0.7 0.6 0.6 0.5 0.5 0.5 0.5 0.4 3.8 0.6 0.6 0.5 0.5 0.4 0.4 0.4 0.3 0.3 0.3 0.24.2 0.9 0.8 0.8 0.7 0.7 0.6 0.6 0.6 0.5 0.5 0.5 4.2 0.7 0.6 0.6 0.5 0.5 0.4 0.4 0.4 0.3 0.3 0.34.6 0.9 0.9 0.8 0.8 0.7 0.7 0.6 0.6 0.6 0.5 0.5 4.6 0.7 0.7 0.6 0.5 0.5 0.5 0.4 0.4 0.3 0.3 0.35.0 1.0 1.0 0.9 0.8 0.8 0.7 0.7 0.6 0.6 0.6 0.5 5.0 0.8 0.7 0.6 0.6 0.5 0.5 0.4 0.4 0.4 0.3 0.3
Cultivar 9 Cultivar 10
Cd-soil pH range Cd-soil pH range0.0 5.0 5.2 5.4 5.6 5.8 6.0 6.2 6.4 6.6 6.8 7.0 0.0 5.0 5.2 5.4 5.6 5.8 6.0 6.2 6.4 6.6 6.8 7.01.0 0.6 0.6 0.5 0.5 0.4 0.4 0.4 0.3 0.3 0.3 0.3 1.0 0.8 0.7 0.7 0.6 0.5 0.5 0.4 0.4 0.4 0.3 0.31.4 0.8 0.7 0.6 0.6 0.5 0.5 0.5 0.4 0.4 0.4 0.3 1.4 1.1 1.0 0.9 0.8 0.7 0.6 0.6 0.5 0.5 0.4 0.41.8 0.9 0.8 0.8 0.7 0.7 0.6 0.6 0.5 0.5 0.4 0.4 1.8 1.3 1.2 1.1 1.0 0.9 0.8 0.7 0.6 0.6 0.5 0.52.2 1.0 1.0 0.9 0.8 0.7 0.7 0.6 0.6 0.5 0.5 0.5 2.2 1.6 1.4 1.3 1.2 1.0 0.9 0.8 0.8 0.7 0.6 0.62.6 1.2 1.1 1.0 0.9 0.8 0.8 0.7 0.7 0.6 0.6 0.5 2.6 1.8 1.6 1.5 1.3 1.2 1.1 1.0 0.9 0.8 0.7 0.63.0 1.3 1.2 1.1 1.0 0.9 0.8 0.8 0.7 0.7 0.6 0.6 3.0 2.1 1.9 1.7 1.5 1.4 1.2 1.1 1.0 0.9 0.8 0.73.4 1.4 1.3 1.2 1.1 1.0 0.9 0.9 0.8 0.7 0.7 0.6 3.4 2.3 2.1 1.9 1.7 1.5 1.4 1.2 1.1 1.0 0.9 0.83.8 1.5 1.4 1.3 1.2 1.1 1.0 0.9 0.8 0.8 0.7 0.7 3.8 2.5 2.3 2.1 1.9 1.7 1.5 1.4 1.2 1.1 1.0 0.94.2 1.6 1.5 1.4 1.3 1.2 1.1 1.0 0.9 0.8 0.8 0.7 4.2 2.8 2.5 2.2 2.0 1.8 1.6 1.5 1.3 1.2 1.1 1.04.6 1.7 1.6 1.4 1.3 1.2 1.1 1.0 1.0 0.9 0.8 0.8 4.6 3.0 2.7 2.4 2.2 2.0 1.8 1.6 1.4 1.3 1.2 1.15.0 1.8 1.7 1.5 1.4 1.3 1.2 1.1 1.0 0.9 0.9 0.8 5.0 3.2 2.9 2.6 2.3 2.1 1.9 1.7 1.5 1.4 1.3 1.1
Cultivar 11 Cultivar 12
Cd-soil pH range Cd-soil pH range0.0 5.0 5.2 5.4 5.6 5.8 6.0 6.2 6.4 6.6 6.8 7.0 0.0 5.0 5.2 5.4 5.6 5.8 6.0 6.2 6.4 6.6 6.8 7.01.0 0.5 0.5 0.5 0.4 0.4 0.4 0.3 0.3 0.3 0.3 0.3 1.0 0.2 0.2 0.2 0.2 0.2 0.1 0.1 0.1 0.1 0.1 0.11.4 0.7 0.7 0.6 0.6 0.6 0.5 0.5 0.4 0.4 0.4 0.4 1.4 0.3 0.2 0.2 0.2 0.2 0.2 0.2 0.2 0.2 0.1 0.11.8 1.0 0.9 0.8 0.8 0.7 0.7 0.6 0.6 0.5 0.5 0.4 1.8 0.3 0.3 0.3 0.3 0.2 0.2 0.2 0.2 0.2 0.2 0.22.2 1.2 1.1 1.0 0.9 0.9 0.8 0.7 0.7 0.6 0.6 0.5 2.2 0.4 0.4 0.3 0.3 0.3 0.3 0.3 0.2 0.2 0.2 0.22.6 1.4 1.3 1.2 1.1 1.0 0.9 0.9 0.8 0.7 0.7 0.6 2.6 0.4 0.4 0.4 0.4 0.3 0.3 0.3 0.3 0.3 0.2 0.23.0 1.6 1.4 1.3 1.2 1.1 1.1 1.0 0.9 0.8 0.8 0.7 3.0 0.5 0.5 0.4 0.4 0.4 0.3 0.3 0.3 0.3 0.3 0.23.4 1.8 1.6 1.5 1.4 1.3 1.2 1.1 1.0 1.0 0.9 0.8 3.4 0.5 0.5 0.5 0.4 0.4 0.4 0.4 0.3 0.3 0.3 0.33.8 1.9 1.8 1.7 1.6 1.4 1.3 1.2 1.1 1.1 1.0 0.9 3.8 0.6 0.6 0.5 0.5 0.5 0.4 0.4 0.4 0.3 0.3 0.34.2 2.1 2.0 1.8 1.7 1.6 1.5 1.4 1.3 1.2 1.1 1.0 4.2 0.6 0.6 0.6 0.5 0.5 0.5 0.4 0.4 0.4 0.3 0.34.6 2.3 2.2 2.0 1.9 1.7 1.6 1.5 1.4 1.3 1.2 1.1 4.6 0.7 0.6 0.6 0.6 0.5 0.5 0.5 0.4 0.4 0.4 0.35.0 2.5 2.3 2.2 2.0 1.9 1.7 1.6 1.5 1.4 1.3 1.2 5.0 0.7 0.7 0.6 0.6 0.6 0.5 0.5 0.5 0.4 0.4 0.4 Figure A2.1 Examples of look-up tables for individual cultivars
Note: All tables are constructed using a CEC of 20 cmol+kg-1, a range in soil pH from 5 to 7, Cd-soil (Aqua Regia) ranging from 1 to 5 mg kg-1.


Alterra-rapport 1823 97
Appendix 3 Overview of soil data per site
Table A3.1 General Soil data
pH H2O pH 0.01 M CaCl2 CEC (cmol+ kg-1) OS (%)
Site mean min max media
n mean min max media
n mean min max media
n mean min max media
n CH6 5.0 4.2 6.9 5.0 4.7 3.8 6.8 4.7 16.9 5.0 19.8 17.0 6.7 2.5 8.3 6.7 CH7 6.3 5.0 7.5 6.3 6.1 4.7 7.2 6.1 11.1 5.7 19.7 11.0 4.6 2.2 6.4 4.6 CH8 6.5 5.2 7.1 6.5 6.3 4.6 6.9 6.4 19.0 4.0 21.6 19.3 6.3 1.5 7.2 6.3 HC3 5.7 4.8 6.2 5.7 5.4 4.4 5.8 5.4 5.5 2.8 9.3 5.6 2.7 2.0 4.9 2.7 HC4 5.9 5.2 6.5 5.9 5.6 4.7 5.9 5.6 8.7 5.0 13.2 8.9 4.5 3.0 5.7 4.5 HC5 5.5 4.7 6.0 5.5 5.1 4.0 5.7 5.1 6.9 3.0 10.9 7.1 3.5 2.3 4.4 3.5 HM3 6.3 5.0 7.0 6.4 6.2 4.9 7.0 6.3 19.1 5.6 22.5 19.3 7.5 2.9 8.6 7.5 HM4 6.1 4.7 6.8 6.2 5.9 4.5 6.6 6.0 16.2 2.6 25.1 16.3 6.2 4.8 7.9 6.2 HM5 5.6 4.5 6.8 5.7 5.3 4.2 6.4 5.4 15.1 6.2 18.5 15.1 5.9 4.4 7.6 5.8 LK1 5.7 4.7 6.8 5.7 5.3 4.4 6.6 5.3 5.9 2.6 19.4 5.7 2.7 1.3 7.3 2.7 LK2 6.1 5.2 6.6 6.1 5.8 4.8 6.3 5.8 10.6 4.9 18.9 10.7 4.4 2.3 6.6 4.3 PDA 5.7 4.8 6.1 5.7 5.3 4.4 5.9 5.4 13.1 8.5 19.7 13.2 7.1 6.1 8.3 7.1 PDB 5.5 4.5 6.2 5.6 5.2 4.1 5.8 5.2 14.4 6.9 24.2 14.5 7.5 6.4 9.1 7.5 PDC 5.6 4.8 6.1 5.7 5.2 4.1 5.5 5.2 13.3 6.7 16.1 13.7 6.8 5.8 8.0 6.8 PDD 5.4 4.6 5.7 5.4 5.0 3.9 5.3 5.0 14.6 10.7 18.6 14.7 7.8 6.8 8.9 7.8 PDE 5.5 4.8 5.8 5.6 5.1 4.3 5.4 5.2 14.1 8.3 18.8 14.3 7.5 6.3 9.0 7.5 PDF 5.6 4.7 5.9 5.6 5.2 4.3 5.5 5.3 15.2 7.2 20.4 15.3 7.8 6.5 8.9 7.7 PDG 5.4 4.6 5.8 5.5 5.1 4.1 5.4 5.1 14.9 9.6 20.9 15.3 7.7 6.8 8.5 7.7 PDH 5.3 4.7 5.7 5.3 5.0 4.3 5.4 5.0 16.4 8.8 20.9 16.8 8.7 7.4 10.2 8.7

98 Alterra-rapport 1823
Table A3.2 Cadmium
Extract (all in mg kg-1 dm)
Cd Aqua Regia Cd 0.43 M HNO3 Cd 0.1 M HCl Cd 0.05 M EDTA Cd 0.01 M CaCl2
Site mean min max med mean min max med mean min max med mean min max med mean min max med
CH6 0.6 0.3 1.2 0.5 0.4 0.2 1.1 0.3 0.4 0.1 1.0 0.3 0.3 0.2 1.0 0.3 0.069 0.003 0.186 0.065
CH7 0.4 0.2 1.4 0.4 0.2 0.1 0.5 0.2 0.2 <0.1 0.4 0.2 0.2 0.1 0.5 0.2 0.011 0.001 0.093 0.008
CH8 0.4 0.2 2.1 0.4 0.2 0.1 0.6 0.2 0.2 0.1 0.6 0.2 0.2 0.1 0.5 0.2 0.006 0.001 0.098 0.005
HC3 2.7 0.2 6.8 2.6 2.3 0.1 5.0 2.2 2.2 0.1 5.3 2.1 1.8 0.1 3.3 1.7 0.446 0.033 0.989 0.428
HC4 0.4 0.2 2.0 0.4 0.3 0.1 1.9 0.3 0.3 0.2 1.9 0.3 0.3 0.2 1.3 0.3 0.046 0.007 0.414 0.041
HC5 0.2 0.1 0.5 0.2 0.1 0.1 0.3 0.1 0.1 0.1 0.3 0.1 0.1 0.1 0.3 0.1 0.035 0.012 0.087 0.033
HM3 0.7 0.3 2.1 0.6 0.5 0.3 1.6 0.4 0.5 0.2 1.5 0.4 0.5 0.2 1.6 0.4 0.012 0.001 0.061 0.008
HM4 1.1 0.3 2.9 0.9 0.8 0.2 2.0 0.7 0.8 0.1 1.9 0.6 0.7 0.2 1.9 0.6 0.024 0.004 0.088 0.023
HM5 0.5 0.2 2.5 0.5 0.3 0.1 1.7 0.3 0.3 <0.1 1.7 0.3 0.3 0.1 2.0 0.2 0.033 0.005 0.083 0.030
LK1 0.3 0.1 0.8 0.3 0.2 0.1 0.6 0.2 0.2 <0.1 0.5 0.2 0.2 0.1 0.6 0.2 0.031 0.002 0.100 0.031
LK2 0.3 0.1 1.7 0.3 0.2 0.1 1.4 0.2 0.2 <0.1 1.3 0.1 0.2 0.1 1.3 0.2 0.010 0.001 0.073 0.008
PDA 14.1 5.3 20.9 14.0 11.7 4.6 17.5 11.5 11.2 4.4 16.8 11.1 8.5 3.9 12.5 8.5 0.940 0.206 1.996 1.018
PDB 14.8 6.2 29.4 13.8 11.9 5.8 19.9 11.3 11.7 5.7 25.7 11.1 8.3 3.7 16.4 8.1 0.896 0.211 2.181 0.876
PDC 5.9 4.5 14.0 5.9 5.2 3.5 11.9 5.2 4.8 3.7 13.6 4.7 4.2 2.3 8.4 4.2 0.586 0.192 0.923 0.606
PDD 5.9 4.0 21.6 5.6 5.0 3.1 15.2 4.8 4.7 3.2 14.5 4.4 3.8 2.7 12.9 3.7 0.549 0.161 1.482 0.560
PDE 11.6 6.6 23.2 10.3 10.0 4.5 20.6 8.8 9.4 4.1 19.0 8.5 7.7 3.7 15.6 7.0 1.325 0.392 3.232 1.254
PDF 4.6 3.7 5.7 4.6 3.9 2.7 5.1 3.7 3.6 2.7 4.6 3.6 3.1 1.8 4.0 3.0 0.327 0.071 1.253 0.303
PDG 4.2 3.4 5.5 4.2 3.5 2.5 4.5 3.5 3.4 2.5 4.7 3.4 2.9 1.0 3.9 2.9 0.430 0.136 1.263 0.420
PDH 6.3 3.3 12.6 5.7 5.2 2.7 11.0 4.7 5.0 2.3 12.2 4.5 4.1 1.5 7.9 3.7 0.488 0.114 1.378 0.472

Alterra-rapport 1823 99
Table A3.3 Zinc
Extract (all in mg kg-1 dm)
Zn Aqua Regia Zn 0.43 M HNO3 Zn 0.1 M HCl Zn 0.05 M EDTA Zn 0.01 M CaCl2
Site mean min max med mean min max med mean min max med mean min max med mean min max med
CH6 431.9 274.6 964.5 420.5 115.8 48.2 344.6 112.2 104.5 31.2 247.0 102.3 99.6 24.6 328.0 95.7 24.6 0.05 54.7 22.6
CH7 461.2 195.3 995.5 364.8 115.4 40.7 335.2 81.0 99.5 31.3 300.3 70.7 86.9 20.7 255.1 63.8 4.8 0.01 31.9 2.3
CH8 287.5 190.6 795.0 269.6 52.0 36.0 254.3 49.5 41.3 30.7 227.2 39.2 30.0 20.2 180.0 27.8 0.2 0.01 6.9 0.2
HC3 95.5 63.1 185.5 92.1 25.8 18.6 46.8 24.5 22.2 11.9 43.4 21.9 19.1 10.7 39.0 18.5 4.5 2.42 10.6 4.3
HC4 198.7 88.7 296.5 194.3 48.0 24.3 81.0 46.6 41.6 22.2 76.8 40.1 37.8 15.9 67.0 36.9 5.6 1.49 11.5 5.2
HC5 116.0 72.2 229.6 105.2 29.7 17.3 76.2 27.0 25.9 15.8 53.4 23.6 23.9 13.8 51.6 21.6 8.0 1.81 32.5 7.2
HM3 358.9 220.0 970.3 317.8 77.8 43.3 447.5 68.3 64.5 34.8 344.8 56.8 54.6 29.9 285.9 47.0 1.0 0.02 38.3 0.3
HM4 438.6 217.9 1164.1 372.1 94.8 38.6 278.1 79.2 81.4 33.1 225.7 68.0 69.5 26.5 189.7 58.8 1.6 0.14 38.9 1.2
HM5 328.5 230.3 1052.4 294.1 82.3 41.7 249.1 77.0 72.6 40.1 200.7 68.3 66.0 30.9 186.2 61.7 7.1 0.20 16.3 6.6
LK1 511.3 179.8 1225.2 367.8 150.6 34.3 574.2 86.2 134.6 31.1 537.3 76.9 112.5 27.7 383.6 69.2 16.8 0.12 96.9 14.0
LK2 302.9 156.9 1189.1 253.8 77.2 35.6 396.6 61.2 68.8 28.0 348.3 53.1 63.1 27.5 304.6 50.0 3.2 0.21 30.5 2.4
PDA 419.2 204.6 555.3 418.6 193.9 79.8 327.2 191.8 162.9 70.4 308.0 161.1 147.3 61.5 223.7 146.4 17.8 4.96 36.7 18.4
PDB 306.4 179.3 484.6 292.3 119.3 54.7 314.3 114.3 102.4 61.5 211.3 98.5 87.0 45.3 169.9 83.8 10.2 3.17 22.8 9.9
PDC 221.8 149.3 297.1 223.0 87.2 61.0 118.5 87.0 71.9 46.6 101.1 72.0 68.6 39.8 86.4 68.4 7.9 1.22 13.2 8.0
PDD 172.0 132.5 390.1 168.7 62.6 43.2 147.3 61.0 52.9 22.3 134.5 50.7 47.7 26.6 127.5 46.1 5.9 1.63 13.4 6.2
PDE 263.2 181.0 420.6 240.3 97.9 48.7 175.6 90.2 81.3 43.4 137.9 76.2 73.3 40.1 134.9 68.3 10.1 2.35 21.6 9.8
PDF 151.4 135.5 178.5 150.9 49.8 33.9 64.2 49.6 41.1 31.9 50.9 40.7 36.2 22.7 49.8 35.5 2.5 0.58 9.4 2.4
PDG 141.5 120.1 167.9 141.0 42.6 32.3 52.5 42.4 36.8 29.9 47.5 36.2 33.1 12.6 41.6 33.2 3.9 0.55 12.0 3.8
PDH 172.4 128.9 334.1 161.6 61.5 39.9 112.3 55.8 52.3 31.7 92.1 48.1 47.7 23.9 87.3 44.0 5.6 1.95 16.5 5.3

100 Alterra-rapport 1823
Table A3.4 Nickel
Extract (all in mg kg-1 dm)
Ni Aqua Regia Ni 0.43 M HNO3 Ni 0.1 M HCl Ni 0.05 M EDTA Ni 0.01 M CaCl2
Site mean min max med mean min max med mean min max med mean min max med mean min max med
CH6 176.6 45.6 461.4 164.8 58.4 6.7 96.4 57.9 54.6 5.0 101.7 54.7 57.7 5.2 89.1 57.7 12.3 0.12 29.4 11.8
CH7 138.1 53.6 247.5 134.5 32.8 7.8 69.5 33.8 28.5 6.8 64.7 29.5 26.8 8.1 66.1 27.5 2.2 <0.01 11.0 1.5
CH8 51.7 32.4 207.1 48.0 8.1 4.6 46.2 7.4 7.2 4.0 63.5 6.3 7.3 3.5 33.3 6.7 0.1 <0.01 1.7 0.1
HC3 66.4 42.4 110.6 64.0 31.8 23.2 43.9 32.1 26.9 18.3 37.9 26.5 27.5 17.7 35.1 27.5 6.1 3.26 10.5 6.1
HC4 91.3 50.0 129.9 88.7 34.4 11.4 46.5 34.8 30.3 20.9 42.7 30.7 31.0 22.6 38.8 31.1 4.7 1.38 8.7 4.5
HC5 86.3 51.3 139.5 82.6 40.0 24.4 57.2 39.9 34.9 24.0 49.5 34.1 37.0 22.7 53.1 37.1 10.9 2.40 28.3 10.4
HM3 158.0 33.3 373.7 140.9 41.1 23.9 94.7 38.8 36.4 21.0 73.5 36.0 35.7 20.2 60.7 34.1 0.8 0.03 9.9 0.5
HM4 194.4 47.9 445.6 171.5 46.0 25.9 96.7 44.7 41.1 24.2 80.8 40.6 39.2 15.8 68.0 39.4 1.4 0.21 19.6 1.2
HM5 176.0 107.1 417.1 157.2 51.6 17.1 78.1 50.8 47.8 14.7 69.3 47.6 49.6 13.5 73.9 50.0 5.8 0.38 11.8 5.6
LK1 60.1 25.5 221.0 51.6 15.7 3.2 60.8 11.9 13.3 3.3 59.2 9.8 12.4 3.3 57.1 10.1 1.9 0.10 8.1 1.7
LK2 209.1 51.7 391.0 191.0 59.4 10.9 102.2 57.5 53.1 10.1 97.0 52.5 51.4 9.4 84.7 52.0 3.6 0.04 15.3 3.4
PDA 31.0 19.0 56.0 30.9 5.5 3.5 13.8 5.4 4.5 3.1 9.1 4.4 4.6 3.0 7.6 4.5 0.5 0.08 1.1 0.5
PDB 29.9 18.4 49.7 29.7 3.9 2.0 8.9 3.8 3.2 2.1 5.1 3.1 3.2 1.3 5.0 3.2 0.3 0.04 0.7 0.3
PDC 28.2 18.6 37.2 28.3 3.8 2.3 5.1 3.7 3.0 2.1 4.1 3.0 3.2 2.0 4.3 3.2 0.3 0.04 0.4 0.3
PDD 29.6 17.9 86.8 29.3 3.3 2.3 4.4 3.3 2.6 0.8 3.7 2.5 2.7 1.7 3.8 2.7 0.2 0.01 0.4 0.2
PDE 33.0 19.5 46.8 32.4 5.2 3.0 9.5 5.0 4.3 2.3 7.7 3.8 4.2 2.2 8.7 4.0 0.4 0.15 0.9 0.4
PDF 30.1 21.2 39.6 29.9 2.6 1.7 3.4 2.6 1.9 0.9 2.8 1.9 1.9 0.8 2.9 1.9 0.1 0.01 0.5 0.1
PDG 29.3 19.9 61.9 28.2 2.7 1.9 3.6 2.7 2.2 1.6 3.0 2.1 2.2 1.1 3.4 2.2 0.2 <0.01 0.8 0.2
PDH 31.1 16.8 42.6 30.7 3.5 2.0 8.2 3.0 2.8 1.4 5.6 2.5 2.9 1.2 6.1 2.5 0.2 0.02 1.7 0.2

Alterra-rapport 1823 101
Table A4.5 Lead
Extract (all in mg kg-1 dm)
Pb Aqua Regia Pb 0.43 M HNO3 Pb 0.1 M HCl Pb 0.05 M EDTA Pb 0.01 M CaCl2
Site mean min max med mean min max med mean min max med mean min max med mean min max med
CH6 62.1 30.4 91.1 61.9 35.8 14.5 57.9 35.8 20.2 4.1 34.2 19.5 26.4 5.0 43.8 25.8 0.08 0.001 0.29 0.07
CH7 35.2 23.5 84.0 33.0 22.1 15.3 37.2 20.8 10.9 3.2 22.4 10.5 17.4 7.0 34.0 16.6 0.09 0.001 0.34 0.05
CH8 55.4 24.5 159.9 53.8 26.7 15.2 40.9 26.6 11.5 3.1 20.2 11.6 19.7 9.9 27.6 19.9 0.08 0.001 0.34 0.06
HC3 23.4 16.4 36.0 23.5 13.5 8.9 20.7 13.3 7.7 3.2 11.6 7.8 9.3 2.0 16.3 9.4 0.09 0.001 0.50 0.08
HC4 34.7 23.2 54.4 33.6 20.2 8.8 33.8 20.2 11.7 4.2 20.7 11.2 15.5 8.2 24.3 15.1 0.11 0.001 0.23 0.11
HC5 22.5 10.8 46.2 20.4 13.3 6.7 30.8 12.0 6.9 0.8 17.8 6.3 9.6 3.0 19.9 8.8 0.10 0.005 0.30 0.10
HM3 32.7 21.2 97.3 31.5 18.3 10.8 55.9 17.7 6.5 0.3 42.1 6.2 11.3 4.1 45.5 10.8 0.08 0.001 0.30 0.05
HM4 33.2 23.0 64.0 32.6 18.0 11.2 54.6 17.3 6.8 0.7 22.8 6.6 10.8 4.5 30.7 10.5 0.08 < 0.001 0.29 0.06
HM5 36.2 22.2 97.4 35.7 19.0 11.7 29.8 18.6 7.7 1.9 15.3 7.6 12.1 4.5 23.2 12.2 0.08 0.001 0.34 0.05
LK1 51.6 18.3 217.4 42.3 30.5 8.0 66.3 26.1 21.9 5.4 49.9 19.3 25.1 5.0 57.1 21.7 0.08 < 0.001 0.28 0.06
LK2 33.0 17.5 122.2 28.4 19.4 8.9 49.1 17.1 10.8 1.2 43.5 8.7 16.5 6.2 54.4 14.0 0.08 < 0.001 0.32 0.05
PDA 686.9 280.7 933.8 678.6 479.4 183.8 715.4 480.3 425.8 135.4 821.7 383.6 419.7 151.6 624.9 415.2 0.43 0.060 0.93 0.43
PDB 551.0 290.7 848.4 540.6 388.7 172.0 723.3 373.8 320.6 139.1 762.3 291.0 329.7 149.7 569.2 326.5 0.46 0.076 1.05 0.45
PDC 344.6 177.7 595.7 333.9 233.8 132.4 397.4 225.1 171.3 79.9 389.1 167.3 197.4 100.0 316.4 195.7 0.24 0.061 0.45 0.23
PDD 225.0 152.6 567.4 210.9 153.2 105.5 413.8 146.0 103.4 68.6 317.4 96.9 128.3 63.8 372.9 120.7 0.23 0.065 0.47 0.21
PDE 453.5 263.1 1171.4 395.3 318.2 155.5 755.6 283.8 237.8 100.2 789.0 204.6 251.8 145.4 549.5 224.0 0.40 0.060 0.94 0.39
PDF 156.1 121.7 234.4 152.9 102.5 64.5 133.2 102.1 64.0 48.7 79.9 64.4 85.4 57.2 109.0 84.9 0.12 0.001 0.32 0.12
PDG 162.1 126.9 208.5 160.8 105.6 80.5 143.1 102.8 67.6 49.4 99.2 66.4 88.2 39.8 138.9 86.7 0.17 0.024 0.43 0.19
PDH 208.5 86.3 544.7 173.8 136.6 57.5 373.3 117.3 94.6 32.2 370.7 73.6 119.1 40.3 308.1 97.1 0.21 0.004 0.54 0.20

102 Alterra-rapport 1823
Table A3.6 Chromium
Extract (all in mg kg-1 dm)
Cr Aqua Regia Cr 0.43 M HNO3 Cr 0.1 M HCl Cr 0.05 M EDTA Cr 0.01 M CaCl2
Site mean min max med mean min max med mean min max med mean min max med mean min max med
CH6 115.6 56.7 483.0 106.0 8.5 2.1 82.4 7.0 2.7 0.31 31.58 2.17 1.02 0.10 6.96 0.88 0.018 < 0.001 0.153 0.016
CH7 101.1 50.2 200.3 90.4 10.0 2.9 28.8 6.9 4.0 0.83 12.77 2.83 2.00 0.06 6.96 1.23 0.013 < 0.001 0.036 0.012
CH8 66.5 41.2 146.7 61.9 2.4 0.9 22.9 1.9 0.7 0.04 11.65 0.57 0.22 0.01 5.32 0.13 0.013 < 0.001 0.043 0.010
HC3 87.9 56.3 149.8 83.8 8.6 4.4 16.7 8.0 2.6 0.53 4.81 2.45 1.85 0.70 3.29 1.78 0.036 0.015 0.080 0.034
HC4 159.7 90.3 259.1 153.6 13.7 6.3 34.1 11.7 5.4 1.54 18.98 4.20 2.47 1.24 5.20 2.26 0.034 0.006 0.061 0.034
HC5 99.9 50.1 267.4 85.5 7.3 2.9 37.5 5.3 1.8 0.26 17.29 1.01 1.43 0.29 5.53 1.07 0.041 0.012 0.185 0.036
HM3 120.8 62.3 345.7 100.8 9.0 3.0 42.1 6.0 3.3 0.96 13.96 2.26 0.92 0.03 5.08 0.67 0.016 < 0.001 0.043 0.016
HM4 153.2 64.0 468.4 126.3 13.4 3.4 60.6 8.2 4.6 1.05 20.80 3.22 1.20 0.02 5.27 0.89 0.014 < 0.001 0.045 0.012
HM5 153.7 64.9 450.9 125.1 11.4 3.7 67.6 7.4 3.8 0.12 17.52 2.71 1.32 0.00 5.63 0.89 0.018 < 0.001 0.043 0.017
LK1 93.6 44.3 189.0 86.4 9.0 2.0 33.5 6.4 3.7 0.62 15.93 2.47 1.59 0.11 5.89 1.20 0.015 < 0.001 0.044 0.014
LK2 130.1 57.1 343.5 103.1 13.1 4.4 68.3 8.3 4.9 1.49 19.30 3.38 2.23 0.56 9.15 1.55 0.014 < 0.001 0.044 0.011
PDA 54.0 43.1 93.3 53.6 4.2 2.5 8.1 4.1 0.6 0.03 1.86 0.60 0.14 0.02 0.50 0.10 0.013 < 0.001 0.030 0.013
PDB 53.3 43.0 76.2 53.3 2.6 1.0 4.7 2.5 0.2 0.01 0.80 0.10 na na na na 0.013 < 0.001 0.037 0.013
PDC 47.3 38.9 58.0 46.9 2.4 1.8 3.3 2.4 0.1 0.01 0.52 0.08 na na na na 0.013 < 0.001 0.030 0.013
PDD 51.3 41.4 149.1 50.4 2.1 1.3 4.1 2.1 0.2 0.01 0.58 0.07 na na na na 0.013 < 0.001 0.031 0.013
PDE 52.1 38.9 70.2 52.0 2.5 1.6 4.4 2.4 0.1 0.01 0.55 0.08 na na na na 0.012 < 0.001 0.038 0.012
PDF 53.1 41.1 95.3 52.9 2.2 1.4 3.0 2.1 0.1 0.01 0.37 0.09 na na na na 0.014 < 0.001 0.030 0.013
PDG 52.6 44.1 104.4 51.9 2.1 1.6 3.2 2.1 0.1 0.03 0.07 0.06 0.07 0.07 0.07 0.07 0.014 < 0.001 0.053 0.014
PDH 52.9 43.3 72.0 52.6 2.0 1.4 3.3 1.8 0.1 0.01 0.22 0.15 na na na na 0.012 < 0.001 0.032 0.012

Alterra-rapport 1823 103
Table A3.7 Copper
Extract (all in mg kg-1 dm)
Cu Aqua Regia Cu 0.43 M HNO3 Cu 0.1 M HCl Cu 0.05 M EDTA Cu 0.01 M CaCl2
Site mean min max med mean min max med mean min max med mean min max med mean min max med
CH6 130.0 72.2 765.9 109.8 76.5 42.9 573.8 64.6 65.3 44.5 367.6 55.9 76.4 39.5 347.3 66.5 0.277 0.009 4.466 0.170
CH7 315.3 64.1 903.5 215.8 202.8 45.3 635.8 129.0 187.8 39.3 640.3 113.3 195.4 35.1 539.3 132.3 0.518 0.012 9.242 0.210
CH8 162.3 72.8 695.5 158.4 87.5 47.6 438.9 84.6 71.4 40.9 401.4 69.5 88.4 46.5 429.1 86.3 0.052 <0.001 0.833 0.037
HC3 32.1 22.9 196.0 29.6 18.6 12.1 128.6 17.3 15.0 10.0 117.5 13.5 15.7 9.3 118.0 14.5 0.065 0.013 0.717 0.057
HC4 205.7 29.8 310.7 202.3 134.9 17.3 211.1 132.2 121.2 14.6 206.7 119.9 117.0 13.1 198.7 118.9 0.328 0.037 0.753 0.287
HC5 105.8 32.9 299.8 90.7 67.7 17.3 259.2 53.1 57.0 14.9 188.2 44.9 60.0 14.6 204.7 47.2 0.370 0.015 2.180 0.252
HM3 134.9 71.8 420.9 102.9 83.7 45.0 289.8 63.6 71.9 36.4 261.6 54.1 82.9 41.3 263.7 63.8 0.052 <0.001 0.971 0.029
HM4 136.1 55.3 556.2 105.7 80.6 34.6 292.1 61.2 70.4 27.5 262.0 53.8 78.9 29.5 285.4 62.1 0.043 <0.001 0.401 0.023
HM5 112.5 57.9 610.5 87.0 67.6 34.0 417.6 54.2 58.7 30.7 386.7 46.5 67.0 24.1 418.1 54.5 0.094 0.004 0.844 0.075
LK1 173.3 51.5 509.1 142.2 113.2 29.7 336.4 88.9 101.3 27.6 299.2 81.4 111.0 31.7 315.0 93.7 0.478 0.006 2.533 0.364
LK2 179.5 79.4 489.5 137.8 113.6 54.8 338.8 87.9 102.7 48.2 313.2 77.3 116.4 58.0 307.5 91.1 0.151 0.003 1.009 0.095
PDA 124.2 49.8 245.7 123.5 63.6 27.0 128.1 62.5 52.7 23.2 102.3 52.3 47.6 19.6 82.9 50.4 0.082 0.001 0.192 0.096
PDB 58.8 34.1 163.9 55.5 31.4 14.5 281.9 26.7 24.4 12.4 180.9 22.2 23.5 9.9 54.9 21.9 0.039 <0.001 0.161 0.039
PDC 55.1 35.1 67.8 56.2 30.6 19.6 41.8 30.6 24.3 14.9 31.2 24.2 27.9 14.8 36.9 28.2 0.047 0.001 0.092 0.052
PDD 35.8 26.0 62.3 34.8 17.6 11.4 56.8 16.6 13.9 10.5 33.0 13.3 15.7 11.0 36.3 15.1 0.030 0.005 0.083 0.030
PDE 48.4 36.1 78.4 45.5 26.0 15.9 45.8 24.8 20.2 13.1 34.1 18.7 23.0 14.4 40.3 21.5 0.044 0.003 0.100 0.050
PDF 33.6 26.6 40.6 33.8 16.6 11.6 24.1 16.6 12.8 9.5 15.3 12.9 14.8 8.9 18.4 14.9 0.035 0.004 0.133 0.034
PDG 31.3 25.5 42.2 30.9 14.9 11.2 21.4 14.7 11.7 9.1 17.3 11.3 14.0 5.0 21.9 13.8 0.032 0.001 0.157 0.034
PDH 33.5 23.7 56.5 32.0 14.8 9.8 29.3 13.6 11.4 6.7 23.3 10.3 13.6 6.5 24.9 12.9 0.027 0.001 0.164 0.024

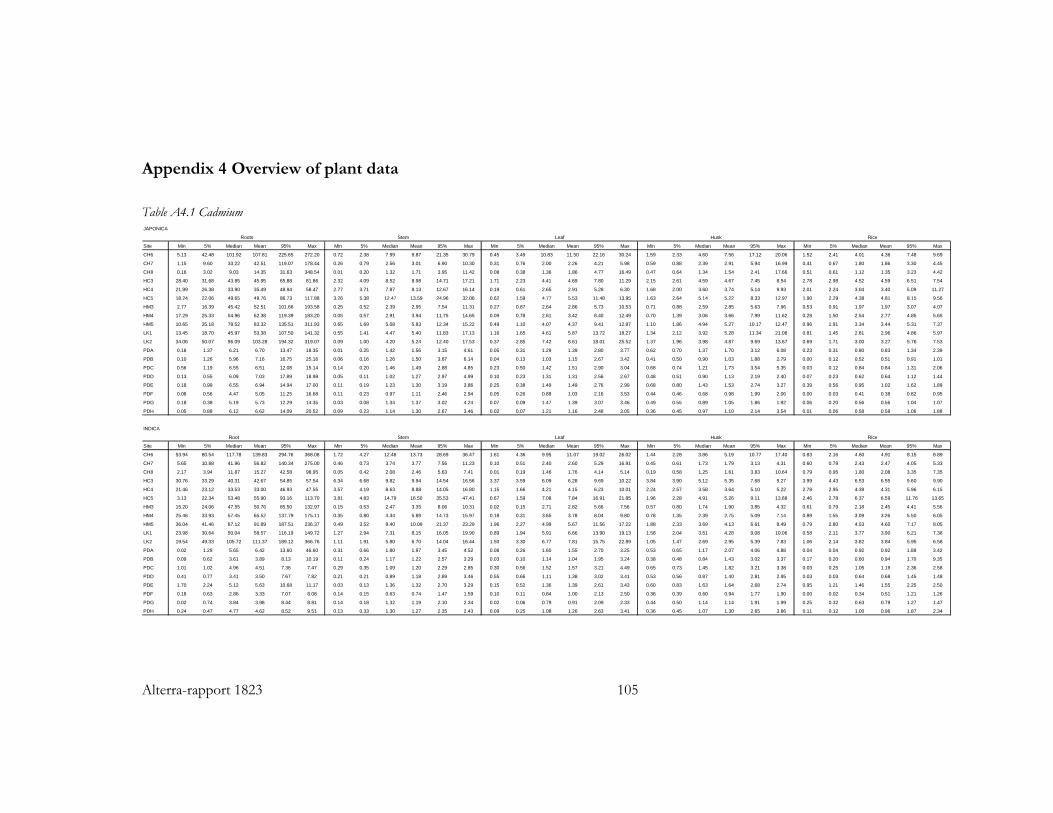
Alterra-rapport 1823 105
Appendix 4 Overview of plant data
Table A4.1 Cadmium JAPONICA
Site Min 5% Median Mean 95% Max Min 5% Median Mean 95% Max Min 5% Median Mean 95% Max Min 5% Median Mean 95% Max Min 5% Median Mean 95% Max
CH6 5.13 42.48 101.92 107.81 225.65 272.20 0.72 2.38 7.99 9.87 21.35 30.79 0.45 3.49 10.83 11.50 22.16 30.24 1.59 2.33 4.60 7.56 17.12 20.06 1.52 2.41 4.01 4.36 7.48 9.69
CH7 1.15 9.60 33.22 42.51 119.07 178.44 0.26 0.79 2.56 3.01 6.90 10.30 0.31 0.76 2.00 2.26 4.21 5.98 0.59 0.88 2.39 2.91 5.94 16.99 0.41 0.67 1.80 1.86 3.30 4.45
CH8 0.16 3.02 9.03 14.35 31.63 348.54 0.01 0.20 1.32 1.71 3.95 11.42 0.08 0.38 1.36 1.86 4.77 16.49 0.47 0.64 1.34 1.54 2.41 17.66 0.51 0.61 1.12 1.35 3.23 4.42
HC3 28.40 31.68 43.85 45.95 65.88 81.86 2.32 4.09 8.52 8.98 14.71 17.21 1.71 2.23 4.41 4.69 7.80 11.29 2.15 2.61 4.59 4.67 7.45 8.54 2.78 2.98 4.52 4.59 6.51 7.54
HC4 21.99 26.38 33.90 35.49 48.94 58.47 2.77 3.71 7.87 8.13 12.67 16.14 0.19 0.61 2.65 2.91 5.28 6.30 1.68 2.00 3.60 3.74 5.14 9.93 2.01 2.24 3.04 3.40 5.09 11.27
HC5 18.24 22.06 49.65 49.76 86.73 117.88 3.26 5.38 12.47 13.59 24.96 32.06 0.62 1.59 4.77 5.53 11.48 13.95 1.63 2.64 5.14 5.22 8.33 12.97 1.90 2.29 4.38 4.81 8.15 9.56
HM3 2.77 16.39 45.42 52.51 101.66 193.58 0.25 0.52 2.39 2.95 7.54 11.31 0.27 0.87 2.64 2.86 5.73 10.53 0.71 0.88 2.59 2.85 5.63 7.96 0.53 0.91 1.97 1.97 3.07 4.07
HM4 17.29 25.33 54.96 62.38 119.39 183.20 0.05 0.57 2.91 3.94 11.75 14.65 0.09 0.78 2.61 3.42 8.40 12.49 0.70 1.39 3.06 3.66 7.99 11.62 0.28 1.50 2.54 2.77 4.85 5.65
HM5 10.65 35.18 78.52 83.32 135.51 311.93 0.65 1.69 5.08 5.83 12.34 15.22 0.49 1.10 4.07 4.37 9.41 12.87 1.10 1.86 4.94 5.27 10.17 12.47 0.96 1.91 3.34 3.44 5.31 7.37
LK1 13.45 18.70 45.97 53.38 107.50 141.32 0.55 1.41 4.47 5.40 11.83 17.13 1.16 1.65 4.61 5.87 13.72 18.27 1.34 2.12 3.92 5.28 11.34 21.08 0.81 1.45 2.81 2.96 4.86 5.97
LK2 34.06 50.07 96.09 103.28 194.32 319.07 0.09 1.00 4.20 5.24 12.40 17.53 0.37 2.85 7.42 8.61 18.01 25.52 1.37 1.96 3.98 4.87 9.69 13.67 0.69 1.71 3.00 3.27 5.76 7.53
PDA 0.18 1.37 6.21 6.70 13.47 18.35 0.01 0.25 1.42 1.56 3.15 4.61 0.05 0.31 1.29 1.39 2.80 3.77 0.62 0.70 1.37 1.70 3.12 6.08 0.23 0.31 0.80 0.83 1.34 2.39
PDB 0.10 1.26 5.96 7.16 16.75 25.16 0.06 0.16 1.26 1.50 3.67 6.14 0.04 0.13 1.03 1.15 2.67 3.42 0.41 0.50 0.90 1.03 1.88 2.79 0.00 0.12 0.52 0.51 0.91 1.01
PDC 0.56 1.19 6.55 6.51 12.08 15.14 0.14 0.20 1.46 1.49 2.88 4.85 0.23 0.50 1.42 1.51 2.90 3.04 0.68 0.74 1.21 1.73 3.54 5.35 0.03 0.12 0.84 0.84 1.31 2.06
PDD 0.13 0.55 6.09 7.03 17.89 18.98 0.05 0.11 1.02 1.27 2.97 4.99 0.10 0.23 1.31 1.31 2.56 2.67 0.48 0.51 0.90 1.13 2.19 2.40 0.07 0.23 0.62 0.64 1.12 1.44
PDE 0.18 0.99 6.55 6.94 14.94 17.00 0.11 0.19 1.23 1.30 3.19 3.86 0.25 0.38 1.49 1.49 2.76 2.99 0.68 0.80 1.43 1.53 2.74 3.27 0.39 0.56 0.95 1.02 1.62 1.89
PDF 0.08 0.56 4.47 5.05 11.25 16.68 0.11 0.23 0.97 1.11 2.46 2.94 0.05 0.26 0.88 1.03 2.16 3.53 0.44 0.46 0.68 0.98 1.99 2.06 0.00 0.03 0.41 0.38 0.82 0.95
PDG 0.18 0.38 5.19 5.73 12.29 14.35 0.03 0.08 1.34 1.37 3.02 4.24 0.07 0.09 1.47 1.39 3.07 3.46 0.49 0.55 0.89 1.05 1.86 1.92 0.06 0.20 0.56 0.56 1.04 1.07
PDH 0.05 0.88 6.12 6.62 14.09 20.52 0.09 0.23 1.14 1.30 2.67 3.46 0.02 0.07 1.21 1.16 2.48 3.05 0.36 0.45 0.97 1.10 2.14 3.54 0.01 0.06 0.58 0.58 1.06 1.88
INDICA
Site Min 5% Median Mean 95% Max Min 5% Median Mean 95% Max Min 5% Median Mean 95% Max Min 5% Median Mean 95% Max Min 5% Median Mean 95% Max
CH6 53.94 80.54 117.78 139.83 294.76 368.08 1.72 4.27 12.46 13.73 28.69 36.47 1.61 4.36 9.95 11.07 19.02 26.02 1.44 2.28 3.86 5.19 10.77 17.40 0.83 2.16 4.60 4.91 8.15 8.89
CH7 5.65 10.88 41.96 56.82 140.34 275.00 0.46 0.73 3.74 3.77 7.56 11.23 0.10 0.51 2.40 2.60 5.29 16.91 0.45 0.61 1.73 1.79 3.13 4.31 0.60 0.79 2.43 2.47 4.05 5.33
CH8 2.17 3.94 11.87 15.27 42.58 98.95 0.05 0.42 2.08 2.46 5.63 7.41 0.01 0.19 1.46 1.76 4.14 5.14 0.19 0.58 1.25 1.61 3.83 10.64 0.79 0.95 1.80 2.08 3.35 7.35
HC3 30.76 33.29 40.31 42.67 54.85 57.54 6.34 6.68 9.82 9.94 14.54 16.56 3.37 3.59 6.09 6.28 9.69 10.22 3.84 3.90 5.12 5.35 7.68 9.27 3.99 4.43 6.53 6.55 9.60 9.90
HC4 21.46 23.12 33.53 33.00 46.93 47.55 3.57 4.19 8.63 8.88 14.05 16.80 1.15 1.66 4.21 4.15 6.23 10.01 2.24 2.57 3.58 3.64 5.10 5.22 2.78 2.95 4.39 4.31 5.96 6.15
HC5 3.13 22.34 53.48 55.90 93.16 113.70 3.81 4.83 14.79 16.50 35.53 47.41 0.67 1.59 7.08 7.84 16.91 21.85 1.96 2.28 4.91 5.26 9.11 13.68 2.46 2.78 6.37 6.59 11.76 13.65
HM3 15.20 24.06 47.55 50.76 85.50 132.97 0.15 0.53 2.47 3.35 8.06 10.31 0.02 0.15 2.71 2.82 5.66 7.56 0.57 0.80 1.74 1.90 3.85 4.32 0.61 0.79 2.18 2.45 4.41 5.56
HM4 25.46 33.93 57.45 65.52 137.79 175.11 0.35 0.80 4.34 5.89 14.73 15.97 0.18 0.31 3.65 3.78 8.04 9.80 0.78 1.35 2.39 2.75 5.09 7.14 0.89 1.55 3.09 3.26 5.50 6.05
HM5 36.04 41.46 87.12 91.89 187.51 236.37 0.49 3.52 8.40 10.09 21.37 23.29 1.96 2.27 4.99 5.67 11.56 17.22 1.88 2.33 3.69 4.13 6.61 8.49 0.79 2.80 4.53 4.60 7.17 8.05
LK1 23.98 30.64 50.04 58.57 116.19 149.72 1.27 2.94 7.31 8.15 16.05 19.90 0.89 1.94 5.91 6.66 13.90 19.13 1.58 2.04 3.51 4.28 9.08 10.06 0.58 2.11 3.77 3.90 6.21 7.38
LK2 19.54 49.33 105.72 111.37 189.12 366.76 1.11 1.91 5.80 6.70 14.04 16.44 1.50 3.30 6.77 7.81 15.75 22.89 1.05 1.47 2.69 2.95 5.39 7.83 1.06 2.14 3.82 3.84 5.95 6.58
PDA 0.02 1.29 5.65 6.42 13.60 46.60 0.31 0.66 1.80 1.97 3.45 4.52 0.08 0.26 1.60 1.55 2.70 3.25 0.53 0.65 1.17 2.07 4.06 4.88 0.04 0.04 0.92 0.92 1.88 3.42
PDB 0.09 0.62 3.61 3.89 8.13 10.19 0.11 0.24 1.17 1.22 2.57 3.29 0.03 0.10 1.14 1.04 1.95 3.24 0.38 0.48 0.84 1.43 3.02 3.37 0.17 0.20 0.60 0.94 1.70 9.35
PDC 1.01 1.02 4.96 4.51 7.36 7.47 0.29 0.35 1.09 1.20 2.29 2.85 0.30 0.56 1.52 1.57 3.21 4.49 0.65 0.73 1.45 1.82 3.21 3.38 0.03 0.25 1.05 1.19 2.36 2.58
PDD 0.41 0.77 3.41 3.50 7.67 7.82 0.21 0.21 0.89 1.18 2.89 3.46 0.55 0.66 1.11 1.38 3.02 3.41 0.53 0.56 0.87 1.40 2.81 2.95 0.03 0.03 0.64 0.68 1.45 1.48
PDE 1.70 2.24 5.12 5.63 10.68 11.17 0.03 0.13 1.36 1.32 2.70 3.29 0.15 0.52 1.36 1.39 2.61 3.43 0.60 0.83 1.63 1.64 2.68 2.74 0.95 1.21 1.46 1.55 2.25 2.50
PDF 0.18 0.63 2.86 3.33 7.07 8.08 0.14 0.15 0.63 0.74 1.47 1.59 0.10 0.11 0.84 1.00 2.13 2.50 0.36 0.39 0.60 0.94 1.77 1.90 0.00 0.02 0.34 0.51 1.21 1.26
PDG 0.02 0.74 3.84 3.98 8.44 8.81 0.14 0.18 1.32 1.19 2.10 2.34 0.02 0.06 0.79 0.91 2.09 2.33 0.44 0.50 1.14 1.14 1.91 1.99 0.25 0.32 0.63 0.79 1.27 1.47
PDH 0.24 0.47 4.77 4.62 8.52 9.51 0.13 0.33 1.30 1.27 2.35 2.43 0.09 0.25 1.08 1.26 2.63 3.41 0.36 0.45 1.07 1.30 2.65 3.86 0.11 0.12 1.00 0.96 1.87 2.34
StemRoot
Rice
RiceHuskLeaf
Roots Stem Leaf Husk

106 Alterra-rapport 1823
Table A4.2 Zinc
JAPONICA
Site Min 5% Median Mean 95% Max Min 5% Median Mean 95% Max Min 5% Median Mean 95% Max Min 5% Median Mean 95% Max Min 5% Median Mean 95% Max
CH6 35.88 56.54 119.99 126.09 245.00 297.50 106.20 172.30 452.90 502.20 884.80 4465.90 27.07 50.50 137.60 133.10 231.80 366.00 26.54 29.67 53.83 57.05 91.03 117.60 17.56 23.84 29.67 30.16 38.01 45.34
CH7 18.22 24.19 68.59 74.39 168.00 248.80 36.40 47.50 192.30 226.90 487.00 2200.00 19.55 34.36 96.00 116.80 248.70 437.70 20.40 25.18 57.22 62.92 117.95 182.10 17.60 20.33 27.46 27.81 35.40 42.75
CH8 20.39 25.10 46.81 57.08 110.70 294.70 48.10 57.50 132.90 189.70 422.80 1750.60 15.83 24.96 42.00 51.70 107.60 259.00 13.00 16.49 24.15 25.37 37.09 103.60 9.93 13.45 19.98 20.13 27.45 34.39
HC3 28.68 32.53 52.63 56.06 90.70 102.30 56.50 72.00 151.50 170.00 315.90 345.20 32.54 34.19 83.40 89.40 198.50 268.40 26.42 29.97 40.26 40.88 56.07 60.90 20.22 21.60 27.38 26.60 31.27 32.51
HC4 32.17 38.12 56.31 59.64 94.70 119.60 138.90 171.10 240.60 256.60 400.90 447.30 39.14 54.31 99.40 111.90 186.50 208.50 24.29 25.45 42.30 46.18 77.83 91.40 22.50 24.71 28.94 28.96 34.15 44.72
HC5 19.25 25.47 55.64 58.90 101.60 164.30 60.60 105.90 248.60 257.50 459.80 587.80 35.86 48.15 121.90 128.60 241.90 397.80 25.04 27.06 42.40 45.06 68.33 213.40 20.38 21.24 28.06 27.51 34.20 37.24
HM3 20.54 24.53 47.04 51.69 79.70 210.90 29.00 47.00 183.50 208.00 430.60 1014.80 32.78 38.31 59.20 63.20 95.40 301.60 21.05 25.62 36.86 38.38 54.35 155.20 16.69 18.74 25.31 25.01 31.44 38.49
HM4 32.48 36.57 71.08 77.40 140.70 434.00 41.90 119.00 199.80 250.50 508.30 752.50 34.89 49.90 75.30 86.10 132.30 330.00 14.08 33.77 45.30 49.55 74.46 323.30 17.39 21.07 25.96 26.61 34.38 43.86
HM5 27.16 38.10 63.02 70.54 134.30 185.50 90.90 113.60 213.00 241.70 491.00 1034.20 29.88 39.14 65.40 72.00 119.60 230.90 23.98 27.04 37.36 38.93 57.37 81.90 16.32 20.62 26.79 26.86 35.27 37.10
LK1 27.06 77.21 196.42 209.87 384.20 600.10 132.50 310.50 693.00 733.20 1322.70 1937.20 28.24 86.82 189.20 213.00 433.70 925.50 31.35 44.51 64.13 75.61 153.62 223.30 22.13 26.13 33.06 33.68 42.98 50.41
LK2 30.66 41.42 66.08 75.10 131.40 262.30 74.00 90.20 163.80 198.50 476.50 787.30 28.15 33.73 63.80 73.10 140.90 225.10 20.86 23.97 38.30 72.43 71.40 4107.00 14.24 20.15 27.89 28.08 38.28 63.32
PDA 48.92 70.17 109.49 109.48 158.80 193.30 80.30 225.20 459.70 506.40 917.30 1096.00 45.84 65.78 153.40 160.90 308.10 412.00 22.62 29.62 50.24 55.45 95.00 129.20 24.39 28.22 34.80 35.32 43.77 52.90
PDB 12.57 24.77 64.75 63.18 96.90 113.30 30.80 87.40 230.40 231.20 387.00 506.30 19.52 28.96 79.00 82.50 149.60 188.30 15.61 20.92 37.66 40.54 67.71 90.90 20.29 22.49 30.02 30.10 38.62 43.91
PDC 40.17 43.71 74.74 77.38 116.60 121.60 190.20 199.50 318.90 339.90 525.70 799.40 40.61 46.95 93.20 97.80 173.10 260.30 24.48 28.32 45.39 53.20 100.65 165.40 27.88 29.65 33.74 35.46 45.17 48.52
PDD 22.56 26.57 44.55 47.36 76.70 85.60 76.30 89.70 194.50 192.90 303.10 363.70 39.84 45.99 78.90 78.30 115.40 134.30 23.73 25.95 40.61 41.92 60.70 79.00 21.10 23.51 29.12 29.76 38.65 39.70
PDE 36.82 40.32 58.96 62.13 84.60 165.20 111.00 115.40 184.40 187.20 270.90 368.30 32.94 39.66 68.20 71.50 100.50 265.50 26.37 28.98 39.11 41.57 58.15 71.90 19.45 22.72 31.06 31.51 39.94 44.89
PDF 17.08 20.77 35.46 37.21 60.90 69.70 80.40 93.10 156.90 163.70 277.00 322.40 34.16 40.33 68.90 67.70 93.20 118.60 25.14 27.50 39.71 41.82 60.54 68.50 21.89 23.06 29.16 29.49 37.93 39.93
PDG 17.03 23.77 34.30 35.57 48.70 69.80 76.50 91.10 124.10 136.60 244.40 271.40 32.82 35.51 52.80 54.60 79.60 110.50 22.87 26.93 39.69 40.48 57.60 64.80 20.67 23.17 30.65 30.81 39.38 42.93
PDH 15.92 22.28 41.39 43.08 66.60 125.20 70.80 84.40 146.90 157.60 261.70 378.90 33.57 42.86 62.60 65.80 101.20 153.20 20.56 26.19 40.51 44.22 65.46 318.30 20.81 23.78 29.72 30.27 38.17 44.62
INDICA
Site Min 5% Median Mean 95% Max Min 5% Median Mean 95% Max Min 5% Median Mean 95% Max Min 5% Median Mean 95% Max Min 5% Median Mean 95% Max
CH6 75.55 89.91 142.25 147.50 230.40 344.30 222.50 276.70 611.40 748.30 1833.30 2486.60 50.42 62.48 117.30 142.30 303.80 335.40 19.44 25.18 40.66 52.03 93.21 354.60 15.32 22.67 27.38 28.30 36.62 50.74
CH7 23.42 28.79 96.77 101.05 188.60 311.40 44.40 61.40 262.50 313.50 1008.70 1265.30 11.18 33.59 113.50 132.60 356.50 494.90 19.05 21.26 41.79 56.26 166.68 192.70 15.42 20.05 27.31 27.70 35.77 47.97
CH8 24.36 31.99 68.47 74.78 165.30 176.30 68.10 76.90 228.20 280.20 633.10 869.80 20.39 25.00 47.60 57.90 131.80 173.70 15.35 16.40 24.65 28.39 46.78 120.20 14.22 17.24 22.47 22.52 28.64 40.50
HC3 33.83 38.56 72.63 73.09 116.50 129.10 76.90 103.00 243.90 229.30 372.40 407.10 35.05 38.46 111.70 105.60 234.30 261.00 23.15 26.12 38.19 40.74 62.94 70.10 21.13 24.10 28.61 29.02 34.32 40.91
HC4 27.07 38.40 79.30 77.55 121.00 146.80 157.20 176.10 333.00 369.80 682.60 1000.90 63.03 65.30 103.00 122.10 254.30 275.10 22.02 23.98 31.80 36.72 60.33 66.60 23.20 24.52 27.47 27.60 31.19 32.96
HC5 20.12 22.18 72.13 67.19 112.60 140.80 88.60 105.90 362.70 395.90 748.20 925.30 36.97 51.94 107.10 122.70 267.00 288.70 23.22 25.72 34.10 37.29 59.74 64.00 20.45 21.14 26.06 26.29 32.03 35.52
HM3 24.17 30.84 59.41 63.33 105.20 135.90 33.40 73.50 233.50 275.80 624.80 836.10 34.88 45.41 61.30 66.10 106.30 139.60 19.19 22.43 28.98 35.49 49.53 289.70 15.66 19.20 23.95 24.80 32.35 39.21
HM4 44.19 56.35 99.84 103.45 174.30 210.70 72.00 147.00 375.70 490.40 1151.60 2474.40 32.44 46.79 82.30 92.60 193.00 246.00 22.16 24.12 33.32 34.64 47.06 63.90 13.30 20.87 23.74 25.20 34.93 39.06
HM5 46.39 56.93 97.34 103.74 176.60 421.60 191.40 225.30 399.50 531.40 1349.20 2657.80 40.79 46.78 73.80 86.00 147.00 450.30 21.28 26.10 33.78 34.52 48.91 51.60 15.61 20.17 25.71 25.99 33.56 36.42
LK1 68.89 96.31 230.16 253.99 546.80 594.70 177.10 260.60 906.70 1084.70 2590.70 3945.70 70.88 84.46 246.90 265.50 514.00 616.40 30.34 37.80 51.86 60.11 121.03 213.10 20.30 26.20 33.60 34.45 43.51 57.84
LK2 44.24 47.85 86.71 99.00 188.60 309.60 98.50 127.20 250.60 310.60 602.20 1666.80 35.30 38.50 63.00 72.10 120.70 278.20 20.21 22.89 29.44 31.96 48.29 59.90 10.82 21.64 25.71 26.77 35.86 41.38
PDA 47.50 50.80 119.58 122.00 187.80 206.80 144.70 267.20 676.30 764.00 1433.10 1668.80 62.91 88.31 157.80 175.50 316.30 406.30 22.39 24.51 44.15 64.94 136.27 137.20 25.40 26.51 37.21 37.02 52.72 65.39
PDB 29.08 46.05 71.94 75.08 116.30 177.40 131.90 154.50 313.10 322.70 618.80 654.80 44.66 55.62 101.00 102.30 169.10 189.30 16.09 19.62 36.47 52.04 107.40 124.80 22.51 23.69 32.39 35.09 55.24 117.50
PDC 53.01 58.66 100.85 95.73 125.70 134.20 193.80 225.00 455.80 479.70 1125.20 1234.50 70.92 75.72 125.10 129.40 207.90 249.50 23.29 27.05 44.40 53.68 89.31 112.40 28.79 28.88 37.67 38.44 53.66 54.06
PDD 27.17 28.18 49.01 50.62 72.50 93.30 102.80 105.40 241.50 260.40 525.60 530.30 42.90 47.65 100.50 104.10 171.50 175.10 20.09 20.82 36.86 45.27 82.06 83.00 22.80 22.93 30.26 31.72 44.95 45.03
PDE 54.67 56.67 75.35 76.65 112.70 114.20 118.20 128.50 265.40 269.10 450.20 481.50 40.85 44.44 101.60 104.80 194.40 217.30 21.36 25.30 43.86 44.74 70.42 76.80 25.21 27.41 35.77 34.56 41.89 45.46
PDF 19.46 25.70 34.76 36.20 51.00 53.20 108.50 119.40 170.40 202.90 394.50 431.30 51.73 54.47 70.60 84.90 147.90 182.00 17.91 19.28 30.25 40.61 68.72 69.90 22.15 22.73 29.77 31.25 43.11 43.78
PDG 28.82 29.94 45.75 47.17 72.70 73.00 87.50 116.90 187.90 199.10 300.10 313.00 38.78 46.68 70.50 76.00 119.90 151.40 20.71 21.02 37.26 42.61 69.90 75.30 24.28 24.76 33.41 33.81 43.85 44.43
PDH 29.43 32.18 44.83 48.97 77.20 83.00 109.60 122.40 203.60 228.30 524.40 606.10 37.64 41.10 77.50 82.80 142.80 192.60 16.44 20.09 39.39 43.79 74.94 92.20 22.30 23.01 32.82 33.95 48.30 53.00
Rice
Root Stem Leaf Husk Rice
Roots Stem Leaf Husk

Alterra-rapport 1823 107
Table A4.3 Nickel
JAPONICA
Site Min 5% Median Mean 95% Max Min 5% Median Mean 95% Max Min 5% Median Mean 95% Max Min 5% Median Mean 95% Max Min 5% Median Mean 95% Max
CH6 5.13 42.48 101.92 107.81 225.65 272.20 0.72 2.38 7.99 9.87 21.35 30.79 0.45 3.49 10.83 11.50 22.16 30.24 1.59 2.33 4.60 7.56 17.12 20.06 1.52 2.41 4.01 4.36 7.48 9.69
CH7 1.15 9.60 33.22 42.51 119.07 178.44 0.26 0.79 2.56 3.01 6.90 10.30 0.31 0.76 2.00 2.26 4.21 5.98 0.59 0.88 2.39 2.91 5.94 16.99 0.41 0.67 1.80 1.86 3.30 4.45
CH8 0.16 3.02 9.03 14.35 31.63 348.54 0.01 0.20 1.32 1.71 3.95 11.42 0.08 0.38 1.36 1.86 4.77 16.49 0.47 0.64 1.34 1.54 2.41 17.66 0.51 0.61 1.12 1.35 3.23 4.42
HC3 28.40 31.68 43.85 45.95 65.88 81.86 2.32 4.09 8.52 8.98 14.71 17.21 1.71 2.23 4.41 4.69 7.80 11.29 2.15 2.61 4.59 4.67 7.45 8.54 2.78 2.98 4.52 4.59 6.51 7.54
HC4 21.99 26.38 33.90 35.49 48.94 58.47 2.77 3.71 7.87 8.13 12.67 16.14 0.19 0.61 2.65 2.91 5.28 6.30 1.68 2.00 3.60 3.74 5.14 9.93 2.01 2.24 3.04 3.40 5.09 11.27
HC5 18.24 22.06 49.65 49.76 86.73 117.88 3.26 5.38 12.47 13.59 24.96 32.06 0.62 1.59 4.77 5.53 11.48 13.95 1.63 2.64 5.14 5.22 8.33 12.97 1.90 2.29 4.38 4.81 8.15 9.56
HM3 2.77 16.39 45.42 52.51 101.66 193.58 0.25 0.52 2.39 2.95 7.54 11.31 0.27 0.87 2.64 2.86 5.73 10.53 0.71 0.88 2.59 2.85 5.63 7.96 0.53 0.91 1.97 1.97 3.07 4.07
HM4 17.29 25.33 54.96 62.38 119.39 183.20 0.05 0.57 2.91 3.94 11.75 14.65 0.09 0.78 2.61 3.42 8.40 12.49 0.70 1.39 3.06 3.66 7.99 11.62 0.28 1.50 2.54 2.77 4.85 5.65
HM5 10.65 35.18 78.52 83.32 135.51 311.93 0.65 1.69 5.08 5.83 12.34 15.22 0.49 1.10 4.07 4.37 9.41 12.87 1.10 1.86 4.94 5.27 10.17 12.47 0.96 1.91 3.34 3.44 5.31 7.37
LK1 13.45 18.70 45.97 53.38 107.50 141.32 0.55 1.41 4.47 5.40 11.83 17.13 1.16 1.65 4.61 5.87 13.72 18.27 1.34 2.12 3.92 5.28 11.34 21.08 0.81 1.45 2.81 2.96 4.86 5.97
LK2 34.06 50.07 96.09 103.28 194.32 319.07 0.09 1.00 4.20 5.24 12.40 17.53 0.37 2.85 7.42 8.61 18.01 25.52 1.37 1.96 3.98 4.87 9.69 13.67 0.69 1.71 3.00 3.27 5.76 7.53
PDA 0.18 1.37 6.21 6.70 13.47 18.35 0.01 0.25 1.42 1.56 3.15 4.61 0.05 0.31 1.29 1.39 2.80 3.77 0.62 0.70 1.37 1.70 3.12 6.08 0.23 0.31 0.80 0.83 1.34 2.39
PDB 0.10 1.26 5.96 7.16 16.75 25.16 0.06 0.16 1.26 1.50 3.67 6.14 0.04 0.13 1.03 1.15 2.67 3.42 0.41 0.50 0.90 1.03 1.88 2.79 0.00 0.12 0.52 0.51 0.91 1.01
PDC 0.56 1.19 6.55 6.51 12.08 15.14 0.14 0.20 1.46 1.49 2.88 4.85 0.23 0.50 1.42 1.51 2.90 3.04 0.68 0.74 1.21 1.73 3.54 5.35 0.03 0.12 0.84 0.84 1.31 2.06
PDD 0.13 0.55 6.09 7.03 17.89 18.98 0.05 0.11 1.02 1.27 2.97 4.99 0.10 0.23 1.31 1.31 2.56 2.67 0.48 0.51 0.90 1.13 2.19 2.40 0.07 0.23 0.62 0.64 1.12 1.44
PDE 0.18 0.99 6.55 6.94 14.94 17.00 0.11 0.19 1.23 1.30 3.19 3.86 0.25 0.38 1.49 1.49 2.76 2.99 0.68 0.80 1.43 1.53 2.74 3.27 0.39 0.56 0.95 1.02 1.62 1.89
PDF 0.08 0.56 4.47 5.05 11.25 16.68 0.11 0.23 0.97 1.11 2.46 2.94 0.05 0.26 0.88 1.03 2.16 3.53 0.44 0.46 0.68 0.98 1.99 2.06 0.00 0.03 0.41 0.38 0.82 0.95
PDG 0.18 0.38 5.19 5.73 12.29 14.35 0.03 0.08 1.34 1.37 3.02 4.24 0.07 0.09 1.47 1.39 3.07 3.46 0.49 0.55 0.89 1.05 1.86 1.92 0.06 0.20 0.56 0.56 1.04 1.07
PDH 0.05 0.88 6.12 6.62 14.09 20.52 0.09 0.23 1.14 1.30 2.67 3.46 0.02 0.07 1.21 1.16 2.48 3.05 0.36 0.45 0.97 1.10 2.14 3.54 0.01 0.06 0.58 0.58 1.06 1.88
INDICA
Site Min 5% Median Mean 95% Max Min 5% Median Mean 95% Max Min 5% Median Mean 95% Max Min 5% Median Mean 95% Max Min 5% Median Mean 95% Max
CH6 53.94 80.54 117.78 139.83 294.76 368.08 1.72 4.27 12.46 13.73 28.69 36.47 1.61 4.36 9.95 11.07 19.02 26.02 1.44 2.28 3.86 5.19 10.77 17.40 0.83 2.16 4.60 4.91 8.15 8.89
CH7 5.65 10.88 41.96 56.82 140.34 275.00 0.46 0.73 3.74 3.77 7.56 11.23 0.10 0.51 2.40 2.60 5.29 16.91 0.45 0.61 1.73 1.79 3.13 4.31 0.60 0.79 2.43 2.47 4.05 5.33
CH8 2.17 3.94 11.87 15.27 42.58 98.95 0.05 0.42 2.08 2.46 5.63 7.41 0.01 0.19 1.46 1.76 4.14 5.14 0.19 0.58 1.25 1.61 3.83 10.64 0.79 0.95 1.80 2.08 3.35 7.35
HC3 30.76 33.29 40.31 42.67 54.85 57.54 6.34 6.68 9.82 9.94 14.54 16.56 3.37 3.59 6.09 6.28 9.69 10.22 3.84 3.90 5.12 5.35 7.68 9.27 3.99 4.43 6.53 6.55 9.60 9.90
HC4 21.46 23.12 33.53 33.00 46.93 47.55 3.57 4.19 8.63 8.88 14.05 16.80 1.15 1.66 4.21 4.15 6.23 10.01 2.24 2.57 3.58 3.64 5.10 5.22 2.78 2.95 4.39 4.31 5.96 6.15
HC5 3.13 22.34 53.48 55.90 93.16 113.70 3.81 4.83 14.79 16.50 35.53 47.41 0.67 1.59 7.08 7.84 16.91 21.85 1.96 2.28 4.91 5.26 9.11 13.68 2.46 2.78 6.37 6.59 11.76 13.65
HM3 15.20 24.06 47.55 50.76 85.50 132.97 0.15 0.53 2.47 3.35 8.06 10.31 0.02 0.15 2.71 2.82 5.66 7.56 0.57 0.80 1.74 1.90 3.85 4.32 0.61 0.79 2.18 2.45 4.41 5.56
HM4 25.46 33.93 57.45 65.52 137.79 175.11 0.35 0.80 4.34 5.89 14.73 15.97 0.18 0.31 3.65 3.78 8.04 9.80 0.78 1.35 2.39 2.75 5.09 7.14 0.89 1.55 3.09 3.26 5.50 6.05
HM5 36.04 41.46 87.12 91.89 187.51 236.37 0.49 3.52 8.40 10.09 21.37 23.29 1.96 2.27 4.99 5.67 11.56 17.22 1.88 2.33 3.69 4.13 6.61 8.49 0.79 2.80 4.53 4.60 7.17 8.05
LK1 23.98 30.64 50.04 58.57 116.19 149.72 1.27 2.94 7.31 8.15 16.05 19.90 0.89 1.94 5.91 6.66 13.90 19.13 1.58 2.04 3.51 4.28 9.08 10.06 0.58 2.11 3.77 3.90 6.21 7.38
LK2 19.54 49.33 105.72 111.37 189.12 366.76 1.11 1.91 5.80 6.70 14.04 16.44 1.50 3.30 6.77 7.81 15.75 22.89 1.05 1.47 2.69 2.95 5.39 7.83 1.06 2.14 3.82 3.84 5.95 6.58
PDA 0.02 1.29 5.65 6.42 13.60 46.60 0.31 0.66 1.80 1.97 3.45 4.52 0.08 0.26 1.60 1.55 2.70 3.25 0.53 0.65 1.17 2.07 4.06 4.88 0.04 0.04 0.92 0.92 1.88 3.42
PDB 0.09 0.62 3.61 3.89 8.13 10.19 0.11 0.24 1.17 1.22 2.57 3.29 0.03 0.10 1.14 1.04 1.95 3.24 0.38 0.48 0.84 1.43 3.02 3.37 0.17 0.20 0.60 0.94 1.70 9.35
PDC 1.01 1.02 4.96 4.51 7.36 7.47 0.29 0.35 1.09 1.20 2.29 2.85 0.30 0.56 1.52 1.57 3.21 4.49 0.65 0.73 1.45 1.82 3.21 3.38 0.03 0.25 1.05 1.19 2.36 2.58
PDD 0.41 0.77 3.41 3.50 7.67 7.82 0.21 0.21 0.89 1.18 2.89 3.46 0.55 0.66 1.11 1.38 3.02 3.41 0.53 0.56 0.87 1.40 2.81 2.95 0.03 0.03 0.64 0.68 1.45 1.48
PDE 1.70 2.24 5.12 5.63 10.68 11.17 0.03 0.13 1.36 1.32 2.70 3.29 0.15 0.52 1.36 1.39 2.61 3.43 0.60 0.83 1.63 1.64 2.68 2.74 0.95 1.21 1.46 1.55 2.25 2.50
PDF 0.18 0.63 2.86 3.33 7.07 8.08 0.14 0.15 0.63 0.74 1.47 1.59 0.10 0.11 0.84 1.00 2.13 2.50 0.36 0.39 0.60 0.94 1.77 1.90 0.00 0.02 0.34 0.51 1.21 1.26
PDG 0.02 0.74 3.84 3.98 8.44 8.81 0.14 0.18 1.32 1.19 2.10 2.34 0.02 0.06 0.79 0.91 2.09 2.33 0.44 0.50 1.14 1.14 1.91 1.99 0.25 0.32 0.63 0.79 1.27 1.47
PDH 0.24 0.47 4.77 4.62 8.52 9.51 0.13 0.33 1.30 1.27 2.35 2.43 0.09 0.25 1.08 1.26 2.63 3.41 0.36 0.45 1.07 1.30 2.65 3.86 0.11 0.12 1.00 0.96 1.87 2.34
StemRoot
Rice
RiceHuskLeaf
Roots Stem Leaf Husk

108 Alterra-rapport 1823
Table A4.4 Lead
JAPONICA
Site Min 5% Median Mean 95% Max Min 5% Median Mean 95% Max Min 5% Median Mean 95% Max Min 5% Median Mean 95% Max Min 5% Median Mean 95% Max
CH6 4.89 9.98 20.22 24.51 55.38 136.40 0.02 0.39 1.81 2.11 5.19 8.01 0.05 0.56 2.86 3.20 7.19 10.07 0.06 0.21 1.26 2.12 7.54 12.10 0.01 0.05 0.17 0.20 0.43 1.03
CH7 3.14 3.68 8.10 10.37 27.80 36.30 0.05 0.33 1.31 1.82 4.66 8.81 0.19 0.46 2.03 2.89 5.93 9.14 0.27 0.51 2.28 3.31 9.48 25.72 0.00 0.03 0.19 0.23 0.44 1.81
CH8 2.19 3.44 7.23 8.87 19.01 44.70 0.11 0.24 1.47 1.95 5.11 6.19 0.11 0.56 3.90 4.54 11.17 20.53 0.17 0.24 0.89 4.06 14.28 24.87 0.02 0.06 0.18 0.20 0.43 1.27
HC3 3.17 3.93 7.00 7.50 12.45 15.90 0.04 0.25 1.80 1.76 3.28 4.28 0.42 0.85 2.40 2.48 4.20 5.00 0.32 0.42 0.76 0.90 1.55 7.36 0.02 0.04 0.10 0.11 0.20 0.42
HC4 3.12 4.70 9.98 10.87 22.00 27.00 0.08 0.53 2.27 2.28 4.60 5.05 0.30 0.70 2.56 2.44 4.04 4.40 0.35 0.39 0.66 0.74 1.22 2.08 0.00 0.02 0.10 0.10 0.20 0.68
HC5 2.82 4.02 6.60 7.50 13.49 20.30 0.09 0.87 2.56 2.51 4.12 4.66 0.08 0.49 2.32 2.22 4.15 5.15 0.32 0.39 0.67 0.76 1.54 2.65 0.00 0.02 0.09 0.10 0.18 1.14
HM3 2.45 4.42 9.09 9.93 17.55 33.50 0.04 0.20 1.21 1.94 5.40 12.72 0.04 0.32 2.43 2.68 6.06 11.07 0.22 0.32 1.70 2.38 6.44 13.57 0.01 0.04 0.17 0.20 0.40 1.84
HM4 2.72 3.73 8.12 9.42 20.06 29.20 0.04 0.28 1.02 1.38 4.01 5.41 0.03 0.32 2.29 2.56 5.31 9.61 0.19 0.36 1.47 2.19 6.10 10.64 0.00 0.02 0.15 0.19 0.45 1.99
HM5 3.18 4.36 8.57 9.94 17.83 37.90 0.04 0.11 1.10 1.62 5.04 7.78 0.10 0.30 2.99 3.35 6.62 15.60 0.25 0.37 1.61 2.31 6.51 9.02 0.00 0.02 0.14 0.17 0.42 0.83
LK1 3.16 11.48 31.64 36.53 88.52 154.70 0.01 0.30 1.84 2.48 6.03 27.71 0.18 1.16 4.26 7.04 21.56 99.53 0.21 0.65 3.44 7.13 30.88 68.24 0.01 0.08 0.22 0.25 0.48 1.89
LK2 3.32 4.93 11.34 13.29 30.27 65.30 0.08 0.20 1.01 1.43 4.08 6.65 0.04 0.62 3.29 3.38 6.93 11.09 0.08 0.19 2.61 3.39 10.40 19.03 0.03 0.06 0.16 0.23 0.58 1.96
PDA 51.95 69.40 131.19 136.60 218.05 269.60 9.65 13.35 20.53 21.38 33.67 57.95 2.65 3.84 6.75 6.80 10.50 12.45 0.48 0.74 1.33 1.54 2.85 10.13 0.04 0.08 0.17 0.20 0.43 1.19
PDB 19.48 41.15 105.68 106.77 204.96 257.40 0.92 10.07 21.88 22.80 42.97 67.75 2.15 3.28 6.72 7.07 12.63 19.02 0.57 0.81 1.26 1.83 5.66 11.74 0.00 0.06 0.16 0.20 0.47 1.65
PDC 33.35 35.69 55.44 59.38 84.91 224.80 0.71 4.40 11.19 12.13 21.22 37.37 1.89 2.48 4.37 4.48 7.34 10.10 0.52 0.62 1.05 1.38 2.88 11.12 0.00 0.01 0.13 0.18 0.30 2.15
PDD 15.22 25.20 43.75 45.64 70.57 73.30 0.48 5.34 10.21 11.09 18.88 28.29 1.43 2.11 3.86 4.10 7.20 8.75 0.57 0.65 1.00 1.11 1.66 3.73 0.02 0.04 0.13 0.19 0.48 1.36
PDE 40.70 44.78 67.32 80.58 160.65 247.00 5.00 6.04 10.83 11.80 20.76 36.93 2.45 2.79 4.47 4.83 7.48 11.60 0.59 0.63 1.23 1.24 2.10 2.26 0.01 0.04 0.14 0.17 0.41 0.57
PDF 19.28 20.74 30.10 33.46 56.83 77.60 3.89 5.23 9.18 9.69 16.52 19.85 0.92 1.73 3.88 3.91 6.33 7.05 0.46 0.61 1.07 1.09 1.68 2.28 0.00 0.03 0.13 0.13 0.27 0.30
PDG 12.87 15.80 26.92 29.01 53.34 60.70 2.32 3.53 6.35 7.40 14.49 18.26 1.00 1.51 3.21 3.26 4.87 5.58 0.45 0.60 0.99 1.09 1.82 2.14 0.01 0.03 0.13 0.16 0.35 0.63
PDH 12.10 13.41 38.10 46.42 106.16 302.60 2.39 3.28 8.71 9.54 19.90 33.04 0.03 1.04 3.87 4.12 9.72 11.76 0.45 0.67 1.02 1.09 1.67 2.21 0.01 0.04 0.13 0.16 0.31 0.79
INDICA
Site Min 5% Median Mean 95% Max Min 5% Median Mean 95% Max Min 5% Median Mean 95% Max Min 5% Median Mean 95% Max Min 5% Median Mean 95% Max
CH6 8.89 14.00 25.51 31.65 73.83 120.20 0.02 0.78 1.87 2.13 4.75 5.97 0.27 0.87 2.96 3.47 8.33 9.22 0.08 0.25 0.62 2.14 6.92 12.77 0.01 0.03 0.19 0.32 1.42 2.37
CH7 3.11 4.66 9.41 12.03 28.60 49.70 0.02 0.18 1.22 1.94 6.19 9.12 0.10 0.30 2.50 3.44 11.23 12.31 0.34 0.44 2.03 2.57 6.09 11.24 0.03 0.10 0.22 0.27 0.58 1.37
CH8 3.30 4.31 9.32 10.05 18.40 41.00 0.53 0.55 1.98 2.51 5.74 8.28 0.32 0.58 4.16 4.48 10.30 11.00 0.07 0.15 0.88 4.00 14.30 18.01 0.04 0.11 0.24 0.35 1.56 2.20
HC3 3.42 3.84 7.81 8.02 12.41 15.70 0.49 0.58 1.61 1.70 3.09 4.53 0.59 0.78 2.01 2.28 4.38 6.61 0.49 0.56 0.80 0.99 2.27 3.16 0.02 0.04 0.13 0.14 0.26 0.27
HC4 3.77 5.09 9.29 10.30 18.92 19.50 0.47 0.67 1.82 2.01 3.52 4.29 0.08 0.15 1.52 1.57 2.79 3.10 0.36 0.39 0.67 0.82 1.37 2.61 0.02 0.03 0.11 0.12 0.21 0.23
HC5 3.32 4.99 7.42 11.97 15.84 206.90 0.17 0.37 2.20 2.28 4.05 5.99 0.17 0.34 2.07 2.15 3.97 4.35 0.39 0.43 0.73 0.84 1.45 3.96 0.03 0.04 0.12 0.13 0.27 0.36
HM3 3.43 4.30 8.03 9.62 16.47 42.90 0.01 0.22 1.02 1.34 3.55 3.78 0.07 0.30 2.35 2.77 5.98 8.40 0.26 0.34 1.17 1.81 5.14 7.24 0.02 0.05 0.20 0.24 0.55 1.62
HM4 3.36 4.10 8.57 10.86 25.08 72.50 0.05 0.33 1.18 1.52 5.52 6.91 0.59 1.12 2.82 3.22 7.26 7.86 0.22 0.32 1.08 2.01 7.18 11.85 0.03 0.06 0.16 0.27 1.04 1.61
HM5 3.66 5.11 9.97 11.68 23.52 47.50 0.02 0.15 1.36 1.75 5.26 7.70 0.00 0.20 2.80 3.14 6.79 13.46 0.21 0.27 0.92 2.35 7.78 14.45 0.01 0.05 0.19 0.36 1.50 3.05
LK1 5.51 12.78 29.92 37.32 77.61 122.20 0.24 0.46 2.10 2.59 5.06 25.06 0.05 0.34 4.33 5.64 15.48 25.58 0.25 0.35 3.53 5.25 18.33 26.60 0.06 0.09 0.21 0.24 0.54 0.70
LK2 4.65 6.05 12.50 16.61 39.05 82.20 0.08 0.42 1.35 2.03 6.32 17.75 0.10 0.71 2.59 3.08 6.40 7.63 0.12 0.19 0.86 2.27 7.77 9.87 0.02 0.05 0.17 0.22 0.72 0.87
PDA 10.92 84.39 129.31 128.38 183.49 200.90 9.65 14.68 24.90 26.11 47.61 55.35 2.15 3.65 5.69 6.26 9.93 10.92 0.55 0.58 1.22 1.52 3.40 6.19 0.00 0.01 0.15 0.16 0.32 0.45
PDB 39.39 70.34 106.38 106.49 147.70 185.30 8.92 11.88 20.70 21.29 35.17 43.54 1.43 2.57 5.54 5.99 9.99 10.64 0.49 0.54 0.98 1.26 2.62 3.56 0.03 0.04 0.13 0.17 0.42 0.85
PDC 40.71 42.91 62.55 63.13 85.28 121.00 7.99 8.07 13.49 14.12 20.23 24.39 1.38 1.61 4.33 4.37 6.72 6.90 0.54 0.55 0.76 1.07 2.35 2.42 0.01 0.04 0.15 0.19 0.64 0.78
PDD 21.51 26.27 42.50 44.27 69.54 73.90 5.17 5.80 10.86 10.97 17.03 17.10 1.82 1.92 3.47 3.66 5.95 6.27 0.46 0.52 0.79 0.86 1.38 1.51 0.00 0.01 0.09 0.10 0.27 0.30
PDE 53.95 57.74 79.37 84.37 128.87 150.10 6.44 8.53 16.51 16.00 26.63 30.44 1.52 2.35 4.67 5.14 8.54 8.75 0.49 0.56 0.87 1.12 2.48 2.81 0.05 0.07 0.17 0.17 0.29 0.32
PDF 19.73 21.08 33.74 36.08 64.80 76.70 4.51 4.59 8.50 10.38 20.53 24.57 1.48 1.59 3.86 3.97 7.10 7.34 0.46 0.50 0.81 0.95 1.71 1.84 0.00 0.03 0.17 0.17 0.41 0.46
PDG 21.59 22.44 32.04 32.24 41.18 46.20 2.42 4.53 7.79 8.44 16.68 17.20 0.90 1.20 3.02 3.14 5.45 6.13 0.51 0.53 0.93 0.93 1.58 1.70 0.00 0.02 0.14 0.17 0.44 0.67
PDH 14.66 17.71 40.73 47.85 100.25 130.60 2.31 4.17 8.99 11.48 22.27 45.87 0.37 0.82 2.95 3.57 7.33 15.12 0.50 0.52 0.85 0.95 1.88 2.30 0.04 0.04 0.12 0.16 0.40 0.53
Rice
Root Stem Leaf Husk Rice
Roots Stem Leaf Husk

Alterra-rapport 1823 109
Table A4.5 Chromium JAPONICA
Site Min 5% Median Mean 95% Max Min 5% Median Mean 95% Max Min 5% Median Mean 95% Max Min 5% Median Mean 95% Max Min 5% Median Mean 95% Max
CH6 1.89 4.22 16.59 19.67 48.00 131.49 0.01 0.06 0.43 0.52 1.36 2.27 0.01 0.12 0.66 0.94 2.76 9.10 0.09 0.14 0.30 0.44 1.20 4.43 0.10 0.13 0.21 0.22 0.34 0.60
CH7 0.72 4.52 11.56 15.08 33.92 83.49 0.02 0.05 0.42 0.56 1.85 3.86 0.01 0.18 0.70 0.76 1.47 2.27 0.10 0.12 0.31 0.51 1.68 3.82 0.10 0.17 0.26 0.27 0.41 0.71
CH8 0.06 1.23 6.54 7.63 17.20 26.52 0.02 0.08 0.45 0.54 1.18 4.03 0.00 0.08 0.52 0.69 1.56 6.60 0.10 0.14 0.33 0.46 1.35 4.16 0.10 0.14 0.21 0.23 0.34 0.65
HC3 5.11 6.41 15.40 16.97 31.43 72.58 0.13 0.77 2.73 3.19 6.71 10.31 0.01 0.06 0.51 0.57 1.19 1.63 0.24 0.27 0.43 0.44 0.66 0.83 0.06 0.08 0.15 0.15 0.25 0.48
HC4 7.47 10.16 19.40 19.94 33.80 49.42 0.35 0.58 2.41 2.64 5.60 7.40 0.01 0.04 0.43 0.55 1.47 2.03 0.24 0.29 0.41 0.47 0.88 1.93 0.07 0.09 0.14 0.15 0.23 0.30
HC5 3.61 5.52 12.76 14.94 26.86 93.61 0.16 0.66 1.86 2.45 6.13 8.32 0.01 0.06 0.40 0.45 1.00 1.85 0.24 0.28 0.41 0.48 0.83 4.26 0.05 0.08 0.14 0.14 0.20 0.29
HM3 1.85 5.08 14.94 19.41 49.40 104.95 0.01 0.05 0.39 0.47 1.08 1.92 0.03 0.17 0.94 1.00 2.13 4.37 0.07 0.15 0.40 0.55 1.62 4.29 0.10 0.16 0.25 0.26 0.39 0.72
HM4 1.34 5.00 17.73 23.15 65.53 139.49 0.01 0.04 0.34 0.43 1.22 2.59 0.01 0.07 0.54 0.65 1.32 5.85 0.08 0.14 0.34 0.41 0.80 3.10 0.02 0.13 0.25 0.26 0.43 0.76
HM5 4.83 9.02 26.39 31.18 61.21 203.59 0.01 0.04 0.41 0.49 1.45 1.95 0.01 0.04 0.49 0.57 1.25 3.30 0.08 0.13 0.33 0.42 1.21 2.28 0.11 0.16 0.23 0.25 0.46 0.83
LK1 2.62 8.65 25.74 27.71 54.53 80.63 0.02 0.07 0.39 0.43 0.93 1.36 0.10 0.22 0.91 0.92 1.71 2.23 0.07 0.13 0.45 0.54 1.35 2.86 0.10 0.12 0.21 0.23 0.39 0.92
LK2 4.66 9.26 20.66 26.66 60.88 155.55 0.01 0.10 0.42 0.54 1.33 3.12 0.04 0.12 0.76 0.91 1.98 5.55 0.10 0.12 0.41 0.62 2.29 4.95 0.09 0.14 0.21 0.22 0.32 0.77
PDA 0.01 0.78 4.12 4.36 8.12 11.58 0.07 0.15 0.56 0.67 1.42 2.08 0.04 0.16 0.53 0.59 1.22 2.13 0.28 0.34 0.48 0.50 0.76 1.31 0.08 0.08 0.15 0.16 0.31 0.46
PDB 0.01 0.47 2.88 3.22 7.45 9.92 0.04 0.20 0.73 0.87 2.09 7.39 0.01 0.08 0.57 0.61 1.25 1.77 0.27 0.32 0.44 0.50 0.85 1.73 0.06 0.09 0.15 0.16 0.24 0.40
PDC 0.38 0.75 4.76 4.96 11.23 12.96 0.09 0.14 0.55 0.69 1.81 2.23 0.04 0.08 0.54 0.58 1.18 1.69 0.21 0.31 0.41 0.45 0.81 1.00 0.00 0.02 0.16 0.15 0.24 0.32
PDD 0.05 0.12 2.06 2.53 5.36 10.10 0.02 0.07 0.55 0.81 2.33 3.36 0.05 0.08 0.55 0.62 1.33 1.71 0.21 0.28 0.42 0.43 0.68 1.05 0.06 0.08 0.15 0.17 0.28 0.42
PDE 0.12 0.65 3.83 4.33 8.93 10.91 0.02 0.07 0.49 0.65 1.81 3.22 0.01 0.07 0.47 0.52 1.18 1.30 0.26 0.27 0.41 0.42 0.55 0.78 0.07 0.08 0.15 0.16 0.25 0.51
PDF 0.13 0.36 3.52 3.88 7.66 21.28 0.09 0.11 0.53 0.62 1.48 1.60 0.01 0.10 0.41 0.45 1.04 1.24 0.26 0.31 0.44 0.45 0.63 0.83 0.06 0.08 0.15 0.15 0.25 0.41
PDG 0.07 0.19 3.07 3.21 6.22 7.35 0.04 0.05 0.49 0.65 1.89 2.65 0.02 0.07 0.50 0.52 1.18 1.23 0.28 0.32 0.43 0.45 0.69 1.04 0.07 0.08 0.15 0.17 0.32 0.47
PDH 0.05 0.52 2.88 3.56 8.27 11.09 0.03 0.07 0.46 0.60 1.81 2.22 0.01 0.10 0.48 0.54 1.24 2.02 0.21 0.29 0.42 0.42 0.58 0.71 0.06 0.08 0.14 0.15 0.26 0.32
INDICA
Site Min 5% Median Mean 95% Max Min 5% Median Mean 95% Max Min 5% Median Mean 95% Max Min 5% Median Mean 95% Max Min 5% Median Mean 95% Max
CH6 6.99 10.77 23.77 26.88 51.88 119.76 0.01 0.10 0.41 0.50 1.24 1.58 0.07 0.18 0.82 1.02 1.84 6.55 0.08 0.13 0.33 0.49 1.60 4.90 0.11 0.15 0.24 0.26 0.44 0.71
CH7 4.12 5.76 16.47 19.57 47.21 76.78 0.01 0.06 0.35 0.40 0.97 1.65 0.04 0.12 0.57 0.77 1.51 6.87 0.11 0.13 0.26 0.36 0.74 2.42 0.15 0.17 0.27 0.26 0.41 0.44
CH8 0.39 2.20 9.37 10.68 23.75 29.97 0.08 0.11 0.48 0.63 1.45 5.93 0.02 0.09 0.56 0.85 3.63 4.93 0.08 0.13 0.35 0.39 0.81 1.07 0.13 0.15 0.23 0.26 0.51 0.80
HC3 3.36 4.51 10.77 12.12 21.22 27.83 0.10 0.20 1.58 1.73 3.60 6.01 0.04 0.06 0.44 0.47 1.01 1.36 0.31 0.32 0.43 0.46 0.64 1.17 0.09 0.10 0.16 0.16 0.27 0.32
HC4 6.48 10.49 18.84 18.83 28.85 30.21 0.23 0.34 1.65 1.97 4.58 5.05 0.02 0.07 0.50 0.53 0.98 2.02 0.30 0.30 0.47 0.59 1.73 2.80 0.07 0.08 0.15 0.15 0.25 0.27
HC5 1.58 2.97 13.17 13.90 26.13 38.79 0.09 0.31 1.32 1.75 5.13 6.46 0.02 0.18 0.47 0.52 1.12 1.43 0.26 0.31 0.53 0.55 0.91 1.22 0.07 0.08 0.15 0.15 0.22 0.32
HM3 0.88 6.91 16.31 19.48 49.79 56.56 0.02 0.14 0.42 0.46 0.99 1.46 0.10 0.26 1.11 1.21 2.57 3.28 0.12 0.15 0.32 0.47 1.02 4.35 0.09 0.13 0.24 0.25 0.39 0.61
HM4 7.91 11.27 22.65 28.73 73.19 113.60 0.01 0.03 0.49 0.53 1.34 1.99 0.06 0.13 0.60 0.72 1.45 3.64 0.09 0.14 0.31 0.40 0.73 3.29 0.13 0.15 0.25 0.27 0.45 0.70
HM5 6.95 9.90 26.83 31.82 69.75 171.41 0.01 0.01 0.35 0.34 0.64 0.91 0.03 0.12 0.65 1.06 3.55 9.62 0.07 0.12 0.30 0.35 0.79 1.59 0.11 0.15 0.23 0.25 0.43 0.87
LK1 8.73 11.61 29.26 36.87 90.04 114.38 0.04 0.10 0.46 0.62 1.58 6.41 0.01 0.10 0.79 0.94 2.34 4.49 0.09 0.14 0.40 0.54 1.16 3.69 0.09 0.14 0.23 0.25 0.37 0.95
LK2 5.93 10.60 25.21 31.78 71.60 104.91 0.06 0.12 0.50 0.61 1.32 2.62 0.01 0.07 0.81 0.93 2.37 5.00 0.13 0.14 0.33 0.40 0.69 2.03 0.13 0.15 0.24 0.24 0.32 0.39
PDA 0.04 0.53 3.41 3.99 7.34 25.80 0.02 0.10 0.57 0.60 1.19 1.35 0.01 0.18 0.70 0.69 1.29 1.60 0.34 0.38 0.48 0.51 0.72 0.78 0.00 0.00 0.17 0.16 0.25 0.40
PDB 0.04 0.24 2.39 2.75 6.34 7.28 0.04 0.13 0.57 0.61 1.31 1.57 0.03 0.07 0.45 0.52 1.04 1.34 0.30 0.34 0.46 0.48 0.66 0.90 0.08 0.10 0.18 0.19 0.28 0.42
PDC 0.06 0.10 2.78 3.40 8.10 11.00 0.04 0.05 0.29 0.39 1.10 1.13 0.08 0.08 0.49 0.48 1.17 1.17 0.32 0.33 0.47 0.49 0.74 0.99 0.00 0.06 0.17 0.16 0.23 0.27
PDD 0.30 0.32 3.23 3.30 6.71 7.35 0.03 0.10 0.57 0.60 1.22 1.34 0.07 0.09 0.38 0.59 2.28 5.21 0.32 0.33 0.45 0.46 0.63 0.68 0.00 0.00 0.16 0.14 0.23 0.24
PDE 0.12 0.23 2.92 2.97 6.16 7.57 0.03 0.03 0.59 0.63 1.52 2.00 0.02 0.06 0.43 0.45 0.92 1.09 0.34 0.37 0.45 0.48 0.71 0.76 0.09 0.09 0.17 0.17 0.25 0.27
PDF 0.12 0.24 2.73 2.98 7.00 7.06 0.07 0.08 0.35 0.41 1.13 1.36 0.05 0.07 0.26 0.41 1.38 2.06 0.38 0.38 0.48 0.49 0.66 0.68 0.00 0.06 0.18 0.16 0.22 0.24
PDG 0.01 0.16 2.31 2.71 6.06 8.18 0.06 0.07 0.43 0.45 0.93 0.95 0.01 0.05 0.51 0.48 0.86 0.87 0.33 0.33 0.47 0.47 0.58 0.63 0.08 0.09 0.17 0.18 0.28 0.53
PDH 0.25 0.35 2.34 2.45 5.27 6.76 0.03 0.06 0.33 0.41 0.97 1.02 0.03 0.05 0.38 0.43 0.84 1.36 0.26 0.35 0.47 0.46 0.61 0.65 0.06 0.09 0.17 0.16 0.22 0.26
Rice
Root Stem Leaf Husk Rice
Roots Stem Leaf Husk

110 Alterra-rapport 1823
Table A4.6 Copper JAPONICA
Site Min 5% Median Mean 95% Max Min 5% Median Mean 95% Max Min 5% Median Mean 95% Max Min 5% Median Mean 95% Max Min 5% Median Mean 95% Max
CH6 11.60 18.44 29.21 37.09 86.25 199.36 3.05 4.82 12.56 12.38 21.77 24.70 3.14 3.81 7.87 8.15 14.08 26.37 2.76 3.29 5.48 5.52 7.65 12.82 3.62 3.83 4.63 4.84 6.34 7.77
CH7 14.39 21.18 49.54 66.89 165.49 352.44 5.07 7.01 14.13 14.34 23.89 28.44 4.55 6.73 9.14 9.39 13.42 15.68 4.22 4.51 6.13 6.21 8.58 10.86 2.83 3.88 5.74 5.83 8.32 9.68
CH8 17.31 21.52 36.99 42.68 97.69 134.44 4.57 9.44 14.37 14.96 21.01 42.85 3.97 6.78 13.31 13.67 23.43 32.05 3.79 4.47 6.27 6.63 9.60 10.40 3.81 4.56 6.19 6.20 8.90 10.54
HC3 9.63 10.38 17.80 18.29 27.42 39.74 6.49 7.95 15.81 16.13 26.03 36.59 2.48 3.14 4.21 4.38 6.14 7.78 1.70 2.04 3.45 3.51 4.77 5.94 3.31 3.54 4.23 4.29 5.14 5.37
HC4 15.04 16.57 32.00 32.19 50.79 53.12 14.08 15.84 27.95 29.52 48.55 53.79 3.56 3.74 6.37 6.76 10.90 13.83 2.86 3.33 4.45 4.60 6.15 8.86 3.42 3.63 4.90 4.98 6.53 10.81
HC5 6.28 11.14 32.75 32.36 59.25 72.40 5.40 10.26 31.45 32.71 57.79 68.78 1.93 2.79 6.97 7.53 15.06 18.37 2.00 2.62 4.04 4.39 6.90 8.90 2.51 2.68 4.95 5.06 8.02 9.17
HM3 7.80 10.42 20.63 27.06 67.52 167.76 2.35 3.34 7.88 8.33 14.57 20.44 5.72 6.46 9.99 12.40 26.03 32.02 4.19 4.76 6.22 6.97 11.48 15.08 3.24 3.42 4.39 4.59 6.30 10.83
HM4 10.45 12.51 22.67 28.39 63.90 127.38 1.24 2.54 6.69 7.45 15.90 19.76 2.39 3.49 6.70 7.68 14.90 19.33 2.97 3.66 4.86 5.16 7.73 9.79 0.63 3.28 4.16 4.44 7.43 10.83
HM5 11.57 14.43 25.22 29.25 56.18 140.61 2.10 3.56 8.09 8.70 16.83 27.84 3.60 5.70 15.34 16.14 32.92 45.32 3.57 4.34 7.79 7.73 11.93 13.87 2.74 3.73 4.56 4.72 6.40 7.73
LK1 17.69 25.53 81.89 94.35 209.86 281.27 5.74 9.45 17.71 19.85 34.77 167.65 5.30 10.91 22.44 29.61 69.29 306.08 5.50 7.60 10.61 11.73 20.68 31.42 3.87 4.59 6.46 6.70 9.56 10.90
LK2 13.96 20.68 34.31 45.52 98.55 205.40 2.59 3.16 6.64 8.12 16.39 26.72 4.10 5.38 10.91 11.85 21.91 29.63 3.03 3.99 5.63 6.16 9.59 11.92 3.07 3.57 4.61 4.87 7.04 9.15
PDA 6.09 9.38 18.20 17.83 26.62 29.14 5.22 11.50 17.52 17.99 25.61 31.15 2.42 4.45 6.17 6.38 8.76 10.24 2.30 2.74 4.47 4.72 7.78 10.38 3.46 3.86 5.07 5.19 6.79 7.47
PDB 0.06 2.45 9.80 10.17 17.82 21.27 1.58 3.19 10.45 10.81 18.23 23.45 1.14 2.48 3.94 3.99 5.57 7.02 1.21 1.92 3.33 3.37 4.89 6.59 0.77 2.02 4.09 3.97 5.29 5.94
PDC 8.83 9.00 12.79 13.74 20.73 24.90 4.60 5.27 11.82 12.38 19.52 29.54 3.26 3.85 4.70 4.78 6.11 6.54 2.44 2.52 4.06 4.15 5.71 9.49 0.08 1.15 4.63 4.70 6.74 7.18
PDD 2.59 3.76 9.44 9.27 14.43 16.43 5.43 6.62 10.43 10.70 15.83 21.57 2.42 2.66 3.82 3.87 5.55 6.11 1.74 2.00 3.14 3.31 4.98 6.17 2.77 3.35 4.10 4.20 5.12 5.59
PDE 4.52 6.33 9.46 10.20 15.54 21.75 3.94 4.44 7.79 8.54 16.00 17.97 2.25 2.73 3.68 3.85 5.05 6.78 2.00 2.28 3.38 3.55 5.09 5.58 3.16 3.60 4.33 4.49 5.76 6.36
PDF 2.47 3.78 8.45 8.70 13.73 15.52 4.90 6.43 9.91 10.50 16.18 27.16 2.02 2.62 3.63 3.79 5.32 6.24 2.20 2.23 3.53 3.50 5.40 6.09 3.10 3.46 3.99 4.16 5.51 6.17
PDG 3.03 3.97 7.36 7.83 12.20 14.54 3.00 4.87 7.74 8.73 16.40 25.11 2.61 2.81 3.44 3.47 4.21 4.95 2.06 2.31 3.35 3.33 4.61 4.91 3.03 3.56 4.07 4.19 5.52 6.02
PDH 1.79 2.98 8.17 8.32 17.16 20.89 3.00 4.00 7.93 8.22 13.63 21.00 1.86 2.21 3.24 3.32 4.56 6.38 1.64 2.03 3.19 3.33 4.70 13.00 2.80 3.08 3.91 4.08 5.71 6.03
INDICA
Site Min 5% Median Mean 95% Max Min 5% Median Mean 95% Max Min 5% Median Mean 95% Max Min 5% Median Mean 95% Max Min 5% Median Mean 95% Max
CH6 18.63 19.84 32.77 43.53 92.90 260.65 9.43 10.81 22.62 22.83 33.52 44.15 4.77 5.51 10.09 10.55 16.73 20.76 3.32 3.51 5.49 5.75 8.34 13.93 2.60 4.45 6.07 6.10 8.06 10.62
CH7 20.24 21.46 60.36 77.16 159.97 383.44 7.76 8.91 20.13 21.59 42.40 52.14 5.74 7.69 11.07 12.79 21.39 36.36 4.22 4.49 5.96 6.09 8.22 10.36 2.67 4.60 6.75 6.98 10.37 11.21
CH8 16.92 24.26 44.01 51.29 104.04 123.78 12.35 16.20 26.98 27.10 37.40 42.23 5.51 7.23 13.58 16.20 30.27 36.55 3.94 4.80 6.55 6.84 9.72 11.99 3.40 4.82 7.75 7.60 10.11 10.72
HC3 14.04 16.41 26.41 25.67 33.84 34.73 11.82 13.09 23.48 23.34 34.78 38.01 3.78 4.48 5.76 5.86 7.68 8.50 3.01 3.27 4.38 4.40 5.87 6.25 4.19 4.27 5.01 5.28 7.04 7.42
HC4 19.41 19.88 44.50 41.36 62.30 66.17 13.81 17.86 44.75 46.84 79.98 81.44 4.16 5.47 9.06 9.81 16.41 16.70 4.26 4.42 5.64 5.75 7.81 8.00 4.39 4.72 6.43 6.62 9.22 9.49
HC5 9.35 13.57 42.22 39.16 60.08 70.21 12.84 16.31 53.80 49.35 87.22 93.41 3.39 3.84 10.60 10.51 17.77 28.42 2.65 3.16 5.23 5.29 8.36 8.96 3.05 3.56 6.52 6.35 9.56 10.34
HM3 8.18 11.03 19.20 21.80 42.01 62.88 2.85 6.44 11.52 12.08 20.43 26.59 6.02 7.86 13.26 14.00 23.10 30.32 3.69 4.42 6.44 6.68 10.10 11.31 2.59 4.06 5.09 5.42 7.80 8.44
HM4 13.77 14.48 27.20 32.06 57.26 174.90 2.40 5.99 13.86 15.60 29.53 33.56 2.90 4.35 10.61 10.68 18.59 27.31 3.09 3.61 5.41 5.44 7.64 10.29 3.35 3.81 5.01 5.78 9.85 11.69
HM5 18.31 18.92 29.57 33.00 69.58 105.54 6.24 9.44 17.61 18.23 29.89 32.02 5.33 8.30 15.39 17.23 30.07 80.24 4.49 4.75 6.96 7.11 9.80 10.04 3.44 4.35 5.43 5.75 8.49 8.98
LK1 23.01 41.75 88.56 106.06 226.68 432.40 9.66 17.73 29.82 30.69 48.27 55.33 9.01 15.30 29.41 35.20 82.82 110.17 8.21 8.48 12.53 14.51 23.64 74.93 5.23 6.74 9.78 9.90 12.50 19.97
LK2 17.27 19.35 43.00 52.57 130.16 277.09 5.64 6.67 13.43 14.30 25.75 36.56 5.30 6.30 11.62 13.63 25.28 40.24 3.86 4.05 5.20 5.81 8.86 11.24 3.40 4.08 5.21 5.88 9.44 9.83
PDA 7.15 9.13 19.82 19.92 29.77 47.00 6.08 17.34 32.04 31.55 46.96 67.67 4.10 4.96 8.82 8.64 12.57 13.49 2.75 2.94 4.93 6.51 11.42 22.57 0.12 0.17 6.03 5.40 8.01 8.48
PDB 3.11 5.21 13.30 13.22 21.18 21.80 6.12 8.11 18.78 18.84 31.13 35.91 2.80 3.31 5.30 5.45 7.81 8.69 2.12 2.34 3.66 4.60 7.82 9.31 2.77 3.33 5.03 5.02 6.68 11.32
PDC 11.51 11.71 16.95 17.86 27.57 28.25 8.94 12.91 26.66 26.78 45.05 46.31 4.51 4.61 6.78 6.60 8.38 8.52 3.26 3.31 4.88 4.89 6.69 7.35 0.18 3.15 5.22 5.54 8.03 8.40
PDD 3.04 3.24 12.16 11.62 18.84 22.48 6.79 7.22 18.02 19.20 36.43 39.50 3.30 3.35 5.03 5.45 8.37 8.93 2.32 2.41 3.96 4.28 6.28 7.21 0.12 0.12 4.45 3.98 6.22 6.39
PDE 10.68 10.84 15.63 16.42 25.89 26.94 8.24 8.47 25.74 24.11 42.49 43.74 3.12 3.35 4.95 5.28 7.57 7.97 2.00 2.65 4.21 4.18 5.31 5.89 3.93 4.24 4.94 5.04 6.13 6.30
PDF 2.83 3.48 10.03 9.93 17.83 20.08 8.35 8.85 17.53 17.45 26.56 39.71 2.70 2.89 5.15 5.04 6.85 7.82 2.02 2.12 3.20 3.76 6.10 6.52 0.11 2.83 4.72 4.55 6.01 6.53
PDG 7.38 7.45 11.09 12.13 19.37 21.92 9.48 10.19 19.32 20.05 30.81 31.45 3.92 4.13 4.94 5.11 6.62 7.17 2.67 2.67 3.95 4.12 6.05 6.85 3.82 4.03 5.11 5.08 6.21 6.51
PDH 3.85 5.86 11.57 11.80 21.00 26.82 8.71 9.72 17.09 18.97 36.33 41.21 2.81 3.09 4.34 4.62 6.71 7.64 2.15 2.22 4.04 4.02 6.18 7.61 2.87 3.18 4.82 4.90 6.74 6.87
Rice
Root Stem Leaf Husk Rice
Roots Stem Leaf Husk

Alterra-rapport 1823 111
Appendix 5 Theory behind the derivation of P50, P90 and P95 confidence levels of soil quality standards
In figure A5.1 the concept of the derivation of the P50, P90 and P95 Soil Quality Standard is shown.
Model prediction of Cd in rice
90 and 95% upper limits of prediction
Cd-
rice
Cd-soil or CaCl2
FQS
P50SQS
P90SQS
P95SQS
Figure A5.1 Conceptual representation of the meaning of the P50, P90 and P95 SQS
The relation between Cd in soil or soil solution (CaCl2) is represented by a solid line showing an increase in the Cd level in rice with increasing soil or soil solution Cd levels. As such this line represents the predicted Cd content in rice at a given pH and CEC in case of the soil model or at a given Zn content in case of the CaCl2 model. Based on the food quality standard (FQS) used (either 0.2 or 0.4 mg kg-1) the crossing of the model predictions and this FQS line represents the soil quality standard (P50 SQS). This means that at the pH and CEC given, the soil Cd content at the P50 SQS level will, on average result in a Cd level in rice equal to the FQS. Due to model uncertainty however, the actual Cd content in rice at the P50 SQS Cd level in soil will be higher (ór lower) than the average model predicted lines. The upper limit of the predicted levels is represented by the 90 and 95% lines. This means that at a given soil Cd content, 95 out of 100 samples of rice will be below the level represented by the 95 percentile line. The quality of the model obviously determines how large the difference between the average model predictions and the 90 or 95% limits are. In case of a perfect model, the 95% line is equal to the model predictions (no error of prediction). Obviously this is never the case for models as discussed here. The P50 SQS therefore implies that there is a chance of 50% that the real Cd level in rice still exceeds the FQS. On the other hand there is also a 50% chance that the real Cd level in rice will be below the FQS. To increase the security that the measured Cd level in rice is below the FQS with a confidence of 90 or 95% one has to decrease the SQS to the level where the 90% or 95% predictions lines cross the FQS line. Obviously, the P90 SQS and P95 SQS will be lower than the P50 SQS. Again, the

112 Alterra-rapport 1823
degree to which the P90 or P95 are below the P50 SQS depends on the model quality. In chapter 6 it was shown that for the data derived in this study P90 levels derived by the soil model or the CaCl2 model are roughly half the value of the P50 SQS.