heavy-section steel technology program
TRANSCRIPT

NUREG/CR-4219 ORNL/TM-9593/V10&N2 Vol. 10, No. 2
Heavy-Section Steel Technology Program
Semiannual Progress Report for April - September 1993
Manuscript Completed: January 1995 Date Published: May 1995
Prepared by W. E. Pennell
Oak Ridge National Laboratory Managed by Martin Marietta Energy Systems, Inc.
Oak Ridge National Laboratory Oak Ridge, TN 37831-6285
Prepared for Division of Engineering Technology Office of Nuclear Regulatory Research U.S. Nuclear Regulatory Commission Washington, DC 20555-0001 NRC Job Code B0119


DISCLAIMER
This report was prepared as an account of work sponsored by an agency of the United States Government. Neither the United States Government nor any agency thereof, nor any of their employees, make any warranty, express or implied, or assumes any legal liability or responsibility for the accuracy, completeness, or usefulness of any information, apparatus, product, or process disclosed, or represents that its use would not infringe privately owned rights. Reference herein to any specific commercial product, process, or service by trade name, trademark, manufacturer, or otherwise does not necessarily constitute or imply its endorsement, recommendation, or favoring by the United States Government or any agency thereof. The views and opinions of authors expressed herein do not necessarily state or reflect those of the United States Government or any agency thereof.
DISCLAIMER
Portions of this document may be illegible in electronic image products. Images are produced from the best available original document.

Abstract
The Heavy-Section Steel Technology (HSST) Program is conducted for the Nuclear Regulatory Commission by Oak Ridge National Laboratory (ORNL). The program focuses on the development and validation of technology for the assessment of fracture-prevention margins in commercial nuclear reactor pressure vessels. The HSST Program is organized in 12 tasks: (1) program management, (2) fracture methodology and analysis, (3) material characterization and properties, (4) special technical assistance, (5) fracture analysis computer programs, (6) cleavage-crack initiation, (7) cladding evaluations, (8) pressurized-thermal-shock technology, (9) analysis methods validation,
(10) fracture evaluation tests, (11) warm prestressing, and (12) biaxial loading effects on fracture toughness. The program tasks have been structured to emphasize the resolution fracture issues with near-term licensing significance. Resources to execute the research tasks are drawn from ORNL with subcontract support from universities and other research laboratories. Close contact is maintained with the sister Heavy-Section Steel Irradiation Program at ORNL and with related research programs both in the United States and abroad. This report provides an overview of principal developments in each of the 12 program tasks from April-September 1993.
m NUREG/CR-4219, Vol. 10, No. 2


Contents
Page
Abstract „ iii
List of Figures ix
List of Tables xiii
Preface xv
Executive Summary xvii
1 Program Management 1
References 4
2 Fracture Methodology and Analysis 7
2.1 Introduction 7 2.2 Biaxial Loading and Shallow-Flaw Effects on Crack-Tip Constraint and Fracture Toughness 7
2.2.1 Finite-Element Model of Cruciform Specimen 7 2.2.2 Application of the J-Q Method to Cruciform Specimens , 7 2.2.3 Application of J-Q Method to Shallow-Crack Specimens 12 2.2.4 J-Q Failure Locus 12 2.2.5 Fracture-Toughness Scaling Model (Dodds-Anderson) 12
2.2.5.1 Application of Scaling Model to Shallow-Crack Data 13 2.2.5.2 Application of Scaling Model to Cruciform Beam Data 15
2.2.6 Discussion of Crack-Tip Analyses 17
2.2.7 Cleavage Initiation Sites and Stress-Based Fracture Characterization 19
2.3 Dynamic Reinitiation 21
2.3.1 Introduction 21 2.3.2 Background 21 2.3.3 Analysis Program 25
2.4 Cleavage Behavior in Nuclear Vessel Steels 25
2.5 Elastic-Plastic Fracture Mechanics in Inhomogeneous Materials and Structures 26
2.5.1 Final Review Meeting 26
2.5.2 Summary of Results 27
References 27
3 Material Characterization and Properties 31
3.1 Margin Assessment for Fracture-Toughness Curves 31
3.1.1 Development of Transition Region Fracture-Toughness Testing Standard 31 3.1.2 Evaluation of the Bases for the ASME Ki c Curve 32
v NUREG/CR-4219, Vol. 10, No. 2

3.2 Characterization of Materials for Structural Tests 34
3.2.1 Effect of Notch Preparation on Fracture Toughness 35 3.2.2 Young's Modulus and Poisson's Ratio Measurement for CE-WP Material 36 3.2.3 Development of Material Specifications to Simulate Irradiated Material for the Biaxial
and Cladding Effects Tasks 40
3.3 Thermal Aging of Stainless Steel Cladding 40
3.4 J-R Curve Evaluations of A 302 Grade B Steel 41
References 41
4 Special Technical Assistance 43
4.1 Closed-Form Stress Intensity Factor Calculations for Reactor Pressure Vessels Under Constant Rate Temperature Change Loading 43
4.1.1 Background 43 4.1.2 Thermal Analysis 43 4.1.3 Stress Analysis „ 44 4.1.4 Polynomial Representation of Stresses Over the Crack Depth 44 4.1.5 Calculation of SIFs 44 4.1.6 Discussion 45
References 45
5 Fracture Analysis Computer Programs 47
5.1. FAVOR 47 5.2 Benchmarking Exercises 47
5.3 Dynamic Crack Arrest 48
References 49
6 Cleavage Crack Initiation 51
6.1 Shallow-Crack Fracture-Toughness Testing 51
6.1.1 HSST Shallow-Crack Fracture-Toughness Testing Program 51 6.1.2 Shallow-Crack Full-Thickness Clad Beam Tests 51
51 6.2 Thickness Effects on Fracture 51
6.2.1 Constraint Evaluation of Data 52 6.2.2 Statistical Adjustment to Data 54 6.2.3 Comparison of Constaint and Statistical Methods 56
6.3 Clad Cylinder Thermal-Shock Testing 56
References 58
7 Cladding Evaluations 61
8 Pressurized-Thermal-Sbock Technology 63
vi NUREG/CR-4219, Vol. 10, No. 2

8.1 Stress-Intensity-Factor Influence Coefficients 63 8.2 Introduction 63 8.3 Superposition Technique 63 8.4 Calculation of SIFICs ( K £ ) 64 8.5 Verification of SIFICs (Kj) and Superposition Technique 65 8.6 Comparison with Results Produced by Other Investigators 65 8.7 Tabulation of SIFICs 67
References 76
9 Analysis Methods Validation 77
9.1 Project FALSIRE 77 9.2 FALSIRE II 78 9.3 Summary of Proposed FALSIRE II International Reference Experiments 79
9.3.1 AEA Technology—Fourth Spinning Cylinder Test (SC-4) 79 9.3.2 Prometey—Sixth PTS Test (PTS1/6) 83 9.3.3 EdF—Clad Four-Point Bending Beam Tests (DD2 and DSR3) 85 9.3.4 MPA—PTS Tests (NKS-5 and-6) 86
9.3.4.1 NKS-5 87 9.3.4.2 NKS-6 88
9.3.5 ORNL—Biaxially Loaded Cruciform Beams (BB^l) 88
94 Closure 91
References 91
10 Fracture Evaluation Tests 93
10.1 FuU-Thickness Clad Beam Tests 93 10.2 Thermal-Shock Facility and Operation Upgrades 94 10.3 Finite-Length Raw Validation Tests 94 10.4 Material Requests 103
References 103
11 Warm Prestressing 105
12 Biaxial Loading Effects on Fracture Toughness 107
12.1 Development-Phase Test Matrix 107 12.2 Experimental Results and Data Reduction Procedures 108
12.2.1 Initiation Site Location 108 12.2.2 Load vs Deflection Behavior 110 12.2.3 Toughness Estimation Techniques , I l l 12.2.4 Comparison of Test and Analysis Results 114
12.3 Interpretation of Results 115
12.3.1 Fracture-Toughness Results 115 12.3.2 Evaluation of Test Specimen and Fixture 122
12.4 Future Testing 122
References 123
NUREG/CR-4219, Vol. 10, No. 2 vii


List of Figures
Figure Page
1.1 Level 1 breakdown structure for HSST Program 1
1.2 Resources applied to HSST Program R&D tasks 2
2.1 Cruciform bend specimen used in HSST biaxial testing program: (a) dimensions of cruciform specimen and {b) detail of crack plane 8
2.2 (a) Finite-element model for local crack-tip analyses of cruciform bend specimen, (b) test section region of finite-element model for cruciform bend specimen, (c) highly refined crack-tip region of finite-element model for cruciform bend specimen, and (d) finite-element model with expanded region of refinement near the crack tip for analysis of uniaxially loaded cruciform specimen 9
2.3 Variation of Q with normalized distance ahead of the crack tip,X = Omm, uniaxial loading 10
2.4 Variation of Q with normalized distance ahead of the crack tip, X = 0 mm, biaxial 0.6:1 loading 10
2.5 J-Q trajectories at X = 0 mm for normalized distance rao/J = 2 11
2.6 J-Q trajectories at X = 0 mm for normalized distance rcr/J = 5 11
2.7 J-Q failure locus for A 533 grade B class 1 steel at T - R T N D T - 10°C 13
2.8 HSST shallow-crack fracture-toughness results as function of normalized temperature T - R T N D T • • I 4
2.9 . Toughness data at T - RTNDT = -25 to -10°C as function of crack depth 14
2.10 Ko data at T - RTNDT = -25 to -10°C as function of crack depth 15
2.11 Determination of finite-body to SSY toughness ratio from stresses ahead of crack tip 16
2.12 Finite-body to SSY toughness ratio as function of normalized distance ahead of crack tip 17
2.13 Sn/Se stress ratios predicted at crack-tip plastic zone boundary by modified Inglis equations for plane stress, plane strain, and 1:1 biaxial-loading boundary conditions 18
2.14 Schematic defining fractographic variables 19
2.15 (a) Distribution of opening-mode stress component for SENB specimen with a/W = 0.1 as function of applied load up to crack initiation; (b) distribution of opening-mode stress component for biaxial shallow-crack cruciform specimen; (c) toughness vs normalized distance to initiation site for shallow-and deep-crack SENB specimens; and (d) toughness vs normalized distance to initiation site for uniaxial and biaxial shallow-crack cruciform specimens 20
2.16 Schematic representation of shift of CVN transition temperature and upper-shelf level due to strain rate (from Barsom and Rolfe20) 22
2.17 Data due to Wilson et al. 2 1 showing influence of loading rate on fracture toughness of 1018 cold-rolled structural steel (from Freund23) 22
2.18 Kjd vs Kid f° r A 533 B at several temperatures as reported by Shabbits1^ (from
Keeney-Walker and Bass2 7) 23
2.19 Time history from Keeney-Walker and Bass 2 7 analysis 25
2.20 Schematic pictures of cleavage embryo formation 26 ix NUREG/CR-4219, Vol. 10, No. 2

2.21 Stress as function of plastic strain-rate at several temperatures for a-iron (Ref. 29) 26
3.1 Master curve (solid line), 5% confidence on master curve (dashed line), ASME lower-bound Ki c curve (dotted line), andEPRI Ki c data 31
3.2 Master curve and 5% confidence curve developed from six 1/2T compact specimens and drop-weight
NDT tests on Midland weld WF-70 and EPRI Ki c data 32
3.3 EPRI Kic data and three lower-bound curves 33
3.4 Plot of entire EPRI data bank showing all 174 data values 33
3.5 Three lower-bound curves shown in Fig. 3.3 with EPRI and HSSI Fifth Irradiation Series Kj c data 34
3.6 Results of CVN impact energy of specimens in L-S orientation from A 533 grade B class 2 material (HSST Plate 14) in as-received condition 35
3.7 Stress-strain data for all T-orientation specimens from WP-CE material used in initial biaxial beam tests 37
3.8 Magnification of typical stress-strain yielding behavior of WP-CE material showing upper and lower yield points 37
3.9 Comparison of stress-strain curves in longitudinal and transverse orientations at room temperature for WP-CE material 38
3.10 Yield and ultimate tensile strengths as function of temperature for WP-CE material 39
3.11 Young's modulus as function of temperature as experimentally determined, compared to dynamically measured value at room temperature and other sources indicated 40
6.1 Deep-crack toughness data as function of normalized temperature (T- NDT) 52
6.2 Low transition toughness data at T - NDT = -10°C as function of specimen thickness 52
6.3 Data at T-NDT = -10°C, meeting D-A 2-and 3-D SSY criteria as function of thickness 53
6.4 Uncorrected and corrected data at T - NDT = -10°C as function of specimen thickness using 2-D D-A constraint correction 54
6.5 Median and 95% confidence level curves with Kjc(med) values, ASME lower bound, and HSST 13A characterization curves 55
6.6 Median and 95% confidence level curves with IT-equivalent toughness data and ASME
lower-bound curve 55
6.7 Data at T - NDT = -10°C adjusted to a IT-size equivalent as a function of specimen thickness 55
6.8 Schematic of finite-length flaw cruciform specimen 58
8.1 Axially oriented finite-length semielliptical flaw on inner surface of cylinder 64
8.2 Finite-element model of clad cylinder 65 8.3 Comparison of Ki values calculated by FAVOR (SIFICs and superposition) and direct finite-element
solutions for axially oriented 6:1 and 10:1 flaws (a/t = 0.075 and 0.5, respectively) in clad PWR vessel during severe thermal transient 66
8.4 SIFICs for axially oriented semielliptical flaws (a/t = 0.2) on inner surface of cylinder: (a) 2:1 aspect ratio; (fe) 10:1 aspect ratio 66
8.5 SIFICs for an axialty oriented semielliptical flaw with a/t = 0.5 and 6:1 aspect ratio 67
x NUREG/CR-4219, Vol. 10, No. 2

9.1 Specimen geometry for the fourth spinning cylinder experiment (SC-4; AEA Technology) 82
9.2 Comparison of fracture surfaces and ultrasonic profiles for two defects: (a) 60-mm crack depth and (b) 40-mm crack depth ....... 83
9.3 Sixth PTS experiment (PTS 1/6; Prometey Institute): (a) cylinder geometry, (b) detail of crack
plane, and (c) test facility 84
9.4 Clad bend-bar specimen containing an underclad crack (DD2 and DSR3; EdF) 86
9.5 Specimen geometry for fifth PTS experiment (NKS-5; MPA) 87
9.6 Specimen geometry for sixth PTS experiment (NKS-6; MPA) 89
9.7 Crucifonn bend specimen (BB-1 through -5; ORNL) 90
10.1 Von Mises contour plots for biaxially (1:1) loaded crucifonn plate with four equal-length diffusion slots in each load arm 96
10.2 Von Mises contour plots for biaxially (1:1) loaded cruciform plate with four equal-length diffusion slots in each load arm and center 5.1-cm-long flaw 97
10.3 Von Mises contour plots for biaxially (1:1) loaded crucifonn plate wim four diffusion slots in each load arm; the inner diffusion slots are shorter by 0.5 cm 98
10.4 Von Mises contour plots for biaxially (1:1) loaded cruciform plate with four diffusion slots in each load arm and center 5.1-cm-long flaw; the inner diffusion slots are shorter by 0.5 cm 99
10.5 Calculated SIF along flaw front as function of angle from surface for family of flaws ranging from semicircular (1.27-cm radius) to semielliptic (1.27 cm deep by 5.08 cm long) for beam in bending 100
10.6 Calculated SIF along flaw front as function of angle from surface for family of flaws ranging from semicircular (1.52-cm radius) to semielliptic (1.52 cm deep by 3.81 cm long) for beam in bending 100
10.7 Preliminary test section design details for laboratory-scale finite-length flaw specimens 101
10.8 Comparison of fracture toughness measured using ITCT specimens with different flawing techniques 102
12.1 Slot configurations used in analyses of cruciform bend specimen: (a) uniform slots on test section boundary, (b) outer slots extended inward by 8.9 mm (0.35 in.) across test section boundary, (c) center slot contracted away by 5.1 mm (02 in.) from test section boundary, and (d) a superposition of configurations (b) and (c) 108
12.2 Load vs CMOD response for all four clip gages for specimen BB-5 109
12.3 Load vs potentiometer response for all four potentiometers on specimen BB-5 109
12.4 Load vs LLD response for all five specimens 110
12.5 Load vs CMOD response for all five specimens I l l
12.6 Variation of T/J with U pi for specimen BB-2 113
12.7 Variation of Tipj with U pi for specimens BB-4,-5, and-1 113
12.8 Variation of T^J with Api for specimen BB-2 114
12.9 Variation of i\% with Api for specimen BB-4, -5, and -1 114
12.10 Pretest and posttest material properties 115
xi NUREG/CR-4219, Vol. 10, No. 2

12.11 (a)-(c) Posttest 3-D finite-element model of cruciform specimen 116
12.12 Comparison of measured load vs LLD response for specimen BB-2 with computed response 117
12.13 Comparison of measured load vs CMOD response for specimen BB-2 with computed response 117
12.14 Computed variation of Kj along crack front for specimen BB-2 118
12.15 Comparison of measured load vs LLD response for specimens BB-4, -5, and -1 with computed response 118
12.16 Comparison of measured load vs CMOD response for specimens BB-4, -5, and -1
with computed response 119
12.17 Computed variation of Kj along crack front for specimens BB-4, -5, and -1 119
12.18 Biaxial and uniaxial shallow-crack toughness data as function of normalized temperature 120
12.19 Uniaxial and biaxial toughness data as function of aack depth at T-RTNE>T = - 1 0 ° C 120
12.20 Toughness data for deep-and shallow-crack specimens as function of load ratio at T - R T N D T = - 1 0 ° C 121
xn NUREG/CR-4219, Vol. 10, No. 2

List of Tables
Table Page
2.1 SSY toughness results for the uniaxial and biaxial cruciform specimens 18
2.2 Cleavage embryo size estimates for several values of local stress, c, and resistance to spreading 26
3.1 Tensile properties of A 533 grade B class 1 material (WP-CE) used in the first series of biaxial tests 38
8.1 SIFICs for axially oriented finite-length semielliptical flaws on inner surface of a cylinder: Ri/t = 10 and a/t = 0.01 , 68
8.2 SIFICs for axially oriented finite-length flaws on inner surface of a cylinder: Ri/t = 10 and a/t = 0.0184 69
8.3 SIFICs for axially oriented finite-length semielliptical flaws on inner surface of a cylinder: R^t = 10 and a/t = 0.05 70
8.4 SIFICs for axially oriented finite-length semielliptical flaws on inner surface of a cylinder: Rj/t = 10 and a/t = 0.075 71
8.5 SIFICs for axially oriented finite-length semielliptical flaws on inner surface of a cylinder Ri/t = 10 and a/t = 0.1 72
8.6 SIFICs for axially oriented finite-length semielliptical flaws on inner surface of a cylinder: Rj/t = 10 and a/t = 0.2 73
8.7 SIFICs for axially oriented finite-length semielliptical flaws on inner surface of a cylinder: R^t = 10 and a/t = 0.3 74
8.8 SIFICs for axially oriented finite-length semielliptical flaws on inner surface of a
cylinder: Rj/t = 10 and a/t = 0.5 75
9.1 I^rge-scale fracture experiments analyzed in Phase I of CSNI/FAG Project FALSIRE 77
9.2 Large-scale reference fracture experiments proposed for FALSIRE II 78 9.3 Schedule of events for Phase II of Project FALSIRE 79
9.4 Summary of test objectives of large-scale experiments used in FALSIRE II 80
9.5 Summary of FALSIRE II reference experiments 81
10.1 Matrix of first series of FTCB tests 93
12.1 Test matrix for development phase of biaxial testing program 108
12.2 Location of initiation sites for cruciform specimens 110
12.3 Summary of results of the development phase of the biaxial testing program 112
12.4 Summary of verification phase of biaxial testing 122
xm NUREG/CR-4219, Vol. 10, No. 2


Preface
The Heavy-Section Steel Technology (HSST) Program, which is sponsored by the Nuclear Regulatory Commission, is an engineering research activity devoted to extending and developing the technology for assessing the margin of safety against fracture of the thick-walled steel pressure vessels used in light-water-cooled nuclear power reactors. The program is being carried out in close cooperation with the nuclear power industry. This report covers HSST work performed in April— Septemberl993. The work performed by the Oak Ridge National Laboratory (ORNL) and by subcontractors is managed by the Engineering Technology Division (ETD) of ORNL. Major tasks at ORNL are carried out by the ETD and the Metals and Ceramics Division. The following is a list of previous progress reports on this program:
ORNL-4176 ORNL-4315 ORNL-4377 ORNL-4463 ORNL-4512 ORNL-4590 ORNL-4653 ORNL-4681 ORNL-4764 ORNL-4816 ORNL-4855 ORNL-4918 ORNL^4971 ORNL/TM-4655 (Vol. II) ORNL/TM-4729 (Vol. II) ORNL/TM-4805 (Vol. II) ORNL/TM-4914 (Vol. II) ORNL/TM-5021 (Vol. II) ORM/TM-5170 ORNL/NUREG/TM-3 ORNL/NUREG/TM-28 ORNL/NUREG/TM-49 ORNL/NUREG/TM-64 ORNL/NUREG/TM-94 ORNL/NUREG/TM-120 ORNL/NUREG/TM-147 ORNL/NUREG/TM-166 ORNL/NUREG/TM-194 ORNL/NUREG/TM-209 ORNL/NUREG/TM-239 NUREG/CR-0476 (ORNL/NUREG/TM-275) NUREG/CR-0656 (ORNL/NUREG/TM-298) NUREG/CR-0818 (ORNL/NUREG/TM-324) NUREG/CR-0980 (ORNL/NUREG/TM-347) NUREG/CR-1197 (ORNL/NUREG/TM-370)
NUREG/CR-1305 (ORNL/NUREG/TM-380) NUREG/CR-1477 (ORNL/NUREG/TM-393) NUREG/CR-1627 (ORNL/NUREG/TM-401) NUREG/CR- 1806 (ORNL/NUREG/TM-419) NUREG/CR-1941 (ORNL/NUREG/TM-437) NUREG/CR- 2141, Vol. 1 (ORNL/TM-7822) NUREG/CR-2141, Vol. 2 (ORNUTM-7955) NUREG/CR-2141, Vol. 3 (ORNLrtM-8145) NUREG/CR-2141, Vol. 4 (ORNL/TM-8252) NUREG/CR-2751, Vol. 1 (ORNL/TM-8369/V1) NUREG/CR-2751, Vol. 2 (ORNL/TM-8369/V2) NUREG/CR-2751, Vol. 3 (ORNL/TM-8369/V3) NUREG/CR-2751, Vol. 4 (ORNL/TM-8369/V4) NUREG/CR-3334, Vol. 1 (ORNL/TM-8787/V1) NUREG/CR-3334, Vol. 2 (ORNL/TM-8787/V2) NUREG/CR-3334, Vol. 3, (ORNL/TM-8787/V3) NUREG/CR-3744, Vol. 1 (ORNL/TM-9154/V1) NUREG/CR-3744, Vol. 2 (ORNL/TM-9154/V2) NUREG/CR-4219, Vol. 1 (ORNL/TM-9593/V1) NUREG/CR-4219, Vol. 2 (ORNL/TM-9593/V2) NUREG/CR-4219, Vol. 3, No. 1 (ORNL/TM-9593/V3&N1) NUREG/CR-4219, Vol. 3, No. 2 (ORNL/TM-9593/V3&N2) NUREG/CR-4219, Vol. 4, No. 1 (ORNL/TM-9593/V4&N1) NUREG/CR-4219, Vol. 4, No. 2 (ORNL/TM-9593/V4&N2) NUREG/CR-4219, Vol. 5, No. 1 (ORNL/TM-9593/V5&N1) NUREG/CR-4219, Vol. 5, No. 2 (ORNL/TM-9593/V5&N2) NUREG/CR-4219, Vol. 6, No. 1 (ORNL/TM-9593/V6&N1) NUREG/CR-4219, Vol. 6, No. 2 (ORNL/TM-9593/V6&N2) NUREG/CR-4219, Vol. 7, No. 1 (ORNL/TM-9593/V7&N1) NUREG/CR-4219, Vol. 7, No. 2 (ORNL/TM-9593/V7&N2) NUREG/CR-4219, Vol. 8, No. 1 (ORNLTM-9593/V8&N1) NUREG/CR-4219, Vol. 8, No. 2 (ORNLTM-9593/V8&N2) NUREG/CR-4219, Vol. 9, No. 1 (ORNL/TM-9593/V9&N1) NUREG/CR-4219, Vol. 9, No. 2 (ORNL/TM-9593/V9&N2) NUREG/CR-4219, Vol. 10, No. 1 (ORNL/TM-9593/V10&N1)
xv NUREG/CR-4219, Vol. 10, No. 2


Executive Summary W. E. Pennell
The Heavy Section Steel Technology (HSST) Program is conducted for the Nuclear Regulatory Commission (NRC) by Oak Ridge National Laboratory (ORNL). The program focus is on the development and validation of technology for the assessment of fracture prevention margins in commercial nuclear reactor pressure vessels (RPVs). Prior phases of the program generated the required technology, which was then transferred to national consensus codes and standards. Subsequent large-scale fracture tests have revealed the need for further development and refinement of the technology. Irradiation-effects research and reactor vessel surveillance programs have identified further areas in which extension of the fracture technology is required. Program activities are structured to provide the necessary fracture technology developments and to support the NRC in the licensing application of that technology. RPV licensing issues directly influenced by this technology include (1) definition of pressure-temperature (P-T) curves and low temperature overpressure protection (LTOP) relief valve set points, (2) evaluation of vessel integrity under pressurized-thermal shock (PTS) transient loading, (3) safety evaluations of vessels containing material with low-upper-shelf (LUS) Charpy energy, and (4) data transfer from small-scale surveillance specimens for full-scale application.
1 Program Management A team from Electricite" de France visited ORNL on April 9,1993, for discussions with HSST Program personnel on topics relating to reactor vessel PTS analysis. The French team was particularly interested in the FAVOR program and in the test programs investigating the effects of constraint (shallow flaws and biaxial loading) on fracture toughness. A team comprised of the HSST and Heavy-Section Steel Irradiation (HSSI) Program managers visited European fracture technology research centers and one nuclear reactor fabrication facility over the period May 31, 1993, to June 11,1993. A number of fracture technology research topics of mutual interest were identified as a result of these visits. They represent areas of potential future interaction that could benefit the HSST Program. In a follow-up action, a team from the Nuclear Research Institute in Rez, in the Czech Republic, visited ORNL for a briefing and discussions on the HSST Program biaxial fracture toughness testing technology.
The 1993 American Society of Mechanical Engineers (ASME) Pressure Vessel and Piping (PVP) Division Conference included eight sessions on pressure vessel integrity,
organized by an international team coordinated by the HSST Program. The program provided the editor for the volume of conference proceedings entitled "Pressure Vessel Integrity-1993." During the current reporting period, HSST Program personnel published 4 reports and 15 papers and gave 19 presentations at technical society and NRC-sponsored national and international meetings.
2 Fracture Methodology and Analysis The focus of this task is on the development and validation of dual-parameter stress-based correlations to reflect the effect of crack-tip constraint on the fracture toughness of pressure vessel steels. A single parameter characterization of the temperature-dependent fracture toughness (Kjc) of pressure vessel steels is used in the present generation of codes, standards, and regulatory requirements. Kj c provides an adequate description of the fracture toughness of materials only when a limiting condition of constraint exists at the crack tip. A second parameter is required to characterize fracture toughness when crack-tip constraint departs from the limiting condition. Crack-tip constraint conditions of particular concern in RPV structural integrity evaluations are those associated with shallow flaws and biaxial loading.
Work continued on the evaluation of the Dodds-Anderson scaling model (D-A) and the O'Dowd and Shih constraint characterization (J-Q). Both methodologies incorporate a stress-based characterization of the conditions governing cleavage crack initiation. Elastic-plastic finite-element analyses of the biaxial cruciform test specimen were used to define crack-tip stress fields under both uniaxial and biaxial loading. The analyses showed a nonuniform distribution of hydrostatic stress in the crack-tip stress field under uniaxial fracture loading. Nonuniformity of the crack-tip hydrostatic stress field is incompatible with the assumptions upon which the J-Q methodology is based. A more uniform distribution of the crack-tip hydrostatic stress was predicted under biaxial fracture loading. The differing results were traced to the effect of interaction between the crack-tip and beam-bending inelastic stress fields. The spatial variation of the hydrostatic stress (directly related to Q) appears to seriously compromise usefulness of the J-Q methodology for characterizing constraint effects in three-dimensional (3-D) structures. The J-Q methodology worked well, however, when applied to the analysis of single-edge-notched-bend (SENB) specimens that failed under conditions of plane strain crack-tip constraint
xvii NUREG/CR-4219, Vol. 10, No. 2

Executive The D-A scaling model is simple to use and worked well when applied to the SENB data set identified above. Application of the D-A scaling model to the biaxial test results, however, produced fracture toughness constraint correction factors that varied unacceptably as a function of the distance ahead of the crack tip, selected as the reference distance for scaling the crack-tip stress fields. Investigation is continuing into the causes for the problems encountered with 3-D applications of both the J-Q and D-A methodologies for dealing with constraint effects. An important element of this investigation involves the use of crack-initiation site location data from fractographic examination of broken test specimens to evaluate the validity of the stress-based assumptions upon which the J-Q and D-A methodologies are based.
Response of an RPV wall to crack extension is slow when compared wiui the speed of crack propagation, because of inertia effects. This disparity in response times can produce a number of crack initiation and arrest events between the first initiation and the final arrest of a crack propagating in a pressure vessel. Some researchers have postulated that consideration of the dynamic initiation and arrest events, occurring within the crack propagation event, could result in the prediction of reduced vessel wall penetration at stable arrest. The dynamic crack initiation toughness testing program was initiated to provide the dynamic fracture toughness (Kid) data required to evaluate the stability of a crack arrested by dynamic effects. Analyses have been performed to determine the stress intensity factor loading (Kid) rate relevant to crack propagation during a PTS event KM rates determined from these analyses were in the range 10 < Kid < 105. Results from these analyses will be incorporated into the test specification for the dynamic fracture-toughness tests. Additional analysis of the dynamic response of a reactor vessel with a propagating crack are to be performed by the University of Maryland (UM), under an HSST Program subcontract The UM analysis will determine the effects of structural damping and fluid-structure interaction on K^. Results from the UM analysis will also be incorporated into the dynamic fracture-toughness test specification.
Work continued at UM on the investigation of microscopic features important to the analytical modeling of crack initiation and propagation behavior in pressure vessel steels. The investigation uses scanning electron microscopy and optical fractography, coupled with theoretical analysis, to develop a fundamental understanding of the fracture process. A previous phase of this work had demonstrated that high local strain rates must be present to sustain cleavage crack propagation. In the current reporting period, estimates were made of the crack initiation embryo size required for cleavage initiation. The embryo size is a
function of the local stress and the resistance to crack propagation.
A final review of results from the Japanese investigation into Elastic-Plastic Fracture Mechanics in Inhomogeneous Materials (EPI) was completed. The objective for the investigation was to develop analysis techniques for predicting ductile crack extension in RPV welds, where mechanical and metallurgical inhomogeneities may exist. The research team concluded that inhomogeneities in prototypical RPV welds were sufficiently small that analysis techniques developed for homogeneous materials produced acceptable estimates of ductile crack extension in pressure vessel welds.
3 Material Characterization and Properties
Work continued on an assessment of margins incorporated into the fracture toughness curves of Appendix G of Sect. XI of the American Society of Mechanical Engineers (ASME) Boiler and Pressure Vessel Code. A review of the data base for the crack initiation toughness (Kjc) curve showed that some data points produced at very low test temperatures had not been considered in the formulation of the lower-bound curve currently incorporated in the Code. It was concluded that this omission could have influenced the asymptotic value incorporated into the equation used to define the Code curve. Results from this evaluation were made available to the ASME Section XI Working Group on Flaw Evaluation and were considered by that group when they proposed the recently adopted revision to the equation for the Code Ki c curve.
Weibull statistical methods were used to fit a master curve to the data in the ASME Code Ki c curve data base. A 5% curve derived from the master curve was shown to bound an appropriate number of the data points. A "master curve" was generated using a small data set generated using 1/2T compact test (CT) specimens. A 5% curve derived from this master curve was also shown to bound an appropiate number of the data points in the ASME Section XI Appendix G data base. This demonstration supports the validity of the analysis methods incorporated into the standard for "Fracture Mechanics Testing in the Transition Temperature Range," which is currently under development in Committee E08 of the American Society for Testing and Materials (ASTM).
Materials characterization studies were conducted in support of ongoing HSST fracture-toughness testing programs. Cracks in the biaxial test specimens are currently sharpened by fatigue precracking. Tests were made to determine
NUREG/CR-4219, Vol. 10, No. 2 xviii

Executive if alternate, lower cost, crack-sharpening techniques could produce acceptable results. Crack-sharpening techniques evaluated were (1) electron beam discharge machining of the notch and (2) electron beam welding and hydrogen charging. Variability of the fracture-toughness results obtained using the alternate crack-sharpening techniques was found to be unacceptably high. The fatigue crack-sharpening technique will be retained for future biaxial fracture-toughness tests.
Characterization tests were performed on the A 533 B plate material obtained from Combustion Engineering and used in the initial series of biaxial fracture-toughness tests. A significant finding from these tests was that the material had pronounced upper and lower yield points. The trend of increasing stress with increasing strain resumes at a strain of -1.5%. Accurate modeling of this stress-strain behavior can be important to the accurate analysis of crack-tip stress fields.
An objective for the biaxial fracture-toughness testing program is to simulate some of the important effects of irradiation in the test material. Work was initiated on the development of a heat treatment that would produce prototypical Charpy energy and yield stress properties in the test material. The study of thermal aging effects on the tearing toughness of stainless steel weld material continued. Aging of test specimens at 288CC for 20,000 h was completed. Prototypical A 302 B pressure vessel steel plate material was received from the General Electric Company. Tearing toughness tests on this material will be performed to determine if the anomolous tearing toughness characteristics reported by Materials Engineering Associates for A 302 B material are present in the material used to construct early RPVs. Characterization tests were initiated on the test material.
4 Special Technical Assistance Constant rate heatup and cooldown is characteristic of transients used to define the pressure-temperature curve for an RPV. Methods derived from computational analysis are currently in use to calculate stress intensity factors (SIFs) for postulated finite-length surface flaws in a pressure vessel under constant rate thermal transient loading. In the current reporting period, closed-form solutions were generated for the thermal stress distribution in an RPV wall during a constant rate thermal transient. Polynomial fits to the thermal stress distribution were then used to generate an expression for the thermal stress contribution to the stress intensity factor for finite-length surface flaws. This expression can be used to provide independent checks on SIF values calculated using the numerically based techniques. Results from this work were made available to
members of the ASME Working Group on Flaw Evaluation.
5 Fracture Analysis Computer Programs
Work continued on development of the Fracture Analysis of Vessels, Oak Ridge (FAVOR) computer code. FAVOR is an advanced code for the analysis of RPV failure rates under PTS transient loading. The code is being developed in a manner that will make an executable version of FAVOR available to users without making the source deck available to mem. This feature makes possible configuration control of me code. In the current reporting period, influence coefficients for infinite-length surface flaws were integrated into FAVOR, and verification checks were completed. Provision for both detailed and simplified definitions of the PTS transients were also added. Preparation of the FAVOR users guide was 75% completed. HSST Program personnel maintained active participation in the PTS Analysis Methods Benchmarking Project sponsored jointly by the NRC and the Electric Power Research Institute.
A study was made of the impact of including dynamic influences on crack arrest in a probabilistic PTS analysis. Dynamic effects were found to have a significant influence on the conditional probability of vessel failure only when the PTS transient under consideration included a reheat phase. The study was made to assess the utility of a dynamic fracture-toughness testing program to obtain fracture-toughness data appropriate to assessing the crack reinitiation potential following a dynamic crack arrest. Evaluation of results from this study is continuing.
6 Cleavage Crack Initiation This task provides planning input to fracture technology development tests and evaluates results from those tests. The influence of specimen thickness (B) on the fracture toughness obtained from deep-flaw specimens was evaluated in the current reporting period. The evaluation covered a number of techniques that have been proposed to reflect the effect of specimen thickness (constraint) on fracture toughness. Techniques evaluated included two versions of the technique included in the standard ASTM-399, two versions of the D-A constraint correction technique, and an empirical adjustment proposed by Hagiwara.
Fracture-toughness data from 25-, 50-, 100- and 150-mm thick specimens, fabricated from A 533 B material, were included in the study. All of the data were generated at test temperatures corresponding to the lower transition
xix NUREG/CR-4219, Vol. 10, No. 2

Executive temperature range for the material. The material characterization curve was used to adjust data generated at normalized temperatures in the range -25°C < T - NDT < +5°C to a common normalized temperature of T - NDT = -10°C. A mean line through the adjusted data showed the mean fracture toughness to decrease by 14% as the test specimen thickness increased from 25 to ISO mm.
The study evaluated (1) criteria proposed to determine when fracture-toughness data can be considered specimen-size-independent and (2) schemes proposed for adjusting fracture-toughness data that do not satisfy the requirements for size-independence. The various screening techniques proposed for assessing size independence of fracture-toughness data produced results that varied considerably. This result indicates that further development of the data screening techniques may be required. A modified form of the Irwin Pi c correction appeared to work well and was easy to apply. It produced size effects corrections that were consistent with the ASME Code fracture-toughness data base. The D-A correction also worked well.
A statistical evaluation of the transition-range deep flaw fracture-toughness data, using a three-parameter Weibull fit to the data together with a master curve, was also completed. This approach to characterization of size effects in fracture-toughness data is based upon the weakest link theory. The weakest link theory translates into an increased potential for fracture as the length of the crack front, and therefore the potential for a lower-bound weak link to be located within the length of the crack front, increases as the specimen size increases. The mean curve and the ± 2 o confidence limit curves derived using this method were a very good fit to the data and did not violate the ASME Code lower-bound fracture-toughness curve. Preliminary planning was completed to define the test specimen configuration and the test matrix for an initial series of cruciform beam tests in the experimental investigation of biaxial loading and cladding effects on the fracture behavior of finite-length surface flaws under simulated PTS loading.
7 Cladding Evaluations No activity in the current reporting period.
8 PTS Technology This task generates the fracture technology advances that are incorporated into the FAVOR computer program for the structural integrity evaluation of RPVs, under PTS loading. In the current reporting period, stress-intensity-factor influence coefficients (SMCs) were generated for a range of finite-length semielliptic axial surface flaws in a
clad RPV, with an internal radius-to-wall thickness ratio of 10. The SIFICs were generated using a finite-element computer program (AB AQUS), which has been shown to conform with the quality assurance requirements for nuclear plant equipment (NQA-1). SIFICs were generated for a number of locations around the crack front of each semielliptic flaw, for each of two cladding thicknesses. Incorporation of this data base of SIFICs into the FAVOR program will give it the capability for rapid and efficient assessment of the impact of finite length axial surface flaws on the. probability of through-wall failure of pressurized-water reactor (PWR) RPVs under PTS loading.
Generation of SIFICs for circumferential finite length flaws, and for other vessel internal-radius to wall-thickness ratios, is scheduled for subsequent phases of the program.
SIFICs for semielliptical longitudinal surface flaws were generated for flaw aspect ratios (2c/a) of 2,6, and 10. SIFICs were generated covering the dimensionless flaw-depth/vessel-thickness (a/w) range 0.01<a/t<0.5. The influence coefficients are dimensionless and can, therefore, be applied to analyses performed in either English or SI units. Separate SIFICs were generated for each of two typical cladding thicknesses. This feature permits the effect of the discontinuity in tbe vessel wall stress distribution at the clad-base material interface to be reflected in the SIF calculation. Quality assurance verification checks were made by comparing SIFs calculated by the FAVOR computer program, using the SIFICs, with SIFs calculated using both an NQA-1 qualified finite-element program, and published SIFs that are available for a subset of the flaw geometries covered by the work reported here. Good agreement was obtained between SIFs generated using tbe influence coefficients and those generated using the independent methods. Incorporation of these SIFICs into the FAVOR computer program increases the accuracy of a probabilistic analysis of reactor vessel integrity under PTS transient loading and decreases the time required to perform that analysis.
9 Analysis Methods Validation This task is concerned with the validation of fracture analysis methods by means of their application to large-scale fracture experiments. The task objectives are accomplished by means of participation in an international project for the Fracture Analysis of Large-Scale Reference Experiments (FALSIRE). The focus of the first phase of project FALSIRE was on PTS experiments involving both pressure and thermal stresses. The Phase 1 FALSIRE results revealed problems with ductile tearing analysis methods when applied to complex, but prototypical, vessel loading conditions. The objective for the second phase of Project
NUREG/CR-4219, Vol. 10, No. 2 xx

Executive FALSIRE is to obtain an understanding of the reasons for the analysis methods problems revealed in the first phase. The focus, in phase 2 of the project, is on the response of shallow cracks subjected to mechanical and thermal stresses at temperatures in the transition range. Special emphasis is placed on experiments in which the mode of failure involved a transition from ductile tearing to cleavage fracture.
The following seven large-scale fracture experiments were selected for analysis in phase 2 of the project • Spinning cylinder experiment SC-4 from the United
Kingdom
• PTS experiment PTS 1/6 from Russia
• Subclad crack experiments DD27&DSR3 from France
• PTS experiments NKS-5&6 from Germany
• Biaxial bending experiment BB-4 from the United States
The tentative schedule of major milestones for phase 2 of Project FALSIRE is for problem statements to be distributed, by November 1993, a review in the mil of 1994 of analysis results generated by the project participants, followed by publication of results from FALSIRE n, in NUREG format, in calendar year 1995. During this reporting period, organization responsibility for FALSIRE It was transferred to a newly created NRC program for International Programs Support (JCN No. B5703).
10 Fracture Evaluation Tests This task performs testing in support of the other HSST Program tasks, with the exception of Task 12. Shallow-flaw fracture-toughness tests are being conducted on full-thickness clad-beams cut from the RPV from a canceled PWR plant The tests are being conducted by the National Institute for Science and Technology under an HSST Program subcontract No tests were conducted in the current reporting period.
An inspection of the ORNL thermal shock test facility was completed. Mechanical elements of the facility were found to be in good condition, but the instrumentation and data collection systems will need to be replaced if the facility is to be reactivated. This inspection was done as a part of a study of options available for the experimental element of
tbe HSST Program investigation of biaxial loading and cladding effects on the shallow-flaw fracture behavior of finite-length surface flaws. The study concluded that the cruciform specimen (see Task 12 for details of this specimen) provided the most versatile and cost-effective test vehicle for the finite-length surface flaw investigations. No further action on the thermal shock facility is planned at this time.
Finite-element analyses were performed to assess design modifications required to adapt the cruciform biaxial specimen design for testing finite-length shallow surface flaws. Initial tests will be conducted using unclad specimens. The analyses resulted in selection of a configuration of load-diffusion-control (LDC) slots that resulted in a reasonably uniform distribution of biaxial stresses in the test section of the specimen. This LDC slot geometry avoided perturbations of the test-section stress field that could have an unplanned influence on crack initiation behavior. Further analyses were performed to determine the geometry of the finite-length surface flaw to be used in the initial tests in this program. Material for the loading arms was selected and heat-treated to increase its yield stress and thereby ensure that the loading arms can be reused in subsequent tests. Material for the specimen test section was selected and sent for heat treatment and characterization testing.
Fatigue precracking of finite-length flaws can cause uneven fatigue crack growth for any finite-length surface flaw geometry for which the applied SIF varies significantly around the crack front Uneven crack growth will result in some departure of the fatigue presharpened flaw geometry from the desired geometry. In an attempt to overcome this problem, two alternate crack-sharpening techniques were evaluated. The alternate techniques were (1) electrodiscbarge machining using an electrode with a very small tip radius and (2) hydrogen charging of an electron beam weld. A series of IT CT specimens was prepared using the above crack-sharpening techniques, together with a control set prepared using conventional fatigue presharpening techniques. Results from fracture tests on this series of 1TCT specimens showed that both of the alternate crack-sharpening techniques performed unac-ceptably, whereas the fatigue-crack-sharpening technique produced consistently uniform results. Fatigue crack sharpening will, therefore, be used to sharpen the finite length flaws.
11 Warm Prestressing No activity in the current reporting period.
xxi NUREG/CR-4219, Vol. 10, No. 2

Executive
12 Biaxial Loading Effects on Fracture Toughness
PTS loading produces a biaxial stress field in the region of an RPV where shallow surface flaws are located and where maximum irradiation damage has occurred. Any effect of biaxial loading on fracture toughness will, therefore, directly influence the structural integrity of an RPV under PTS loading. The focus of this task is an experimental investigation of the effects of biaxial loading on the shallow-flaw fracture toughness of RPV material.
Conceptual design and fabrication of a cruciform test specimen and an associated loading fixture for the biaxial tests was completed in the prior reporting period. In this reporting period, development tests were conducted with the objective of providing the data required to refine critical elements of the cruciform test specimen design. The design elements of concern were (1) the configuration of the LDC slots and (2) the configuration of the constant-depth surface crack, where it joined the center LDC slot. The specimen design objective was to obtain an as-large-as-possible field of uniform biaxial stresses while at the same time ensuring that crack initiations occurred away from the intersection of the crack with the LDC slot. This condition was necessary to ensure that the test results would reflect only the effects of biaxial loading on the shallow-flaw fracture toughness of the material. Stress concentration effects at the intersection of the crack with the LDC slots could not be permitted to influence the frac' ture initiation process.
The test temperature for these development tests (-45°C) was selected to correspond with a normalized test temperature (T - RTNDJ = -10°C) for which a significant body of shallow-flaw fracture-toughness data existed from previously completed tests on uniaxially loaded specimens. This normalized temperature is in the lower portion of the
transition temperature range. Three LDC slot configurations were tested. Crack-mouth-opening displacements and load-line displacements were both measured and used, together with results from finite-element analyses of the test specimen, to define the measured fracture toughness (Kjc> for each of the tests. Five cruciform specimens were tested during this reporting period, one under uniaxial loading and four under 0.6:1.0 biaxial loading. The test results were used to refine the test specimen design. The final test specimen design was shown to be capable of consistently producing crack initiations near the center of the crack front. Achievement of crack initiation at this location satisfies a basic functional requirement for the cruciform specimen design.
The cruciform test specimen and its loading fixture have been shown to be capable of generating a statistically meaningful body of biaxial fracture-toughness data, under conditions of prototypic constraint, at considerably less cost than previously existing biaxial test facilities. This demonstration satisfies a further basic functional requirement for the cruciform biaxial fracture-toughness testing system.
The tests demonstrated that the fracture-toughness values generated under 0.6:1.0 biaxial loading were -13% lower than the fracture toughness measured under uniaxial loading. This stress-biaxiality-induced decrease in fracture toughness occurred in a region of the fracture-toughness curve where inelastic deformation contributed 17% to 26% of the measured fracture toughness. A primary effect of biaxial loading is to constrain plastic deformation of material at the crack tip. It is anticipated, therefore, that the effect of biaxial loading on fracture toughness could be greater at normalized temperatures in the middle of the transition temperature range, because the contribution of inelastic deformation to the measured fracture toughness is greater in this normalized temperature range.
NUREG/CR-4219, Vol. 10, No. 2 xxii

Heavy-Section Steel Technology Program Semiannual Progress Report for April 1993-September 1993
1 Program Management* W. E. Pennell
The Heavy-Section Steel Technology (HSST) Program is conducted for the Nuclear Regulatory Commission (NRC) by Oak Ridge National Laboratory (ORNL). The program focus is on development and validation of technology for the assessment of fracture-prevention margins in commercial nuclear reactor pressure vessels (RPVs).
RPV structural integrity issues of current concern can be grouped into four primary categories: (1) low-temperature overpressure protection set-point criteria, (2) structural integrity of the pressure vessel when subjected to pressurized-thermal-shock (PTS) loading, (3) evaluation of fracture-prevention margins for reactor vessels containing low-upper-shelf Charpy energy material, and (4) transfer of data from small-scale fracture-toughness surveillance
This report is written in metric units. Conversions from English units for all SI quantities are listed on p. 125 of this report.
specimens for application to RPVs. The HSST Program is structured to provide the research results required for resolution of these issues. Management direction and control of the program are implemented using a 12-element Level 1 work breakdown structure (WBS) and a linked cost-schedule performance-monitoring system. The current HSST Program Level 1 (WBS) is shown in Fig. 1.1. Each element of the Level 1 WBS represents a separate research or management task with a designated task leader.
Staffing for the research tasks is drawn from the Engineering Technology, Metals and Ceramics, and Computing and Telecommunications Divisions at ORNL. Subcontracts with consultants, universities, and other research laboratories are used to gain access to special expertise and capabilities required for certain research tasks. A summary of resources applied to the HSST research tasks during this reporting period is given in Fig. 1.2.
ORNL-DWG 94M-2449 ETD
HEAVY-SECTION STEEL TECHNOLOGY PROGRAM H.O
FRACTURE METHODOLOGY AND ANALYSIS
. H2
MATERIAL CHARACTERIZATION
AND PROPERTIES H 3
SPECIAL TECHNICAL ASSISTANCE
H.4
PROGRAM MANAGEMENT „ ,
n.i
FRACTURE ANALYSIS COMPUTER PROGRAMS
H.5
CLEAVAGE CRACK INITIATION
H.6
CLADDING EVALUATIONS
H.7
PRESSURIZED-THERMAL-SHOCK TECHNOLOGY
HI
ANALYSIS METHODS VALIDATION
H.9
FRACTURE EVALUATION TESTS
H.10
WARM PRESTRESSING
H.11
BIAXIAL LOADING EFFECTS H12
Figure 1.1 Level 1 Breakdown structure for HSST Program
1 NUREG/CR-4219, Vol. 10, No. 2

Program ORNL DWG-94M-2450R ETD
HEAVY-SECTION STEEL TECHNOLOGY PROGRAM
W.E. Pennell, Manager
ENGINEERING TECHNOLOGY DIVISION
J.W. Bryson J.G. Merkle R.D. Cheverton D.K.M. Shum W.F. Jackson T J . Theiss W. McAfee
COMPUTING AND TELECOMMUNICATIONS
DIVISION
B.R. Bass T.L. Dickson J A Keeney
METALS AND CERAMICS DIVISION
D. J. Alexander F.M. Haggag J.J. Henry S.K. Iskander D.E. McCabe
E.T. Manneschmidt R.K. Nanstad M. Rao R.L. Swain
CONSULTANTS
S.T. Rolfe C.F. Shin E.T. Wessel
R&D SUBCONTRACTORS
Banelle Columbus Div. Century Research Corp. Edison Welding Institute
University of Illinois University of Kansas University of Maryland
Figure 1.2 Resources applied to HSST Program R&D tasks
A team from Electricity de France visited ORNL on April 9,1993, for discussions with HSST Program personnel on topics relating to reactor vessel PTS analysis. The current approach to PTS analysis in France is to demonstrate compliance with transient-specific fracture margin requirements using deterministic analysis. There is, however, a growing interest in France in probabilistic PTS analysis methods. The French team was particularly interested in the Fracture Analysis of Vessels: Oak Ridge Program and in the test programs investigating the effects of constraint (shallow flaws and biaxial loading) on fracture toughness.
A team comprised of the HSST and Heavy-Section Steel Irradiation (HSSI) Program managers visited European fracture technology research centers, and one nuclear reactor fabrication facility from May 31,1993, to June 11, 1993. Objectives for the visit were to (1) obtain a firsthand understanding of RPV structural integrity issues of concern to the European nuclear power community, (2) obtain a detailed understanding of the research in progress aimed at resolving those issues, (3) communicate information on the scope and objectives of the HSST and HSSI research programs to the European research teams, and (4) identify areas where increased interaction would be mutually beneficial to the U.S. and European research programs.
Visits were made to the following research centers: • Nuclear Research Center—Rez, Czech Republic
Skoda Laboratory—Plzen, Czech Republic
• Skoda Nuclear Machinery Plant—Plzen, Czech Republic
• Staatliche Materialprufungsanstalt—Stuttgart, Germany
• Bundesanstalt fur Materialforschung—Berlin, Germany
• Electricity de France—Renardiers, France • FRAMATOME—Paris, France • AEA Technology—Risley, England • AEA Technology—Harwell, England
A number of fracture technology research topics of mutual interest were identified as a result of these visits. They represent areas of potential future interaction that could benefit the HSST Program. Specific research topics identified include crack-tip stress-field modeling, crack-tip constraint effects on fracture toughness, development and validation of models to predict precleavage tearing, dynamic fracture-toughness testing, ductile tearing-toughness correlations, fracture toughness of weld material, fracture behavior of subclad flaws, shallow-flaw, and biaxial-loading effects. A trip report providing details of the information obtained during the visits was issued on July 14,1993.
Information obtained from these visits will be factored into preparation of the HSST Program plan for the FY 1994 performance period (CY 1994). In particular, arrangements were made for interactions that, it is hoped, will permit HSST Program personnel to gain access to the materials data base used to calibrate the European ductile tearing (void formation and coalescence) models. In a reciprocal
NUREG/CR-4219, Vol. 10, No. 2

action, a team from the Nuclear Research Institute in Rez, in the Czech Republic, visited ORNL for a briefing and discussions on the HSST Program biaxial fracture-toughness testing technology.
The American Society of Mechanical Engineers (ASME) Pressure Vessel and Piping (PVP) Division Conference was held in Denver during July 25-29,1993. The conference included eight sessions on fracture technology developed jointly by Dr. S. Bhandari of FRAMATOME, Professor G. Yagawa of the University of Tokyo, and the HSST Program manager. The sessions were well attended and generated significant discussion. The 28 papers presented in those sessions were published in ASME PVP-Vol. 250, entitled "Pressure Vessel Integrity-1993." The HSST Program provided the principal editor for that volume.
A review of research conducted in the Japanese Elastic-Plastic Fracture Mechanics in Inhomogeneous Structures (EPI) Program was presented to HSST Program personnel and the NRC HSST Program monitor on July 30,1993, in Denver. The review was presented by a team led by Professor Yagawa. An important finding from this research was that inhomogeneity of prototypical welds did not have any significant influence on the material J-R curves. The study did, however, identify a potential concern for low crack-initiation toughness in the weld fusion-line material. Professor Yagawa provided HSST Program personnel with copies of the final report from the EPI project.
A concept was developed for interpreting J-Q analysis results from tests with varying levels of crack-tip constraint The concept uses a J-Q failure locus scatter band to define Q-specific corrections to the Q = 0 fracture-toughness curve. The result is a Q-specific fracture-toughness curve. To date a single Q-specific fracture-toughness curve has been produced. The concept appears to have the potential for reducing the volume of J-Q data required for implementing a Q-based adjustment of existing fracture-toughness curves.
Presentations outlining research in progress in the HSST Program were given to European fracture technology research organizations during May 31,1993, to June 11, 1993; Commissioner Forrest J. Remick on June 28,1993; and E. S. Beckjord, Director of the NRC Office of Regulatory Research, on September 30,1993.
During the current reporting period, HSST Program personnel published 2 NUREG/CR reports,1-2 1 letter report,3 1 foreign trip report,4 4 invited papers in
Program refereed journals,5 - 8 and 11 papers in technical society
publications;9-19 edited 1 technical society volume on pressure vessel integrity;20 and gave 19 presentations at technical society and NRC-sponsored national and international meeting. 2 1 - 3 9
References
1. T. J. Theiss et aL, Martin Marietta Energy Systems, Inc., Oak Ridge National Laboratory, "Initial Results of the Influence of Biaxial Loading on Fracture Toughness," USNRC Report NUREG/CR-6036 (ORNL/TM-12349), June 1993.*
2. T. L. Dickson, Martin Marietta Energy Systems, Inc., Oak Ridge National Laboratory, "Generic Analyses for Evaluation of Low Charpy Upper-Shelf Energy Effects on Safety Margins Against Fracture of Reactor Pressure Vessel Materials," USNRC Report NUREG/CR-6023 (ORM/TM-12340), July 1993.*
3. R. K. Nanstad, J. A. Keeney, and D. E. McCabe, Martin Marietta Energy Systems, Inc., Oak Ridge National Laboratory, "A Preliminary Review of the Bases for the K[c Curve in the ASME Code," ORNL/NRC/LTR-93/15, July 12,1993.
4. W. E. Pennell and W. R. Corwin, "Report of Foreign Travel of W. E. Pennell, Engineering Technology Division, and W. R. Corwin, Metals and Ceramics Division," ORNL/FTR-4673, July 14,1993.
5. D. K. M. Shum, D. E. McCabe, J. Henry, and J. Keeney-Walker, "Correlation Between Induced Thickness Reduction and Fracture Toughness," Eng. Frac. Mech. (October 1992).'''
6. J. Keeney-Walker and B. R. Bass, "Applications of ADINA to Evaluate Analysis Methodologies for Predicting Cleavage Arrest and Reinitiation of a Deep Crack in an RPV," Journal of Computers and Structures (June 1993).t
7. W. E. Pennell, "Heavy-Section Steel Technology Program Overview," Nucl. Eng. Des., 142 (2 & 3), 117-135 (August 1993). t
8. W. E. Pennell, "Heavy-Section Steel Technology Program: Recent Developments in Crack Initiation and Arrest Research," Engineering and Design, 142 (2 & 3), 255-266 (August 1993).*
3 NUREG/CR-4219, Vol. 10, No. 2

Program 9. T. J. Theiss, D. K. M. Shum, and S. T. Rolfe,
"Experimental Investigations of the Fracture Toughness Enhancement Associated with Shallow Flaws," Proceedings from the International Conference on Shallow Crack Fracture Mechanics, Toughness Tests and Applications, M. G. Dawes, Ed., June 1993.
10. B. R. Bass, J. W. Bryson, W. E. Pennell and T. J. Theiss, "Determination of Out-of-PIane Biaxial Stress Effects on Fracture Toughness for Shallow Surface Cracks in Reactor Pressure Vessel Steels," ASME PVP 250,257-269 (July 1993).t
11. D. K. M. Shum et al., "Potential Change in Flaw Geometry During Pressurized Thermal-Shock Transients," ASME PVP 250,65-76 (July 1993).t
12. J. W. Bryson and T. L. Dickson, "Stress-Intensity-Factor Coefficients for Axial and Circumferential Flaws in Reactor Pressure Vessels," ASME PVP 250 78-87 (July 1993).1"
13. T. L. Dickson, "FAVOR: A New Fracture Mechanics Code for Reactor Pressure Vessels Subjected to Pressurized Thermal Shock," ASME PVP 250,3-9 (July 1993).'''
14. D. K. M. Shum, "Warm Pre-Stress Effects in Fracture-Margin Assessment of PWR-RPVs.," pp. 333-338 in Transactions of the 12th International Conference on Structural Mechanics in Reactor Technology (SMIRT), Stuttgart, Germany, August 1993, Vol. G.
15. J. A. Keeney, T. J. Theiss, W. J. McAfee, and B. R. Bass, "An Overview of the HSST Full-Thickness Shallow-Crack Clad Beam Testing Program," pp. 183-188 in Transactions of the 12th International Conference on Structural Mechanics in Reactor Technology (SMIRT), Stuttgart, Germany, August 1993, Vol. G.
16. J. A. Keeney and T. L. Dickson, "The Effects of Cladding on Propagation of Finite-Length Flaws in FTS Analyses," pp. 363-368 in Transactions of the 12th International Conference on Structural Mechanics in Reactor Technology (SMIRT), Stuttgart, Germany, August 1993, Vol. G.
17. B. R. Bass et al., "Design of a Cruciform Bend Specimen for Determination of Out-of-Plane Biaxial
Tensile Stress Effects on Fracture Toughness for Shallow Cracks," pp. 345-350 in Transactions of the 12th International Conference on Structural Mechanics in Reactor Technology (SMIRT), Stuttgart, Germany, August 1993, Vol. G.
18. D. K. M. Shorn and J. G. Merkle, "Crack Initiation Under Generalized Plane-Strain Conditions," pp. 37-54 in Fracture Mechanics: Twenty-Third Symposium, ADTM STP1189, Ravinder Chona, Ed., American Society for Testing and Materials, Philadelphia, September 1993.
19. J. G. Merkle, "Near-Crack-Tip Transverse Strain Effects Estimated with a Large Strain Hollow Cylinder Analogy," pp. 95-114 in Fracture Mechanics: Twenty-Third Symposium, ADTM STP 1189, Ravinder Chona, Ed., American Society for Testing and Materials, Philadelphia, September 1993.
20. "Pressure Vessel Integrity—1993," American Society of Mechanical Engineers, Pressure Vessel and Piping Division, W. E. Pennell, Ed., PVP 250 (July 1993).+
21. R. K. Nanstad and M. C. Rao, "Fractography Evaluations for HSST Shallow-Flaw Fracture Toughness Program," presented at the HSST-EDF Fracture Technology Interchange Meeting in Oak Ridge, Tennessee, April 8,1993.
22. T. L. Dickson, "Cladding and Finite-Length Flaw Effects," presented at an Experts Meeting in San Diego, May 6,1993.
23. W. E. Pennell, "HSST Program: Overview of Current Research Project," presented at the NRC-RES/NRC-NRR/ORNL HSST/HSSI Research Program Review Meeting in Rockville, Maryland, May 13,1993.
24. R. K. Nanstad, "Observations on Irradiation-Induced Fracture Toughness and Charpy Impacts Shifts," presented at the RES/NRR/ORNL Meeting on RPV Integrity and the NRC Contractors Meeting on Radiation Effects, Rockville, Maryland, May 13-14, 1993.
25. T. J. Theiss, "Results of Biaxial Testing Program," presented at the ASTM E08.08 Committee Meetings in Adanta, May 17,1993.
26. J. A. Keeney, "Evaluation of the Ki c Data Base form EPRINP-719-SR (August 1978)," presented at the
NUREG/CR-4219, Vol. 10, No. 2 4

ASTM E08.08 Committee Meetings in Atlanta, May 18,1993.
27. J. G. Merkle, "Cornerstones of the Transition Range Draft Standards, Including Constraint Effects," presented at the ASTM E08.08 Committee meetings in Atlanta, May 18,1993.
28-33. W. E. Pennell, "Current Fracture Technology Research Background, Objectives, and Preliminary Results," presented at the European Fracture Technology Research Centers in Prague, Stuttgart, Berlin, Paris, Manchester, and Oxford, May31-Junell, 1993.
34. W. E. Pennell, "Overview of Current Fracture Technology Research Projects," presented to Commissioner Forrest J. Remick, U.S. Nuclear Regulatory Commission, at the Oak Ridge National Laboratory, June 28,1993.
35. D.K.M. Shum, "Interpretation of Warm Prestress-Enhanced Fracture Toughness Based on Crack-Tip Constraint," presented at the 25th
Program National Symposium on Fracture Mechanics, Lehigh University, Bethlehem, Pennsylvania, June 29,1993.
36. B. R. Bass, "Determination of Out-of-Plane Biaxial Stress Effects on Fracture Toughness for Shallow-Surface Cracks in Reactor Pressure Vessels," presented at the 1993 ASME PVP Conference in Denver, July 25-29,1993.
37. J. W. Bryson, "Stress-Intensity-Factor Influence Coefficients for Axial and Circumferential Flaws in Reactor Pressure Vessels," presented at the 1993 ASME PVP Conference in Denver, July 25-29,1993.
38. B. R. Bass, "Design of a Cruciform Bend Specimen for Determination of Out-of-Plane Biaxial Tensile Stress Effects on Fracture Toughness for Shallow Cracks," presented at the SMIRT-12 Conference in Stuttgart, Germany, August 15,1993.
5 NUREG/CR-4219, Vol. 10, No. 2

Program 39. W. E. Pennell, "Heavy-Section Steel Technology
Program Review," presented at the Review of NRC/RES/DE Projects at Oak Ridge National Laboratory by E. S. Beckjord, September 30, 1993.
Available for purchase from National Technical Information Service, Springfield, VA 22161.
'Available in public technical libraries.
NUREG/CR-4219, Vol. 10, No. 2 6

2 Fracture Methodology and Analysis B.R
2.1 Introduction
During this report period, work continued on an investigation of biaxial loading and shallow-flaw effects on constraint and fracture toughness for reactor pressure vessel (RPV) steels; on analytical studies of dynamic crack arrest in RPVs subjected to pressurized-thermal-shock (PTS) loading; and on the development of improved models of cleavage behavior in RPV steels.
2.2 Biaxial Loading and Shallow-Flaw Effects on Crack-Tip Constraint and Fracture Toughness
A program to develop and evaluate fracture methodologies for the assessment of crack-tip constraint effects on fracture toughness of RPV steels has been initiated in the Heavy-Section Steel Technology (HSST) Program. Crack-tip constraint is an issue that significantly impacts fracture mechanics technologies employed in safety assessment procedures for commercially licensed nuclear RPVs. A validated technology that incorporates constraint effects is essential to the transfer of fracture-toughness data from, for example, miniature fracture-toughness surveillance specimens to RPVs. The focus of studies described herein is on the evaluation of two stress-based methodologies for quantifying crack-tip constraint [i.e., J-Q theory 1 - 3 and the Dodds-Anderson (D-A) scaling model4'5 based on critical stressed volumes] through applications to experimental and fractographic data. Data were utilized from single-edge-notch bend (SENB) specimens6 and HSST-developed cruciform beam specimens7 that were tested in HSST shallow-crack and biaxial testing programs. Shallow-crack effects and far-field tensile out-of-plane biaxial loading have been identified as constraint issues that influence both fracture toughness and the extent of the toughness scatter band.
2.2.1 Finite-Element Model of Cruciform Specimen
Three-dimensional (3-D), elastic-plastic, finite-element analyses were performed on the cruciform specimen depicted in Fig. 2.1. Local crack-tip stress fields obtained from these analyses are used in applications of stress-based constraint characterization models. The one-fourth section of the cruciform specimen is represented in the 3-D finite-element model of Fig. 2.2. The model consists of 18,650 nodes and 3,890 twenty-node isoparametric brick elements. Collapsed-prism elements arranged in a focused or
Bass
centered fan configuration at the crack tip are used to produce a 1/r strain singularity appropriate for inelastic analysis. Reduced integration was employed to eliminate shear locking in the elements. The cruciform specimen is assumed to be supported on a rigid plate under the test section and loaded by uniformly applied forces at the ends of the longitudinal/transverse arms to produce the uniaxial or biaxial bending conditions. The rigid support plate is incorporated into the finite-element model of Fig. 2.2 using a contact element option in the ABAQUS (Ref. 8) finite-element program.
The outermost semicircular ring of nodes in the mesh of Fig. 2.2 (c) has a radius of 2 mm. This radius was extended to 4 mm in a second finite-element model developed for analysis of the BB-2 test [Fig. 2.2 (d)]. The relatively higher failure load (measured in terms of J) of the latter test required an expanded region of refinement to resolve the stress at a normalized distance of TCQ/1 = 5.
The material properties used for all calculations presented herein include Young's modulus E = 205,170 MPa, Poisson's ratio v = 0.25, and the piecewise linear stress strain curve for A 533 grade B class 1 steel taken from Ref. 7.
2.2.2 Application of the J-Q Method to Cruciform Specimens
The J-Q constraint analyses reported in this section are based on small strain finite-element formulations. In Appendix B of Ref. 9, the crack-tip constraint analyses described in this section are reported using a finite strain finite-element formulation. Interpretations of biaxial loading effects on stress triaxiality are unchanged from the small strain formulation. This agreement between the finite strain and small strain solutions supports conclusions in Ref. 3 that small strain formulations for J-Q analyses are generally acceptable.
Values of Q-stress are determined from the distributions of opening-mode stress in the crack plane ahead of the tip as a function of applied load for the uniaxial and biaxial specimens, respectively. The variation of Q with r as a function of applied load over the annulus 2 <r < 5 for the uniaxial and biaxial loading cases is shown in Figs. 2.3 and 2.4, respectively. In Fig. 2.3, the Q-stress steadily decreases as the applied load is increased and as general yielding develops in the uniaxially loaded specimen. Also,
NUREG/CR-4219, Vol. 10, No. 2

Fracture ORNL-DWG 92M-3935AR ETD
DIMENSIONS IN mm
(a) — p \ 51 [t— 112 — * \ J 0 SURFACE CRACK
ffi?
(b) SECTION A-A
Figure 2.1 Cruciform bend specimen used in HSST biaxial testing program: (a) dimensions of cruciform specimen and (b) detail of crack plane
the Q-stress exhibits a dependence on radial distance with increasing load. The bending field imposed on the beam by the applied loads progressively impinges on the near crack-tip field within the region defined by f < 5, producing an essentially linear dependence of Q upon r at higher J values.
used in Ref. 3 to assess the dependence of Q upon f in analyses of three-point bend bar specimens for a range of crack depths. Values of | Q' | > 0.1 were computed at higher loads for deep-crack geometry in these analyses, reflecting the interaction of far-field bending stresses with the near-tip field.
To quantify changes in the stress triaxiality from a spatially uniform hydrostatic field ahead of the crack, O'Dowd and Shih3 defined the mean gradient of Q over the annulus 1 < f <5:
Q' = Q(r = 5) - Q(r = 1)
4 (1)
The criterion of | Q' | < 0.1 was proposed by O'Dowd and Sbih3 as an indication that the Q-stress field is essentially constant over the annulus 1 < r < 5. The Q' function was
For the uniaxially loaded cruciform specimen, Fig. 2.3 indicates that the criterion | Q'| < 0.1 is not satisfied on the annulus 2 < r < 5 as failure load is approached. The Q' criterion, based on a maximum of 0.1, appears to permit a large variation in Q-stress over the crack-tip annulus. In this case, the variation in Q over the crack-tip annulus is greater than the difference between calculated Q-stress values for uniform and biaxial loading cases. Thus, it remains difficult to support the quantification of crack-tip constraint based on stress conditions in this annulus that
NUREG/CR-4219, Vol. 10, No. 2 8

Fracture ORNL-OWG 93-3902 ETD OflNL-OWG 933903 ETO
SLOTS SLOTS
Figure 2.2 (a) Finite-element model for local crack-tip analyses of cruciform bend specimen, (b) test section region of finite-element model for cruciform bend specimen, (c) highly refined crack-tip region of finite-element model for cruciform bend specimen, and (d) finite-element model with expanded region of refinement near the crack tip for analysis of uniaxially loaded cruciform specimen
are so heavily influenced by the far-field stresses. Consequently, application of the Q-stress methodology under conditions represented by the uniaxially loaded specimen at failure appears to be problematic.
The effect on variation of Q-stress vs f due to addition of the out-of-plane bending load is illustrated by results from the biaxial case given in Fig. 2.4. For this case, Q varies negligibly with f (i.e., | Q' | ~ 0.01) over the annulus 2 <r < 5 for the full range of loading. The Q-stress steadily decreases to a value of -0.6, where it remains (approximately) constant until failure conditions are reached. This value of Q-stress agrees well with the Q-stress determined at failure for the shallow-crack SENB specimens. Comparison of these results with the uniaxial case in Fig. 2.3 indicates that biaxial loading produces a higher stress triaxiality (as quantified by Q) at failure conditions and a hydrostatic stress field that is more spatially uniform over the annulus 2 <r <5.
The evolution of the J-Q loading path at the midplane of the cruciform specimen for the uniaxial and biaxial loading cases is depicted in Figs. 2.5 and 2.6. The Q-stress is evaluated at distances ahead of the crack given by r = 2 and 5 in Figs. 2.5 and 2.6, respectively. The J-Q loading path for the biaxial case reaches a constant value of approximately -0.6 as the loading path turns sharply upward and failure conditions are approached. For the uniaxial case, the J-Q path is sensitive to the choice of f (i.e., Q becomes more negative with increasing f), as would be expected from results shown previously in Fig. 2.3. Response of the cruciform specimen in terms of measured pressure (P), load-line displacement (LLD), and crack-mouth-opening displacement (CMOD) data indicated no significant biaxial loading effects for contained yielding conditions. Similar behavior between the uniaxial and biaxial cases for the J-Q trajectory is demonstrated only for values of f =5. For this case, the uniaxial J-Q loading path follows the biaxial path up to a value of J/(aoo) = 0.24 (which corresponds to J -100 kN/m or Kj ~ 150 MPa>/m) and then diverges from
9 NUREG/CR-4219, Vol. 10, No. 2

Fracture
-0.2
-0 .4
-0.6
-0.8
-1
-1.2
ORNL-DWG 93-3913R ETD
P=463 kN, J=29 kN/m
• P=546 kN, J=45 kN/m
P=625 kN, J=69 kN/m
-P=698kN,J=106kN/m
• P=764 kN, J=165 kN/m
• P=802 kN, J=235 kN/m
Uniaxial 0:1 Load X = 0 mm
_, L -1.4
0 1 2 3 4 5 r = rc 0 /J
Figure 2.3 Variation of Q with normalized distance ahead of the crack tip, X = 0 nun, uniaxial loading
ORNL-DWG 93-3914R ETD
-0.2
-0.4
-0.6
-0.8
-1.2
• P=465 kN, J=26 kN/m - P=558 kN, J=38 kN/m -P=658kN,J=60kN/m -P=748kN,J=100kN/m -P=782kN, J=131 kN/m -P=814kN,J=167kN/m
X . . I L__L-
1
Biaxial 0.6:1 Load X = 0 mm
_J
2 3 4 5 7 = ra 0 /J
Figure 2.4 Variation of Q with normalized distance ahead of the crack tip, X = 0 mm, biaxial 0.6:1 loading
NUREG/CR-4219, Vol. 10, No. 2 10

Fracture ORNL-DWG 93-3915 ETD
0.08
0.07
0.06
0.05
0.04
0.03
0.02
0.01
i—'—'—•—r
Load(KN) 623
T 1 , 1 1 1 1
X = 0 mm
• - • - • - Uniaxial Load
- Biaxial 0.6:1 Load
-1 -0.8 -0.6 -0.4 Q
-0.2
Figure 2.5 J-Q trajectories at X = 0 mm for a normalized distance r<j(/J = 2
ORNL-DWG 93-3918 ETD
Figure 2.6 J-Q trajectories at X = 0 mm for a normalized distance rc</J = 5
11 NUREG/CR-4219, Vol. 10, No. 2

Fracture the biaxial case as yielding increases in the specimens. In Fig. 2.6, the uniaxial and biaxial paths diverge at a Q-stress value of -0.6, a condition that represents substantial loss of triaxiality.
Several observations can be made concerning the J-Q trajectories computed at selected locations ahead of the crack tip in Figs. 2.5 and 2.6. Given the similarity of the uniaxial and biaxial P-CMOD responses at low loads, the expectation is that the J-Q trajectories for the uniaxial and biaxial specimens would exhibit similar behavior. Figure 2.5 depicts the J-Q trajectories computed at r =2, that is, at the location formally defining the Q-stress. The trajectory for the uniaxial case exhibits a significantly higher constraint condition (i.e., higher Q-stress) than the biaxial case for almost the entire loading path. This analytical result is at odds with experimental results that imply the biaxially loaded specimen is the more highly constrained specimen. At failure conditions, however, the uniaxial Q-stress is slightly more negative than the biaxial Q-stress, which is consistent with expected behavior. With increasing distance from the crack tip, the J-Q trajectory for the uniaxial case translates in the direction of decreasing triaxiality (i.e., more negative Q-stress values). For points in that portion of the annulus defined by r =5, the uniaxial and biaxial trajectories are very similar for Q > -0.6 (see Fig.2.6). However, there is no rationale for quantifying constraint at distances relatively far removed from the crack tip in an annulus where far-field stresses have a strong influence as in the uniaxial case. Fractographic examination of the test specimens (described in Sect. 2.27) showed no evidence of cleavage initiation sites in the annulus under consideration.
Therefore, the cruciform specimens will be interpreted in terms of J-Q trajectories defined at f = 2, despite the previously observed inconsistencies between the uniaxial and biaxial trajectories at lower load.
2.2.3 Application of J-Q Method to Shallow-Crack Specimens
The J-Q method was applied to a select number of shallow-and deep-crack SENB specimens as described previously.6
The Q-stress at failure for the deep-crack specimens was found to be negligible, indicating that these specimens failed under essentially small-scale yielding (SSY) conditions. The shallow-crack specimens, however, were found to have a Q-stress of about -0.7 at failure, which represents a significant loss of constraint The opening-mode stresses ahead of the crack tip for the shallow-crack specimens, exhibited a uniform deviation from the SSY solution over a distance of 2 <f < 10 (i.e., spatially uniform). The Q-stress was determined for these specimens only at r = 2. These specimens were used to construct a
preliminary J-Q toughness locus that could be then applied to RPV analyses.
Results from applications of the J-Q method to the HSST wide-plate tests 1 0 ' 1 1 were reported previously in Ref. 12. These single-edge-notch tension specimens (a/W ~ 0.2) exhibited a significant increase in toughness for cleavage initiation. While the J-Q analysis revealed a loss of constraint associated with the wide-plate tests, the J-Q locus for these tests was not in agreement with the J-Q locus for the limited shallow-crack tests.12 This discrepancy between the shallow-crack and wide-plate J-Q analysis is currently being investigated by reanalyzing both specimen types.* This reanalysis has generated a J-Q failure locus based on most of the shallow-crack data and several of the wide-plate results. A preliminary J-Q locus taken from this upcoming report will be presented in the next section with the cruciform data added.
2.2.4 J-Q Failure Locus
A J-Q failure locus for A 533 grade B class 1 steel at one temperature is schematically constructed in Fig. 2.7. This failure locus utilizes J-Q trajectories from analyses of shallow- and deep-crack SENB and HSST wide-plate data performed by Dodds.* The estimated J-Q toughness values for the uniaxially and biaxially loaded cruciform specimen at r = 2 are also included. Figure 2.7 depicts the scatter for a toughness locus corresponding to these ]-Q trajectories.
The toughness locus implies that reduced stress triaxiality (as reflected in more negative values of Q) is associated with increases both in apparent fracture toughness and in data scatter. The trajectories for the cruciform specimens fall well within the scatter of the failure locus. Also, the tendency for the biaxially loaded specimen trajectory to saturate at a higher stress triaxiality (i.e., less negative Q-stress) and turn abruptly upward suggest that biaxial loading could produce less data scatter in shallow-crack geometric than the uniaxial case.
2.2.5 Fracture-Toughness Scaling Model (Dodds-Anderson)
The D-A scaling model 4- 5 ' 1 3 analyzes constraint conditions by determining the area (or volume when considering a 3-D geometry) within a particular stress contour for a finite-body geometry and scaling that area (or
R. H. Dodds, Jr., "Constraint Analysis of the Shallow-Crack and Wide-Plate Test Results," to be issued as an NRC report under subcontract to the HSST Program.
NUREG/CR-4219, Vol. 10, No. 2 12

Fracture ORNL-DWG 93M-3852A ETD
350
300 —
250 —
-g- 200
150 —
100 —
50
SE(B). W=100
t I
a/W=0.l\
•
I I I. II WP-1.2A — • • \
\ UNIAXIAL \ CRUCIFORM V
I
. SE(B), a/W=0.5 V W=100
— \ » BIAXIAL \
/CRUCIFORM \
\ —
^ # WP-1.5A—*A
— \ SE(T), a/W=0.2\ \ W=1000 -X
\ . (w/ notch) <s^ *
\ —
I | i i ~ - - t \ •]
-1.2 -1.0 0.0 -0.8 -0.6 -0.4 -0.2
Q = (Oyy-Ossy) l<5Q
Figure 2.7 J-Q failure locus for A 533 grade B class 1 steel at T - RTNDT = -10°C
0.2
volume) with an equivalent SSY solution. The SSY state is then considered to yield true fracture-toughness results completely independent of specimen size or loading and is comparable to a specimen of infinite size. The scaling model has been successfully applied to fracture-toughness results exhibiting either a loss of in-plane constraint (i.e., shallow cracks) or out-of-plane constraint (i.e., thickness effects).5 The scaling model assumes that the volume of critically stressed material surrounding the crack tip is the same in different specimens with different constraint conditions. As a result, the SSY critical fracture toughness can be determined in a high-constraint geometry and then applied to a low-constraint geometry or vice versa.
2.2.5.1 Application of Scaling Model to Shallow-Crack Data
The D-A scaling model has been used to investigate both in-plane and out-of-plane constraint loss in the HSST shallow- and deep-crack test results. The in-plane investigation is reported herein; the application of the model to out-of-plane constraint or thickness effects is the subject of a separate report. The scaling model was applied to the shallow-crack data using information available in the literature without the need of additional crack-tip analysis.
The fracture-toughness data from the HSST shallow-crack program are shown in Fig. 2.8 as a function of normalized temperature (T - RTNDT)- The shallow-crack toughness increase can be quantified by a temperature shift of ~35°C. The data within the box at a normalized temperature range of approximately -10°C to -25°C in Fig. 2.8 are reported in Fig. 2.9 as a function of crack depth. As expected in a low-constraint geometry, Fig. 2.9 shows both an increase in the fracture-toughness values and data scatter from the shallow-crack specimens when compared with the deep-crack specimens. The regression analysis shown in Fig. 29 indicates a mean shallow-crack toughness value of about 1.6 times the deep-crack toughness, as previously reported.6
Using analysis results from Anderson and Dodds,5
Wallin14 has quantified in-plane constraint loss by the following equation:
JFB/JO = 1 + 176 (JFB/aoo) 1 3 7, (2)
where J 0 is the SSY or reference value of J, and JFB is the value of J in the finite-body geometry. The SSY value (J0) was computed from each specimen tested as a part of the
13 NUREG/CR-4219, Vol. 10, No. 2

Fracture 500
200
100
ORNL-DWG 93-3947 ETD
a W o 50 100
400 • 10 100 • 14 100 D 50 100
f • 10 100 f A 50 100 (M
P 300 A 10 100
0 I • •
-150 -100 -50 0
T .RT M T (C)
50 100
Figure 2.8 HSST shallow-crack fracture toughness results as function of normalized temperature T - R T N D T
ORNL-OWG 93-3948 ETD 300
250 ~
£f 200 -
150
100
50 ~
0
20 30 40
Crack Depth, a (mm)
Figure 2.9 Toughness data at T - RT^DT = -25 to -10°C as function of crack depth
NUREG/CR-4219, Vol. 10, No. 2 14

Fracture HSST Shallow-Crack Program. The plane strain elastic modulus was used to convert from J to K.
The Ko values as a function of crack depth in the transition region (i.e., the data subset in Fig. 2.8 within the box) are shown in Fig. 2.10. As indicated in Fig. 2.10, the KQ results are reduced to a toughness level independent of the crack depth of the specimens. When Figs. 2.9 and 2.10 are compared, the deep-crack data in Fig. 2.10 experience little to no reduction to their K 0 values, whereas the shallow-crack data are reduced substantially to almost exactly the same toughness level. The regression analysis shown in Kg. 2.10 confirms that the KQ data are independent of crack depth. The mean and standard deviation of the shallow- and deep-crack data are included on Fig. 2.10 as well.
Several conclusions can be drawn from the application of the D-A scaling model to the HSST shallow-crack data. First, the scaling model works very well with the shallow-crack data. The model adjusts both shallow- and deep-crack data to the SSY toughness value. In addition, the scatter in the corrected toughness data was also reduced by the application of the scaling model to the original shallow-crack toughness results. Furthermore, the scaling model is very simple to use in this application. The analy
sis of the data using the scaling model required no additional crack-tip analysis. The constraint corrections were based on specimen geometry and cleavage toughness results. It appears likely that J c predictions for shallow-crack geometries could be made from KQ data obtained from deep-crack specimens.
2.2.5.2 Application of Scaling Model to Cruciform Beam Data
Dodds et al. 1 3 have also developed a methodology for performing constraint adjustments of fracture-toughness data from test specimens that utilize a J-Q description of the crack-tip stress fields. This methodology has the advantage of being computationally simpler to apply than the stressed-volume technique for constraint correction previously introduced by Dodds and Anderson.5
Applications of this simplified approach to data from the uniaxially and biaxially loaded cruciform specimens, which draw upon the J-Q analyses of the previous section, are presented herein.
Two different methods of applying the D-A scaling procedure were used to generate these results.* Both methods
*Private conversation with R. H. Dodds, Jr., Sept. 28,1993.
^
300
250
200
150
ORNL-DWG 93-3950 ETD
50
0
100 -
1—1 1 I I |
- A — SENB Data • Uniaxial Cruciform • Biaxial Cruciform
4r.~
Shallow-Crack Data: Mean = 112 MPaVm Std. Deviation = 8.1 MPaVm
T - R T N D T = -10 to -25C
- y = 111.43 + 0.051397x R= 0.074086
a™
—lj \ -&.... A£
Deep-Crack Data: Mean = 114 MPaVm Std. Deviation = 18.3 MPaVm
_L _L 10 20 30 40 50 60
Crack Depth, a (mm)
Figure 2.10 K<, data at T - RTNDT = -25 to -10°C as function of crack depth
15 NUREG/CR-4219, Vol. 10, No. 2

Fracture
begin with the ratio of the distance ahead of the crack tip, r, for the finite-body and SSY solutions, to determine the JFB/JO ratio. Both methods begin the construction with an f value of about 2. The first method holds the finite-body stress constant at f = 2 and determines the distance ahead of the crack tip in the SSY solution that corresponds to that stress (see Fig. 2.11). The second method begins with the SSY stress at r = 2 and finds the distance corresponding to that stress in the finite-body solution(s). Both of these methods are outlined in Fig. 2.11. The first method begins with the finite-body stress at r = 2 or r = 2JFB/O"O. The distance in the SSY solution that yields the same critical stress is f = 11.63 or r = 11.63 J0/o"o- Because the critical distances are assumed equal, JFB/JO = 11.63/2.0 or 5.82. The second method yields a JFB/JO of 2.0/0.621 = 3.22. The second D-A scaling procedure that uses smaller distances ahead of the crack tip is the preferred method in this investigation and will be used to interpret the results.
The JFB/JO results using the D-A scaling procedure for the uniaxial and biaxial cruciform specimens at r = 1.5 to 4 are plotted as a function of distance ahead of the crack tip in Fig. 2.12. Examination of these results leads to several observations. First, the J ratios (and J 0) vary as a function of distance ahead of the crack tip. For the uniaxial cruci
form, the JFB/JO ratio increases from -3 at T = 1.5 to -4 at r = 4. The biaxial cruciform shows a similar increase in JFB/JO w i tn distance ahead of the crack tip. In Ref. 11, the calculation of J 0 is considered valid when values determined at r = 1.5 and at f = 4 differ by <10 percent. The . variation in JFB/JO (and Jo) shown in Fig. 2.12 is about 25 percent over this range for both the uniaxial and biaxial cases. The D-A scaling model results do not, therefore, meet the criteria established in Ref. 13.
There are two potential explanations for J 0 varying by more than the accepted criteria of 10 percent. The first is the nature of the cruciform specimen itself, which possesses 3-D stress fields that vary through the thickness. The D-A scaling model allows the use of critically stressed areas ahead of the crack, assuming a relatively constant field through a specimen thickness. The second explanation is the assumption mat the stressed areas in these cases are similarly shaped, allowing the comparison of distances ahead of the crack rather than areas. This assumption could lead to variations in J 0 that might not exist had the D-A scaling model used contour areas. (Future plans call for the cruciform analyses to be reinterpreted using the latter form of the D-A scaling model.)
ORNL-DWG 93-3951 ETD 4.5
3.5
(= o / o )
2.5
1.5
3 "
T
•—SSY
•&— Uniaxial, P=807 kN, J=246 kN/m
O— Biaxial 0.6:1, P=814 kN, J=167 KN/m
J,„/J Construction for Uniaxial Loading
10 12 0 2 4 6 8
T (= ro0 / J)
Figure 2.11 Determination of finite-body to SSY toughness ratio from stresses ahead of crack tip
NUREG/CR-4219, Vol. 10, No. 2 16

Fracture ORNL-DWG 93-3952 ETD
4.5
4
J / J 3.5 FB 0
2.5
1.5
1 ' ' ' I ' ' ' ' . I . , J • ' ! -
- f _ ^ - - - - j ^ l
•
i -
^ ^ -^ ^ -— 0 — Biaxial Cruciform
: :
i -
i " I -
i * i i i i * i i , , , . t i- t t i i _
:
ro 0/J
Figure 2.12 Finite-body to SSY toughness ratio as a function of normalized distance ahead of crack tip
Figure 2.12 indicates that the range of JEB#O ratios for the uniaxial cruciform is consistent with previous JFB/JO values for the shallow-crack SENB specimens. The uniaxial cruciform yields values of JFB/JO between 3 and 4; the shallow-crack SENB specimens yielded JFB/JO ratios ranging from 1.8 to 5.6, averaging -2.7. Finally, as shown in Fig. 2.12, the biaxial JFB/JO rauo is ~25 percent greater than the uniaxial J-ratio. This implies greater constraint loss for the biaxial specimen than the uniaxial specimen, a result which is inconsistent with the experimental toughness results. However, these ratios have been determined for a very limited number of tests. Additional tests will be necessary to determine if these trends continue.
The J 0 values were calculated for the uniaxial and biaxial cruciform tests for comparison with SENB J 0 values using the analytically based JFB values and the JFB/JO ratios determined at f = 2. The ratio at r = 2 was chosen because the Q-stress is typically determined at that location and the biaxial and uniaxial stresses ahead of the crack tip are almost identical at that location (see Fig. 2.11). The J 0
and KQ values for the four cruciform tests are shown in Table 2.1 along with the upper and lower SSY toughness results from the shallow- and deep-crack SENB tests; KQ values are also included in Fig. 2.10. As indicated in
Table 2.1, all of the cruciform SSY toughness values are within the range of SSY data from the SENB specimens. The J 0 values from the biaxial cruciform are near the lower limit of the SENB J 0 range; the uniaxial J 0 value was nearer the upper limit. Additional data are necessary to determine the full range of SSY toughness values under uniaxial, and biaxial loading.
2.2.6 Discussion of Crack-Tip Analyses
The J-Q method and D-A scaling model have been applied to the shallow- and deep-crack SENB tests and the uniaxial and biaxial cruciform tests. Data sets used in these applications are generated from tests of specimen geometries that provide a contrast in analytical modeling requirements. The SENB specimen is modeled in terms of a 2-D plane strain formulation, while the cruciform specimen exhibits a fully 3-D character that must be considered. Analysis results indicate that both methodologies can be used successfully to interpret experimental results from the deep-and shallow-crack SENB specimen tests. Applications of the two methodologies to the cruciform specimen each showed promising features, but they also raised several issues concerning constraint analysis based on near-tip stress fields.
17 NUREG/CR-4219, Vol. 10, No. 2

Fracture
Table 2.1 SSY toughness results for the uniaxial and biaxial cruciform specimens
Specimen No.
Loading configuration
J F B (kN/m)
Jo (kN/m)
KFB (MPaVm)
K 0
(MPaVin)
BB-1 0.6:1 160 39.4 190 94 BB-2 0:1 257 79.8 241 134 BB-4 0.6:1 160 39.4 190 94 BB-5 0.6:1 174 42.9 198 98
Notes: JFB^o r a t i o at r = 2 was used. Plane strain relationship between J and K was used. SENB (shallow- and deep-crack) SSY data were J 0 = 35.9-95.8 kN/m or KQ = 90-147 MPaVm
The application of crack-tip analysis to a shallow-crack cruciform specimen under biaxial loading represents a significant challenge for these techniques. Differences in constraint conditions due to a biaxial load are difficult to quantify because of the absence of an appropriate distance parameter. Out-of-plane constraint (i.e., thickness effects) can be quantified in terms of the specimen thickness B. In-plane constraint loss is similarly related to a shallow-crack depth, a or a/W. Biaxial loading, however, which impacts the crack-tip stresses substantially, has no appropriate length scale or distance parameter to which the constraint condition can be related. Another way of considering the
influence of biaxial loading is that the out-of-plane stress appears to make the specimen behave as a larger uniaxial specimen.
Biaxial loading has been shown to have a significant effect on the length parameter corresponding to the plastic zone radius in the plane of the crack (in the remaining ligament). Pennell15 presented a model that utilizes stresses in the region immediately adjacent to the crack-tip elastic-plastic interface to infer the influence of far-field biaxial stresses on fracture toughness. Figure 2.13 (from Ref. 15) depicts
ORNL-DWG 91M-3465R ETC
Sy Sz* BOUNDARY CURVE PARAMETER MPa WPa CONDITION
1 CH/c„ 345 345 GPS 2 0 e 345 345 GPS
PLANE STRAIN PLANE STRESS
Figure 2.13 Sjj/S e stress ratios predicted at the crack-tip plastic zone boundary by modified Inglis equations for plane stress, plane strain, and 1:1 biaxial-loading boundary conditions
NUKEG/CR-4219, Vol. 10, No. 2 18

Fracture the ratio of hydrostatic-to-effective stress (o"H/Ce) at the plastic zone radius corresponding to plane stress, plane strain, and 1:1 biaxial loading boundary conditions. The (o"H/ce) ratio is taken as a relevant parameter because of its influence on fracture ductility.
The final impact of out-of-plane biaxial loading is not fully known at this time. It is known, however, that biaxial loading does impact the conditions at the crack tip in a significant manner under conditions of uncontained yielding. Preliminary estimates from Ref. 16 indicated that under contained yielding, changes in initiation toughness due to biaxial effects would not exceed a few percent. Biaxial effects were exhibited in the cruciform specimen at conditions beyond contained yielding. The analyses confirm previously described experimental trends. As shown in Fig. 2.11, uniaxial and biaxial near-tip stresses (r <2) are coincident at failure loads. The applied load at which failure occurred in the uniaxial and biaxial specimens is almost identical; however, the critical value of toughness is quite different Biaxial loading further alters the way that applied load on a cracked specimen is related to the crack-driving force. Biaxial loading also substantially reduces the ductility of a specimen. Additional crack-tip analysis and additional biaxial tests are necessary before the impact of the biaxial loads on the fracture resistance of an RPV is understood.
2.2.7 Cleavage Initiation Sites and Stress-Based Fracture Characterization
is, ductile crack extension (Aa) and distance to cleavage origin (X) are defined in Fig. 2.14. Figure 2.15 (a) and (b) depicts normalized opening-mode, near-crack-tip stress distributions from finite-strain analyses of SENB and biaxially loaded cruciform specimens; the stress distributions are plotted vs normalized distance in front of the crack tip. The finite-strain SSY solutions are shown for reference. In Fig. 2.15(c) and (d), normalized distances [(X + Aa)arj/J] to cleavage initiation sites are plotted for SENB and cruciform bend test specimens. Values for the distance X + Aa, measured from the tip of the fatigue precrack to the cleavage initiation site, are taken from Table 4.1 of Ref. 9.
The central issue here concerns the location of a preponderance of the cleavage initiation sites relative to that region in front of the crack tip where increasing applied J implies increasing opening-mode stress. In Fig. 2.15(a), an effect of progressive loss of stress triaxiality is to shift the stress peak to the left (i.e., toward the crack tip) relative to the SSY stress peak. Given these conditions, the following question is posed: Do the measured cleavage initiation sites tend to fall in a region of the computed stress field where opening-mode stress is increasing with increasing applied J, that is, in Region A of Fig 2.15(a) to the right of the stress peak? (Material points to the left of the stress peak experience a stress field that decreases in magnitude with increasing J). The expectation* is that a cleavage initiation event governed by a stress-based criterion will occur in a rising near-tip stress field under increasing applied load.
Measured fractographic data are being used to assess the relevance of stress-based fracture characterizations to conditions at cleavage initiation sites in SENB and cruciform beam test specimens. (Previous studies that seek to interpret fracture-toughness results through fractographic observations include those of Heerens et al. 1 7) The important elements of this study can be summarized through reference to Figs. 2.14 and 2.15. Fractographic variables, that
W. E. Pennell et al., Martin Marietta Energy Systems, Inc., Oak Ridge Natl. Lab., "Biaxial Loading and Shallow-Haw Effects on Crack-Tip Constraint and Fracture-Toughness," presented at the Twenty-First Water Reactor Safety Information Meeting, Bethesda, Md., Oct. 25, 1993.
ORNL-DWG 93M-3955 ETD 3UCTILE CRACK EXTENSION, Aa
DISTANCE TO INITIATION, X
1/2CTOD J * i ,
FATIGUE PRECRACK •*—•
CLEAVAGE FRACTURE
LUNTING
Figure 2.14 Schematic defining fractographic variables
19 NTJREG/CR-4219, Vol. 10, No. 2

ORNL-DWG 93M-3956 ETD
SBL 3 °0
I I I I I I I I I I I I I I I I I I I I I I BIAXIAL 0.6:1.0 LOAD -
• SSY
l < « 1 l » I l » l l » » » i I » » l i i i I i
rao/J roo/J
600 r T T T T T T T T (o)
500 h V
400 -
I I I I I I I I I I I I I I I
0 DEEP V SHALLOW
£ 300 a UJ h- 200 - 0 0
100 -00 0 0
l l l I l I ' I I I I I I I I I I I I I I I I I 1 2 3
(Aa + X) Oo/J
600
500
| 400
_ ] g 300 O LLt Z 200 -
100
0
I I I I I I I I I I I I I I i I I 1 1 I I I 1 1 (a) • UNIAXIAL
0 BIAXIAL
-
-tt
i l l I I 1 1 1 I I 1 1 1 1 1 I 1 1 1 2 3
(Aa + X) CTQ/J
Figure 2.15 (a) Distribution of opening-mode stress component for SENB specimen with aAV = 0.1 as function of applied load up to crack initiation; (fc) distribution of opening-mode stress component for biaxial shallow-crack cruciform specimen; (c) toughness vs normalized distance to initiation site for shallow- and deep-crack SENB specimens; and (d) toughness vs normalized distance to initiation site for uniaxial and biaxial shallow-crack cruciform specimens

Fracture Results depicted in Fig. 2.15 permit comparisons of normalized distances from the crack tip to opening-mode stress peaks at failure and to measured cleavage initiation sites. For the SENB shallow-crack specimens, the initiation sites appear to fall in the region experiencing a rising stress field, that is, to the right of the stress peak in Fig. 2.15(a). The cruciform specimens present a contrasting result, with the sites located in a falling stress field with increasing J, that is, to the left of the stress peak in Fig. 2.15(b). Thus, fractographic data from the SENB shallow-crack specimens [Fig. 2.15(c)] tend to support the expectation for a critical stress-based fracture criterion discussed previously, while data from the cruciform specimens [Fig. 2.154)] require further study for reasons discussed later.
Results of this comparison between locations of the stress peak and the cleavage initiation sites for the cruciform specimens must be evaluated in the context of several factors. The fractographic data in Fig. 2.15 reflect that the process leading to cleavage fracture involves ductile extension of the crack tip before unstable cleavage. The finite-element models employed in analyses of the specimens in Fig. 2.15 do not incorporate the micromechanical processes that lead to generation of new fracture surfaces before the onset of cleavage instability. The 3-D finite-element model of the cruciform specimen described herein utilizes centered-fan crack-tip elements that allow a simplified blunting and translation of the tip without considering the complexities of the actual process. Inclusion of model refinements associated with these crack-tip processes can potentially influence the near-crack-tip stress fields and, consequently, interpretations of any comparisons between analytical predictions and measured fractographic data.
The opening-mode stress distributions in Fig. 2.15(a) and (b) are plotted vs normalized distance from the crack tip based on the initial undeformed configuration of the model. Of necessity, measurements taken on the fracture surfaces are given in terms of deformed points in the broken specimen. To compensate for these differences, adjustments of the material reference configuration have been proposed for the analytical and experimental plots of Fig. 2.15. One option is to plot the opening-mode stress distribution in terms of the deformed coordinates of the finite-element model and compare this directly with distance X measured from the tip of the blunted crack to the cleavage initiation site.
The proposed adjustment for results given in Fig. 2.15 is based partly on a hypothesis describing micromechanical processes leading to cleavage fracture in the test specimens. Studies to effectively validate such adjustments or hypotheses have been initiated but not completed.
Motivation for such adjustments is derived primarily from recognized limitations of the analytical models in representing the micromechanics of fracture processes. Development and application of a micromechanical model based on void formation and strain-softening concepts (e.g., see Ref. 18) could potentially resolve issues related to representation of crack-tip stress fields.
2.3 Dynamic Reinitiation (C. W. Schwartz* and B. R. Bass)
2.3.1 Introduction
Analyses of certain postulated transient events in RPVs require an understanding of conditions that govern initiation, rapid propagation, arrest, and reinitiation of cracks in cleavage. An important area of investigation concerns the development and validation of a satisfactory dynamic fracture-toughness model applicable to postcleavage arrest conditions in an RPV. The near-term (i.e., a few milliseconds after the previous arrest) initiation of an arrested crack is determined by the dynamic loading on the crack and the material dynamic initiation toughness. An important related factor is that the apparent fracture toughness of low-to-moderate-strength steels is observed to decrease with increasing loading rates for cleavage-dominated fracture in the low-to-midtransition temperature region.19
Candidate fracture mechanics methodologies being used to evaluate the propensity for cleavage reinitiation in an RPV require input of valid dynamic initiation toughness (i.e., Kjd) data spanning the full range of loading (i.e., K I d ) rates and temperature (i.e., T) conditions of interest Consequently, the HSST Program is initiating an analytical and experimental program, described herein, to provide the necessary data. In this program, two important questions must be addressed: (1) What is the Ky vs K I d vs T (vs irradiation) relationship for the RPV material? and (2) What are the K M ranges expected for the realistic PTS scenarios? The first question is the focus of a proposed reinitiation testing program to be directed by ORNL. The second question is the focus of an analytical investigation, described herein, that seeks to provide guidelines for the reinitiation testing program.
2.3.2 Background
Before investigating the range of credible loading rates for PTS scenarios, it is worthwhile to review previous research regarding the effect of loading rate on measured material fracture toughness and to make some preliminary order-of-
Department of Civil Engineering, University of Maryland, College Park.
21 NUREG/CR-4219, Vol. 10, No. 2

Fracture magnitude estimates of actual loading rates in RPVs under PTS conditions. For the purposes of the following discussion, "static" conditions are taken to correspond to crack-tip strain rates e on the order of 10~5/s and loading rates K I d on the order of 1 MPaVm/s, and "impact" conditions correspond to on the order of 10/s and K M on the order of 106 MPaVm /s. These values are consistent with commonly used values in standard references (e.g., Barsom and Rolfe20).
Material Toughness vs Loading Rate
Barsom and Rolfe20 present test data on the effect of loading rate on fracture resistance for a variety of materials. The trends observed in their data for low-to-moderate strength steels (yield stress < 140 ksi/965 MPa) are shown schematically in Fig. 2.16 in terms of Charpy energies. As shown in Fig. 2.17, Wilson et al. 2 1 found similar trends in terms of Ki c and K^ values for 1018
ORNL-DWG 94M-3807 ETD
CO
>
>-CD
UJ Q UJ m cc o CO
as
^ SHIFT IN ^^^ UPPER
SHELF , LEVEL L (ft-lb)
TEMPERATURE! lh-SHIFT IN J/ / ^ /-5T TRANSITION- r\ / r TEMPERATURE r RANGE J
TENERGY LEVEL AT \ WHICH TEMPERATURE ^^&* ^ m
TENERGY LEVEL AT \ WHICH TEMPERATURE LSHIFT IS MEASURED
TEST TEMPERATURE
Figure 2.16 Schematic representation of shift of CVN transition temperature and upper-shelf level due to strain rate (from Barsom and Rolfe20)
150
125
Cg 100
8. §- 75
^ 50
25
ORNL-DWG 94M-3808 ETD
I I
FIBROUJ
l 1 1
FIBROUS h — " ^
- CLEAVAGE p ^ - o - - ' / " ' " ' ^ —
CLEAVAGE ——1 /
/ / S / .
. / * o K I C = l(MPaVfn?s)
I I • K I d = 2X10⁶(MPaVm/s)
i i i
-200 50 100 -150 -100 -50 0 TEMPERATURE (°C)
Figure 2.17 Data due to Wilson et al. 2 1 showing influence of loading rate on fracture toughness of 1018 cold-rolled structural steel (from Freund23)
NUREG/CR-4219, Vol. 10, No. 2 22

Fracture cold-rolled structural steel. The general trends in all of the data are that the effect of increasing loading rate is equivalent to a temperature shift in the lower-transition region. For a given temperature, the impact loading curve lies to the right and below the slow loading or "static" curve. However, at higher temperatures corresponding to the upper-transition and upper-shelf regions, the trend is reversed; the slow loading toughness curve crosses the impact loading curve at about the two-thirds point, and the slow loading upper-shelf toughness is shifted substantially below the impact loading value. This behavior in the upper-shelf region is similar to that observed by Joyce and Hackett22 for ductile fracture. In the context of RPV response under PTS loading, Figs. 2.16 and 2.17 indicate that reduced loading rates may be very beneficial over perhaps the lower third of the transition region; over the middle third, the benefits will likely be less pronounced and more uncertain, while in the upper third and on the upper shelf the effects of reduced loading rates are detrimental and the "static" Ki c vs T relation becomes the conservative choice. Freund23 presents a useful conceptual discussion of this topic in terms of a cleavage fracture model governed by critical stresses vs a ductile tearing model governed by critical strains.
in which T s h i f t is in degrees Fahrenheit, o is the room temperature yield stress in kips per square inch, and e is in seconds-1. Equation (3) is valid over the range 10"3/s <e< 10/s and for a y s < 140 ksi (965 MPa). The temperature shift given by Eq. (3) is significantly sensitive to loading rate in the high loading rate region; for A 533 B steel (CTyS = 65 ksi/445 MPa), reducing K^ from the impact value of 106 MPaVm/s to a value 103 MPa-v/m/s corresponds to a temperature shift of - 85°F.
Shabbits19 presents Kid vsK w vs T data specific to A 533 B steel. These data are reprinted here as Fig. 2.18. Note that the data in Fig. 2.18 span more than just the lower-transition region. The Charpy upper shelf for A 533 B is reached at a T - RTNDT value o f about 135 to 200°F (75 to 100°C) from Naus et al . 2 4 Consequently, only the data in Rg. 2.18 for T - RTNDT values less than about 60°F correspond to the lower third of the transition region over which reduced loading rates are thought to be strongly beneficial. For temperatures within this range, the data in Fig. 2.18 suggest that a reduction of Kid fro111 the impact value of 106 MPaVm /s to a value of 103 MPaVm /s corresponds to a maximum increase in K M on the order of 100%.
Barsom and Rolfe20 suggest that in the lower transition region—that is, the region over which a valid Ki c can be determined—the effect of loading rate can be incorporated via a temperature shift of the following form:
Tshift = (150 -CysKe)1 0.17 (3)
Note that the data in Fig. 2.18 show a much more pronounced increase in K w with decreasing loading rate for T - RTNDT values of 75°F and above, which corresponds to the upper-transition and upper-shelf regions. These trends at high temperatures are contrary to
ORNL-DWG 91M-2S81AR ETD
240
200
160
WESTINGHOUSE A533 GR. B CLASS 1 PLATE o 1TCT SPECIMEN STEEL PLATE 12" THICK D2TCT MRL (HSST PLATE 02) A 4TCT • 0°F V 8TCT • -70°F 1 2 5 ' F v Z |
I
Ki a
<5 125°F 100°F Q , „ „.. ° 7 5
50 © 0 -50 -70
10° 10 1 10* t o 3
Kw(ksi»Vlr77s) 10* 10 5
Figure 2.18 KM VS K W for A 533 B at several temperatures as reported by Shabbits1 9
(from Keeney-Walker and Bass 2 7)
23 NUREG/CR-4219, Vol. 10, No. 2

Fracture observations by Barsom and Rolfe,20 Wilson et a l . / 1 and Joyce and Hackett.22 This may be due to the different materials used in the various studies and the potentially different fracture mechanisms. Nonetheless, given these discrepancies and the sparseness of the high-temperature data in the Shabbits data set, the high-temperature curves in Fig. 2.18 should probably be viewed with some reservations.
Factors other than loading rate may also significantly influence cleavage reinitiation. For example, the fracture toughness for cleavage reinitiation may be reduced because of a sharper crack front, although this effect may be mitigated somewhat by increased crack-tip yielding. On the other hand, the fracture toughness for reinitiation may be increased because the prior crack arrest may occur at a locally tough zone. Ductile tearing before cleavage may also significantly influence reinitiation toughness. Given that loading rate effects on J-R curves for purely ductile fracture show increasing fracture resistance with increasing loading rate (Joyce and Hackett22), it is conceivable that small amounts of precleavage ductile tearing at high loading rates might elevate the subsequent apparent cleavage fracture toughness. "Latency" effects—that is, the duration of crack arrest—may also be important, as argued by Shockey et al. 2 5 If this is true, then the material toughness behavior may need to be described by a K I d vs K I d vsiime duration vs T relationship. This three-parameter (or four-parameter, if irradiation is also included) relationship will greatly complicate material characterization. Many of the complexities outlined above will be very difficult to evaluate quantitatively in a credible, defensible fashion.
Preliminary Estimates of Maximum Loading Rates under PTS Scenarios
Freund26 showed for linear-elastic fracture mechanics (LEFM) conditions that a suddenly arresting crack in an infinite body under static remote loading maintains a constant K I d after arrest—that is, K J d equals zero. Consequently, K I d must be the product either of time-dependent loading effects or of finite geometry effects— that is, the dynamic response of a finite structure.
The external loading rates during PTS scenarios are relatively slow. The pressure and thermal variations occur over intervals of minutes, while the intervals between initiation, arrest, and subsequent reinitiation are on the order of tens of milliseconds, at most Consequently, time-dependent loading effects will not be a significant contributor to Kj d for PTS conditions.
The finite nature of the RPV geometry leads to significant dynamic effects within the vessel. This has been shown by
Keeney-Walker and Bass 2 7 for a prototypical RPV geometry under realistic PTS loadings for LEFM conditions. Their computed K I d vs time history, reprinted here as Fig. 2.19, exhibited a significant oscillatory component, with amplitudes (peak to trough) of -50 MPaVm and a period of -1 to 2 ms. Their estimated peak K I d values on the order of 104 to 105 MPaVmVs, when combined with the Shabbits19 material property data, had a significant effect on the predicted reinitiation and crack jumps in their application-mode analyses. However, all of the computed reinitiations occurred at temperatures in excess of 100°C, which is well beyond the lower-transition region and in the temperature range in which the Shabbits data set is sparse and questionable.
Conceptually, the dynamic response of an RPV can be divided into gross structural response and stress-wave effects. For stress-wave loaded cracks under LEFM conditions, which can be taken as the limiting case of an "instantaneously" loaded crack, analyses by Freund23
suggest K I d values approaching 106MPaVm/s. To estimate the corresponding order-of-magnitude upper bound for K I d for the more relevant condition of a PTS event, we need both the characteristic maximum amplitude of the dynamic response and its corresponding minimum period. Each of these can be reasonably estimated to within 1 or 2 orders of magnitude.
Keeney-Walker and Bass 2 7 indicate a K I d range of 100 ± 50 MPaVm" between arrest and reinitiation/peak response. Examination of their calculations for the detailed dynamic response, reprinted here as Fig. 2.19, suggests a peak-to-trough K I d amplitude on the order of a few tens of megapascals per square root meter. Experience with other dynamic fracture analyses (e.g., the wide-plate test series) suggests a minimum K I d amplitude on the order of a few tens of megapascals per square root meter, which is consistent with the Keeney-Walker and Bass 2 7 RPV calculations.
Estimating a lower bound for the characteristic period of the dynamic response is perhaps more difficult. The natural periods of the lower structural vibration modes for an RPV are typically much longer (on the order of several milliseconds to several tens of milliseconds) and therefore of much less interest than the stress-wave travel times through the vessel. For a vessel with radius R = 2 m, t/R = 0.1, and A 533 B properties, the through-thickness stress waves have travel times (out and back) on the order of 0.1 ms and the circumferential stress waves have travel times (one circumference) on the order of a few milliseconds. While the results obtained by Keeney-Walker and Bass27 are not related to stress-wave effects, these wave travel times are broadly consistent with the
NUREG/CR-4219, Vol. 10, No. 2 24

Fracture
500 450 400 350
*f. 300 £ 250 s ;~2oo
150
100
50
ORNL-DWG 91M-2880R ETD
i r i 1 1 1 r
'f^t^S^^ - =10 4 MPa»Vm/s
= 10 5MPa«Vm/s
JJ L I I I
- 400
- 300 _
200 I
100
0 5 10 15 20 25 30 35 40 45 TIME (ms)
Figure 2.19 Time history from Keeney-Walker and Bass 2 7 analysis
characteristic period found in Ref. 27, as shown in Fig. 2.19.
Combining these estimates yields a reasonable upper bound for the K I d values likely to be observed in an RPV under PTS conditions. A maximum Kid amplitude on the order of 10 MPaVm over a minimum time interval on the order of 0.1 and 1 ms produces a maximum K I d estimate of 104 to 105 MPaVm/s. Although this is still a high loading rate, it is 1 to 2 orders of magnitude below the value estimated from Freund23 for purely stress-wave loaded cracks under LEFM conditions (i.e., "instantaneously" loaded cracks). Note that this loading range rate is also consistent with the findings of Keeney-Walker and Bass.27
It must be remembered that all of the above estimates are based upon highly idealized vessel and material conditions. Potentially significant departures from these idealized conditions include the following: (1) crack-tip plasticity, viscoplasticity; (2) inherent material damping; (3) finite crack, other 3-D effects; (4) energy dissipation in the axial direction, for example, axial vibrations; (5) energy dissipation through vessel fluid-structure interaction; (6) analytical artifacts, for example, spurious vibrations and mesh refinement effects.
2.3.3 Analysis Program
The present study is focusing on a series of dynamic finite-element analyses of the postarrest K w values for an infinitely long axial flaw in an otherwise prototypical RPV vessel under realistic PTS loading conditions. The primary parameters being considered in this study are the arrested crack length, inherent material damping, and fluid-structure interaction effects (in an approximate way). Instantaneous Kj, values will be computed at each time step in each analysis, and the frequency distributions of the computed K H values compared for the various parameter combinations. Results of these analytical studies will be described in the next reporting period.
2.4 Cleavage Behavior in Nuclear Vessel Steels (G. R. Irwin and X. J. Zhang*)
During this report period, work continued at the University of Maryland to develop improved models of cleavage behavior for nuclear vessel steels in the transition temperature range. The emphasis in these studies is placed
Department of Mechanical Engineering, University of Maryland, College Park.
25 NUREG/CR-4219, Vol. 10, No. 2

Fracture on the temperature region extending from near nil-ductility temperature (NDT) to loss-of-cleavage temperature. Elements of the cleavage processes are being investigated with scanning-electron microscopy (SEM), optical fractography, and theoretical analysis. Prior results28 have emphasized that a consistent understanding of the initiation, spreading, and arrest of cleavage in steels is possible only when the role of very high local strain rates is taken into account.
Among the features associated with cleavage behaviors in steels, the spreading of cleavage through ferrite grains is of major importance. For this nearly crystallographic event to occur, cleavage must start and spread from a nearly crystallographic cleavage embryo produced in some manner. Figure 2.20 shows potential origin locations for formation of cleavage embryos. For plausibility of occurrence, such an embryo must be quite small. However, it must be large enough so that the crack extension driving force, G, is as large as the resistance to spreading. Table 2.2 shows estimates of this size corresponding to assumed values of tensile stress, c, and of the resistance to spreading, R. In the clumps of debonding carbide particles, which were cleavage origin locations, the particle size was in the 0.1- to 0.2-fim range. A cleavage embryo size larger than the particle size seems unlikely. From Table 2.2, the size corresponding to the smallest R and the largest a seems best. Figure 2.21, from Ref. 29, shows values of plastic flow stress across a wide range of strain rates for a-iron. Because the steels of interest are stronger and
Table 22. Cleavage embryo size estimates for several values of local stress, o, and
resistance to spreading, R
oVE a (um) (forR=20J/m2)
a(nm) (forR=40J/m2)
1/40 1/60 1/80
0.12 0.27 0.48
0.24 0.55 0.97
because local region strain rates applicable to Fig. 2.20 may be larger than lO^s, a local region stress high enough for the 0.12-pm embryo size in Table 2.2 is plausible.
2.5 Elastic-Plastic Fracture Mechanics in Inhomogeneous Materials and Structures (B. R. Bass)
2.5.1 Final Review Meeting
A final review meeting concerning the Japanese Elastic-Plastic Fracture Mechanics in Inhomogeneous Materials and Structures (EPI) Program was held in Denver, Colorado, on July 30, 1993.
The principal objective of the EPI Program is to investigate elastic-plastic crack extension phenomena in
ORNL-DWG 94M-3157 ETD
\ TENSION
CLEAVAGE EMBRYOS
Figure 2.20 Schematic pictures of cleavage embryo formation
ORNL-DWG 94M-3158 ETD
10° 101 10 2 10 3 10 4 10 5 106
Y P(S- 1)
Figure 2.21 Stress as function of plastic strain-rate at several temperatures for a-iron (Ref. 29). Extrapolation toward a = lO s"1 is indicated
NUREG/CR-4219, Vol. 10, No. 2 26

Fracture
inhomogeneous materials and structures, aiming at the development of estimation schemes of fracture resistance applicable to structures with material inhomogeneities. The Japanese consortium responsible for the EPI Program was organized in July 1988 as a subcommittee of the Nuclear Engineering Research Committee of the Japan Welding Engineering Society (JWES). The EPI subcommittee in Japan consists of 9 universities, 3 research institutes, and 21 companies.
Professor G. Yagawa, Department of Nuclear Engineering, University of Tokyo, serves as chairman of the subcommittee. The HSST Program, on behalf of the U.S. Nuclear Regulatory Commission (NRC), is the sole U.S. participant in the EPI Program. The work of the EPI Program was completed in 1992.
2.5.2 Summary of Results
The program for the meeting, organized by Professor G. Yagawa, included seven Japanese presentations that reviewed the results and conclusions derived from the various EPI Program subtasks. These presentations also included opportunities for discussion of results among the participants in the meeting.
Results were reported from each of the three working groups (WGs) (i.e., Theoretical WG, Experimental WG, and Estimation Scheme WG) set up under the EPI subcommittee to carry out objectives of the program. Fracture-toughness testing was performed on specimens from two source plates: (1) submerged-arc welded A 533 grade B class 1 (A 533 B) steel and (2) an electron-beam welded plate consisting of A 533 B and high-strength HT 80 steels. Experimental studies performed on these materials include tensile tests, residual stress measurements, stable crack extension in compact tension and surface-cracked specimens, and direct measurements of surface crack-tip displacement fields by Moire' inter-ferometry. The effects of material inhomogeneity on the evaluation of fracture parameters were studied using finite-element methods and experimental data from the two source plates. Three simplified engineering estimation schemes (i.e., GE/EPRI method, R6 method, and reference-stress method) were evaluated in applications to crack extension experiments on homogeneous and welded specimens of A 533 B steel. Results obtained thus far indicate that these conventional estimating schemes can be applied in the inhomogeneous material regime with appropriate modifications of material properties. However, differences in material properties of the base and weld metals were modest, with only a 15% difference in yield stress for the two metals. Because these differences in
material properties are considered typical of RPVs, the research findings confirm that effects of inhomogeneities associated with current standard-practice welds are small and not a significant RPV structural integrity assessment issue in the United States. Applications of the simplified schemes to the bimaterial A 533 B-HT80 specimens, which exhibit a substantially greater difference in material properties, are presented in the final report30 on the EPI Program for 1993. [It is recognized that the bimaterial (AS533B/HT80) specimens are not relevant to HSST . objectives that focus on RPV fracture evaluations.]
Detailed results from the EPI Program are summarized in the annual reports 3 0 - 3 4 issued by the Japanese EPI Subcommittee.
References 1. N. P. O'Dowd and C. F. Shih, "Family of Crack-Tip
Fields Characterized by a Triaxiality Parameter: Part I—Structure of Fields," /. Mech. Phys. Solids 39, 989-1015(1991).*
2. N. P. O'Dowd and C. F. Shih, "Family of Crack-Tip Fields Characterized by a Triaxiality Parameter Part II—Fracture Applications," J. Mech. Phys. Solids 40,939-963 (1992).*
3. N. P. O'Dowd and C. F. Shih, Naval Surface Warfare Center, "Two Parameter Fracture Mechanics: Theory and Applications," USNRC Report NUREG/CR-5958 (CDNSWC/SME-CR-16-92), February 1993.*
4. R. H. Dodds, T. L. Anderson, and M. T. Kirk, "A Framework to Correlate a/W Ratio Effects on Elastic-Plastic Fracture Toughness (Jc)," Int. J. Frac. 48,1-22 (1991).*
5. T. L. Anderson and R. H. Dodds, "Specimen Size Requirements for Fracture Toughness Testing in the Ductile-Brittle Transition Region," J. Test. Eval. 19, 123-134(1991).*
6. T. J. Theiss, D. K. M. Shum, and S. T. Rolfe, Martin Marietta Energy Systems, Inc., Oak Ridge Natl. Lab., "Experimental and Analytical Investigation of the Shallow-Flaw Effect to Reactor Pressure Vessels," USNRC Report NUREG/CR-5886 (ORNL/TM-12115),Julyl992.t
27 NUREG/CR-4219, Vol. 10, No. 2

Fracture 7. T. J. Theiss et al., Martin Marietta Energy Systems,
Inc., Oak Ridge Natl. Lab., "Initial.Results of the Influence of Biaxial Loading on Fracture Toughness," USNRC Report NUREG/CR-6036 (ORNL/TM-12349), June 1993.*
8. ABAQUS Theory Manual, Version 4-8, Hibbitt, Karlson, and Sorensen, Inc., Providence, R.I., 1989.
9. B. R. Bass et al., Martin Marietta Energy Systems, Inc. Oak Ridge Natl. Lab., Biaxial Loading and Shallow-Flaw Effects on Crack -Tip Constraint and Fracture Toughness, USNRC Report NUREG/CR-6136 (ORNL/TM-12498), January 1994.*
10. D. J. Naus et al., Martin Marietta Energy Systems, Inc., Oak Ridge Natl. Lab., "High-Temperature Crack-Arrest Behavior in 152-mm-Thick SEN Wide Plates of Quenched and Tempered A 533 Grade B Class 1 Steel," USNRC Report NUREG/CR-5330 (ORNLTM-11083), April 1989.1"
11. D. J. Naus et al., Martin Marietta Energy Systems, Inc., Oak Ridge Natl. Lab., "Crack-Arrest Behavior in SEN Wide Plates of Quenched and Tempered A 533 Grade B Steel Tested Under Nonisoraermal Conditions," USNRC Report NUREG/CR-4930 (ORNL-6388), August 1987.1'
12. B. R. Bass, D. K. M. Shum, and J. Keeney-Walker, Martin Marietta Energy Systems, Inc., Oak Ridge Natl. Lab., "Constraint Effects on Fracture Toughness for Circumferentially Oriented Cracks in Reactor Pressure Vessels," USNRC Report NUREG/CR-6008 (ORNL/TM-12131), 1992.*
13. R. H. Dodds, C. F. Shih, and T. L. Anderson, Department of Civil Engineering, University of Illinois, "Continuum and Micromechanics Treatment of Constraint in Fracture," Report UILU-ENG-92-2014, November 1992.
14. K. Wallin, "Statistical Aspects of Constraint with Emphasis on Testing and Analysis of Laboratory Specimens in the Transition Region," pp. 264-288 in Constraint Effects in Fracture, ASTM STP1171, E. M. Hackett, K. H. Schwalbe, and R H. Dodds, Eds. (American Society for Testing and Materials, 1993).
15. W. E. Pennell, "Heavy-Section Steel Technology Program: Recent Developments in Crack Initiation and Arrest Research," Nucl. Eng. Des. 142,255-266 (1993).*
16. D. K. M. Shum et al., Martin Marietta Energy Systems, Inc., Oak Ridge Natl. Lab., "Analytical Studies of Transverse Strain Effects on Fracture Toughness for Circumferentially Oriented Cracks," USNRC Report NUREG/CR-5592 (ORNL/TM-11581), April 1991.1"
17. J. Heerens et al., "Interpretations of Fracture Toughness in the Ductile-to-Brittle Transition Region by Fractographical Observations," in Defect Assessment in Components—Fundamentals and Applications, ESIS/EGF9, J. G. Blauel and K.-H. Schwalbe, Eds. (Mechanical Engineering Publications, London, 1991), pp. 659-678.
18. J.-C. Devaux et al., "Experimental and Numerical Validation of Ductile Fracture Local Criterion Based on a Simulation of Cavity Growth," pp. 7-23 in Nonlinear Fracture Mechanics: Volume II—Elastic Plastic-Fracture, ASTM STP 995, J. D. Landes, A. Saxena, and J. G. Merkle, Eds. (American Society for Testing and Materials, Philadelphia, 1989).
19. W. O. Shabbits, Westinghouse R&D Center, "Dynamic Fracture Toughness Properties of Heavy Section A533 Grade B Class 1 Steel Plate," Report No.WCAP-7623,1970.
20. J. M. Barsom and S. T. Rolfe, Fracture and Fatigue Control in Structures, 2nd edition (Prentice-Hall, Inc., Englewood Cliffs, NJ, 1987).
21. M. L. WUson, R. H. Hawley, and J. Duffy "The Effect of Loading Rate and Temperature on Fracture Initiation in 1020 Hot Rolled Steel," Eng. Frac. Mech. 13,371-385 (1980).*
22. J. A. Joyce and E. M. Hackett, "Dynamic J-R Curve Testing of a High Strength Steel Using the Multispecimen and Key-Curve Techniques," ASTM STP 905,741-774 (1984).*
23. L. B. Freund, Dynamic Fracture Mechanics, Cambridge University Press, Cambridge, UK (1990).
NUREG/CR-4219, Vol. 10, No. 2 28

24. D. J. Naus et al., "Crack Arrest Behavior in SEN Wide Plates of Quenched and Tempered A533 Grade B Steel Tested Under Nonisothermal Conditions," USNRC Report NUREG/CR-1930 (ORNL-6388), 1987.t
25. D. A. Shockey, J. F. Kalthoff, and D. C. Erlich, "Evaluation of Dynamic Crack Instability," Int. J. Fract. 22, 217-229 (1983).
26. L. B. Freund, "Crack Propagation in an Elastic Solid Subjected to General Loading—n, Non-Uniform Rate of Extension," J. Mech. Phys. Solids, 20,141-152 (1972).
27. J. Keeney-Walker and B. R. Bass, "A Comparison of Analysis Methodologies for Predicting Cleavage Arrest of a Deep Crack in a Reactor Pressure Vessel Subjected to Pressurized Thermal Shock Loading Conditions," USNRC Report NUREG/CR-5793 (ORNL/TM-11969), 1992.
28. G. R. Irwin and X. J. Zhang, "Cleavage Behavior in Nuclear Vessel Steels," PVP 250, ASME, June 1993.
29. L. B. Freund, and J. W. Hutchison, "High Strain Rate Crack Growm in Rate Dependent Plastic Solids," J. Mech. Phys. Solids 33,169-191 (1985).*
30. G. Yagawa, "Study on Elastic-Plastic Fracture Mechanics in Inhomogeneous Materials and Structures," CRC-EPI-5, Century Research Corp., Tokyo, Japan, May 1993.
31. G. Yagawa, "Study on Elastic-Plastic Fracture Mechanics in Inhomogeneous Materials and Structures," CRC-EPI-1, Century Research Corp., Tokyo, Japan, May 1989.
32. G. Yagawa, "Study on Elastic-Plastic Fracture Mechanics in Inhomogeneous Material and Structures," CRC-EPI-2, Century Research Corp., Tokyo, Japan, May 1990.
33. G. Yagawa, "Study on Elastic-Plastic Fracture Mechanics in Inhomogeneous Materials and Structures," CRC-EPI-3, Century Research Corp., Tokyo, Japan, May 1991.
34. G. Yagawa, "Study on Elastic-Plastic Fracture Mechanics in Inhomogeneous Materials and Structures," CRC-EPI-4, Century Research Corp., Tokyo, Japan, May 1992.
Available in public technical libraries. 'Available for purchase from National Technical Information Service, Springfield, VA 22161
29 NUREG/CR-4219, Vol. 10, No. 2

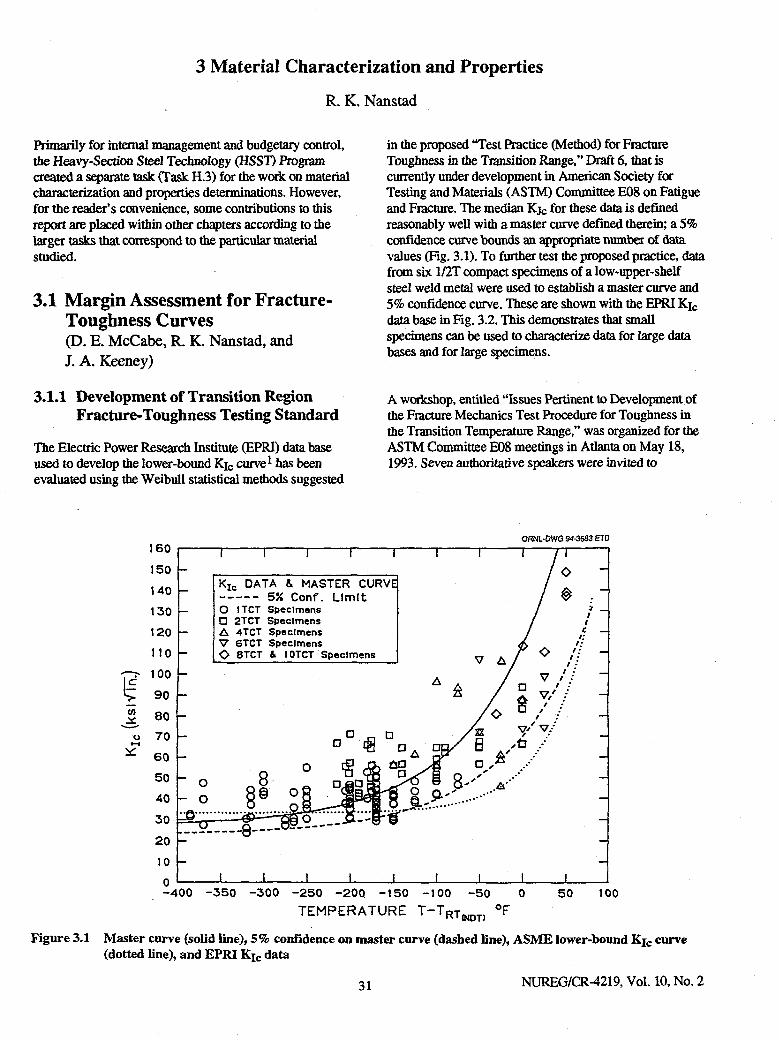
3 Material Characterization and Properties R. K. Nanstad
Primarily for internal management and budgetary control, the Heavy-Section Steel Technology (HSST) Program created a separate task (Task H.3) for the work on material characterization and properties determinations. However, for the reader's convenience, some contributions to this report are placed within other chapters according to the larger tasks that correspond to the particular material studied.
3.1 Margin Assessment for Fracture-Toughness Curves (D. E. McCabe, R. K. Nanstad, and J. A. Keeney)
3.1.1 Development of Transition Region Fracture-Toughness Testing Standard
The Electric Power Research Institute (EPRQ database used to develop the lower-bound Kfc curve1 has been evaluated using the Weibull statistical methods suggested
in the proposed "Test Practice (Method) for Fracture Toughness in the Transition Range," Draft 6, that is currently under development in American Society for Testing and Materials (ASTM) Committee E08 on Fatigue and Fracture. The median Kj c for these data is defined reasonably well with a master curve defined therein; a 5% confidence curve bounds an appropriate number of data values (Fig. 3.1). To further test the proposed practice, data from six 1/2T compact specimens of a low-upper-shelf steel weld metal were used to establish a master curve and 5% confidence curve. These are shown with the EPRI Kfc data base in Fig. 3.2. This demonstrates that small specimens can be used to characterize data for large data bases and for large specimens.
A workshop, entitled "Issues Pertinent to Development of the Fracture Mechanics Test Procedure for Toughness in the Transition Temperature Range," was organized for the ASTM Committee E08 meetings in Atlanta on May 18, 1993. Seven authoritative speakers were invited to
CO
u
160 150 140 130 120 110 100 90 80 70 60 50 40 30 20 10 0 -400
ORNL-DWG 94-3683 ETD
- o - o :0
~r 1 1 1 1 "" i
A A
i
i
V
B
1
A
O
•
.A''
1 ,
I 7 v/ v.-
i
j I
o $ : " i _ / /
r. _ /: /; / ; _ / • / • / ." _ / ." / /
1
- o - o :0
K I c DATA & MASTER CUR VE
"" i
A A
i
i
V
B
1
A
O
•
.A''
1 ,
I 7 v/ v.-
i
j I
o $ : " i _ / /
r. _ /: /; / ; _ / • / • / ." _ / ." / /
1
- o - o :0
O 1TCT Specimens D 2TCT Specimens A 4TCT Specimens V 6TCT Specimens O 8TCT & 10TCT Specimens
VE
"" i
A A
i
i
V
B
1
A
O
•
.A''
1 ,
I 7 v/ v.-
i
j I
o $ : " i _ / /
r. _ /: /; / ; _ / • / • / ." _ / ." / /
1
- o - o :0
D „ D £g
i 1 1
D
a
-1
I
D a a
"" i
A A
i
i
V
B
1
A
O
•
.A''
1 ,
I 7 v/ v.-
i
j I
o $ : " i _ / /
r. _ /: /; / ; _ / • / • / ." _ / ." / /
1 1
D „ D £g
i 1 1
D
a
-1
I
D a a
"" i
A A
i
i
V
B
1
A
O
•
.A''
1 ,
I 7 v/ v.-
i
j I
o $ : " i _ / /
r. _ /: /; / ; _ / • / • / ." _ / ." / /
1 -350 -300 -250 -20Q -150 -100 -50 50
TEMPERATURE T - T R T (NOT)
100
Figure 3.1 Master curve (solid line), 5% confidence on master curve (dashed Dne), ASME lower-bound Kj c curve (dotted line), and EPRI Ki c data
31 NUREG/CR-4219, Vol. 10, No. 2

Material
4 to
o
160
150 140
130
120
110
100
90 80
70
60
50
40
30
20
10
OBNL-DWG 94-3684 ETD
1 1 1 1 i I 1 1 ASME Data & Midland Master Curve PI JS L.B . from 6-1/2TCT Specimens
§ -O 1TCT Specimens § -— D
A 2TCT 4TCT
Specimens Specimens
— — V 6TCT Specimens —
O 8TCT & 10TCT Specimens O/ o O/ o V A
-A k
V V
/ — / t
f / ~ / - D° g a
°A °B/ 4 '•A
V a •
t
o 08 I 3 4 *v Ts a '•A
* —
- o JO
3§ og j i idf o _,„ -
-
o _,„ -
1 1 1 i I 1 1 1 1 -400 -350 -300 -250 -200 -150 -100 - 5 0
TEMPERATURE T - T R T ( N D T ) ° F 50 100
Figure 3.2 Master curve and 5% confidence curve developed from six 1/2T compact specimens and drop-weight NDT tests on Midland weld WF-70 and EPRI Ki c data
present technical information related to transition range test standard issues. A sixth revision to the draft test practice has been prepared using considerable portions of the information presented. Distribution in this case has been limited to only a few of the E08.08.03 task group members.
Data for test temperatures lower than -160°C had been omitted from the lower-bound curve fit; as a consequence, the lower-bound asymptotic value had been set at 36.5 MPaVm (33.2 ksiVin.) instead of the actual 26.1-MPa-v/m (23.7-ksiVnT.) lower bound of all the data (Fig. 3.4).
3.1.2 Evaluation of the Bases for the ASME Kic Curve
The objective of this task was to review the data reported in the EPRI report, entided "Haw Evaluation Procedures: ASME Section XI," and compare it to the lower-bound plots in Appendix A of Sect. XI of the "American Society of Mechanical Engineers (ASME) Boiler and Pressure Vessel Code." The Kj c curve used in the code was manually constructed, and mis curve did not fit the commonly used mathematically expressed Kj c curve of the EPRI report (Fig. 3.3). Also shown is an alternative expression developed later by Yukawa with modified constants designed to more closely fit the manually constructed curve.
A comparison is made here that reflects a new philosophy on how data scatter in Kj c type tests can be managed so that the transition temperature can be more accurately defined. The ASME curve represents a concept that massive data collection can be used to establish a lower-bound curve of universal shape. Also transition temperature effects from empirical tests are reliably related to the sharp crack fracture mechanics transition behavior of materials. The Weibull approach uses the more easily (and more accurately) defined median of data scatter from relatively few fracture mechanics tests to establish the transition temperature. Data scatter characteristics of transition temperature data are defined, and consequently a confidence limit approach to establishing a lower bound of fracture toughness can be adopted.
A few errors of little significance to the construction of the lower-bound curve were found in the EPRI Ki c tabulated data.
Data from the Heavy-Section Steel Irradiation (HSSI) Program were used to evaluate the two proposed
NUREG/CR-4219, Vol. 10, No. 2 32

Material 3 5 0
•2 300
CO £ 2 5 0
if) CO LU 2 0 0 X o O 150 I—
u a: ID t-o <
100
5 0 -
ORNL-DWG 94-3685 ETD
1 1 1 1 1 1 1 : ; 1 •* i
1 1 : ; 1 •* i
EPRI K J c Equotfon (EPRI NP-719) / / — • ; o HSST-01 Subarc Weld • I
o A533B CIoss t Suborc Weld • / - A A533B Weld HA2 / / •"
• HSST-02 ; / • A533B Class J Weld • 1
- * A509 Class 2 ; 1
•It
—
-•II •//
• 7 '
* / ' ft / /
-
A °m a / / — o _ • / * -* u* /V
i i t t i
V
—
i i t t i f f f - 2 5 0 - 2 0 0 -150 -100 - 5 0 0
T - R T N 0 T (°F) 5 0 100 150 2 0 0
Figure 3.3 EPRI Ki c data and three lower-bound curves. Hand-drawn curve, ASME Code prior to 1993 (solid line), EPRI equation (dashed curve), and Yukawa fit to old ASME curve (dotted curve)
ORNL-DWG 94-6729
200
175
150
n 125
100
75
o HSST 01 sw a A533B sw o HSST 01 «r HSST 03 • A533B CI • HSST 02 • A533B w A A533B w HAZ A A508
K|C-WE1BULL K ( c -W95 K|C-W99 EPRI
" i ' i r
8
•*.
B T V
0 I i i ' ' ' i i i i 1 i i L _ J I ' • • • ' • ' i i I i i i i I -400 -300 -200 -100 0 100 200
T-RT N D T(°F)
Figure 3.4 Plot of entire EPRI data bank showing all 174 data values. Weibull master curve, 5% and 1% Weibull confidence and EPRI curve
33 NUREG/CR-4219, Vol. 10, No. 2

Material mathematical lower-bound Kj c curves. Included in this data set were two weld metals and more than 200 compact specimens ranging in size from IT to 8T (Fig. 3.5). These data were found to be bounded by the EPRI curve, and this information was passed along at ASME Code meetings and to the Working Group on Flaw Evaluation. This resulted in the adoption of the EPRI equation to replace the former ASME Ki c curve. The changes were officially published in the 1992 Addenda to Section XI. The equation used is
K I c =33.2 + 20.734 exp [0.02(T - RTNDT)] • ksWiiT
A letter report, "A Preliminary Review for the Bases for the Kic Curve in the ASME Code," by R. K. Nanstad, J. A. Keeney, and D. E. McCabe (ORNL/NRC/LTR-93/15), was issued July 12,1993.
3.2 Characterization of Materials for Structural Tests (S. K. Iskander, J. J. Henry, Jr., and E. T. Manneschmidt)
The results of tests to characterize and develop materials for several HSST Program tasks are presented here. Given first is a comparison of the fracture toughness of IT compact C(T) specimens with initial notch prepared with three different techniques. These IT C(T) specimens were tested at temperatures that correspond to lower-shelf and lower-transition temperatures.
Also included are posttest tensile properties of material from the development phase of the biaxial beam tests (an A 533 grade B class 1 plate material remaining from the WP-CE specimen halves).
Plans for several of the HSST tasks require the use of materials whose relevant properties simulate "prototypical" irradiated reactor pressure vessel (RPV) base and clad metal properties. A typical RPV steel with potential to simulate the required irradiated base metal properties is a specially heat-treated A 533 grade B plate. Tensile and Charpy V-noteh (CVN) impact tests on A 533 grade B plate in two heat-treated conditions have been performed. Also, the fracture toughness of several surrogate cladding materials has been measured. The development of these surrogate materials is ongoing and will be presented when this subtask is complete.
Some characterization (the RTNDT) of the weld metal from a circumferential weld of an unused RPV was determined and presented in the previous semiannual. Tensile and CVN tests have since been performed, and more characterization on the axial weld from this same vessel is planned and will be reported when the characterization tasks are completed. The axial weld from the same vessel is being used in the full-thickness shallow-flaw beam tests performed at the National Institute for Standards and Technology (NIST).
ORNL-DWG 94-3686 ETD 350
|2 300
en =i 250
W Ld
X O
O
Ul DC
200
150
100
< F 50
i 1 1 1 ASME Code K l c Curve EPRI K : c Equation (EPRI NP-719) Yukawa Equation
o EPRI Data • HSSI Welds 72W and 73W
Unirradiated
I
T T
- 250 -200 -150 -100 - 5 0 0
T - R T N D T (°F) 50 100 150 200
Figure 3.5 Three lower-bound curves shown in Fig. 33 with EPRI and HSSI Fifth Irradiation Series K j c data
NUREG/CR-4219, Vol. 10, No. 2 34

3.2.1 Effect of Notch Preparation on Fracture Toughness (S. K. Iskander, R. L. Swain, and W. J. McAfee)
The standard ASTM methods to determine fracture toughness prescribe fatigue precracked initial notches. For large test specimens with long flaws, this may be impractical, and the HSST Program has often used the electron-beam/hydrogen (EB/H2) charging technique pioneered by Canonico and Hudson.2 This method has been used for both the thermal shock and the pressurized-thermal-shock series of tests.3 Flaws for the biaxial beam tests performed to date have been prepared using fatigue precracking that, because of the specific manufacturing sequence of these beams, is time-consuming and expensive. A small task to explore more efficient notch preparation techniques for the biaxial beams has been completed and summarized below.
Initial notches were prepared in IT C(T) specimens in the L-S orientation by (1) fatigue precracking, (2) electro-discharge machining (EDM) of a flaw with a 0.050-mm (0.002-in.) root radius, and (3) hydrogen charging an electron-beam weld. None of the specimens were side-grooved. The IT C(T) specimens were machined from
Material HSST Plate 14 in the as-received condition. The CVN impact energy of material from HSST Plate 14 (A 533 grade B class 2) in the as-received condition in the L-S orientation is given in Fig. 3.6. The 41-J transition temperature is -6°C. It is noteworthy that tests on an A 212 grade B material [used for the High Flux Isotope Reactor (HFIR) RPV] in this same orientation exhibited a very narrow transition temperature region, with energies well in excess of 250 J on the upper-shelf region.4 Temperatures of-85 and -30°C were chosen for testing the IT C(T) specimens. These temperatures would probably bracket the range of test temperatures for the biaxial beams and correspond to lower shelf and lower transition, respectively.
The cleavage initiation fracture toughness (Kj c ) of the material was first determined using the standard fatigue precracking technique. Six specimens were tested at each of the two temperatures. The mean Kj c values [and standard deviation (a)] are 49.7 (7.1) and 112.9 (23) MPa-s/m at -85 and -30°C, respectively. Six tests at the each of these two temperatures were made on the specimens prepared by EDM of a flaw with a 0.050-mm (0.002-in.) root radius. Otherwise, the geometry was that of the standard IT C(T) specimen. The means (and a's) were 115 (20) and 238 (38) MPa Vm. Thus, the apparent "Kj c"
250 r ORNL-DWG 94-3687 ETD
200 :
150 : —3
en
2 100
50 :
-1—r | 1 1—r—1—J—r T 1 f""|™ 1 * * * * 1
HSST Plate 014 - As Recieved
A533B Class 2 L-S Orientation
• * i i . i . . I • • . . 0 - 1 0 0 - 5 0 0 50 100 150 200 250 300
Test Temperature (°C)
Figure 3.6 Results of CVN impact energy of specimens in the L-S orientation from A 533 grade B class 2 material (HSST Plate 14) in the as-received condition
35 NUREG/CR-4219, Vol. 10, No. 2

Material at each temperature for the EDM notches is at least twice as high as that of the standard fatigue precracked specimen. The trend is the same as that found by Joyce and Link5 in their investigation on the effect of EDM notches (with the same nominal root radius as in this study) on die ductile fracture toughness of several structural alloys at upper-shelf temperatures. One of these alloys is an A 533 grade B pressure vessel steel. The average Kj c for the three A 533 grade B specimens with EDM notches was 263 MPa-vm compared to 221 MPa-vm for the two fatigue precracked specimens, or an elevation of apparent "Kj c" for the EDM notches of 20%.
Six tests at -30°C were performed on specimens with notches prepared by EB/H2 charging. Three of the six specimens had a pop-in, and the average Kj c of these specimens was about 30% higher than that of the fatigue precracked specimens, whereas it was 30% lower in the three specimens that did not experience a pop-in. Hydrogen that remained in the flaw region may have influenced the results. The six remaining IT C(T) specimens with an EB/H2 flaw were baked at 140 to 150°C for 90 h to drive out the residual hydrogen that may have been in the flaw region and could have influenced the results. They were then tested at -30°C. The mean and standard deviation of the Kjc's for these six specimens are 105 and 41 MPa-v/m, respectively, compared to 113 and 23 MPa-v/m for the six fatigue precracked specimens. Thus, the mean for the baked specimens is about 7% lower than the mean for the precracked specimens. The corresponding figures for the six EB/H2 specimens that were not baked are 112 and 37 MPa Vm . Thus, remnant H2 does not seem to have played a major role in the mean values or the scatter of the data. The mean and standard deviation for all 12 EB/H2 specimens are 109 and 37 MPa-y/m, respectively. Thus, the mean Kj of all 12 EB/H2 specimens is only 4% lower than that of the precracked specimens, but the scatter is significantly higher.
3.2.2 Young's Modulus and Poisson's Ratio Measurements for CE-WP Material (S. K. Iskander, J. J. Henry, Jr., J. T. Hutton, D. L. Thomas, and W. A. Simpson, Jr.)
Some of the first biaxial tests were performed using an A 533 grade B class 1 material that was previously used in the HSST Combustion Engineering (CE)-Wide Plate (WP) series of tests, and some limited information exists from the characterizations performed by both CE and Oak Ridge National Laboratory (ORNL). Recently, stress-strain curves, Young's modulus, and Poisson's ratio were measured as a function of temperature for the CE-WP material. The material originated from the HSST CE-WP test specimen halves. The 1x1x0.1m wide plate test
sections were from a 244-mm-thick plate that was split through the thickness middle.6
Six 6.35-mm (0.25-in.) gage diameter tensile specimens were machined so that the longitudinal axes were in the transverse orientation (T-orientation specimens). The fracture plane for T-orientation specimens would then be parallel to that in which the flaw propagated in the biaxial tests. Two specimens were tested at each of the following temperatures: room temperature (23), -18, and -46°C (73, 0, and -50°F). In addition to these six specimens, two tensile specimens were machined in the same plane but in the L-orientation, i.e., normal to the T-orientation, and were tested at room temperature only. A clip-on extensometer* was used to obtain a stress-strain curve that could be digitized from the vicinity of yielding to about 25% strain.
The data from all eight tests have been digitized into a spreadsheet format. After digitizing, an apparent Young's modulus was calculated by regression fitting a straight line to the initial portion of the stress strain curve. This Young's modulus may not be accurate''' because of the limitations of the extensometer. The elastic strain was then subtracted from all the recorded strains, to give a set of values of plastic strain and stress. All strain values mentioned in this report are the engineering strain, defined as the change in the gage length divided by the original gage length. Elastic strains were then calculated from more accurately measured values of Young's modulus as described later and added to the plastic strains to give the final stress-strain. Figure 3.7 shows the resulting stress-strain curves for aU the T-orientation specimens tested. This material exhibits pronounced upper and lower yield points, which may be important in the numerical analysis of the crack-tip stresses. A typical stress-strain plot of that region is shown in Fig. 3.8. There is no significant difference in the stress-strain curves between specimens machined in either the transverse or longitudinal orientations, as may be seen in Fig. 3.9 The measured tensile strength properties as a function of temperature have been summarized in Table 3.1 and plotted in Fig. 3.10. The figure also compares the recently measured room temperature transverse tensile strengths to those published in NUREG/CR-5408 (Ref. 6). The observed differences are probably caused by scatter of properties due to the different locations in the plate from which the test specimens were obtained.
The yield and ultimate strengths can be obtained from a load-stroke chart.
tTo the author's knowledge, the class A or B-1 extensometer prescribed in ASTM E 111 for determination of Young's modulus are not commercially available as clip-on extensometers and, as descibed later, electric resistance strain gages were used.
NUREG/CR-4219, Vol. 10, No. 2

Material
o Q_
w CO CD
to
700
650
600
550
500
450
400
- I — i — i — i — i — r ORNL-DWG 94-3688 ETD
— T 1 > r
A533B Class 1 (WP-CE) Material -46°C
350
Biaxial Specimen Surface Material T — Orientation
-J—,—I 1 L.
0.00 0.05 0.10 0.15 0.20 0.25
Strain (mm/mm)
Figure 3.7 Stress-strain data for all the T-orientation specimens from the WP-CE material used in the initial biaxial beam tests
600
550
D Q_ 500
CO CO P 450
CO
400
350
i i i i I i • i i I i i i i I i i i i I i i • i I
ORNL-DWG 94-3689 ETD I i i i i I i i i > I i i i
A533B Class 1 (WP-CE) Material
fV_
Test Temperature —46°C Biaxial Specimen Surface Material T — Orientation
* • • • * • • • * * i • • • * • * * • * • • • • * • ' • • * * • 1 • • t • • • • * • • ' •
0.000 0.005 0.010 0.015 0.020 0.025 0.030 0.035 0.040 0.045 0.050
Strain (mm/mm) Figure 3.8 Magnification of typical stress-strain yielding behavior of the WP-CE material showing upper and lower
yield points 37 NUREG/CR-4219, Vol. 10, No. 2

Material ORNL-DWG 94-3690 ETD
700 i—i—i—i—i—r
A533B Class 1 (WP-CE) Material T
Biaxial Specimen Surface Material Tested at Room Temperature
T Orientation • • • L Orientation
350 * 0.00 0.05 0.10 0.15 0.20 0.25
Strain ( m m / m m )
Figure 3.9 Comparison of stress-strain curves in longitudinal and transverse orientations at room temperature for WP-CE material
Table 3.1 Tensile properties of A 533 grade B class 1 material (WP-CE) used in the first series of biaxial tests
Temperature
Strength Total
elongation (*)
Temperature 0.2% yield Ultimate Total elongation
(*)
Reduction of area
(%) Specimen [°C(°F)] [MPa (ksi)] [MPa (ksi)]
Total elongation
(*)
Reduction of area
(%)
Normal to rolling direction (transverse)
CEWPT6 -46 -50 466 67.6 642 93.1 27 67 CEWPT5 ^16 -50 470 68.2 641 92.9 28 70 CEWPT3 -18 0 439 63.7 615 89.2 27 69 CEWPT4 -18 0 459 66.5 618 89.6 26 71 CEWPT2 23 73 411 59.6 578 83.8 28 72 CEWPT1 23 73 All 61.1 578 83.8 26 71
Parallel to rolling direction (longitudinal) CEWPL2 23 73 All 61.1 578 83.8 26 71 CEWPL1 23 73 422 61.2 583 84.6 28 72
NUREG/CR-4219, Vol. 10, No. 2 38

Material
700 ORNL-DWG 94-3691 ETD
~f I ^ ~ | - T " ' | " T - l " ' p I I I I | '> I I I ) " I l"" l T I " I I - I T - | "T " I — T ~ l \ l " T f •'!•• I
^ 600 Q_
S 500 CO
400 -
A533B Class 1 (WP-CE) Material
U l t trans = 5 " ~ ° " 9 2 2 T ' ( ~ 4 6 * T ^ 2 3 ) '.
Material from Top Surface NUREG/CR-of Biaxial Test Specimen 5 4 0 8
Trans Long T r a n s
Yield V A Ultimate • A
O •
1 • • •
Yield ran„ = 434 - 0.757T, (-46 * T £ 23) trans 1 ' • * • ' ' • • ' ' • • • r * • ' ' • ' ' • t • *
- 5 0 - 4 0 - 3 0 - 2 0 - 1 0 0 10 20 30 Temperature T (°C)
Figure 3.10 Yield and ultimate tensile strengths as a function of temperature for WP-CE material
The static Young's modulus (E) and Poisson's ratio (v) were measured as a function of temperature (T) in the T-orientation and in the temperature range -100 < T < 24 (T in °C) [-148 < T < 75 (T in °F)J and can be calculated from
E = 206-0.0809T (E in GPa and T in °C),
E = 30.1-0.00652 T (E in 1000 ksi and T in °F),
and
v = 0.273 + 9.14 10- 5 T (T in °C),
v = 0.271 + 5.08 10- 5 T (T in °F).
The experimental data and these expressions, together with the single acoustically measured value of Young's modulus, are shown in Fig. 3.11. Also included is the so-called EPRI expression7 that has often been used by ORNL, as well as the tabular values given in Table 1-6.0 of Appendix I, Division 1, Sect. Ill, of the "ASME Boiler and Pressure Vessel Code." The maximum difference between the measured values and the EPRI expression is <l%. The difference between the measured values and the ASME values is somewhat more.
The above values of E and v were measured from a single 100-mm-long rectangular 25- by 6-mm cross-sectional bar.
On each of the 25-mm sides, a longitudinal and transverse electric resistance strain gage was installed. Each gage was connected to its own bridge and recorded separately. The bar was then loaded in six steps to a maximum value of 280 MPa and then unloaded by the same number of steps. The procedures given in ASTM Standard Test Methods for Young's Modulus, E 111, and Poisson's Ratio E132 were used. The first load step is used as the initial load and subtracted from each load to give a series of incremental loads. The strain values from similarly oriented gages were averaged to compensate for misalignment. The values of E and v were then calculated by fitting a straight line to the data using linear regression. This procedure was performed at each temperature of interest It can be shown that the process of subtracting me initial load compensates for the gage temperature effects caused by the difference of coefficients of expansion of gage and test specimen. These effects can be considerable at the low temperatures shown in Fig. 3.10, even when temperature-compensated gages are used.
The dynamic Young's modulus (E<jyn) and Poisson's ratio (vdyn) in the longitudinal (rolling) and transverse (L- and T-) orientations were measured at room temperature using an ultrasonic technique. Measurements did not reveal any anisotropy. Within the error of dynamic measurements, there does not seem to be any anisotropy. In eitiier the
NUREG/CR-4219, Vol. 10, No. 2

Material ORNL-DWG 94-3692 ETD
O Q_ O CD
_ D Z5
o
in en c =3 O
>-'
A533B Class 1 (WP--CE) 220
E = 206-0.0809T
\ > ^ ^ ORNL electric resistance ^ • ^ ^ strain gaoe measurements •
i 1
i
210
^ " •"-« ^ v - ^ Ultrasonic \
^ * ^ > ^ ^ EPRI Expression ^ S ^ E = 207.2-0.0571T.
200
& Table I -6.0 ASME Boiler & Pressure Vessel Code Sect III, Dlv. 1 Appendix 1, July 1 , 1989
A
- 150 - 1 0 0 - 5 0 0 Temperature (°C)
50
Figure 3.11 Young's modulus as function of temperature as experimentally determined, compared with dynamicaUy measured value at room temperature and other sources indicated
transverse or longitudinal direction, the average values for Edyn and Vdyn are 213 GPa (30.9 ksi) and 0.29. The dynamic properties Edyn and Vdyn> which are relatively simple to measure, are useful in determining if anisotropy exists. The room temperature dynamic Young's modulus is 4% higher than the static value and is the one commonly used in stress analysis. The static values are relatively more difficult to measure because of the high-accuracy strain measurements needed and were determined using electric resistance strain gages as described above.
3.2.3 Development of Material Specifications to Simulate Irradiated Material for the Biaxial and Cladding Effects Tasks (S. K. Iskander, G. M. Goodwin, J. F. King, and D. J. Alexander)
The purpose of the Biaxial Loading Effects Task is to investigate the influence of constraint on the shallow-crack initiation fracture toughness for typical RPV material. For this task, material and heat treatment specifications are being developed mat would simulate the tensile and CVN energy of irradiated material. Desirable goals are a temperature at the 68-J Charpy impact energy level >50°C (120°F) and the room temperature yield strength in the range of 620 to 690 MPa (90 to 100 ksi). A typical RPV steel with potential to simulate the required irradiated base metal properties is a specially heat-treated A 533 grade B
plate. Tensile and CVN impact tests on an A 533 grade B plate in two heat-treated conditions have been performed. Also, the fracture toughness of several surrogate cladding materials has been measured. The development of mese surrogate materials is ongoing and will be presented when this subtask is complete.
An ideal method to develop such a heat treatment would be to use the ORNL heat-cycle simulation equipment. This allows various heating or cooling rates to be easily simulated on six relatively small bars simultaneously. Twenty bars of material from HSST Plate 014 were prepared. These bars could readily be machined into tensile or CVN specimens and tested. Thus, several heat treatments could be investigated in a relatively short period. This equipment has not been used for many years, and a considerable effort was made to reactivate it. After a while, it became clear that the costs would be greater than anticipated, and potential use of this facility was discontinued for mis project.
3.3 Thermal Aging of Stainless Steel Cladding (F. M. Haggag and R. K. Nanstad)
Thermal aging at relatively low temperatures (343°C) has been shown to significantly degrade the Charpy impact
NUREG/CR-4219, Vol. 10, No. 2 40

Material toughness of type 308 stainless steel welds. The stainless steel cladding applied to the inner surface of RPVs is very similar to that material: Hence, an experimental program was initiated to evaluate the effects of thermal aging on stainless steel cladding relative to its contribution to toughness degradation during irradiation experiments as well as long-term effects.
Results from testing of unaged material and material aged for 1600 h were presented in a previous progress report.8
Thermal aging of stainless steel cladding at 288°C, and the ferritic steel on which it is overlaid, to 20,000 h has been completed. Charpy impact, tensile, and 0.5 TC(T) specimens are being fabricated and prepared for testing. Thermal aging at 288°C to an accumulated time of 50,000 h is in progress. Other cladding specimens are being aged at 343°C together with a type 308 stainless steel weld from another Nuclear Regulatory Commission (NRC) program. The results from the somewhat higher aging temperature will allow for direct comparison with the aging effects on the other material and will provide some indication of the response of the stainless steel cladding to different aging temperatures. All the results from the 20,000-h aging cycle will be presented in the next report.
3.4 J-R Curve Evaluations of A 302 Grade B Steel (D. E. McCabe)
Seven plates of vintage A 302 grade B (modified) steel and one early vintage plate of A 533 grade B class 1 steel have been obtained from the General Electric Co. in San Jose, California. A proposed text matrix was formulated and forwarded to the NRC project monitor. The matrix has been evaluated, discussed, and revised to accommodate review comments from NRC.
CVN curves have been produced for four of the seven A 302 grade B plates and the early vintage A 533 grade B plate. Separate CVN curves were developed for the T-L, L-T, and L-S orientations. Upper-shelf toughnesses ranged from 116 to 173 J (85 to 126 ft-lb) in the T-L direction, 173 to 219 J (126 to 160 ft-lb) in the L-T direction, and 164 to 234 J (120 to 171 ft-lb) in the L-S orientation. Transition temperatures, as defined by the 50% shear criterion, were generally below room temperature. J-R curves currently under development have looked to be consistent with the upper-shelf CVN energies noted.
References
1. American Society of Mechanical Engineers, Section XI Task Group on Flaw Evaluation, "Flaw Evaluation
Procedures: ASME Section XI," EPRINP-719-SR, August 1978.
2. D. A. Canonico and J. D. Hudson, Union Carbide Corp., Oak Ridge Natl. Lab., Technique for Generating Sharp Cracks in Low-Alloy High Strength Steels, pp. 60-64 in "Heavy-Section Steel Technology Program Semiann. Prog. Rep. for Period Ending February 28,1971," ORNL-4681, December 1971.*
3. P. P. Holz, Union Carbide Corp., Oak Ridge Natl. Lab., "Flaw Preparations for HSST Program Vessel Fracture Mechanics Testing: Mechanical Cyclic Pumping and Electron Beam Weld-Hydrogen-Charge Cracking Schemes," USNRC Report NUREG/CR-1274 (ORNL/NUREG/TM-369), 1980.*
4. R. D. Cheverton, J. G. Merkle, and R. K. Nanstad, Eds., Martin Marietta Energy Systems, Inc., Oak Ridge Natl. Lab., "Evaluation of HFIR Pressure Vessel Integrity Considering Radiation Embrittlement," ORNL/TM-10444, April 1988.*
5. J. A. Joyce and R. E. Link, U.S. Naval Academy, Naval Surface Warfare Center, "The Effect of Electric Discharge Machined Notches on the Fracture Toughness of Several Structural Alloys," USNRC Report NUREG/CR-5981 (CDNSWC/SSM-61-93/01), September 1993.*
6. D. J. Naus et al., Martin Marietta Energy Systems, Inc., Oak Ridge Natl. Lab., "SEN Wide-Plate Crack-Arrest Testing Using A 533 Grade B Class 1 Material: WP-CE Test Series," USNRC Report NUREG/CR-5408 (ORNL/TM-11269), November 1989.*
7. W. L. Server, J. W. Sheckherd, and R. A.Wullaert, Electric Power Research Institute, "Fracture Toughness Data for Ferritic Nuclear Pressure Vessel Materials," EPRI NP-119, April 1976.
8. R. K. Nanstad, Martin Marietta Energy Systems, Inc., Oak Ridge Natl. Lab., Material Characterization and Properties, pp. 23-28 in "Heavy-Section Steel Technology Program Semiannual Progress Report for April-September 1991," USNRC Report NUREG/CR-4219, Vol. 8, No. 2 (ORNDTM-9593/V8&N2), April 1992.*
Available for purchase from National Technical Information Service, Springfield, VA 22161
41 NUREG/CR-4219, Vol. 10, No. 2


4 Special Technical Assistance J. G. Merkle
4.1 Closed-Form Stress Intensity Factor Calculations for Reactor Pressure Vessels Under Constant-Rate Temperature Change Loading
4.1.1 Background
Most fundamental structural design and safety analysis problems have been initially posed, sometimes in necessarily simplified terms, and solved in mathematically closed form, with less restricted numerical solutions being developed later. Such was not the case for the calculation of stress intensity factors (SIFs)for surface cracks in reactor pressure vessels (RPVs) subjected to thermal loading. Because the initial calculations performed in the late 1960s and early 1970s involved transient stresses caused by thermal-shock loading, for which closed-form solutions do not exist, the first thermal KT calculations were numerical. Despite an early closed-form solution by Yukawa for a beam under steady state cooldown,1 the numerical trend has otherwise persisted. This is true even though the most common thermal Ki calculations are for constant rate cooldown or heatup, for which applicable, albeit overlooked,-closed-form thermal and stress analysis equations do exist. In addition, numerical inaccuracies have occurred in existing thermal KT calculations, and existing numerical results do not clearly reveal the effects of material properties and vessel dimensions on the calculated values of Kj. Thus, it has become desirable to take advantage of the existing closed-form thermal and stress analysis equations applicable to constant-rate cooldown and heatup loading and to develop a closed-form procedure for calculating thermal Ki values for RPVs. The equations to be derived herein do not consider the material property differences between cladding and base metal. This simplification should have only a minor effect on the accuracy of Level A and B KT calculations for cracks as deep as t/4. The effect would be greater for shallower cracks with depths of the order of the clad thickness. However, the level C and D loadings that govern the behavior of postulated shallow cracks may not be steady state. Therefore, the following equations may not be appropriate for Level C and D analyses.
4.1.2 Thermal Analysis
Steady state cooldown or heatup of an RPV is defined as the limiting condition asymptotically approached as the result of an imposed constant rate of change of temperature at the inside surface of the vessel with the outside surface completely insulated. Under the asymptotic cooldown or
heatup condition, the rate of temperature change at each point in the vessel wall is the same. Thus, the temperature profile remains constant, but the absolute temperatures are all changing at the same rate. For a vessel material with a constant specific heat, the temperature profile is mathematically the same as for a hollow cylindrical nuclear fuel element with internal cooling, external insulation, and a uniform internal rate of volumetric heat generation. In both cases, the rate of energy flow to or from each unit volume is constant with both position and time.
Thermal and elastic stress distribution solutions for various heat generating geometries and boundary conditions were published in a table2 in the November 1960 issue of Nucleonics magazine. This table was reproduced verbatim in Vol. IV of the Reactor Handbook, second edition.3 Case 3(c) of the table from Ref. 2 is a hollow cylinder with inner surface cooled and outer surface insulated. The through-wall temperature difference is proportional to q"7k, where q'" is the uniform volumetric heat generation rate and k is the thermal conductivity. For a constant cooling rate, the substitution
q'" = (CR) cy (1)
defines the uniform volumetric energy loss rate, where c is specific heat and y is density. Consequently,
q'" (CR) cy k k
Because thermal diffusivity d is defined by
k
(2)
d = cy
(3)
the final substitution becomes
(CR) k
(4)
Using Eq. (4) and the equations for Case 3(c) in Ref. 2, the through-wall temperature profile is given by
T-T . (CR)r0
2
4d In
^
VriV
(r \ 2 f ^
\T°J r ,(5)
43 NUREG/CR-4219, Vol. 10, No. 2

Special where T is the temperature at a specified radius r, Tj is the inside surface temperature, and r; and r0 are the inner and outer radii, respectively. Equation (5) shows that the through-wall temperature difference for a given cooling rate depends inversely on the thermal diffusivity and is given by where
— = 2 C ' n z n , (10)
T 0 -T i = (CRK 4d
In riy
f \ 2
(6)
and
x z = - ,
a (11)
4.1.3 Stress Analysis
Again using Eq. (4) and Ref. 2, the circumferential thermal stress is given by
x = r - r i ? (12)
can easily be fit to the stresses calculated from Eq. (7), over the interval 0 < z < 1, by using the values of a /o" f t at z = 0, 1/3,2/3, and 1. Let
c e = R -
where
( ~\ f-\2
vw - 5
l + |i
l - ' A '« /
In ^
KhJ -In
R = E a (CR) r0
2
(l - v) 4d
(7)
and in which E is the elastic modulus, a is the thermal expansion coefficient, and v is Poisson's ratio. From Eq. (8), the inside surface thermal stress is given by
(8)
- 1 . ' f t
, by using determinants,
c = 1,
C'l 18q 1 / 3 -•9*V3 + 2qL
C'l 2 »
c'2 = - ^ I A f36q 2 / 3 - 9 < h c'2 = 2
and
(13)
(14)
(15)
(16)
* 0 = R
In U^
r„ ;
3 + i.
2 f. \)
1-\To.
(9) , 2 7 £ l l / 3 - 2 7 ^ +
9 ( l l C =
4.1.5 Calculation of SIFs
(17)
4.1.4 Polynomial Representation of Stresses Over the Crack Depth
To calculate SIFs using available polynomial-based influence coefficients, it is necessary to represent the stress distribution over the crack depth by a polynomial equation. A third-degree polynomial equation having the form
Polynomial influence coefficients for calculating SIFs for finite-length surface cracks in plates have recently been tabulated by the American Society of Mechanical Engineers Section XI Working Group on Flaw Evaluation. Crack depth and surface length are denoted by a and £, respectively. The tabulation includes values of Gj for
NUREG/CR-4219, Vol. 10, No. 2 44

Special a/ £ = 0.1 and 0.2, but not for a/ £ = 1/6. However, a linear interpolation is easily performed, using
G i(V6)-iG i(0.1) + | G i ( 0 ^ ) .
Calculating the elliptic integral <I> from
® = Jl + 4.593 -1.65
values of Kit are calculable from
(18)
(19)
Kit = (G 0 + Ci Gi + C 2 G 2 + C!$ G 3 ) ^ - VST . (20)
4.1.6 Discussion
The same temperature profile and stress distribution equations just given can be obtained by straightforward algebraic substitutions, for the particular boundary conditions involved, from the general solutions given in the book on Thermal Stress Techniques in the Nuclear Industry, by Zudans et al. 4 However, with the use of basic principles and Timoshenko's5 thermal stress equations, it is no more difficult to do the derivations "from scratch."
References 1. PVRC Recommendations on Toughness Requirements
for Ferritic Materials, WRC-175, Welding Research Council, New York, August 1972.
2. R. Hankel, "Stress and Temperature Distributions," Nucleonics, 18(11), 168-69 (November I960).*
3. S. McLain and J. H. Martins, Eds., Reactor Handbook, Vol. IV, Second Edition, Interscience Publishers, New York, 1964.
4. Z. Zudans, T. D. Yen, and W. H. Steigelmann, Thermal Stress Techniques in the Nuclear Industry, American Elsevier Publishing Company, New York, 1965.
5. S. P. Timoshenko and J. N. Goodier, Theory of Elasticity, Third Edition, McGraw-Hill, New York, 1987.
'Available in public technical libraries.
45 NUREG/CR-4219, Vol. 10, No. 2


5 Fracture Analysis Computer Programs
T.L.
5.1 FAVOR Work continued on the development of the FAVOR (Fracture Analysis of Vessels: 0_ak Ridge) computer code.1
The stress intensity factor influence coefficients (SMCs) for infinite-length axial and continuous circumferential flaws,2 which were previously generated by the NQA-1 ABAQUS code,3 were implemented into FAVOR. Problems were executed to benchmark the implementation of these influence coefficients into FAVOR. The difference between direct ABAQUS finite-element solutions and the FAVOR solutions, which utilize the influence coefficients and superposition, was <1%.
The FAVOR User Guide is -75% complete. It presently contains -20 sample problems that demonstrate the various options and capabilities of the code. These sample problems are intended to serve as a tutorial for new users. Work was also initiated on a Programmers's Guide during this period. The output formats of the FAVOR output reports were "cleaned up" and enhanced. Some effort was expended on internal code documentation.
An executable version of the FAVOR code can be created using the LAHEY FORTRAN compiler that has provisions to create executables that may be run on 386 or 486 PC hardware on which the LAHEY software does not reside. This option allows that FAVOR executables can be distributed to end users without distributing the source code; this is a necessity if configuration control of the code is to be maintained. Configuration control ensures that all users will obtain identical solutions for a particular input data set when using the same FAVOR release number. Configuration control avoids problems such as that encountered during the review of the Yankee Rowe PTS analysis.4
During the Yankee Rowe review, a considerable effort was expended to determine the nature and implications of modifications that had been made to the "baseline version" of the source code by the consultant who performed the analysis.
An option was incorporated into the FAVOR code that allows the user to input stylized thermal transients in either the form of an exponential decay or a linear cooldown rate. This option is in addition to the method of inputting up to 100 coolant temperature/time history pairs.
An option was incorporated into FAVOR that facilitates performing probabilistic fracture mechanics (PFM) analyses over a range of fracture-related data. Specifically, this option provides the capability to perform up to 11 PFM analyses with a single computer execution by varying either the fluence, copper, nickel, flaw density, or RTNDT of all of the subregions in the model. This option dramatically increases the productivity of an analyst who is performing PFM analyses over a range of sensitivity parameters.
In the near term, it is anticipated that the matrix of SMCs that was recently generated (see Task 8) for axially oriented semielliptical flaw geometries for clad reactor pressure vessels (RPVs) with an internal radius-to-wall thickness ratio (Ri/t) of 10 will be implemented into the FAVOR code. This will provide the FAVOR code wim the ability to perform deterministic and probabilistic fracture analyses for axially oriented semielliptical flaws with aspect ratios of 2,6, and 10 as well as infinite-length flaws. Deterministic and probabilistic fracture analyses performed for semielliptical flaw geometries will be able to include the variation of the SIF around the crack front.
In the longer term, it is anticipated that a data base of highly accurate and validated SIFICs for a range of axially and circumferentially oriented, finite-length, semielliptical, inner surface flaw geometries for a range of clad vessel geometries will be incorporated into FAVOR. The incorporation of this SMC data base into FAVOR will facilitate the generation of highly accurate, validated Kj solutions for a wide range of flaw geometries as may be required in a structural integrity assessment of any U.S. pressurized-water or boiling-water reactor geometry. It is.also anticipated that the ability to include clad plasticity will be incorporated into FAVOR in the longer term.
5.2 Benchmarking Exercises
The pressurized-thermal-shock (PTS) benchmark problem draft final report5 was edited. Comments were given to Westinghouse (Bruce Bishop). It was recommended that a topic for future study and benchmarking should be the extension of the PFM methodology for one vessel beltline region containing exactly one flaw to an entire vessel belt-line region containing multiple flaws. Regulatory Guide 1.154 states that the entire vessel beltline region is to be included in the PFM analysis; therefore, plant-specific
NUREG/CR-4219, Vol. 10, No. 2

Fracture
analyses necessarily involve multiple regions (axial welds, circumferential welds, and plates) and multiple flaws. Also, the beltline model may include axial and azimuthal variations of neutron fluence. These are areas of potential future controversy in any plant-specific PTS analyses.
Most of the PFM codes utilized in the PTS benchmark exercise appeared to produce similar results (when using the same modeling assumptions); however, the PTS benchmark exercise was limited to analyzing a single vessel region (axial or circumferential weld) with a single flaw. Extension of the results of PFM analyses for individual vessel regions, each of which is assumed to have one flaw, to the entire vessel beltline region involves several assumptions, each of which has the potential to significantly impact the final calculated frequency of vessel failure. The extension of the PFM methodology for one vessel region containing exactly one flaw to an entire vessel beltline region containing multiple flaws would benefit from discussion and benchmarking.
This recommendation was born out of lessons learned during the Integrated Pressurized Thermal Shock Program6 - 8
and the Yankee Rowe review4 and sensitivity analyses.9
The design criteria used in the development of the FAVOR code was formulated to address these considerations. FAVOR has a rigorous methodology for performing a PFM analysis for the entire vessel beltline, containing many beltline regions (or any subset thereof), containing any number of flaws, distributed in any manner.
The American Society of Mechanical Engineers (ASME) Section XI Working Group on Operating Plant Criteria has defined a benchmark problem to evaluate procedures used to calculate the contribution of cladding to KT during heatup and cooldown transients. Solutions were generated for this benchmark problem and were transmitted to the Nuclear Regulatory Commission (NRC). The solutions were mutually validated by using the FAVOR code and direct AB AQUS finite-element solutions. These solutions will be discussed at the November ASME Section XI meeting.
5.3 Dynamic Crack Arrest
Previous analyses have suggested that the static equilibrium description of cleavage fracture could be overly conservative with regard to predicting postcleavage events such as crack arrest and reinitiation. The static equilibrium method has traditionally been used when performing vessel
NUREG/CR-4219, Vol. 10, No. 2
fracture analyses and is the method currently incorporated in the FAVOR code. One recent publication10 presented an example case in which incorporating dynamic effects into the PFM analysis reduced the conditional probability of failure of an embrittled RPV subjected to PTS by more than an order of magnitude. This could have a profound effect on the results of a Regulatory Guide 1.154 plant-specific PTS analysis.
Analyses have recently been performed to assess the potential impact that the inclusion of dynamic effects could have on the results of a PFM analysis of the RPV subjected to a PTS transient. The result of the publication cited above10
in which the conditional probability of failure was reduced by more than an order of magnitude was verified. It was observed, however, that the particular PTS transient used in the analysis of Ref. 10 had a reheat phase. Further analyses were performed on this transient without the reheat phase and other transients that had varying characteristics, but without a reheat phase.
The conclusions regarding the impact of including dynamic effects into PFM analyses of RPVs subjected to PTS transients follow: • The impact is transient dependent. The impact on tran
sients without a reheat phase was relatively small (reduced the conditional probability of failure by approximately a factor of 2), whereas the impact on transients that include a reheat phase is between 1 and 2 orders of magnitude.
The inclusion of dynamic effects enhances the chance that an initiated (or reinitiated) flaw will arrest. Dynamic effects predict that a propagating flaw will arrest at a shallower depth, relative to the static treatment of a propagating flaw. Reheat transients decrease the chance that an arrested flaw will reinitiate and eventually propagate to failure, relative to the case of a transient without a reheat phase. The synergistic effect of both dynamic effects and reheat considerably increase the chance that a propagating flaw will be arrested and not reinitiated.
• The impact is dependent on the degree of vessel embrit-tlement. As the RTDNT increases, the impact of the inclusion of dynamic effects diminishes.
A survey of the vessels analyzed in the integrated pressurized thermal shock 6 - 8 studies determined that transients with a reheat phase did not make a significant contribution to the overall frequency of vessel failure.

Fracture References 1. T. L. Dickson, "FAVOR: A New Fracture Mechanics
Code for Reactor Pressure Vessels Subjected to Pressurized Thermal Shock," pp. 3-9 in Proceedings of ASME Pressure Vessel and Piping Conference, Denver, Colorado, July 1993, PVP Vol. 250, ASME, 1993.+
2. J. W. Bryson and T. L Dickson, "Stress Intensity Factor Influence Coefficients for Axial and Circumferential Flaws in Reactor Pressure Vessels," pp. 91-99 in Proceedings of ASME Pressure Vessel and Piping Conference in Denver, Colorado, July 1993, PVP Vol. 251, ASME, 1993.t
3. ABAQUS User Manual, Hibbit, Karlsson & Sorenson, Inc., Providence, Rhode Island (1991).
4. T. L. Dickson and R. D. Cheverton, Martin Marietta Energy Systems, Inc., Oak Ridge National Laboratory, "Review of Reactor Pressure Vessel Evaluation Report for Yankee Rowe Nuclear Power Station," Appendix D—ORNL Review of Probabilistic Fracture Mechanics (YAEC No. 1735), USNRC Report NUREG/CR-5799 (ORNL/TM-11982), March 1992.*
5. B. A. Bishop, Draft for Review: Benchmarking of Probabilistic Fracture Mechanics Analyses of Reactor Vessels Subjected to Pressurized Thermal Shock (PTS) Loading, EPRI Research Project 2975-5, March 1993.
6. D. L. Selby et al., Martin Marietta Energy Systems, Inc., Oak Ridge National Laboratory, "Pressurized-
Thermal Shock Evaluation of the H. B. Robinson Nuclear Power Plant," USNRC Report NUREG/ CR-4183 (ORNL/TM-95657/Volume 1), September 1985.*
7. D. L. Selby et al., Martin Marietta Energy Systems, Inc., Oak Ridge National Laboratory, "Pressurized-Thermal Shock Evaluation of the Calvert Cliffs Nuclear Power Plant," USNRC Report NUREG/ CR-4022 (ORNL/TM-9408), September 1985.*
8. T.J. Burns etal., Martin Marietta Energy Systems, Inc., Oak Ridge National Laboratory, "Preliminary Development of an Integrated Approach to the Evaluation of Pressurized Thermal Shock as Applied to the Oconee 1 Nuclear Power Plant," USNRC Report NUREG/CR-3770 (ORNL/TM-9176), May 1986.*
9. T. L. Dickson et al., Martin Marietta Energy Systems, Inc., Oak Ridge National Laboratory, "Pressurized Thermal Shock Probabilistic Fracture Mechanics Sensitivity Analysis for Yankee Rowe Reactor Pressure Vessel," USNRC Report NUREG/CR-5782 (ORNL/TM-11945), August 1993.*
10. D. S. Moelling et al., "Probabilistic Fracture Mechanics Application of Dynamic Crack Arrest by Static Analogy," Proceedings of ASME Pressure Vessel and Piping Conference, San Diego, California, June 1991, PVP Vol. 213/MPC Vol. 32, Pressure Vessel Integrity, ASME, 19911
Available for purchase from the National Technical Information Service, Springfield, VA 22161.
'Available in public technical libraries.
49 NUREG/CR-4219, Vol. 10, No. 2


6 Cleavage Crack Initiation
T.J.
This task emphasizes cleavage initiation toughness and the specimens that are used to evaluate cleavage fracture toughness. The task began in FY 1990 and is currently divided into four subtasks: (6.1) Shallow-Crack Fracture-Toughness Testing; (6.2) Gradient Effects on Fracture Toughness; (6.3) Thickness Effects on Fracture; and (6.4) Clad Cylinder Thermal-Shock Testing.
6.1 Shallow-Crack Fracture-Toughness Testing
Currently, the Shallow-Crack Fracture-Toughness Program is divided into two areas: (1) the Heavy-Section Steel Technology (HSST) Shallow-Crack Fracture-Toughness Testing Program and (2) the Full-Thickness Shallow-Crack Clad Beam Tests. The HSST Shallow-Crack Fracture-Toughness Testing Program has been ongoing since FY 1990 and has produced data by testing 100-mm-deep (4-in.) single-edge notch bend (SENB) specimens. The Shallow-Crack Full-Thickness Clad Beam Tests were initiated during FY 1992 and will test 230-mm-thick (9-in.) clad beams taken from a cancelled nuclear plant.
6.1.1 HSST Shallow-Crack Fracture-Toughness Testing Program (T. J. Theiss and S. T. Rolfe*)
During the current reporting period, additional results of the shallow-crack program were included in a Nuclear Regulatory Commission report in conjunction with Task 2. The focus of the report was the application of stress-based constraint methodologies (specifically, the J-Q methodology and the fracture-toughness scaling model) to data from the shallow-crack and biaxial beam programs. Details of the constraint analysis and interpretation of these results have been included in Chap. 2.
6.1.2 Shallow-Crack Full-Thickness Clad Beam Tests (T. J. Theiss, J. A. Keeney, W. J. McAfee)
A series of tests will be conducted using actual reactor pressure vessel (RPV) material to determine the fracture toughness of prototypic, clad, full-thickness RPV weld and
University of Kansas, Lawrence, Kansas.
plate material with shallow flaws. These tests will investigate the influence of metallurgical gradients and the cladding process on the fracture toughness of material with flaws prototypic of those found in an RPV. Three-point bend specimens with a 225- by 225-mm cross section will be tested to simulate RPV loading conditions. The beams are being tested at the National Institute of Standards and Technology during this fiscal year. Initial tests will be on axial weld material; subsequent tests will sample plate material. The test matrix will include shallow flaws that have the same normalized and absolute crack depths as the HSST shallow crack beams (a/W = 0.1, and a = 10 mm) in beams with a 225-mm beam depth. This will provide additional experimental evidence on the influence of constraint loss associated with a shallow flaw in an RPV. Details of the experimental work for the current reporting period are included in Chap. 10.
6.2 Thickness Effects on Fracture
To fully utilize the data generated in the shallow-crack program,1 a study has been conducted on the deep-crack data within the program as a part of this subtask. The primary goal of the investigation has been to examine the influence of different thicknesses on transition range fracture toughness. This investigation has taken place during the current reporting period and is being drafted into a report at this time.2 A summary of the interim results are presented here.
The deep-crack, fracture-toughness data generated in conjunction with the shallow-crack program were examined using different constraint techniques and a Weibell statistical method. The data are unique because they were produced from two specimen types (SENB and 1TCT), four thicknesses (25, 50,100,150 mm), with a relatively large specimen depth for the SENB specimens (100 mm). The data were all predominately cleavage initiation events primarily in the transition region. This investigation includes a comparison of the different criteria used or proposed to determine the conditions necessary for "size-independent," lower-bound, transition fracture-toughness data. In addition, the data were manipulated using the different constraint adjustments and a weakest link statistical technique3
to determine the applicability and utility of the methods to the SENB and 1TCT transition data. The four constraint theories considered are the Irwin pi c correction,4 the
NUREG/CR-4219, Vol. 10, No. 2

Cleavage
so-called modified Irwin (3tc correction,* the Hagiwara correction,'*' and the Dodds-Anderson (D-A)5 correction. The weakest link statistical model is based on the experimental observation that large specimens tend to have a lower fracture toughness than small specimens and is used to estimate data scatter from a limited number of tests. The larger length of crack front in larger specimens provides a higher probability that the "weakest" material will be tested. A three-parameter Weibull model is used to fit the limited data set to determine parameters (3) that are in turn used in the weakest link model to adjust toughness values for specimen size effects. This procedure is simplified by the observation that two of the three Weibull parameters are universal constants for a particular material grade.*
The deep-crack toughness results are presented in Fig. 6.1 as a function of normalized temperature. Most of the data were from tests conducted in the transition temperature region of the fracture-toughness curve for A 533 B. The data are shown with the characterization curve developed for HSST Plate 13B in the L-S orientation. To provide a subset of data at one temperature with multiple-beam thicknesses, the data in the low transition region (within the boxed region in Fig. 6.1) were adjusted to a single temperature. The low transition data were all adjusted to TNDT = -10°C using the values of the characterization
f 500
400
OHNL-DWG 941*2474 ETD
O 300
CO
ffi 200 <3 3 100 P
' ' ' 1 • • • i . • • i • i i , , , .,_.„,..,-..., 1 i • ' •
o _ _ - L-S 1T CHARACTERIZATION •
0 1TC(T) a SENB B = 50 8 / ' A SENB B = 100 o / • * SENB B = 150
_ 8 / y k \
: • & / o o
:
-a " '
" . . . . . . i . . . i . . . i . . . i 1 1 1 I 1 '
-100 -80 -60 -40 -20 0 T-NDT (°C)
20
Figure 6.1 Deep-crack toughness data as function of normalized temperature (T - NDT)
D. E. McCabe, J. G. Merkle, and R. K. Nanstad, "A Perspective on Transition Temperature and K j c Data Characterization," 24th National Symposium on Fracture ASTM STP 1207, J. E. Landes and D. E. McCabe, Eds., American Society for Testing and Materials.
t G . Hagiwara, "Evaluation of Thickness Effect on Fracture Toughness in Heavy Section Steels," Second Japanese-German Joint Seminar on Nondestructive Evaluation and Structural Strength on Nuclear Power Plants, Tokyo, Japan, February 19S3.
curve at the different temperatures to adjust the data. In other words, the data at TNE>T = -25°C were increased by • about 20%, and the data at T - DWNDT = +5°C were decreased by about 20% to the toughness values at TNDT = -10°C. The data adjusted to T - D W N D T = -10°C are plotted as a function of specimen thickness in Fig. 6.2. The SENB data in Fig. 6.2 appear to be "size-independent" for the specimen thickness ranging from 50 to 150 mm, but the 25-mm 1TCT data appear to be slightly elevated compared with the remainder of the data.
6.2.1 Constraint Evaluations of Data
This section describes the evaluation of the deep-crack data using different constraint theories. The constraint evaluations basically consist of two different approaches. First, various constraint-based criteria have been developed to determine the conditions under which size-independent, lower-bound, fracture-toughness results are achieved. The four criteria considered here are (1) the standard criteria for "plane-strain" results found in ASTM E399, Standard Test Method for Plane-Strain Fracture Toughness of Metallic Materials, (2) a modified, less-stringent criterion6,7 similar to the one found in ASTM E399, (3) a criterion proposed by Dodds and Anderson based on two-dimensional (2-D) finite-element analysis,5 and (4) a subsequent less-stringent criterion by Dodds and Anderson based on three-dimensional (3-D) analysis. The second constraint evaluation of the data, also presented in this section, is the use of constraint-based corrections to the data. The corrections are all designed to reduce size-dependent, fracture-toughness results to a lower-bound level independent of size. Four adjustments were made to the data using different constraint criteria. The adjustments were (1) the
250
200
40 — a. g o 150 —> X.
uS CO UJ 100 z I CD O 50
ORNL-DWG 94M-2475 ETD " J 1 ' I I 1" ' ] " " | - I 1 — | — I 1 1 — J — I — I 1 — | I I I | - I I I | 1 f™
y = 134.3 + -0.13277 x R = 0.25959
i ! > I . « t I i < . I t i i I • i t I i « . I t i t I t i
0 20 40 60 80 100 120 140 160 BEAM THICKNESS (mm)
Figure 6.2 Low transition toughness data at T - NDT = -10°C as function of specimen thickness
NUREG/CR-4219, Vol. 10, No. 2 52

Cleavage
200
a. 150
2
ORNL-DWG 94M-2478A ETD ' \ ' i ' I i > > I i i '
Irwin Pic empirical adjustment,4'8 which is based on the plane-strain criteria found in ASTM E399; (2) the modified Irwin (3ic empirical adjustment,5 which corresponds to the relaxed E399 criteria; (3) a constraint adjustment based on the 2-D finite-element analysis of Dodds and Anderson;5
and (4) an empirical adjustment proposed by Hagiwara.
The Irwin and the more relaxed modified Irwin constraint criteria both appear to be restrictive when applied to these data. Only a very limited number of data were considered plane-strain according to either of these criteria. The 2-and 3-D size-independent criteria of Dodds and Anderson [referred to as "small-scale yielding" (SSY) by the authors], however, indicate that much more of the data are SSY or size-independent than the first two criteria. Initial 2-D analysis indicates that size-independence (referred to as SSY by the authors) is achieved when
a,b,andB>200J c/af, (6.1)
where J c is the J-integral at cleavage failure before significant stable tearing, and 07 is the flow stress of the material. All the data used in this study are derivied from cleavage fractures. The conditions required for SSY using 3-D analysis are 100 Jc/Of rather than 200 )JOf.
The data that satisfy the 2- and 3-D SSY criteria of Dodds and Anderson at TNDT = -10°C are shown in Fig. 6.3 as a function of specimen thickness. As shown in Fig. 6.3, all of the data at TNDT = -10°C satisfy the more relaxed 3-D criteria, while most of these data satisfy the 2-D criteria. The 2-D SSY criteria excludes most of the 25-mm data and the highest 50-mm test result. The 25-mm data point considered SSY is consistent with the 50-, 100-, and 150-mm data. All of the data at TNDT = -10°C, including those from 25-mm-thick specimens, are labeled as SSY according to the 3-D criteria.
In addition to using constraint theories to determine the conditions required for size-independence in toughness data, several data corrections have been proposed to reduce size-dependent toughness results to a lower-bound level independent of size. The criteria considered here were considered in a similar evaluation by McCabe with similar results.
tc . Hagiwara, "Evaluation of Thickness Effect on Fracture Toughness in Heavy Section Steels," Second Japanese-German Joint Seminar on Nondestructive Evaluation and Structural Strength on Nuclear Power Plants, Tokyo, Japan, February 19S3.
co 100 - * * • " CD • *
z I C5 3 50 -O • 2-D CRITERIA: B,b, a > 200 J c / c f •
3-D CRITERIA: B.b, a > 100 Jc/cr } \ n ' • ' • ' • • • ' • — . • t • •« i 1 • . • 1 i • • l • . . t . . .
0 20 40 60 80 100 120 140 160 BEAM THICKNESS, B (mm)
Figure 6.3 Data at T - NDT = -10°C, meeting D-A 2-and 3-D SSY criteria as function of thickness
Results of the Irwin pj c and the Hagiwara constraint corrections applied to the toughness data indicate that these corrections can be too severe. Several of the transition toughness data fall below the American Society of Mechanical Engineers (ASME) curve, which is an indication that too much correction of the data has taken place. These results, however, are not surprising. The Irwin Pi c
correction has always been deemed as a simple method of correcting non-plane-strain data to a conservative lower-bound level. The results of this examination indicate that for transition temperature toughness data the Irwin pj c correction may be overly conservative. The Hagiwara correction, also an empirical method, is more severe than the Irwin 3i c correction. The less severe modified Irwin j3]c
correction, however, is more appropriate for these data than the standard Pi c correction. None of the corrected toughness data fall below the ASME lower bound and the corrected data at TNDT = -10°C appear insensitive to thickness. The overcorrection associated with the Irwin pi c
correction is not present in the modified correction. The primary advantage of the modified pj c correction, as with the standard Irwin pi c correction, is its simplicity.
The constraint criteria based on 2-D finite-element analysis by Dodds and Anderson 5 have been used by Wallin9 to develop the following constraint correction with a steel with a Ramberg-Osgood work-hardening exponent, n, of 10:
J/JSSY =1 + 176 ( J / B S S Y ) L 3 7 • (6.2)
The work-hardening exponent of A 533 B is -10, so Eq. (6.2) is applicable to the present data. No comparable
53 NUREG/CR-4219, Vol. 10, No. 2

Cleavage constraint correction based on the more relaxed 3-D finite-element analysis is available. The 3-D-correction presumably would be less than the correction of Eq. (6.2).
The 2-D, D-A constraint correction was applied to the transition data using Eq. (6.2). No corrected toughness data fall below the ASME lower-bound curve. The corrected toughness results at TNDT = -W'C as a function of thickness (Fig. 6.4) appear constant. Only the 25-mm data are adjusted by any significant amount The linear regression analysis of the corrected data indicates little or no slope in the data of Fig. 6.4 with a low-fitting parameter, which means that the data are not a strong function of thickness. Statistical evaluations of the corrected and uncorrected data indicate that the D-A corrected data are statistically more size-independent than the original data set. This correction reduces toughness results to a reasonable lower-bound level independent of size without overcorrecting the data. The final results using the D-A correction were more consistent than the modified Irwin (3ic results.
6.2.2 Statistical Adjustment to Data
This section presents statistical interpretation of the deep-crack transition toughness data using a three-parameter Weibell expression. The statistical treatment of the data is based oh the American Society of Testing and Materials (ASTM) draft standard, Test Fracture (Method) for
Fracture Toughness Testing in the Transition Range* (hereafter referred to as the draft standard), and associated documentation. The draft standard uses a Weibell statistical method combined with a "master curve" to establish appropriate fracture-toughness curves in the transition range. The draft standard specifies at least six toughness values (specifically, Kj c from 1TCT specimens) at each temperature with the test temperature(s) required to be within the transition region. Using a three-parameter Weibell expression with a fixed slope of 4, which defines the scatter band of the data, and a K^n value of 20 MPaVnT, a statistically based median value of toughness [Kjc(mecj)] is determined.
The master curve, similar in shape to the ASME KIR or Kic curves, is defined as
Kjc(med) = 30 + 70 exp [0.019(T - T0)] , (6.3)
where T is the test temperature and T 0 is the normalizing parameter. T 0 is defined as the temperature at which the median Kj c from IT specimens is 100 MPa-Vm. The master curve concept is unique in that the median toughness values (Kjc) are used and different probability lower envelope curves can be explicitly established using median data because scatter is defined by using a Weibell slope of 4. Furthermore, T 0 is determined using fracture mechanics tests rather than Charpy or drop-weight tests. T 0 is determined once Kj c(m ed) is known using Eq. (6.3).
200
150
* 100 CO CO tu 2 X o o
50
ORNL-DWG 94M-2484 ETD I ' ' • I ' ' • I ' ' ' I
I I 9 9 9
• UNCORRECTED DATA v DODDS/ANDERSON CORRECTION
y = 120.78 + -0.032209 x R= 0.075812
i . . . i . . . i
0 20 40 60 80 100 120 140 160 BEAM THICKNESS, B (mm)
Figure 6.4 Uncorrected and corrected data at T -NDT = -10°C as function of specimen thickness using 2-D D-A constraint correction
The draft standard models size effects using weakest link theory to allow the use of specimens different from a lT-size to be used in establishing T 0. The principal assumption of the weakest link theory is that size effects are related to the ratio of crack front lengths. In other words, a 100-mm-tnick specimen will yield a lower toughness result than a 50-mm-thick specimen because more crack length exists in the thicker specimen, which increases the probability of sampling a cleavage trigger mechanism. A minimum toughness limit of 20 MPaVm is used to prevent specimens of infinite thickness resulting in zero toughness and should be considered a fitting parameter rather than a theoretical minimum toughness result.
The equation used to predict size effects is
K x = 20 + [Kjc - 20] (Bo/B0 1 / 4 , (6.4)
Test Practice (Method) for Fracture Toughness in the Transition Range, Draft 5, Feb. 3, 1993, American Society of Testing and Materials.
NUREG/CR-4219, Vol. 10, No. 2 54

Cleavage where
Kj c = Kj c of test data, K x = predicted Kj c for different thickness, Bo = thickness of test specimen, B x = predicted specimen thickness.
The master curve and the four Kj c(m e cj) values determined using the SENB and IT C(T) data are shown in Fig. 6.5. The average T 0 value of-40°C (which corresponds to TNDT b e 0 3 1 1 8 6 normalized temperatures were used) was used to position the master curve. The master curve agrees very well with each K m e ( j value. Also included in Fig. 6.5 are the upper- and lower-bound curves to a 95% confidence limit, the HSST 13A characterization curve, and the ASME lower-bound curve. The upper- and lower-bound curves are established statistically based on the Weibell slope of 4 and can be determined for any confidence level desired. The ASME lower-bound curve is significantly below the 95% lower limit curve for this data. The median Kj c curve with the 95% confidence limit curves and the individual lT-equivalent data are shown in Fig. 6.6, again with excellent agreement between the data and the master curve. The limit curves envelope all of the data except two data points; this is consistent for 95% confidence limits applied to 41 data points.
An additional advantage of the master curve approach is that various conditions influencing data can be assessed statistically through variations in T 0. Data from different heats of material or specimen types can be combined and analyzed for trends not immediately obvious from one or
two data sets. Trends in the data such as one specimen type producing lower-toughness values than another specimen type can be identified by variations in T 0. As an example, the deep- and shallow-crack data at a single temperature were examined using the techniques in the draft standard. The shallow-crack data had a T 0 that was 32°C lower than the deep-crack data. In other words, the shallow-crack data are statistically ~30°C tougher than the deep-crack data, which is consistent with previous observations.1
The data at TNDT = -10°C are adjusted to a IT equivalent size and are shown in Fig. 6.7 as a function of thickness.
500
£" 400 -
ORNL-DWG 94M-24B8 ETD
f as a. o
—> CO" CO U l 2 X u o
300
200
100 -
-100 -80 -60 -40 -20 0 T-NDT ("C)
20 40
Figure 6.6 Median and 95% confidence level curves with lT-equivalent toughness data and ASME lower-bound curve
ORNL-DWG 94M-2487 ETD
500 1 ' ' ' T ' • ' 1 i ' • 1 ' i ' 1 i i i | i i i | i i il . MEDIAN CURVE BASED ON (T-DW N D T ) Q = -40C/.
{E 400 " HSST13BL-S / / (9 CHARACTERIZATION CURVE - ~ ^ / / 2 /*** f S-
o 3 0 0 f /s "
95% CONFIDENCE LIMITS / J* 03 Vv yr / a 200 z X
'• MEDIAN K j c CURVE V ^ ^ * ^ ^ ^ ^ CD _^>^^ \ * ^ \ t r ^ ^ ^ ^ ^ i § 100 ~----~~^^~~'^zZ^^^^'^ ^s^ '• H '• • ~" ~-~~-ZZZ---^^^ A Q M p K
CURVE i u
-100 -80 -60 -40 -20 0 T-NDT (°C)
20 40
Figure 6.5 Median and 95% confidence level curves with Kj c(m e {j) values, ASME lower bound, and HSST 13A characterization curves
250
200 to o.
" 150 co" CO
\u 100 X
a P 50
ORNL-DWG 94M-2490 ETD I ' ' ' I ' • ' I ' '
y = 127.31 + 0.31205 x R= 0.45024 1
0 20 40 60 80 100 120 140 160 BEAM THICKNESS, B (mm)
Figure 6.7 Data at T - NDT = -10°C adjusted to a 1T-size equivalent as a function of specimen thickness
55 NUREG/CR-4219, Vol. 10, No. 2

Cleavage
The adjusted toughness data tend to increase with increasing specimen size rather than decrease. In fact, comparing the regression analysis of the unadjusted data and 1T-equivalent data (Fig. 6.7) reveals that the lT-equivalent is no less size-dependent. The only change is the direction of the trend in toughness data with increasing specimen size. Based on the results of this data, the weakest link size adjustment was satisfactory, although the adjustment tended to overcorrect the largest specimen data generated from oversquare specimens. The use of the weakest link model appears to work well for specimens with a square ligament. Square and oversquare specimens are currently prohibited from use in the draft standard.
6.2.3 Comparison of Constraint and Statistical Methods
A comparison of the D-A constraint technique with the Weibell statistical technique reveals that both methods are relatively powerful and seem to work well with the current data. The constraint theories considered generally attempted to establish conditions necessary to ensure size-independence and then subsequently to adjust or correct all other data to a lower-bound level independent of size. Once the lower-bound toughness has been established, appropriate fracture assessments can take place. As constraint investigations continue, the criteria needed to ensure size-independence grow more relaxed. The current constraint criteria proposed by Dodds and Anderson appear to be as lenient as practical for transition range A 533 B data.
The statistical technique in the draft standard approaches fracture assessments in a slightly different manner. Mean fracture toughness is established from which a statistically meaningful confidence limit and lower-bound curves can be readily determined. The mean fracture toughness is defined statistically from data of a specific size. The scatter in the data is established by assuming a specific Weibell slope (in this case, 4). The draft standard, therefore, combines a fairly specific constraint condition (IT data) with a set Weibell slope of 4. This relationship has been established by examining large populations of data and then-associated scatter and appears to be an appropriate relationship. Empirical constraint criteria exist within the standard to prevent inappropriate data from being used to determine the mean fracture toughness.
In the future, as both the constraint and statistical techniques mature, it is anticipated that the two approaches will be used more widely in conjunction with each other. One possible approach would be to replace the current empirical constraint criteria in the draft standard with more rigorous constraint criteria such as the D-A criteria. Addition
ally, data that satisfied the constraint criteria or had been adjusted to a lower-bound level could be used in the standard with a greater Weibell slope to reflect the decrease in scatter associated with the lower-bound data.
Further, improved understanding of constraint would permit the use of specimens not currently allowed in conventional fracture-toughness testing. For example, lower-bound results could be generated from shallow-crack specimens necessary to sample specific material conditions or small surveillance specimens. If these lower-bound results were used in conjunction with statistical techniques, probabilistic fracture assessments could be generated with relatively few specimens. Transferability of the results for application to the reactor vessel would be improved because the test results would reflect appropriate material condition rather than a set constraint condition necessary for testing.
6.3 Clad Cylinder Thermal-Shock Testing
Current RPV operating lives are often limited by postulated pressurized-thermal-shock (PTS) accident conditions. The calculated fracture resistance for an RPV is based on the ASME Ki c fracture-toughness curve that was developed using specimens with zero out-of-plane strain (i.e., plane-strain conditions). However, PTS loads produce both a significant positive stress perpendicular to the crack and a significant positive out-of-plane stress parallel to the crack front for both circumferential and axial flaws. Experimental evidence recently generated at Oak Ridge National Laboratory (ORNL) indicates a decrease in the shallow-crack fracture toughness due to biaxial loading compared with uniaxial loading.10 These biaxial results were generated with a cruciform specimen loaded with a biaxial bending ratio of 0.6:1 (i.e., 6 units of load parallel to the crack for every 10 units of crack-opening load) and a straight-through flaw 10 mm deep.
Regulatory Guide 1.154, specifies that in a probabilistic fracture mechanics assessment of an RPV, all flaws assumed to exist will be assumed to be infinitely long, surface flaws.11 The previous biaxial bending specimens were tested with a 2-D, straight-through, shallow flaw to simulate these conditions. In reality, however, flaws that might exist in an RPV would more likely be finite-length flaws with a shallow-crack depth. Recent analytical studies show that RPV conditions can exist under which a semicircular finite-length flaw is less likely to initiate than an infinitely long flaw of the same depth.12 In other words, not all finite-length flaws would immediately grow in length under PTS loading to the point of being
NUREG/CR-4219, Vol. 10, No. 2

Cleavage infinitely long. The ability to account for flaws of finite length rather than assuming all flaws to be of infinite length could substantially reduce the conditional probability of vessel failure.
In addition to assuming that all flaws are infinitely long, current fracture mechanics assessments of RPVs do not take into account the fracture behavior of the cladding. The thermal and mechanical properties of cladding are taken into account, but the fracture resistance of the cladding is assumed to be identical to that of the base material. The exact impact of this assumption has not been quantified, but analytical studies12 indicate that taking account of the fracture behavior of the cladding also may reduce the potential for flaw initiation.
Because of these differences between the assumed and actual conditions of an RPV under PTS loading, the HSST Program is planning to conduct a series of validation tests to investigate the influence of out-of-plane loading on the fracture toughness of finite-length flaws in the presence of cladding using clad cylinders under thermal-shock conditions. To optimize the effectiveness of these clad cylinder tests, the influence of the various variables being considered is being investigated in smaller, less expensive cruciform specimens. During the current performance period, the initial test series was specified for the finite-length flaw, clad cruciform specimens. These initial tests described here will be conducted on base material only using finite-length flaws under uniaxial and biaxial loading. Subsequent tests covered by a separate specification will include the influence of cladding. A summary of the test series is provided here. Details of the testing of these specimens are included in Task 10.
The objective of these initial tests is to develop a specimen suitable for determining the influence of (1) out-of-plane loading and (2) finite-length flaw profile on the effective fracture toughness of RPV plate material. The out-of-plane loading will be parallel to the crack plane but transverse to the opening-mode loading. The finite flaw length studies will be compared with 2-D surface, shallow-crack test results to study the effect of flaw length on fracture toughness. Cruciform specimens with an -100- by 100-mm cross section loaded in bending about two orthogonal axes for biaxial loading with a finite-length, 3-D flaw will be used for these tests as shown in Fig. 6.8. The purpose of these initial tests is primarily to develop a suitable test specimen and procedure and generate a limited set of data to examine the influence of biaxial loading and flaw length on toughness. Additional tests similar to those described here are planned with clad specimens to examine the influence of cladding on fracture toughness. These subsequent tests will be outlined in a separate specification.
Identical specimens will be used for both the biaxial- and uniaxial-loading configurations. Two different material conditions of ASTM A 533, grade B steel will be used. Some of the specimens will be taken from material in the "as-received" condition, and some material will be heat-treated to simulate irradiation-damaged material. The overall dimensions and flaw dimensions will be identical in the two configurations. The material will be heat-treated before being fabricated into specimens. The specimens will be similar to previous HSST cruciform specimens using a composite design with a test section area and four arms welded to the section for load application. Approximate dimensions of the cross-section are 100 by 100 mm with 610-mm longitudinal and transverse spans. Load diffusion control slots will be used to ensure that the stresses in the test section are as constant as possible. The length of the flaw will be such that the interaction between the flaw and the slots is minimized. Figure 6.8 illustrates the relationship between the test section, the arms, the load control diffusion slots, and the crack. Figure 6.8 also shows the profile of the crack and the interaction of the crack and the load control diffusion slots. The specimens will be pre-cracked after the two longitudinal arms are welded to the test section. Following precracking, the transverse arms will be welded to the specimen using electron beam (EB) welding. EB welding is required to ensure minimal distortion in the specimen with a relatively small heat-affected zone.
ORNL plans to test 12 specimens in this developmental biaxial, finite-length flaw test series. Two different material conditions (as-received and heat-treated to simulate irradiation damage) will be used. The overall specimen dimensions and the crack dimensions will be kept the same for all tests in this series. The crack depth, a, will be -15 mm after fatiguing for each test. A semielliptical flaw will be tested with a crack length, 2c, ~41 mm after fatigue precracking. The normalized test temperature (TNDT) f o r
both material conditions within this series will be -18°F (-10°C), which is in the lower transition region for A 533 B. This combination of crack depth and normalized temperature is comparable to that used for both shallow crack tests1 and for the initial biaxial bending tests.10 The final test temperatures will be determined once the pretest characterization is complete. The tests will be conducted in the following sequence.
Material Loading Number of condition configuration specimens
As-received Uniaxial 3 As-received Biaxial 3 Heat-treated Uniaxial 3 Heat-treated Biaxial 3
57 NUREG/CR-4219, Vol. 10, No. 2

Cleavage ORNL-DWG 92M-3935A4 ETD
DIMENSIONS IN mm
— » | 41 \+— 15
L
SECTION A-A
Figure 6.8 Schematic of finite-length flaw cruciform specimen
The biaxial load ratio will be equibiaxial (1:1) to match the load ratio of an RPV under the thermal component of PTS loading.
References
1. T. J. Theiss, D. K. M. Shum, and S. T. Rolfe, Martin Marietta Energy Systems, Inc., Oak Ridge National Laboratory, "Experimental and Analytical Investigation of the Shallow-Flaw Effect in Reactor Pressure Vessels," USNRC Report NUREG/CR-5886 (ORNL/ TM-12115), July 1992.*
2. B.R. Bass etal., Martin Marietta Energy Systems, Inc., Oak Ridge National Laboratory, "Biaxial Loading and Shallow-Flaw Effects on Crack-Tip Constraint and Fracture Toughness," USNRC Report NUREG/CR-6132 (ORNL/TM-12498), December 1993.*
3. J. D. Landes and D. H. Shaffer, "Statistical Characterization of Fracture in Transition Region," pp. 368-82 in Fracture Mechanics: Proceedings of the Twelfth National Symposium on Fracture Mechanics, ASTM STP 700, American Society for Testing and Materials, 1980.?
4. G. R. Irwin, "Fracture Mode Transition for a Crack Transversing a Plate," J. Basic Eng. 82(2), 417-25 (Junel960).t
5. T. L. Anderson and R. H. Dodds, Jr., "Specimen Size Requirements for Fracture Toughness Testing in the Ductile to Brittle Transition Region," J. Test. Eval 19, 123-34 (1991).t
S. T. Rolfe and S. R. Novak, Discussion on M. H. Jones and W. F. Brown, "The Influence of Crack
NUREG/CR-4219, Vol. 10, No. 2 58

Cleavage Length and Thickness in Plane Strain Fracture Toughness Tests," pp. 63-101 in Review of Developments in Plane-Strain Fracture Toughness Testing, ASTM STP 463 American Society for Testing and Materials, 1970.t
7. E. T. Wessel, "State of the Art of the WOL Specimen for Kic Fracture Toughness Testing," Eng. Frac. Mech., 1(1), (January 1968).t
8. J. G. Merkle, Martin Marietta Energy Systems, Inc., Oak Ridge National Laboratory, "An Examination of the Size Effects and Data Scatter Observed in Small-Specimen Cleavage Fracture Toughness Testing," USNRC Report NUREG/CR-3672 (ORNL/TM-9088), April 1984.*
9. K. Wallin, "Statistical Aspects of Constraint with Emphasis on Testing and Analysis of Laboratory Specimens in the Transition Region," pp. 264-88 in Constraint Effects in Fracture, ASTM STP 1171, E. M. Hackett, K.-H. Schwalbe, and R. H. Dodds, Eds., American Society for Testing and Materials, 1993. t
10. T. J. Theiss et al., Martin Marietta Energy Systems, Inc., Oak Ridge National Laboratory, "Initial Results of the Influence of Biaxial Loading on Fracture Toughness," USNRC Report NUREG/CR-6036 (ORNL/TM-12349), June 1993.*
11. U.S. Nuclear Regulatory Commission Regulatory Guide 1.154, "Format and Content of Plant-Specific Pressurized Thermal Shock Safety Analysis Reports for Pressurized Water Reactors."*
12. J. Keeney-Walker et. al., Martin Marietta Energy Systems, Inc., Oak Ridge National Laboratory, "Finite-Length Surface Crack Propagation in Clad Cylinders," USNRC Report NUREG/CR-5915 (ORNL/TM-12166), November 1992.*
Available for purchase from the National Technical Information Service, Springfield, VA 22161.
'Available in public technical libraries. "••Copies are available from U.S. Government Printing Office,
Washington, D.C. 20402. ATTN: Regulatory Guide Account.
NUREG/CR-4219, Vol. 10, No. 2 59


7 Cladding Evaluations
J. A. Keeney
No activity in the current reporting period.
61 NUREG/CR-4219, Vol. 10, No. 2


8 Pressurized-Thermal-Shock Technology
T. L. Dickson
8.1 Stress-Intensity-Factor Influence Coefficients (J. A. Keeney, T. L. Dickson)
During this report period, stress-intensity-factor influence coefficients (SIFICs) were generated for axially oriented finite-length semielliptical inner-surface flaws with aspect ratios [total crack length (2c) to crack depth (a)] of 2,6, and 10 for clad cylinders with an internal radius (Rj) to wall thickness ratio (t) of 10. SIFICs were computed at various angular positions around the crack front for flaw depths in the range of 0.012 a/t < 0.5, with particular emphasis on shallow flaws. SIFICs were also calculated for two cladding thicknesses [t = 3.96 mm (0.156 in.) and t = 6.35 mm (0.25 in.)]. This is the first step of an ongoing task that has the objective of developing a data base of accurate validated SIFICs for a range of axially and cir-cumferentiaUy oriented finite-length semielliptical inner-surface flaw geometries for a range of clad vessel geometries that will envelope all of the commercial pressurized-water reactor (PWR) and boiling-water reactor (B WR) vessel geometries in the United States. The incorporation of this SIFIC data base into fracture mechanics codes such as FAVOR,1 will facilitate the generation of accurate fracture mechanics solutions for a range of flaw geometries as may be required in structural integrity assessments of any U.S. PWR or BWR vessel geometry.
8.2 Introduction
A problem of particular interest in pressure vessel technology is the calculation of accurate SIFs for semielliptical surface cracks in cylinders. Solution techniques that have been applied to this problem include direct three-dimensional (3-D) calculations using a finite-element method.2'3 However, computing costs for this direct approach can be prohibitive when applied to 3-D geometries with time-varying boundary conditions such as those associated with pressurized thermal shock (PTS). Several investigators4-6 have focused on an alternative superposition technique that requires calculation of a set of influence coefficients for a given 3-D crack model. In this technique, the crack surface of a specified geometry is subjected to four stress distributions: uniform, linear, quadratic, and cubic. Influence coefficients obtained from these solutions are then superposed to obtain mode-I SIFs for other stress distributions, such as those due to internal pressure or thermal shock. Considerable economy can be achieved using this approach because the only direct 3-D
solutions required are those used to calculate the influence coefficients.
In this section, the technique for computing influence coefficients associated with an axial semielliptical surface crack in a clad cylinder is briefly outlined. Next, results from the application of the superposition technique are compared with direct 3-D finite-element solutions. Finally, the calculated influence coefficients are compared with results obtained by other investigators for the same geometry.
8.3 Superposition Technique
The SIF Kj is calculated by a superposition technique proposed by Bueckner.7 Instead of calculating stresses for the cracked structure using the actual loads, the calculation is performed with a distributed pressure applied to the crack surfaces only. This pressure is opposite in sign, but equal in magnitude and distribution, to the stresses along the crack line that are calculated for the uncracked structure with the actual loads applied. For an arbitrary stress distribution, and for the case of a 3-D semielliptical flaw, the truncated stress distribution is approximated with the following polynomial:
o(a') = Co + Ci(a7a) + C2(a7a)2 + C3(a7a)3 , (8.1)
where o(a') is the stress normal to the crack plane at radial position a', where a' and a are defined in Fig. 8.1. The Kj. values are calculated for each of the individual terms (stress distributions) in Eq. (8.1) and are then added to obtain the total Ki value as indicated by the following equation:
Kj.(a)= S KTj(a)= £ C:V^K*(a) , (8.2) j=0 j=o
where
K*(a) = Kij(a)/(C<^) . (8.3)
Values of Kjj(a)/Cj are calculated for each of the normalized stress distributions corresponding to each term in Eq. (8.1), using the 3-D finite-element analysis and a value of unity for Cj. The quantity Kj (a) is referred to as the influence coefficient and, as indicated by Eq. (8.3), is dimensionless. Once the influence coefficients are
63 NUREG/CR-4219, Vol. 10, No. 2

Pressurized-Thermal-Shock
ORNL-DWG 94M-3633 ETD
8 - I
Figure 8.1 Axially oriented finite-length semielliptical flaw on inner surface of cylinder
obtained, they can be used with any values of Cj to obtain corresponding values of Kj(a).
nomial is used for the cladding coefficients. This technique is described in detail in Ref. 6.
For 3-D flaws, K; (a) values can be calculated for several points along the crack front, in which case Eq. (8.2) becomes
Ki(a,<}>)= I CjVroiK*(a,<|>) , (8.4) j=0
where <(> is the elliptical angle denoting the point on the crack front.
The presence of a thin layer of stainless steel cladding on the inner surface of reactor pressure vessels has a significant effect on the Kj values for inner-surface flaws because of high thermal stresses generated in the cladding during a thermal transient. To accommodate the stress discontinuity associated with the cladding, influence coefficients were calculated for the cladding stresses alone; the corresponding Kj value can men be superposed on the Ki value due to the stresses in the base material. This is accomplished by first calculating a Kj value for a continuous-function stress distribution obtained by a linear extrapolation of the stress distribution in the base material into the cladding. Then a Ki value is calculated for a stress distribution in the cladding, which is obtained by subtracting the extrapolated distribution from the actual distribution in the cladding, which is also assumed to be linear. The total Ki value is simply the sum of the two. Because the stress distribution in the cladding is essentially linear, only a first-order poly-
8.4 Calculation of SIFICs (K|)
For the present study, Kj was computed using the ABAQUS8 finite-element code. ABAQUS is a nuclear quality assurance certified (NQA-1) code that employs a domain integral method for the computation of the J-integral. A 3-D finite-element model was generated for each crack depth and aspect ratio. The analysis matrix included a crack depth range from 2.16 to 108.0 mm (0.085 to 4.25 in.) (crack depth/vessel thickness ratio of 0.01 to 0.5) and three different aspect ratios of crack length (2c) to crack depth (2:1, 6:1, and 10:1). A total of 39 finite-element models and more than 200 analyses were required to generate the Kj values.
The 3-D finite-element model of a vessel with an axial, inner-surface, semielliptical flaw was generated with the ORMGEN mesh generating program.9 A typical finite-element mesh from this study is shown in Fig. 8.2 (6:1 axial flaw with a/t of 0.2). This model has 10792 nodes and 2255 twenty-noded isoparametric elements. The mesh refinement was increased (more nodes and elements) near the crack tip for models with shallower flaws. From symmetry conditions, only one-fourth of the vessel is included in the finite-element model. The vessel in Fig. 8.2 has a thickness (t) of 216 mm (8.5 in.) (including the cladding), internal radius (Ri) of 2184 mm (86.0 in.), and length CO of 4699 mm (185.0 in.).
NUREG/CR-4219, Vol. 10, No. 2 64

Pressurized-Thermal-Shock
ORNL-DWG 94-3693 ETD
Figure 8.2 Finite-element model of clad cylinder
In the process of calculating the SIFICs, careful attention was paid to using adequately converged finite-element meshes (increased mesh refinement does not change die value of KT) and an appropriate cylinder length. The number of elements in the circumferential and axial direction, and around the crack front, was increased, one at a time, to the point where addition of one element changed the value of Kj. by <1%. The resultant converged meshes for a 180°, half-length segment of the cylinder had ~30,500 degrees of freedom. With regard to cylinder length, a minimum incremental length of cylinder that could be added to the length of the flaw to negate end effects was estimated from the following equation (Ref. 10):
£ = 2it/p ,
where
P 4 = 3(l-v 2)/(R?t 2) ,
(8.5)
(8.6)
and v is Poisson's ratio. For the cylinder radial dimensions given in Fig. 8.2, t = 3353 mm (132 in.). From previous studies,6 the appropriate length for a cylinder with a 6:1, inner-surface, semielliptical flaw (a/t = 0.2) was 1.4 times the estimated value, so a cylinder length of 4699 mm (185 in.) was used in these analyses. A second analysis was performed on a cylinder in which the length of the cylinder was doubled. The Kj values around the crack front changed
8.5 Verification of SIFICs (Kj) and Superposition Technique
The adequacy of using SIFICs was investigated by calculating Ki values by born the superposition and direct finite-element techniques. The direct finite-element solutions were generated with AB AQUS, but the FAVOR code was used to generate a solution utilizing the SIFICs and the superposition technique. The first comparison was for the 6:1 semielliptical flaw with a/t = 0.075 and a thermal load through the vessel wall. The results of this comparison analysis indicate a maximum difference of -2% along the crack front (Fig. 8.3). The second comparison was for a 10:1 semielliptical flaw with a/t = 0.5 and the same loading. The results, given in Fig. 8.3, show good agreement.
8.6 Comparison with Results Produced by Other Investigators
A comparison of some of the 3-D influence coefficients generated in this study witii similar coefficients obtained by omer investigators4'5 is shown in Figs. 8.4 and 8.5. To compare die coefficients with those obtained from Raju and Newman,4 the influence coefficients in Fig. 8.4 represent Kj values multiplied by ^ Q , where the shape factor (Q) is the square of die complete elliptic integral of me second kind. The shape factor for an elliptical crack is approximated by the following equation:
65 NUREG/CR-4219, Vol. 10, No. 2

Pressurized-Thermal-Shock ORNL-DWG 94M-3634 ETD
40 60 ELLIPTIC ANGLE (deg)
Figure 83 Comparison of Kj values calculated by FAVOR (SIFICs and superposition) and direct finite-element solutions for axially oriented 6:1 and 10:1 flaws (a/t = 0.075 and 0J>, respectively) in clad PWS vessel during severe thermal transient
2.6
2.2
1.8
ORNL-DWG 94M-363S ETD
0.2 ••
• RAJU-NEWMAN GO • RAJU-NEWMAN G1 • RAJU-NEWMAN G2 A RAJU-NEWMAN G3
O ABAQUSG0 D ABAQUSG1 O ABAQUSG2 A ABAQUSG3
fcSg^S WSP=»
2.2
1.8
• RAJU-NEWMAN GO • RAJU-NEWMAN G1 • RAJU-NEWMAN G2 A RAJU-NEWMAN G3
O ABAQUSG0 • ABAQUSG1 O ABAQUSG2 A ABAQUSG3
20 40 60 ELLIPTIC ANGLE (deg)
Figure 8.4 SIFICs for axially oriented semielliptical flaws (a/t = 0.2) on inner surface of cylinder: (a) 2:1 aspect ratio; (b) 10:1 aspect ratio
NUREG/CR-4219, Vol. 10, No. 2 66

Pressurized-Thermal-Shock
1.6 ORNL-DWG 94M-3636 ETD
1.4
1.2 \—
1.0
k 0.8
• K0 - REF. 5 • K1 - REF. 5 • K2 - REF. 5 A K3 - REF. 5
O K0 - ABAQUS • K1 - ABAQUS 0 K2 - ABAQUS A K3-ABAQUS
T 0.6 —
.•-•-cr*~ *cr*
0.4
0.2
- a *
20 40 60 ELLIPTIC ANGLE (deg)
80
Figure 8.5 SIFICs for an axially oriented semielliptical flaw with a/t = 0.5 and 6:1 aspect ratio
Q= 1 +1.464 (a/c) 1- 6 5 (8.7)
As indicated in Fig. 8.4, the coefficients being compared pertain to axially oriented, inner-surface flaws in a long cylinder with a/t = 0.2 and aspect ratios of 2:1 and 10:1. The coefficients in Fig. 8.5 (Ref. 5) are for an aspect ratio of 6:1 and a/t = 0.5. The results of the comparison indicate good agreement
The other investigators did not publish SIFICs for the shallower flaw depths, so a comparison could not be made for a/t ratios less than 0.2.
8.7 Tabulation of SIFICs
The SIFICs generated in this study are presented in Tables 8.1-8.8. Each set of angular values represents a
separate finite-element analysis where the plane strain relation
K: JE, /H) was used to calculate K from J. The K value was then normalized by dividing the value by -v/jca and using a stress load of unity. While English units were utilized to compute the K; values, the nondimensionalized K; values are appropriate for any consistent set of units (English, SI, etc.).
Further details regarding the generation of these SIFICs can be found in Ref. 11.
67 NUREG/CR-4219, Vol. 10, No. 2

Pressunzed-Thermal-Shock Table 8.1 SIFICs for axially oriented finite-length semielliptical flaws on inner surface of cylinder
R/t=10anda/t = 0.01
Aspect Elliptic K0 Kl K2 K3 K0 Kl K0 Kl Ratio Angle Uniform Linear Quadratic Cubic t c l =6.35 tcl=6.35 td=3.96 tcl=3.96
2:1 0.00 0.764 0.153 0.061 0.034 0.764 0.153 0.764 0.153 2.37 0.754 0.165 0.062 0.032 0.754 0.165 0.754 0.165 16.6 0.690 0.192 0.079 0.040 0.690 0.192 0.690 0.192 30.8 0.669 0.264 0.127 0.069 0.669 0.264 0.669 0.264 45.0 0.660 0.335 0.196 0.124 0.660 0.335 0.660 0.335 59.2 0.653 0.393 0.269 0.198 0.653 0.393 0.653 0.393 73.4 0.651 0.434 0.329 0.268 0.651 0.434 0.651 0.434 87.6 0.649 0.463 0.366 0.310 0.649 0.463 0.649 0.463 90.0 0.649 0.468 0.372 0.317 0.649 0.468 0.649 0.468
6:1 0.00 0.670 0.134 0.048 0.024 0.670 0.134 0.670 0.134 2.37 0.667 0.134 0.043 0.019 0.667 0.134 0.667 0.134 16.6 0.654 0.170 0.055 0.009 0.654 0.170 0.654 0.170 30.8 0.741 0.269 0.109 0.029 0.741 0.269 0.741 0.269 45.0 0.827 0.381 0.199 0.100 0.827 0.381 0.827 0.381 59.2 0.893 0.481 0.302 0.197 0.893 0.481 0.893 0.481 73.4 0.938 0.559 0.389 0.290 0.938 0.559 0.938 0.559 87.6 0.970 0.594 0.435 0.341 0.970 0.594 0.970 0.594 90.0 0.975 0.601 0.443 0.350 0.975 0.601 0.975 0.601
10:1 0.00 0.515 0.090 0.020 0.006 0.515 0.090 0.515 0.090 2.37 0.529 0.094 0.010 0.005 0.529 0.094 0.529 0.094 16.6 0.610 0.146 0.033 0.005 0.610 0.146 0.610 0.146 30.8 0.762 0.258 0.060 0.019 0.762 0.258 0.762 0.258 45.0 0.889 0.389 0.171 0.066 0.889 0.389 0.889 0.389 59.2 0.979 0.507 0.290 0.136 0.979 0.507 0.979 0.507 73.4 1.033 0.593 0.389 0.249 1.033 0.593 1.033 0.593 87.6 1.064 0.635 0.439 0.307 1.064 0.635 1.064 0.635 90.0 1.069 0.642 0.447 0.316 1.069 0.642 1.069 0.642
NUREG/CR-4219, Vol. 10, No. 2 68

Pressurized-Thermal-Shock Table 8.2 SIFICs for axially oriented finite-length semielliptical flaws on inner surface of cylinder:
Rj/t = 10 and a/t = 0.0184
Aspect Elliptic K0 Kl K2 K3 K0 Kl K0 Kl Ratio Angle Uniform Linear Quadratic Cubic tci=6.35 td=6.35 tci=3.96 t c i=3.96 2:1 0.00 0.777 0.155 0.061 0.034 0.777 0.155 0.777 0.155
2.37 0.767 0.167 0.062 0.032 0.767 0.167 0.767 0.167 16.6 0.700 0.194 0.079 0.040 0.700 0.194 0.700 0.194 30.8 0.677 0.266 0.127 0.069 0.677 0.266 0.677 0.266 45.0 0.667 0.338 0.196 0.125 0.667 0.338 0.667 0.338 59.2 0.660 0.397 0.270 0.198 0.660 0.397 0.660 0.397 73.4 0.657 0.438 0.330 0.267 0.657 0.438 0.657 0.438 87.6 0.654 0.467 0.366 0.310 0.654 0.467 0.654 0.467 90.0 0.653 0.472 0.373 0.317 0.653 0.472 0.653 0.472
6:1 0.00 0.653 0.128 0.043 0.021 0.653 0.128 0.653 0.128 2.37 0.654 0.128 0.038 0.016 0.654 0.128 0.654 0.128 16.6 0.654 0.168 0.045 0.021 0.654 0.168 0.654 0.168 30.8 0.758 0.271 0.099 0.026 0.758 0.271 0.758 0.271 45.0 0.852 0.387 0.192 0.085 0.852 0.387 0.852 0.387 59.2 0.920 0.492 0.298 0.187 0.920 0.492 0.920 0.492 73.4 0.963 0.569 0.387 0.283 0.963 0.569 0.963 0.569 87.6 0.994 0.609 0.434 0.335 0.994 0.609 0.994 0.609 90.0 0.999 0.616 0.442 0.344 0.999 0.616 0.999 0.616
10:1 0.00 0.525 0.092 0.019 0.007 0.525 0.092 0.525 0.092 2.37 0.538 0.096 0.009 0.005 0.538 0.096 0.538 0.096 16.6 0.621 0.149 0.039 0.005 0.621 0.149 0.621 0.149 30.8 0.777 0.262 0.050 0.022 0.777 0.262 0.777 0.262 45.0 0.899 0.392 0.164 0.075 0.899 0.392 0.899 0.392 59.2 0.982 0.509 0.283 0.127 0.982 0.509 0.982 0.509 73.4 1.033 0.595 0.383 0.242 1.033 0.595 1.033 0.595 87.6 1.063 0.637 0.433 0.300 1.063 0.637 1.063 0.637 90.0 1.068 0.644 0.441 0.310 1.068 0.644 1.068 0.644
69 NUREG/CR-4219, Vol. 10, No. 2

Pressurized-Thermal-Shock
Table S3 SIFICs for axially oriented finite-length semielliptical flaws on inner surface of cylinder: R|/t = 10 and a/t = 0.05
Aspect Elliptic K0 Kl K2 K3 K0 Kl K0 Kl Ratio Angle Uniform Linear Quadratic Cubic tcl=6.35 td=6.35 tcl=3.96 tC!=3.96 2:1 0.00 0.701 0.133 0.045 0.022 0.596 0.171 0.598 0.212
31.0 0.681 0.276 0.131 0.070 0.615 0.278 0.238 0.119 40.5 0.670 0.323 0.178 0.108 0.386 0.208 0.175 0.090 50.0 0.663 0.367 0.231 0.158 0.268 0.147 0.146 0.075 59.4 0.659 0.404 0.282 0.212 0.226 0.124 0.129 0.067 68.9 0.654 0.432 0.325 0.263 0.206 0.112 0.119 0.062 78.4 0.653 0.451 0.355 0.301 0.194 0.105 0.114 0.059 87.9 0.651 0.472 0.379 0.327 0.186 0.101 0.108 0.056 90.0 0.651 0.476 0.384 0.333 0.184 0.100 0.107 0.056
6:1 0.00 0.513 0.100 0.027 0.010 0.479 0.186 0.444 0.177 31.0 0.764 0.275 0.100 0.022 0.700 0.346 0.336 0.166 40.5 0.823 0.352 0.162 0.072 0.528 0.270 0.292 0.147 50.0 0.875 0.429 0.235 0.137 0.445 0.232 0.271 0.137 59.4 0.915 0.497 0.310 0.210 0.417 0.215 0.259 0.130 68.9 0.944 0.551 0.375 0.279 0.400 0.205 0.251 0.126 78.4 0.964 0.589 0.423 0.334 0.391 0.199 0.247 0.124 87.9 0.984 0.611 0.449 0.363 0.384 0.195 0.243 0.122 90.0 0.989 0.616 0.454 0.369 0.382 0.194 0.242 0.122
10:1 0.00 0.424 0.075 0.012 0.008 0.373 0.163 0.323 0.147 31.0 0.781 0.261 0.044 0.016 0.713 0.345 0.372 0.182 40.5 0.868 0.350 0.126 0.056 0.578 0.300 0.333 0.167 50.0 0.932 0.437 0.211 0.082 0.501 0.258 0.309 0.155 59.4 0.981 0.514 0.294 0.172 0.471 0.240 0.293 0.147 68.9 1.017 0.575 0.367 0.251 0.450 0.229 0.283 0.142 78.4 1.040 0.617 0.419 0.311 0.440 0.222 0.278 0.139 87.9 1.057 0.639 0.446 0.341 0.431 0.217 0.272 0.136 90.0 1.061 0.644 0.452 0.347 0.430 0.216 0.271 0.136
NUREG/CR-4219, Vol. 10, No. 2 70

Pressurized-Thermal-Shock Table 8.4 SIFICs for axially oriented finite-length semielliptical flaws on inner surface of cylinder:
Rj/t = 10 and a/t = 0.075
Aspect Elliptic K0 Kl K2 K3 K0 Kl K0 Kl Ratio Angle Uniform Linear Quadratic Cubic td=6.35 td=6.35 tcl=3.96 tci=3.96 2:1 0.00 0.697 0.134 0.045 0.022 0.604 0.210 0.511 0.204
32.3 0.683 0.284 0.137 0.075 0.250 0.127 0.138 0.063 41.6 0.673 0.331 0.185 0.114 0.187 0.096 0.108 0.054 50.9 0.666 0.373 0.236 0.163 0.157 0.081 0.092 0.047 60.1 0.662 0.409 0.286 0.217 0.139 0.073 0.083 0.042 69.4 0.657 0.436 0.327 0.266 0.129 0.067 0.076 0.039 78.6 0.656 0.454 0.356 0.303 0.123 0.064 0.073 0.037 87.9 0.654 0.474 0.379 0.328 0.118 0.061 0.070 0.036 90.0 0.654 0.478 0.384 0.334 0.116 0.060 0.069 0.035
6:1 0.00 0.499 0.099 0.026 0.009 0.436 0.171 0.357 0.162 32.3 0.772 0.285 0.102 0.018 0.356 0.177 0.208 0.099 41.6 0.829 0.360 0.164 0.073 0.311 0.157 0.188 0.093 50.9 0.878 0.434 0.237 0.138 0.289 0.146 0.177 0.089 60.1 0.916 0.499 0.309 0.210 0.276 0.139 0.170 0.085 69.4 0.943 0.551 0.372 0.278 0.268 0.135 v 0.166 0.083 78.6 0.963 0.587 0.418 0.330 0.264 0.133 0.163 0.082 87.9 0.982 0.609 0.443 0.358 0.266 0.134 0.165 0.082 90.0 0.986 0.614 0.448 0.365 0.267 0.134 0.165 0.082
10:1 0.00 0.368 0.077 0.011 0.010 0.312 0.141 0.231 0.127 32.3 0.796 0.276 0.049 0.025 0.394 0.195 0.234 0.112 41.6 0.878 0.363 0.131 0.053 0.353 0.178 0.216 0.107 50.9 0.939 0.447 0.215 0.089 0.328 0.165 0.203 0.101 60.1 0.985 0.520 0.296 0.176 0.312 0.157 0.194 0.097 69.4 1.018 0.578 0.365 0.252 0.302 0.152 0.188 0.094 78.6 1.039 0.618 0.415 0.310 0.296 0.149 0.184 0.092 87.9 1.056 0.639 0.441 0.339 0.291 0.146 0.181 0.090 90.0 1.060 0.644 0.447 0.345 0.289 0.145 0.180 0.090
71 NUREG/CR-4219, Vol. 10, No. 2

Pressurized-Thermal-Shock
Table 8.5 SIFICs for axially oriented finite-length semielliptical flaws on inner surface of cylinder: Rj/t = 10 and a/t = 0.1
Aspect Elliptic K0 Kl K2 K3 K0 Kl K0 Kl Ratio Angle Uniform Linear Quadratic Cubic tcl=6.35 tci=6.35 tc]=3.96 t d = 3 . 9 6 2:1 0.00 0.715 0.133 0.046 0.023 0.576 0.217 0.486 0.211
27.2 0.687 0.256 0.116 0.060 0.206 0.102 0.116 0.052 37.3 0.676 0.308 0.164 0.095 0.146 0.074 0.087 0.042 47.4 0.669 0.357 0.220 0.145 0.119 0.061 0.072 0.036 57.5 0.663 0.399 0.275 0.203 0.104 0.053 0.063 0.032 67.7 0.659 0.431 0.323 0.258 0.095 0.049 0.057 0.029 77.8 0.657 0.452 0.357 0.301 0.090 0.046 0.055 0.028 87.9 0.655 0.474 0.383 0.329 0.086 0.044 0.052 0.026 90.0 0.655 0.479 0.388 0.335 0.085 0.043 0.051 0.026
6:1 0.00 0.553 0.095 0.027 0.011 0.457 0.179 0.380 0.170 27.2 0.741 0.242 0.084 0.011 0.278 0.137 0.164 0.079 37.3 0.811 0.324 0.144 0.053 0.240 0.120 0.147 0.073 47.4 0.869 0.407 0.220 0.118 0.221 0.111 0.136 0.068 57.5 0.915 0.483 0.299 0.194 0.210 0.105 0.130 0.065 67.7 0.948 0.544 0.371 0.270 0.203 0.102 0.126 0.063 77.8 0.971 0.586 0.424 0.330 0.199 0.100 0.124 0.062 87.9 0.991 0.610 0.453 0.362 0.196 0.098 0.122 0.061 90.0 0.996 0.615 0.459 0.369 0.195 0.098 0.121 0.061
10:1 0.00 0.417 0.071 0.013 0.006 0.352 0.156 0.286 0.144 27.2 0.752 0.228 0.041 0.017 0.310 0.151 0.186 0.089 37.3 0.849 0.321 0.116 0.057 0.274 0.137 0.169 0.084 47.4 0.922 0.415 0.202 0.067 0.252 0.126 0.157 0.078 57.5 0.979 0.500 0.290 0.162 0.239 0.119 0.149 0.074 67.7 1.020 0.569 0.370 0.247 0.230 0.115 0.143 0.072 77.8 1.046 0.616 0.428 0.313 0.225 0.113 0.140 0.070 87.9 1.065 0.640 0.457 0.346 0.220 0.110 0.137 0.069 90.0 1.068 0.645 0.463 0.353 0.219 0.110 0.137 0.068
NUREG/CR-4219, Vol. 10, No. 2 72

Pressurized-Thermal-Shock Table 8.6 SIFICs for axially oriented finite-length semielliptical flaws on inner surface of cylinder:
Rj/t = 10anda/t = 0.2
Aspect Elliptic K0 Kl K2 K3 K0 Kl K0 Kl Ratio Angle Uniform Linear Quadratic Cubic tci=6.35 tcl=6.35 tcl=3.96 tcl=3.96 2:1 0.00 0.723 0.127 0.046 0.025 0.471 0.204 0.391 0.195
19.8 0.695 0.214 0.089 0.044 0.130 0.063 0.071 0.031 31.1 0.679 0.273 0.133 0.073 0.080 0.039 0.048 0.023 42.5 0.671 0.332 0.192 0.120 0.061 0.031 0.038 0.019 53.8 0.665 0.383 0.255 0.182 0.052 0.026 0.032 0.016 65.2 0.660 0.423 0.312 0.245 0.047 0.023 0.029 0.014 76.5 0.658 0.450 0.354 0.296 0.044 0.022 0.027 0.014 87.9 0.656 0.475 0.384 0.329 0.041 0.021 0.025 0.013 90.0 0.656 0.479 0.389 0.335 0.040 0.020 0.025 0.013
6:1 0.00 0.625 0.101 0.034 0.017 0.423 0.189 0.354 0.179 19.8 0.699 0.194 0.066 0.019 0.157 0.074 0.093 0.043 31.1 0.781 0.280 0.118 0.045 0.127 0.063 0.079 0.039 42.5 0.856 0.375 0.195 0.101 0.116 0.058 0.072 0.036 53.8 0.915 0.464 0.283 0.180 0.110 0.055 0.069 0.034 65.2 0.958 0.538 0.366 0.265 0.106 0.053 0.066 0.033 76.5 0.986 0.590 0.430 0.336 0.104 0.052 0.065 0.032 87.9 1.010 0.619 0.464 0.373 0.102 0.051 0.064 0.032 90.0 1.014 0.624 0.470 0.380 0.102 0.051 0.063 0.032
10:1 0.00 0.506 0.077 0.022 0.009 0.368 0.180 0.314 0.164 19.8 0.694 0.183 0.050 0.025 0.174 0.078 0.106 0.050 31.1 0.815 0.280 0.107 0.011 0.149 0.073 0.093 0.046 42.5 0.915 0.387 0.190 0.083 0.137 0.068 0.085 0.043 53.8 0.991 0.488 0.287 0.170 0.130 0.065 0.081 0.040 65.2 1.045 0.572 0.379 0.263 0.125 0.062 0.078 0.039 76.5 1.080 0.631 0.449 0.340 0.122 0.061 0.077 0.038 87.9 1.103 0.660 0.483 0.378 0.120 0.060 0.075 0.037 90.0 1.107 0.666 0.490 0.385 0.120 0.060 0.075 0.037
73 NUREG/CR-4219, Vol. 10, No. 2

Pressurized-Thermal-Shock Table 8.7 SIFICs for axially oriented finite-length semielliptical flaws on inner surface of cylinder:
Rj/t=10anda/t=0.3
Aspect Elliptic K0 Kl K2 K3 K0 Kl K0 Kl Ratio Angle Uniform Linear Quadratic Cubic tcl=6.35 td=6.35 tcl=3.96 tcl=3.96 2:1 0.00 0.723 0.127 0.048 0.026 0.404 0.188 0.334 0.176
17.4 0.708 0.203 0.083 0.042 0.102 0.049 0.056 0.025 29.1 0.690 0.264 0.126 0.068 0.058 0.028 0.034 0.016 40.9 0.680 0.326 0.185 0.114 0.043 0.021 0.026 0.013 52.6 0.673 0.381 0.251 0.177 0.036 0.018 0.022 0.011 64.4 0.668 0.423 0.310 0.242 0.032 0.016 0.020 0.010 76.1 0.665 0.452 0.355 0.297 0.030 0.015 0.018 0.009 87.9 0.662 0.478 0.385 0.331 0.028 0.014 0.017 0.009 90.0 0.662 0.482 0.391 0.337 0.027 0.014 0.017 0.009
6:1 0.00 0.665 0.112 0.041 0.022 0.380 0.181 0.315 0.167 17.4 0.715 0.190 0.068 0.027 0.117 0.054 0.069 0.032 29.1 0.804 0.277 0.118 0.051 0.093 0.045 0.057 0.028 40.9 0.886 0.376 0.194 0.104 0.085 0.042 0.053 0.026 52.6 0.951 0.470 0.284 0.182 0.081 0.040 0.050 0.025 64.4 0.998 0.549 0.372 0.270 0.078 0.039 0.049 0.024 76.1 1.028 0.605 0.439 0.345 0.077 0.038 0.048 0.024 87.9 1.053 0.635 0.475 0.384 0.075 0.038 0.047 0.024 90.0 1.058 0.640 0.481 0.391 0.075 0.037 0.047 0.023
10:1 0.00 0.562 0.085 0.029 0.014 0.344 0.168 0.290 0.153 17.4 0.707 0.176 0.052 0.016 0.128 0.059 0.078 0.037 29.1 0.848 0.276 0.104 0.016 0.110 0.054 0.068 0.034 40.9 0.962 0.389 0.188 0.082 0.102 0.051 0.064 0.032 52.6 1.051 0.498 0.288 0.169 0.098 0.049 0.062 0.031 64.4 1.115 0.590 0.385 0.265 0.096 0.048 0.060 0.030 76.1 1.157 0.653 0.460 0.346 0.095 0.047 0.060 0.030 87.9 1.183 0.685 0.496 0.387 0.094 0.047 0.059 0.029 90.0 1.187 0.691 0.503 0.394 0.094 0.047 0.059 0.029
NUREG/CR-4219, Vol. 10, No. 2 74

Pressurized-Thermal-Shock Table 8.8 SIFICs for axially oriented finite-length semielliptical flaws on inner surface of cylinder:
Rj/t=10anda/t = O.5
Aspect Elliptic K0 Kl K2 K3 K0 Kl K0 Kl Ratio Angle Uniform Linear Quadratic Cubic tcl=6.35 tcl=6.35 tcl=3.96 t cl=3-96 2:1 0.00 0.736 0.132 0.053 0.029 0.327 0.162 0.272 0.150
15.4 0.746 0.203 0.083 0.043 0.079 0.037 0.045 0.020 27.5 0.719 0.263 0.124 0.067 0.042 0.020 0.025 0.012 39.6 0.704 0.327 0.183 0.112 0.029 0.014 0.018 0.009 51.7 0.693 0.383 0.249 0.175 0.023 0.012 0.015 0.007 63.7 0.685 0.426 0.311 0.242 0.021 0.010 0.013 0.006 75.8 0.681 0.456 0.357 0.299 0.019 0.009 0.012 0.006 87.9 0.676 0.483 0.389 0.334 0.018 0.009 0.011 0.006 90.0 0.676 0.488 0.395 0.340 0.017 0.009 0.011 0.005
6:1 0.00 0.758 0.142 0.059 0.033 0.322 0.163 0.268 0.149 15.4 0.814 0.213 0.083 0.040 0.091 0.041 0.054 0.025 27.5 0.908 0.302 0.132 0.065 0.070 0.034 0.043 0.021 39.6 0.998 0.405 0.208 0.116 0.065 0.032 0.040 0.020 51.7 1.069 0.504 0.300 0.195 0.062 0.031 0.039 0.019 63.7 1.120 0.588 0.392 0.285 0.061 0.030 0.038 0.019 75.8 1.153 0.647 0.463 0.363 0.060 0.030 0.038 0.019 87.9 1.182 0.679 0.500 0.404 0.059 0.029 0.037 0.018 90.0 1.187 0.685 0.506 0.411 0.059 0.029 0.037 0.018
10:1 0.00 0.666 0.119 0.049 0.028 0.302 0.156 0.254 0.140 15.4 0.822 0.208 0.077 0.033 0.097 0.044 0.060 0.028 27.5 0.995 0.316 0.131 0.056 0.086 0.042 0.054 0.027 39.6 1.138 0.440 0.216 0.112 0.083 0.041 0.052 0.026 51.7 1.251 0.560 0.321 0.198 0.083 0.041 0.052 0.026 63.7 1.335 0.662 0.425 0.298 0.083 0.041 0.052 0.026 75.8 1.390 0.734 0.506 0.383 0.083 0.041 0.052 0.026 87.9 1.423 0.770 0.546 0.427 0.083 0.041 0.052 0.026 90.0 1.429 0.776 0.553 0.434 0.083 0.041 0.052 0.026
75 NUREG/CR-4219, Vol. 10, No. 2

Pressurized-Thermal-Shock
References
1. T. L. Dickson, "FAVOR: A New Fracture Mechanics Code for Reactor Pressure Vessels Subjected to Pressurized-Thermal-Shock," Pressure Vessel Integrity, PVP-Vol. 250, pp. 3-10, American Society of Mechanical Engineers, July 1993.*
2. H. G. DeLorenzi, "3-D Elastic-Plastic Fracture Analysis with ADINA," Computers and Structures 13, 613-621 (1981).*
3. B. R. Bass et al., "Applications of Energy Release Rate Techniques to Part-Through Cracks in Experimental Pressure Vessels," J. Pressure Vessel Tech. 104, 308-316 (November 1982).*
4. I. S. Raju and J. C. Newman, Jr., "Stress-Intensity Factor Influence Coefficients For Internal and External Surface Cracks in Cylindrical Vessels," pp. 37-48 in Aspects of Fracture Mechanics in Pressure Vessels and Piping, ASME Pub., PVP 58, American Society of Mechanical Engineers, 1982.*
5. C. Lance, F. Robisson, and A. Pellissier-Tanon, Union Carbide Nucl. Div., Oak Ridge National Laboratory, "Influence of Cladding on the Values of Kj for Emerging Defects in the Vessel Beltline," Framatome (1981), ORNL-tr-4960, February 1983.t
6. D. G. Ball et al., Martin Marietta Energy Systems, Inc., Oak Ridge Natl. Lab., "Stress-Intensity-Factor
Influence Coefficients for Surface Flaws in Pressure Vessels," USNRC Report NUREG/CR-3723 (ORNL/CSD/TM-216), February 1985.t
7. H. F. Bueckner, "A Novel Principle for the Computation of Stress Intensity Factors," Z. angew. Math. Mech. 50,529-546 (1970).*
8. ABAQVS Theory Manual, Version 5.2, Hibbit, Karlson and Sorensen, Inc., Providence, RI, 1992.*
9. B. R. Bass and J. W. Bryson, Martin Marietta Energy Systems, Inc., Oak Ridge Natl. Lab., "Applications of Energy Release Rate Techniques to Part-Through Cracks in Plates and Cylinders, Volume 1, ORMGEN-3D: A Finite Element Mesh Generator for 3-Dimensional Crack Geometries," USNRC Report NUREG/CR-2997/V1 (ORNL/TM-8527), December 1982.t
10. S. Timoshenko, Theory of Plates and Shells, McGraw-Hill, New York, 1940.*
11. J. A. Keeney and T. L. Dickson, "Stress-Intensity-Factor Influence Coefficients for Axially Oriented Semielliptical Inner-Surface Flaws in Clad Pressure Vessels (Rj/t = 10)," Letter Report ORNL/NRC/ LTR-93/33, April 1994.
Available in public technical libraries. 'Available for purchase from the National Technical Information Service, Springfield, VA 22161.
+Available for purchase from organization sponsoring the cited publication, and/or from authors, and/or recipients.
NUREG/CR-4219, Vol. 10, No. 2 76
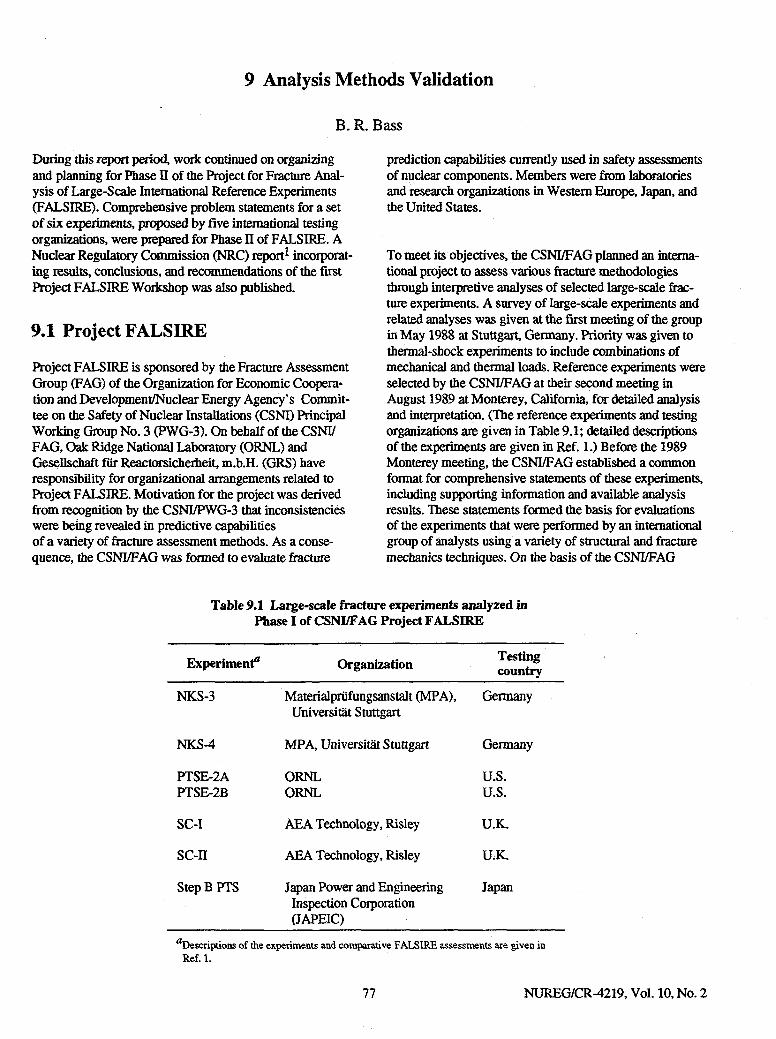
9 Analysis Methods Validation
B. R. Bass
During this report period, work continued on organizing and planning for Phase II of the Project for Fracture Analysis of Large-Scale International Reference Experiments (FALSIRE). Comprehensive problem statements for a set of six experiments, proposed by five international testing organizations, were prepared for Phase II of FALSIRE. A Nuclear Regulatory Commission (NRC) report1 incorporating results, conclusions, and recommendations of the first Project FALSIRE Workshop was also published.
9.1 Project FALSIRE
Project FALSIRE is sponsored by the Fracture Assessment Group (FAG) of the Organization for Economic Cooperation and Development/Nuclear Energy Agency's Committee on the Safety of Nuclear Installations (CSNI) Principal Working Group No. 3 (PWG-3). On behalf of the CSNI/ FAG, Oak Ridge National Laboratory (ORNL) and Gesellschaft fur Reactorsicherheit, m.b.H. (GRS) have responsibility for organizational arrangements related to Project FALSIRE. Motivation for the project was derived from recognition by the CSNI/PWG-3 that inconsistencies were being revealed in predictive capabilities of a variety of fracture assessment methods. As a consequence, the CSNI/FAG was formed to evaluate fracture
prediction capabilities currently used in safety assessments of nuclear components. Members were from laboratories and research organizations in Western Europe, Japan, and the United States.
To meet its objectives, the CSNI/FAG planned an international project to assess various fracture methodologies through interpretive analyses of selected large-scale fracture experiments. A survey of large-scale experiments and related analyses was given at the first meeting of the group in May 1988 at Stuttgart, Germany. Priority was given to thermal-shock experiments to include combinations of mechanical and thermal loads. Reference experiments were selected by the CSNI/FAG at their second meeting in August 1989 at Monterey, California, for detailed analysis and interpretation. (The reference experiments and testing organizations are given in Table 9.1; detailed descriptions of the experiments are given in Ref. 1.) Before the 1989 Monterey meeting, the CSNI/FAG established a common format for comprehensive statements of these experiments, including supporting information and available analysis results. These statements formed the basis for evaluations of the experiments that were performed by an international group of analysts using a variety of structural and fracture mechanics techniques. On the basis of the CSNI/FAG
Table 9.1 Large-scale fracture experiments analyzed in Phase I of CSNI/FAG Project FALSIRE
Experiment" Organization Testing country
NKS-3 Materialprufungsanstalt (MPA), Universitat Stuttgart
Germany
NKS-4 MPA, Universitat Stuttgart Germany
PTSE-2A ORNL U.S. PTSE-2B ORNL U.S.
SC-I AEA Technology, Risley U.K.
SC-II AEA Technology, Risley U.K.
Step B PTS Japan Power and Engineering Inspection Corporation (JAPEIC)
Japan
Descriptions of the experiments and comparative FALSIRE assessments are given in Ref. 1.
77 NUREG/CR-4219, Vol. 10, No. 2

Analysis problem statements, 37 participants, representing 19 organizations, performed a total of 39 analyses of the experiments. A 3-day workshop was held in Boston, Massachusetts, during May 1990, at which all participating analysts examined these evaluations in detail.
Using results from the workshop, ORNL and GRS jointly completed a final report on Phase I of Project FALSIRE that was published as an NRC report.1 Generally, results presented in the report highlight the importance of adequately modeling structural behavior of specimens before performing fracture mechanics evaluations. Applications of the various single-parameter fracture methodologies were found to be partially successful in some cases but not in others. On the basis of these assessments, some conclusions concerning predictive capabilities of selected ductile fracture methodologies, as applied to reactor pressure vessels (RPVs) subjected to pressurized-tbennal-shock (PTS) loading, were given, and recommendations for future development of fracture methodologies were made. Finally, proposals for follow-on work in the context of a Phase II of Project FALSIRE were included in the report.
9.2 FALSIRE II
Following completion of Phase I of Project FALSIRE, several participating organizations indicated a desire to proceed with further evaluation of fracture mechanics analysis methods in a Phase II program. Stimulated by somewhat unfavorable results from analyses of the PTSE-2 experiment in Phase I, it was proposed in Ref. 1 that FALSIRE n should emphasize experiments that focus on behavior in the transition temperature region of relatively shallow cracks subjected to combined thermal and mechanical loading. If possible, experiments for which cracks showed two stages of extension (e.g., stable crack extension followed by unstable extension) should be included. Investigations of crack extension in connection with clad surfaces should also be included.
In 1992, a proposal was made to CSNI/PWG-3 by the chairman of CSNI/FAG to initiate planning for FALSIRE n. After obtaining approval from CSNI/PWG-3, the Organizing Committee (OC) of CSNI/FAG contacted informally several international organizations to request preliminary information on a new set of candidate experiments for possible use in FALSIRE II (the OC consists of H. Schulz, Chairman of CSNI/FAG, J. Seivers, and R. Bass). These organizations are listed in Table 9.2 along with the candidate experiments that were subsequendy proposed by each organization. (A description of the experiments is given in the following section of this report.)
Table 93, Large-scale reference fracture experiments proposed for FALSIRE II
Experiment Organization Testing country
Thick cylinder; AEA Technology, U.K. thermal/centrifugal Risley load (SC-4)
Thick cylinder; Central Research Russia thermal/pressure Institute of Strucload (PTS 1/6) tural Mechanics
(Prometey),13
Technical Research Center of Finland (VTT)b
Finland
Clad beam; Electricity de France isothermal/uniaxial France (EdF) bend load (DD2, DSR3)
Thick cylinder; MPA, Universitat Germany thermal/pressure/ Stuttgart tension load (NKS-5, NKS-6)
Cruciform beam; ORNL U.S. isothermal/biaxial bend load (BB-4)
Organization performing test. "Organization performing analysis.
During May 1993, each of the organizations in Table 9.2 provided detailed information on the candidate experiments to the OC of CSNI/FAG using the special problem statement format developed by the CSNI/FAG during Phase I of FALSIRE; a sample problem statement is included in Appendix A of Ref. 1. The format of the problem statement consists of 16 pages of questions that are intended to provide information on a full range of topics, including the following: 1. general information, including the cognizant contact for
the organization performing the experiment;
2. testing facility;
3. specimen geometry;
4. material, physical, and fracture properties;
5. loading conditions;
NUREG/CR-4219, Vol. 10, No. 2 78

Analysis
6. instrumentation; Table 9.3 Schedule of events for Phase II of Project FALSIRE
7. test data and experimental results; 8. available analysis results; and February- • Solicitation of candidate experi-
March 1993 ments from international 9. comparison of experimental and analysis results. organizations
March 1993 • Formal letters requesting information for testing organizations
May 1993
June 1993
July-August 1993
October-November 1993
June 1994
July-September 1994
Fall 1994
Calendar year 1995
Submission of information to CSN1/FAG Selection of experiments/ drafting of problem statements in working sessions at GRS-K51n Distribution of calls-for-participation announcement for FALSIRE II Distribution of problem statements to analysts participating in FALSIRE II Submission by participating analysts of analysis results for FALSIRE II to CSNI/FAG Compilation of analysis results for FALSIRE II and organization of FALSIRE II workshop by CSNI/FAG Assessment of FALSIRE II analysis results by participating analysts in 3-day workshop Preparation and publication of final report on FALSIRE II (NRC)
The preliminary draft problem statements provided by the testing organizations listed in Table 9.2 were examined in considerable detail by the OC for clarity, completeness, and compatibility with FALSIRE II objectives. Contingent upon the satisfactory completion of certain modifications to the statements, the OC elected to accept all of the expert ments in Table 9.2 for FALSIRE II. The final version of these problem statements will provide the basis for evaluations to be performed by the analysts participating in FALSIRE II.
To publicize FALSIRE II internationally, the OC prepared a two-page, call-for-participation announcement that was distributed at the American Society of Mechanical Engineers (ASME) Pressure Vessel and Piping Conference in July 1993 and the 12th International Conference on Structural Mechanics in Reactor Technology in August 1993. The announcement described the objectives and schedule for FALSIRE II and included a form to allow prospective participants to declare their intentions to the OC by return mail.
Future steps for FALSIRE II essentially follow the format used for FALSIRE I. The completed problem statements for each reference experiment will be distributed to participating analysts beginning in October 1993. The analysts will be requested to submit results of their analyses to the OC in June 1994. At that point, the OC will initiate a compilation of analysis results for distribution at a workshop on FALSIRE II tentatively planned for the fall of 1994. Plans for the proposed FALSIREII workshop having to do with funding, location, and specific dates cannot be specified at this time. Finally, it is anticipated that a final report on FALSIRE II would be prepared and published as an NRC report. The complete schedule of events for FALSIREII is summarized in Table 9.3.
9.3 Summary of Proposed FALSIRE II International Reference Experiments
This section provides a brief summary of each reference experiment selected for FALSIRE II and listed in Table 9.2. These summaries are not intended to be comprehensive but to provide some available information on
specimen geometry, test material, loading conditions, experimental results, and a bibliographic reference for each experiment. Information on the experiments is based on preliminary problem statements and supporting documents provided to the OC by the cognizant organizations. It should be noted that information from the above-mentioned categories was not uniformly available at the same level of detail for all experiments. Consequently, emphasis on certain features varies among the individual summaries. Tables 9.4 and 9.5 further summarize the objectives and relevant features of each of the experiments.
9.3.1 AEA Technology—Fourth Spinning Cylinder Test (SC-4)
The Spinning Cylinder Project at AEA Technology, Risley, is concerned with investigation of fracture behavior in thick-walled test specimens under severe thermal-shock and simulated pressure loading conditions. A special test rig was constructed at Risley to produce the appropriate
79 NUREG/CR-4219, Vol. 10, No. 2

Analysis Table 9.4 Summary of test objectives of large-scale experiments
used in FALSIRE II
Experiment (place) Objective SC-4 Investigate transition fracture behavior for surface cracks in thick-(AEA Technology, U.K.) section steel specimen under thermal-shock loading conditions
PTS 1/6 Investigate crack initiation and arrest of a shallow-surface crack in a (Prometey, Russia) bimaterial thick-section steel specimen under PTS loading conditions
DD2, DSR3 Investigate cleavage initiation of shallow underclad cracks in clad (EdF, France) beams subjected to four-point bending
NKS-5 Investigate unstable crack propagation in transition region of two (MPA, Germany) symmetrically placed surface cracks in thick-section steel specimen
under PTS loading conditions
NKS-6 Investigate unstable crack propagation and arrest of fully circumfer-(MPA, Germany) ential crack in low-toughness vessel material in thick-section steel
specimen under PTS loading conditions
BIM Investigate influence of biaxial loading on cleavage fracture tough-(ORNL, U.S.) ness of shallow cracks using biaxially loaded cruciform beam
loading-conditions. Pressure loading is simulated by rotating the cylinder about its own axis; the generated hoop stress distribution resembles that in a large-diameter pressurized vessel. Specimens can be heated to 350°C and rapidly cooled on die inside surface using a water spray system. According to researchers at Risley, the design ensures uniformity of cooling and very high heat transfer coefficients at moderate speeds.
A series of large-scale experiments has been conducted in the Risley spinning cylinder facility. The first diree were concerned with fully ductile upper-shelf fracture; as indicated in Table 9.1, two of these experiments were used in Phase I of Project FALSIRE. The fourth spinning cylinder experiment (SC-4) was an investigation into transition fracture behavior under contained yield in a thick-section, low-alloy steel structure subjected to severe thermal shock. The stated objectives of SC-4 and the associated fracture analysis and material characterization programs were • to determine the toughness near the inner surface of a
thermally shocked thick-walled specimen in which the material yields near the quenched surface,
• to compare the measured toughness with the transition toughness curve determined from standard test specimens,
• to evaluate die methods used in the assessment of part-penetration defects under severe thermal-shock conditions when the elastically calculated peak stresses exceed yield, and
• to provide information concerning the arrest of a cleavage fracture.
The test was performed on a specimen extracted from a steel forging with the chemical composition of A 508 Class 3 steel, which was given a nonstandard heat treatment to provide suitable mechanical properties for test purposes. The reference nil-ductility transition temperature (RTNDT) w a s reported as >100°C.
Figure 9.1 depicts the test specimen containing two semicircular defects at the inner surface, which were oriented in an axial plane, located halfway along the length of the cylinder and separated by 135°; both were fatigue pre-cracked. Two sizes of defect (40- and 60-mm radii) were produced to maximize the likelihood of achieving the test objectives.
Twelve strain gages (weldable type) were situated on the cylinder. Thermocouples were deployed to measure the
NUREG/CR-4219, Vol. 10, No. 2 80

Table 9.5 Summary of FALSIRE II reference experiments
Analysis
Material" Experiment site toughness Loading*'* Crack, specimen''
geometry Crack growth
SC-4 (AEA, U.K.) >90 J/100°C Thermal shock Two cracks (1 and 2) partly Crack 1: T 0 = 305°C/TC = 7°C axial (max a/t = 0.2 and
0.3) at the inner surface of a cylinder (Rf = 500 mm, t = 100 mm)
cleavage* 0-71 mm
Crack 2: cleavage* 0-32 mm
PTS 1/6 Basic material Thermal shock Partly axial crack Cleavage 0 to (Prometey, Russia) 120J/110°C T o = 280°C/Tc=15°C (max a/t = 0.25) at the 90 mm and arrest
Weld material Internal pressure outer surface of a cylinder in base material; 120 J/40°C (transient) vessel Ri = 340 mm,
t = 150 mm) cleavage 0 to 13 mm and arrest in weld
DD2/DSR3 (EdF, France)
NKS-S (MPA, Germany)
Not available
NKS-6 (MPA, Germany)
BB-4 (ORNL, U.S.)
Basic material 90J/140°C
Weld material 220 J/-60°C
Base material 3 0 ^
Weld material 220 J/-60°C
L-T orientation 330XM0°C
T-L orientation 245 J/-40°C
Four-point bending at T o = -170°C
Thermal shock T 0 = 230°C/TC = 18°C
Axial tension Internal pressure (constant)
Thermal shock T o = 230°C/Tc=18°C
Axial tension Internal pressure
Biaxial bending (ratio 0.6:1) at T 0 = -46°C
Semielliptical underclad crack (a/t = 0.03) in a cladded four-point bending specimen (cross-section 120 by 145 mm)
Two cracks partly circumferential (max a/t = 0.135) at the inner surface of a cylinder (Ri = t = 200 mm)
Circumferential crack (a/t = 0.185) at the inner surface of a cylinder (Ri = t=200mm)
Straight through-crack (a/t= 0.1) in a cruciform-shaped specimen (cross section 91 x 111 mm)
Cleavage
Cleavage in basic material depth 13 mm circumferential 220°; arrest in weld material
Cleavage 20 mm in base material; ductile extension 41 mm; arrest in weld material
Cleavage initiation preceded by 0.08-mm ductile tearing
a A v = Charpy V-notch upper-shelf energy. *T 0 = initial crack-tip temperature/test temperature. C T C = cooling water temperature. **Rj = internal radius t = wall/specimen thickness a = crack depth.
*Predominantly in axial direction. •'Maximum Charpy energy lower than 50 J.
81 NUREG/CR-4219, Vol. 10, No. 2

Analysis
ORNL-DWG 94-3637 ETD
o o
o 6
1 1300
T 8
i
PLANE OF 60-mm SEMICIRCULAR DEFECT
DIMENSIONS IN mm UNLESS OTHERWISE
STATED
135°
PLANE OF 40-mm SEMICIRCULAR DEFECT
OUTER SURFACE
R40 m INNER SURFACE
650
OUTER SURFACE
m R60
INNER SURFACE
650
SECTION Y-Y SECTION X-X
Figure 9.1 Specimen geometry for the fourth spinning cylinder experiment (SC-4; AEA Technology)
cylinder temperature variations axially, circumferentially, and through the thickness. Cylinder speed was measured by three independent devices. On-line monitoring of crack growth was provided by the alternating current potential drop (ACPD) method developed for use on the quenched surface of the specimen.
The cylinder was initially stabilized at a mean temperature of 305°C. The test was conducted at a low rotational speed (530 rpm), and the thermal shock was generated by water spray cooling (~7°C) the inner surface of the preheated cylinder. Crack-tip temperatures were initially consistent with upper-shelf fracture behavior. During the test, crack-tip temperatures fell through the brittle/ductile transition regime.
Data collected during the test provided indications of crack growth at each end of the 40-mm defect. Subsequent
destructive examination confirmed this result and revealed growth at the ends of the 60-mm defect that had not been detected using the ACPD method. The fracture surfaces were similar in several respects (see Fig. 9.2); first, the cracks grew in an axial direction and no growth from the deepest point of either defect was produced; second, the aspect ratios of the arrested cracks were approximately the same, with a 6:1 length-to-depth ratio; and third, there was a thin (2- to 5-mm) ligament of material extending to, or very close to, the point of intersection of the crack with the inner surface of the cylinder. The presence of this unexpected ligament indicated that the cleavage initiation site was some distance below the surface. It also explained the failure of the ACPD method to detect growth of the 60-mm defect where the ligament was thickest.
The locations of the cleavage initiation sites have been established by examination of the fracture surfaces. These data have been used with the temperature data and the
NUREG/CR-4219, Vol. 10, No. 2 82

Analysis
E E
C/3 a.
o cc u_ LU
o
160
140
120
100
80
60
40
20 h
0 100
80
60
40
20
0
T — r T T T i—r ORNL-DWG 94M-3638 ETD
i—r l—r INITIAL NOTCH FATIGUE PRECRACK
EZ3 CLEAVAGE FRACTURE SURFACES O TIME OF FLIGHT DIFFRACTION INSPECTION FROM INNER SURFACE
h • TIME OF FLIGHT DIFFRACTION FROM OUTER SURFACE A PULSE ECHO INSPECTION
1 1 1 1 1 t i l l 1 1 1 1
-
A ^ A A
l c
Vt**'-*"'--'."'- •*"•'-«• *w 3 0 ^ i T , > - | . - . - V T , . v . M . - . | | -JfXvL
-
520 540 560 580 600 620 640 660 680 700 720 740 760 780 DISTANCE FROM TOP OF CYLINDER (mm)
Figure 9.2 Comparison of fracture surfaces and ultrasonic profiles for two defects: (a) 60-nun crack depth and (b) 40-mm crack depth
results of three-dimensional, elastoplastic, finite-element analyses to evaluate the toughness under large-scale conditions. Additional information on the experimental and analytical results for the SC-4 experiment is available in Ref. 2.
primary objective of the sixth experiment was to produce crack initiation and arrest under PTS loading as well as VVER440 material property data for the validation of different fracture assessment models.
9.3.2 Prometey-Sixth PTS Test (PTS 1/6)
PTS experiments are being performed at the Prometey Institute for the purpose of investigating the behavior of surface flaws under pressurized-water reactor overcooling accident conditions. The stated purpose of the tests is to determine whether a surface flaw would be critical as a result of very severe PTS loading and how well this situation can be predicted.
The test vessel is depicted in Fig. 9.3(a). The vessel contained a circumferential weldment at the midlength of the vessel. The width of the weld was determined by etching to be 160 mm at the outside surface and 50 mm at the inside surface. An axial outside surface flaw was located at the midlengdi of the vessel partly in weld and base material. A sharp precrack was made by a manual metal arc welding technique. The initial crack geometry, presented in Fig. 9.3(b), is a near semiellipse (a = 38 mm, 2c = 350 mm).
Seven PTS experiments were performed with the same model RPV using five different flaw geometries. The
The pressure vessel material is VVER-440-type RPV steel 15X2MFA. The Charpy upper-shelf impact energy was
83 NUREG/CR-4219, Vol. 10, No. 2

Analysis ORNL-DWG 94M-3639 FED
CIRCUMFERENTIAL WELD
PRETEST FLAW
(a) 1850
-100
(b)
OUTSIDE SURFACE
VESSEL WALL-
INSIDE SURFACE
J_ 100 200 300
AXIAL COORDINATE (mm) 400
WATER TANK (5 nf) CRANE FOR LIFTING HEATING RESISTORS
„> WATER TANK (5 m3)
(c)
Figure 9-3 Sixth PTS experiment (PTS 1/6; Prometey Institute): (a) cylinder geometry, (&) detail of crack plane, and (c) test facility
NUREG/CR-4219, Vol. 10, No. 2 84

quoted to be -120 J for weld and base material, although this parameter was found to be dependent on distance from the vessel surface. The RTNOT w a s not available; a Charpy energy of 50 J was achieved at 40°C in the weld and at 110°C in the base material. The circumferential weld was made by submerged-arc welding using wire Sv-IOXMFT and flux AH-42. The vessel was subjected to heat treatment to simulate the radiation embrittlement of the VVER-440-type steel. According to the Prometey Institute, the heat-treatment parameters were given as follows: annealing at 1000°C, holding 4 h, cooling in oil, tempering at 620°C for 10 h, cooling in air. Material properties for the vessel were generated by the Prometey Institute and VTT.
The temperatures were measured on the outside and inside surfaces of the vessel using thermocouples. The strains were measured at selected points on the outside surface using weldable strain gages. In addition, the crack-mouth-opening displacement (CMOD) and pressure were measured. All the transducers were set to zero after pressuriza-tion and just before the beginning of the thermal transient.
The test facility configuration is depicted in Fig. 9.3(c). The pressure vessel was first heated to test temperature using heating resistors. The initial temperature distribution varied along the vessel length between 235°C and 310°C. At the same time, the vessel was pressurized by water to an initial pressure of 605 bar. Just before the thermal shock was initiated, the heating resistors were raised. The vessel was then subjected to a sudden flow of cold tap water around the outer surface. Because of the capacity of cooling water tanks, die coolant flow is effective for only the first 2 min, after which the flow rate gradually decreases to zero.
During the heat-up phase, steam is generated inside the vessel as a result of the high temperature. To avoid over-pressurization, this steam is allowed to flow out of the vessel. The fact that the vessel is not full of water results in nonuniform heat transfer on the inside surface of the vessel along me vessel lengtii. Also, the vessel stands witii one end on the floor. According to Prometey, these two factors contributed to a nonuniform initial temperature distribution in the vessel.
Cleavage fracture initiation was achieved in the transition temperature region of the base material. The final configuration of the arrested crack is shown in Fig. 9.3(6)- Analytical interpretations of the crack run/arrest event in the PTS 1/6 experiment are presented in Ref. 3.
Analysis 9.3.3 EdF—Clad Four-Point Bending Beam
Tests (DD2 and DSR3)
An experimental program is under way at Electricity de France (EdF) to provide data for evaluating different methods of fracture analysis used in RPV integrity assessments. Experimental results are being compared with analysis predictions to validate different methods of fracture analysis and to evaluate their conservatism. Also, the effects of stainless steel cladding are being examined. The focus of these studies is a series of clad beams containing underclad cracks tested in four-point bending. The tests were performed at low temperatures (-170°C) to simulate severe radiation embrittlement and to investigate the effects of cladding on cleavage fracture in the base material.
The geometry of the four-point bend-bar specimen containing an underclad crack is shown schematically in Fig. 9.4. The central part of each beam is A 508 class 3 steel; the R T N D T was given as -40°C. The fabricated specimen has dimensions of 120 x 145 x 1780 mm, with a 6.0-mm (DD2)/4.5-mm (DSR3) layer of cladding on the top surface produced by an automatic submerged-arc welding process. The cladding is applied in two layers, the first of which is 309L stainless steel, followed by a second layer of 308L. The beam contains a small semielliptical underclad crack with depth of 4.5 mm (DD2)/13 mm (DSR3) and length of 48 mm (DD2)/40 mm (DSR3); the crack was generated by fatigue precracking. After the cladding process, a stress relief heat treatment is applied at 600°C for 8 h.
Data collected during the tests are load, load-line displacement (LLD), strains, and temperatures. Strains are measured with strain gages placed on the clad surface and on the opposite surface of the beam. Temperatures are measured with thermocouples placed on the surface and inside the specimen.
The objective of the tests is to obtain crack instability in die base metal by cleavage fracture. With this aim, the tests are performed at very low temperature, about-170°C. Before the mechanical test, the beam is cooled with liquid nitrogen such that die temperature is uniform inside the specimen after the cooling. The beam is insulated to avoid significant reheating during me fracture test. The specimens are then loaded in four-point bending widi a 1450-mm major span and 450-mm minor span.
In the DD2 and DSR3 tests, the fracture loads were reported to be 840 and 695 kN, respectively. The cleavage
85 NUREG/CR-4219, Vol. 10, No. 2

Analysis ORNL-DWG 94M-3640 ETD
119.5
BEND BAR WELDED JOINTS
i CLAD LAYER
119.5
•145-
CLAD LAYER
INITIAL DEFECT: LENGTH ~ 44mm DEPTH ~ 4mm
119.5
DIMENSIONS IN mm
Figure 9.4 Clad bend-bar specimen containing an underclad crack (DD2 and DSR3; EdF)
fractures initiated in the ferritic base material with no crack arrest.
Additional information concerning the EdF clad-beam testing program is given in Ref. 4.
9.3.4 MPA—PTS Tests (NKS-5 and -6)
Large-scale experiments were conducted on thick-section cylindrical specimens under PTS loading at MPA-Stuttgart to investigate crack growth and crack arrest behavior of primary circuit RPV materials. The material characteristics
NUREG/CR-4219, Vol. 10, No. 2 86

varied from high-toughness material to low-toughness material with a higher nil-ductility transition temperature to simulate end-of-life (EOL) or beyond EOL state. All tests started from in-service conditions and were cooled down to room temperature.
The test facility at MPA-Stuttgart incorporates a thick-walled, hollow-cylinder test specimen welded at both ends to the grips of a 100-MN tensile testing machine. In addition to an axial tensile load, the specimen was loaded by internal pressure (pressurized water at 30 MPa, T = 300°C). The thermal-shock cooling of the specimen inner surface is performed by means of two high-pressure pumps directing cold water (20°C) through evenly distributed nozzles toward the inner surface over the whole test length of the cylinder.
Analysis men. According to MPA, the positions of the thermocouples recorded the achievement of an even temperature -distribution both in the circumferential and longitudinal direction. The CMODs were recorded with clip gages positioned at selected points.
9.3.4.1 NKS-S
Two prefatigued semielliptical cracks (see Fig. 9.5) with the circumferential angle of 52° and each with a maximum crack depth of 27 mm were installed in the specimen NKS-5. The cylindrical specimen was composed of low-toughness base material (22 NiMoCr 37) with a shape-welded high-toughness external ring of 160-mm thickness made of S3 NiMo 1. The Charpy upper-shelf energy was 90 J and 220 J for the base and weld material, respectively; the corresponding RTJNJDT values were quoted as 75 and -30°C, respectively.
The temperatures through the wall thickness were measured with thermocouples inserted into boreholes. Additional thermocouples, together with strain gages, were applied on the internal and external surfaces of the speci-
The objectives of the NKS-5 test were to attain unstable crack initiation in the transition region of the material and extension of both cracks up to the tough external ring. At
ORNL-DWG 94M-3641 ETD
SECTION A - B
BASE MATERIAL (22NiMoCr37)
WELDING MATERIAL (S3 NiMo 1)
DIMENSIONS IN mm
Figure 9.5 Specimen geometry for fifth PTS experiment (NKS-5; MPA)
87 NUREG/CR-4219, Vol. 10, No. 2

Analysis the beginning of the thermal shock, the temperature was stabilized at 230°C on the inner wall of the specimen. The axial load was raised to the maximum of 100 MN at a rate of 3 MN/min just 11 min after cooling had started and was kept at that level until the end of the test.
During the test, the cracks initiated in the brittle regime and expanded in a "jump" up to the tough weld material. The fracture surface of specimen NKS-5 showed that the cracks propagated in cleavage both in the circumferential direction over an azimuthal angle of 220°, as well as in wall thickness direction, where they were arrested at a crack depth of 40 mm by the tough welded material. Inspection of the fracture surface indicated that the crack advanced essentially by cleavage. However, an exception was a seam of ductile fracture at the end of the fatigue crack, which can be interpreted as a stretched zone. Analytical assessments of the NKS-5 experiment are given in Ref. 5.
9.3.4.2 NKS-6
The purpose of the NKS-6 test was to conduct an experimental and numerical investigation of unstable crack propagation and arrest in a very low toughness vessel material under combined mechanical and thermal loading. The test specimen contained a 360° circumferential flaw on the inner surface having an average depth of 37 mm; the flaw was fatigue precracked. As depicted in Fig. 9.6, the crack was located in an inner ring of heat-treated material based on 17 MoV 84, which was specially developed by MPA-Stuttgart and referred to as KS22. The specimen also included a shape-welded, high-toughness 100-mm-thick external ring of S3 NiMo 1 similar to that used in NKS-5. The remainder of the cylinder was manufactured from 20 MnMoNi 55 steel, which is similar to A 508 Class 3. The Charpy upper-shelf energy for the KS22 material is very low (by design), estimated to be -30 J. The FATT 50 temperature for the KS22 material was given as 250°C.
Conditions prior to the test included an initial temperature of 280°C, internal pressure of 13 MPa, and an axial load of 25 MN. The combination of internal pressure and axial load resulted in Kj values just below the scatter band of the Kjc values of the KS22 material in which the crack resided. Subsequent to application of the thermal shock, crack propagation was achieved in the specimen in two steps with final crack arrest occurring at the interface of the tougher welded external ring.
Two regions with different fracture modes were visible from fractographic examinations. The fracture surface immediately adjacent to the fatigue crack indicated predominantly cleavage fracture, which turned into a com
pletely ductile fracture mode. In accordance with measurements on the fracture surface and acoustic emission results, the first phase included a cleavage crack jump and arrest corresponding to Aa = 20 mm. Following a quiet phase of a few seconds, crack extension continued with ductile crack growth up to the tough welded material (Aa = 41 mm). On reaching the weld material, no additional crack extension occurred. Analytical assessments of the NKS-6 experiment are described in Ref. 5.
9.3.5 ORNL—Biaxially Loaded Cruciform Beams (BB-4)
A testing program to examine the influence of biaxial loads on the fracture toughness of shallow-flaw specimens under conditions prototypic of an RPV was begun within the HSST Program. Existing data suggest that shallow-flaw specimens under tensile biaxial loading (i.e., parallel to the crack tip) will exhibit a toughness reduction compared to shallow-flaw uniaxially loaded specimens. Determination of the extent of this toughness reduction is one of the main goals of the biaxial fracture-toughness program.
A cruciform specimen with a shallow through-thickness crack was proposed for biaxial fracture-toughness testing. The specimen, shown in Fig. 9.7(a), has a cross section of dimensions 9.1 by 10.2 cm and a straight through-crack of uniform depth 10 mm in the test section. The total length of this specimen in the longitudinal or transverse direction, including the test section and the loading arms, is 61 cm. Three slots are machined into each arm to minimize diffusion of the load around the test section containing the through-crack. The crack is cut between two opposite central load-diffusion control slots to produce a shallow crack of uniform depth with no singularity on the surface. Figure 9.7(b) shows the profile of the crack and the intersection of the crack and the central slot. The specimen is notched and precracked after the two longitudinal arms are electron-beam welded to the test section.
The test section of the specimen is fabricated from A 533 grade B class 1 steel plate previously employed in the HSST wide-plate and shallow-crack testing programs. Estimates of Charpy upper-shelf energy in the L-T orientation ranged from -329 J to -350 J; the RT N D T is -35°C.
Instrumentation is placed on the specimen to monitor CMOD, LLD, surface strain, and temperature at various locations. A special load reaction system was constructed for applying bending loads to the arms of the specimen in a statically determinant manner. Loading is applied at mid-span to the specimen using a square, flat seat having
NUREG/CR-4219, Vol. 10, No. 2 88

Analysis
ORNL-DWG 94M-3642 ETD
B
17771 20MnMoNi55 S3 NiMo 1
R^Kl KS22(17MoV84)
DIMENSIONS IN mm
Figure 9.6 Specimen geometry for sixth PTS experiment (NKS-6; MPA)
89 NUREG/CR-4219, Vol. 10, No. 2

Analysis
ORNL-DWG 92M-3935AR ETC
DIMENSIONS IN mm
(a)
— » | 51 f « — 1 1 2 — * | JO SURFACE CRACK
(b) SECTION A-A
Figure 9.7 Cruciform bend specimen (BB-1 through -5; ORNL)
rounded edges and the same planar dimensions as the test section. The test section bends into two orthogonal surfaces that contact the seat along the outer edges resulting in eight-point bending (or four-point bending for the uniaxial case).
The HSST Program assigned a total of five cruciform specimens to the development phase of the biaxial testing program. These "development" specimens were used to evaluate the performance of the test specimen, test fixture, and procedures to develop a test specimen geometry suitable for the generation of biaxial fracture-toughness data.
Data from the cruciform specimens were initially compared with data from previous HSST shallow-crack tests performed under uniaxial conditions. Several of the uniaxial shallow-crack tests were conducted at T - RTNDT of -10°C, which is in the transition region of the deep-crack
toughness curve for A 533 B. The test temperature for the cruciform specimen tests was -45°C; therefore, the normalized temperature (T - RTNDT) was -10°C.
Of the five development specimens, four were tested under biaxial loading, and one was tested under uniaxial loading. The uniaxially loaded cruciform specimen allows comparison with previous uniaxial shallow-crack specimens under identical test conditions (crack depth, temperature, etc.). Testing cruciform specimens in both uniaxial and biaxial loading configurations will allow toughness values to be measured with only one test condition changed, namely, the out-of-plane loading.
Based on pretest finite-element analyses, a biaxial load ratio of 0.6:1 (transverse bending load:longitudinal bending load) was selected for testing in the development phase of the program. All five specimens tested in this phase gave
NUREG/CR-4219, Vol. 10, No. 2 90

Analysis consistent results. The critical fracture load for each specimen was approximately the same, but the uniaxial specimen withstood substantially more deformation at failure than did the biaxial specimens. The plastic "work" at the crack tip, determined from the load vs LLD or load vs CMOD curve, was a factor of 3 greater for the uniaxial specimen man for the biaxial specimens. Because American Society for Testing and Materials standards are not appropriate for the cruciform geometry, three-dimensional, elastic-plastic, finite-element posttest analyses were necessary to estimate the fracture toughness. The posttesi finite-element analyses were used to determine r|-factors from which the toughness value of each test was estimated. A complete assessment of these analyses is given in Refs. 6 and 7.
Test BB-4, with a biaxial loading ratio of 0.6:1, was selected for FALSIRE II by the OC.
9.4 Closure
During this report period, organizational responsibilities at ORNL for Project FALSIRE were transferred from the HSST Program to the NRC-sponsored RPV International Programs Support (NRC JCN No. B5703).
References
1. B. R. Bass et al, Martin Marietta Energy Systems, Inc., Oak Ridge National Laboratory, "CSNI Project for Fracture Analysis of Large-Scale International Reference Experiments (Project FALSIRE)," USNRC Report NUREG/CR-5997 (ORNL/TM 12307) (June 1993).*
2 D. J. Lacey et al., Spinning Cylinder Test 4: An Investigation of Transition Fracture Behavior for Surface
Breaking Defects in Thick-Section Steel Specimens, AEA Technology Report AEA TRS 4098, June 1991.
3 H. Keinanen et al., "Pressurized Thermal Shock Tests with Model Pressure Vessels Made of 15X2MFA Reactor Steel," IAEA Specialists' Meeting on Fracture Mechanics Verification by Large-Scale Testing, Oak Ridge, Tennessee, October 26-29,1992.
4 D. Moinereau et al., "Cleavage Fracture of Specimens Containing an Underclad Crack," PVP Vol. 233, Pressure Vessel Fracture, Fatigue and Life Management, ASME, 1992.
5 L. Stumpfrock, "Fracture Mechanic Investigations on Cylindrical Large-Scale Specimens under Thermal-Shock Loading," 17th MPA Seminar, October 10-11, 1991 (to be published in Nuclear Engineering and Design).
6 T. J. Theiss et al., Martin Marietta Energy Systems, Inc., Oak Ridge National Laboratory, "Initial Results of the Influence of Biaxial Loading on Fracture Toughness," USNRC Report NUREG/CR-6036 (ORNL/TM-12349), June 1993.*
7. B. R.. Bass et al., Martin Marietta Energy Systems, Inc., Oak Ridge National Laboratory, "Biaxial Loading and Shallow-Flaw Effects on Crash-tip Constraint and Fracture Toughness," USNRC Report NUREG/ CR-6132 (ORNL/TM-12498) January 1994.*
Available for purchase from the National Technical Information Service, Springfield, VA 22161.
91 NUREG/CR-4219, Vol. 10, No. 2


10 Fracture Evaluation Tests
W.J.
The purpose of this task is to provide experimental support for tasks within the Heavy-Section Steel Technology (HSST) Program exclusive of Task HI2, which performs its own experimental work. Currently, Task H10 is divided into 4 subtasks: 10.1 Full-Thickness Clad Beam Tests (coordinated with Task H6, Cleavage-Crack Initiation, and Task H7, Cladding); 10.2 Thermal-Shock Facility Operation and Upgrades; 10.3 Finite-Length Flaw Validation Tests (coordinated with Task H6, Cleavage-Crack Initiation, and Task H7, Cladding); and 10.4 Material Requests (supply A 533 B material on an as-needed basis). In addition, Task H10 has interfaced with Task H12, Biaxial Loading Effects on Fracture Toughness, in the development and test shakedown of a beam bend fixture for biaxial fracture testing of cruciform type specimens, details of which have been reported previously. Progress in the different subtasks is discussed below.
10.1 Full-Thickness Clad Beam Tests [W. J. McAfee (ORNL), S. R. Low (NIST)]
The full-thickness, clad beam (FTCB) tests are being performed at the National Institute of Standards and Technology (NIST) using its 53.4-MN (12-miIlion lb) servo-hydraulic test machine. The objective of these tests is to determine the fracture toughness of prototypic, clad, full-thickness reactor pressure vessel (RPV) weld and plate material with shallow flaws. Shallow flaws are of primary interest in support of the on-going pressurized-thermal-shock (PTS) evaluations. In addition, the flaw geometries and specimen designs specified permit investigation of the influence of metallurgical gradients in the base material and the effect of the presence of cladding on the fracture toughness of both weld and base materials with flaws prototypic of those that could occur in an RPV. The test results will be used to investigate, identify, and quantitatively define differences between assumed [e.g., American Society of Mechanical Engineers (ASME), Sect. XI] and actual toughness levels in the near surface material of an RPV. The source material for the specimens is American Society of Testing and Materials (ASTM) A 533 Grade B, Class 1 steel with stainless steel cladding, which was taken from a shell segment of a canceled pressurized-water reactor (PWR) vessel. The particular segment being used includes the rolled plates and a full-thickness longitudinal vessel weld. The base material, cladding, and weldm'ent are thus completely prototypic of a production-quality RPV. Characterization of the plate and weld materials is being performed at Oak Ridge National Laboratory (ORNL)
under Task H3. The characterization includes Charpy tests to determine the transition temperature(s) for the materials and stress-strain curves for use in performing the supporting fracture analyses.
The test matrix for the first series of tests is shown in Table 10.1. The nominal crack depths, a, shown are for the beams after fatigue precracking. All three of these specimens represent tests of the weld joining the shell segments. One development and two test beams were planned for this series. Testing of the development beam, which was intended to verify and validate the testing procedures for the other tests, has been completed. Based on Charpy results, the test was performed at -25°C and failed at a load of -278 kips. Initial observations indicate that the failure mode was essentially cleavage.
Table 10.1 Matrix of first series of FTCB tests
Test beam Crack depth, ^ a (in.)
1 (Development beam) 4.50 0.50 2 0.90 0.10 3 0.40 0.04
The interagency agreement (IAG) under which this testing was performed expired at the end of March 1993, and due to various delays in getting the IAG extended for another year, no additional testing has been performed during this reporting period. The IAG extension was completed during September, and NIST has resumed work, starting instrumentation of FTCB 2 and FTCB 3. Testing will resume when NIST has resolved some problems with its test machine and has cleared up ongoing work so that the staff can reconfigure the machine for the ORNL tests.
The IAG extension includes two additional FTCB tests. These specimens are to be fabricated using the broken halves of the first test specimen (development beam). They will thus be base metal equivalents of FTCB 2 and FTCB 3 in Table 10.1 although the specific flaw depths will be determined after data from the shallowest flaw test (FTCB 3) are available. These additional tests will provide comparative results for evaluation of the relative strength of weld and base materials in full-thickness form. As part of the IAG extension, the two additional specimens will be fabricated by NIST with ORNL oversight. It is planned that the specimens will be fabricated by electron-beam (EB)
NUREG/CR-4219, Vol. 10, No. 2

Fracture
welding beam arms to the test section, thus permitting use of FTCB1 beam halves as noted previously. This fabrication procedure has been used extensively and successfully by ORNL although not on sections this thick. ORNL has had discussions with a potential vendor, and it appears that procedures for EB welding of 8- to 9-in.-thick sections are feasible.
In addition to fabrication and performance of these tests, the IAG extension includes an engineering feasibility study to design a large-scale biaxial test fixture comparable to that currently in use at ORNL. This fixture will permit biaxial testing of full-thickness beam specimens (unclad, clad, 2-D flaws, and 3-D flaws) to extend the uniaxial work discussed previously and in subtask HI0.3 to conditions more prototypic of RPV loading. The availability of such a large-scale test facility is an integral part of the HSST Program's long-range plan to perform large-scale, prototypic RPV testing. The feasibility study commits ORNL only to the costs for development of the design. A decision on fabrication of such a facility will be made after a careful review of HSST needs and options. NIST personnel visited ORNL in September to inspect the HSST biaxial test facility and to discuss detailed requirements for a large-scale biaxial fixture. The discussions were very productive because NIST now has a much clearer perception of the constraints necessary on the fixture to achieve the type of loading required.
10.2 Thermal-Shock Facility and Operation Upgrades (W. J. McAfee, F. Gibson, and W. F. Jackson, Jr.)
A preliminary review to assess the operational status of the Thermal-Shock Facility (TSF) at ORNL was completed. The structure and mechanical components appear to be in excellent condition and would require only a minor amount of refurbishment to be returned to operational status. It is considered that the instrumentation cables (thermocouple leads, strain gage leads, etc.) will not be usable for any future tests. In addition, the data acquisition system (DAS) used for the previous series of thermal-shock tests is no longer serviceable, and the system currendy used for structural testing does not have the capability needed to condition, measure, and record the number of channels used in a typical thermal-shock test. The general requirements for a DAS needed to support thermal-shock testing have been developed.
Assessment of the role of thermal-shock tests in developing methodologies for both finite-length flaw and cladding effects continues. In a typical thermal-shock test, conditions under which failure occur are limited by the combi
nation of shock rate and temperature. If the shock rate is too low, the thermal stress may not generate sufficiently high stress-intensity factors (SIFs) to cause failure. Alternately, the temperature, and thus the material toughness, may be high enough when the peak SIFs are achieved that failure does not occur. Specifically, the thermal-shock test does not allow control of test conditions of the type that are necessary for development of a general technology related to finite-length flaw and cladding behavior.
Fracture initiation tests in which applied load in conjunction with material properties (toughness, tearing resistance, etc.) can be controlled are considered to be more appropriate for developing the general elements of a methodology to evaluate the behavior of finite-length flaws and the contribution of cladding under PTS conditions. Laboratory-scale and full-thickness biaxial beam tests can be used advantageously because a wide range of combinations of material properties and applied stress can be investigated. Material mechanical properties can be "adjusted" through both heat treatment of the material and use of selected test temperatures. In addition to testing under specified material conditions, biaxial beam tests provide the capability of testing under specified stress state conditions, that is, different biaxiality conditions, as would occur due to thermal loading, pressure loading, or a combination of thermal and pressure loading. In summary, it is recommended that the methodology for handling finite-length flaws and cladding be developed using biaxially loaded beam tests. This methodology will then be validated, when appropriate, with selected thermal-shock tests of clad cylinders with finite-length flaws.
10.3 Finite-Length Flaw Validation Tests (W. J. McAfee, T. J. Theiss, and W. F. Jackson, Jr.)
The objective of these tests, as discussed in subtask H6, is to investigate the influence of finite-length flaw profiles, out-of-plane loading, material condition, and the effect of cladding on the effective fracture toughness of RPV plate material. As discussed previously, the use of a beam specimen has limitations as compared to performing full-scale thermally shocked cylinder tests but has the distinct advantage of being able to investigate a matrix of parameters in a much more timely and cost-effective manner. The task elements are briefly discussed below.
Although Regulatory Guide 1.154 (Ref. 1) specifies that, in performing a probabilistic fracture mechanics assessment of an RPV, all shallow flaws shall be assumed to be infinitely long surface flaws, the flaws that most probably exist in an RPV will be shallow finite-length, surface flaws.
NUREG/CR-4219, Vol. 10, No. 2 94
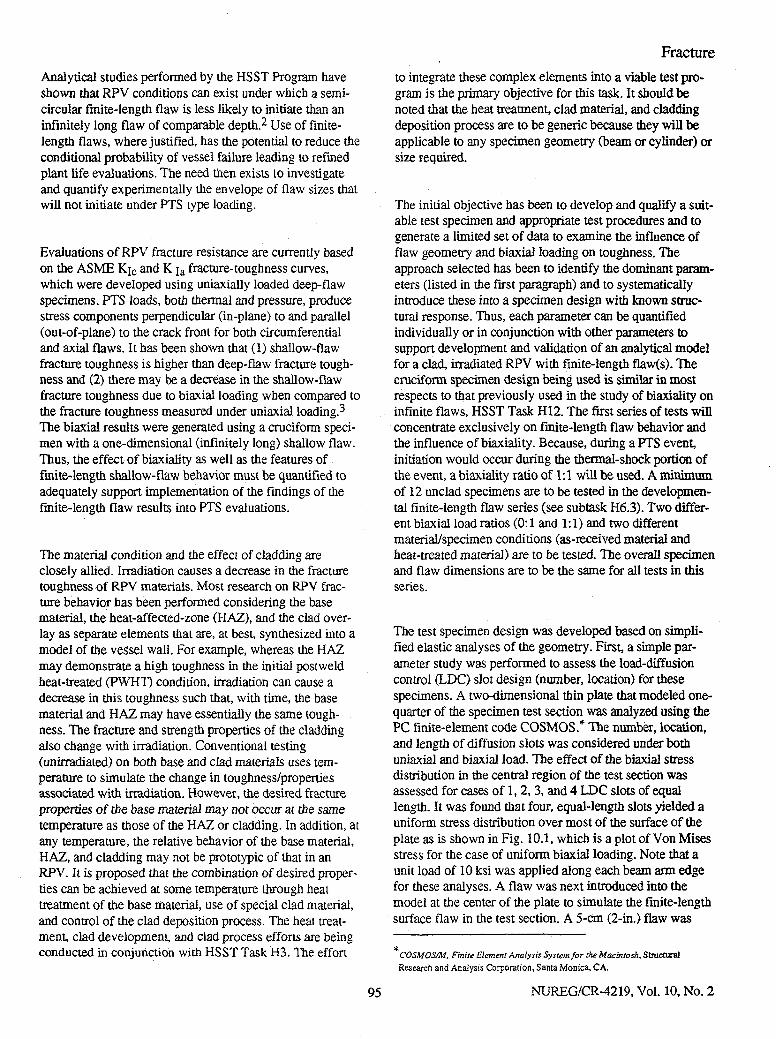
Fracture Analytical studies performed by the HSST Program have shown that RPV conditions can exist under which a semicircular finite-length flaw is less likely to initiate than an infinitely long flaw of comparable depth.2 Use of finite-length flaws, where justified, has the potential to reduce the conditional probability of vessel failure leading to refined plant life evaluations. The need then exists to investigate and quantify experimentally the envelope of flaw sizes that will not initiate under PTS type loading.
Evaluations of RPV fracture resistance are currently based on the ASME Kjc and K j a fracture-toughness curves, which were developed using uniaxially loaded deep-flaw specimens. PTS loads, both thermal and pressure, produce stress components perpendicular (in-plane) to and parallel (out-of-plane) to the crack front for both circumferential and axial flaws. It has been shown that (1) shallow-flaw fracture toughness is higher than deep-flaw fracture toughness and (2) there may be a decrease in the shallow-flaw fracture toughness due to biaxial loading when compared to the fracture toughness measured under uniaxial loading.3
The biaxial results were generated using a cruciform specimen with a one-dimensional (infinitely long) shallow flaw. Thus, the effect of biaxiality as well as the features of finite-length shallow-flaw behavior must be quantified to adequately support implementation of the findings of the finite-length flaw results into PTS evaluations.
The material condition and the effect of cladding are closely allied. Irradiation causes a decrease in the fracture toughness of RPV materials. Most research on RPV fracture behavior has been performed considering the base material, the heat-affected-zone (HAZ), and the clad overlay as separate elements that are, at best, synthesized into a model of the vessel wall. For example, whereas the HAZ may demonstrate a high toughness in the initial postweld heat-treated (PWHT) condition, irradiation can cause a decrease in this toughness such that, with time, the base material and HAZ may have essentially the same toughness. The fracture and strength properties of the cladding also change with irradiation. Conventional testing (unirradiated) on both base and clad materials uses temperature to simulate the change in toughness/properties associated with irradiation. However, the desired fracture properties of the base material may not occur at the same temperature as those of the HAZ or cladding. In addition, at any temperature, the relative behavior of the base material, HAZ, and cladding may not be prototypic of that in an RPV. It is proposed that the combination of desired properties can be achieved at some temperature through heat treatment of the base material, use of special clad material, and control of the clad deposition process. The heat treatment, clad development, and clad process efforts are being conducted in conjunction with HSST Task H3. The effort
to integrate these complex elements into a viable test program is the primary objective for this task. It should be noted that the heat treatment, clad material, and cladding deposition process are to be generic because they will be applicable to any specimen geometry (beam or cylinder) or size required.
The initial objective has been to develop and qualify a suitable test specimen and appropriate test procedures and to generate a limited set of data to examine the influence of flaw geometry and biaxial loading on toughness. The approach selected has been to identify the dominant parameters (listed in the first paragraph) and to systematically introduce these into a specimen design with known structural response. Thus, each parameter can be quantified individually or in conjunction with other parameters to support development and validation of an analytical model for a clad, irradiated RPV with finite-length flaw(s). The cruciform specimen design being used is similar in most respects to that previously used in the study of biaxiality on infinite flaws, HSST Task H12. The first series of tests will concentrate exclusively on finite-length flaw behavior and the influence of biaxiality. Because, during a PTS event, initiation would occur during the thermal-shock portion of the event, a biaxiality ratio of 1:1 will be used. A minimum of 12 unclad specimens are to be tested in the developmental finite-length flaw series (see subtask H6.3). Two different biaxial load ratios (0:1 and 1:1) and two different material/specimen conditions (as-received material and heat-treated material) are to be tested. The overall specimen and flaw dimensions are to be the same for all tests in this series.
The test specimen design was developed based on simplified elastic analyses of the geometry. First, a simple parameter study was performed to assess the load-diffusion control (LDC) slot design (number, location) for these specimens. A two-dimensional thin plate that modeled one-quarter of the specimen test section was analyzed using the PC finite-element code COSMOS.* The number, location, and length of diffusion slots was considered under both uniaxial and biaxial load. The effect of the biaxial stress distribution in the central region of the test section was assessed for cases of 1, 2, 3, and 4 LDC slots of equal length. It was found that four, equal-length slots yielded a uniform stress distribution over most of the surface of the plate as is shown in Fig. 10.1, which is a plot of Von Mises stress for the case of uniform biaxial loading. Note that a unit load of 10 ksi was applied along each beam arm edge for these analyses. A flaw was next introduced into the model at the center of the plate to simulate the finite-length surface flaw in the test section. A 5-cm (2-in.) flaw was
COSMQSM, Finite Element Analysis System for the Macintosh. Structural Research and Analysis Corporation, Santa Monica. CA.
NUREG/CR-4219, Vol. 10, No. 2

Fracture ORNL-DWG 94-3694 ETD
Von Mises M 2.40E+04
2.20E+O4 2.00E4O4 1.80E+O4 1.60E+04 1.40E404 1.20E+O4 1.00E+04 8.00E+O3 6.00E4O3 4.00E+03 2.00E+O3 0.000000
• < t 8-10 ksi 10-12 ksi
Figure 10.1 Von Mises contour plots for biaxially (1:1) loaded cruciform plate with four equal-length diffusion slots in each load arm
used as being representative of the general flaw length that will be tested. It was observed for this case that there was an interaction between the stress field of the flaw and that of the innermost LDC slot. The adjacent areas of high stress at the flaw tip and the diffusion slot tip are shown in Fig. 10.2. There would then be a greater potential for the flaw to initiate at the surface due to the presence of the LDC slot. It should be noted that this phenomenon was intensified for cases using an odd number of diffusion slots because a slot tip was directly in line with and closest to the flaw. An alternate design was considered where the inner LDC slots parallel to the flaw plane were shortened by 0.5 cm (0.2 in.). The results for the equi-biaxial load case with no flaw shown in Fig. 10.3 demonstrate general retention of the uniform stress field in the center region of the test section. Introduction of the surface flaw does not lead to interaction of the flaw and LDC slot stress fields as
shown in Fig. 10.4. This configuration has then been established as the LDC slot design for the first series of tests.
The second element in developing the specimen design was to establish the finite-length flaw geometry to be used in this initial series of tests. Elastic analyses were performed using the Newman-Raju equations for a finite-width beam under a bending load.4 Several criteria were used to select the flaw sizes considered. First, the flaw was to be small enough to be considered a "shallow" flaw and would thus be in the range of 0.6 to 1.9 cm (0.25 to 0.75 in.) deep. Comparability with previous infinite-length shallow-flaw testing was desirable but not essential. Second, the flaw was to be large enough that fracture would be expected to occur before either plastic collapse of the beam or
NUREG/CR-4219, Vol. 10, No. 2 96

Fracture ORNL-DWG 94-3695 ETD
Von Mises 3.60E+04 3.30E+O4 3.00E4O4 2.70E+04 2 40E+04 2.10E+Oi 180E+G4 1.50E+O4 1.20E+04 0 00E+03 6 OOE+03 3.0OE+O3 0000000
• •
12-15 ksi 9-12 ksi
Figure 10.2 Von Mises contour plots for biaxially (1:1) loaded cruciform plate with four equal-length diffusion slots in each load arm and center 5.1-cm-long flaw
excedance of the load capacity of the ORNL biaxial test fixture. Third, the flaw geometry was to yield a Ki distribution that would not be a maximum at the deepest point, because the ultimate goal is to study the effect of cladding on the extension (initiation) of a finite-length, through-surface flaw. The K\ distribution is very sensitive to the flaw depth and aspect ratio. This is illustrated in Fig. 10.5, which shows the results for a family of flaws ranging from a semicircular flaw 1.27 in deep (2c = 1 in.) to a semi-elliptic flaw 1.27 cm deep by 5.08 cm long (2c = 2 in.). For interpreting failure behavior, the results for the angular range from the surface to -10° below the surface are not considered valid because of (1) the analytical representations that do not properly account for surface effects and (2) the enhanced toughness near the surface due to loss of constraint. The distribution of Ki around the flaw tip is also
important from the fatigue-sharpening standpoint. Referring again to Fig. 10.5, it can be seen that fatiguing might actually change the shape of the flaw tending toward some unspecified semiellipse where Kj is constant around the complete flaw tip. Unfortunately, this geometry (depth, aspect ratio) may not be the one that it was desired to test. A series of analyses was performed using different flaw sizes from which a semielliptic flaw 1.52 cm deep by 3.81 cm long (0.6 in. by 1.5 in.) was selected. These results are shown in Fig. 10.6. This flaw size will be treated as a reference flaw for future tests. Assuming a toughness in the range of 90 to 110 MPa Vm (80 to 100 ksi VmT), which is representative of A 533 in the lower transition region, the reference flaw satisfies the general criteria specified above. The preliminary test section design is shown in Fig. 10.7.
97 NUREG/CR-4219, Vol. 10, No. 2

Fracture ORNL-DWG 94-3696 ETD
Von Mises B 2.40E4O4
2.20E+O4 2.00E+O4 1.80E+O4 1.60E+O4 1.40E+O4 1.20E+04 1.00E+04 8.0OE+O3 6.00E+O3 4.00E4O3 2.00E+O3 0.000000
10-12 ksi
Figure 10.3 Von Mises contour plots for biaxially (1:1) loaded cruciform plate with four diffusion slots in each load arm; the inner diffusion slots are shorter by 0.5 cm
With the preliminary design developed, detailed fabrication drawings and a fabrication specification were prepared. HSST Plate 14 has been selected as the source material for these specimens. A cutting plan for Plate 14B, developed and approved by the Nuclear Regulatory Commission (NRC), will economically provide material for heat treatment and characterization, finite-length flaw clad cruciform specimens, and full-thickness clad cruciform specimens (proposed tests will be performed at NIST). Fabrication was initiated on six development specimens. These specimens will be used to develop test procedures and for investigation of the general behavior of this finite-length flaw under uniaxial and biaxial loading.
Due to the high loads that may occur in these tests and the desire to reuse the beam arms as many times as possible, special beam arms are being fabricated. The beam arms are being machined from HSST 9-in.-thick plate edge material, that is, material not normally used for test specimens. Elastic calculations of possible failure loads, particularly for . future finite-length flaw clad specimens, indicated that the beams arms could be deformed plastically. It was thus specified that the beam arm blanks receive special heat treatment to increase the yield strength. This heat treatment requires heating the blanks to a temperature of 1575°F± 25 °F, holding for 3 to 4 h, and water quenching in an agitated bath. During quenching, the cooling rate shall be
NUREG/CR-4219, Vol. 10, No. 2 98

Fracture ORNL-DWG 94-3697 ETD
Von Mises
3.60E+O4 3.30E+04 3.00E-fO4 2.70E+04 2.40E+O4 2.10E-KM 1.80E+O4 150E+W 120E-O4 9 00E+0~ 6.00E-4)3 3.00E+O3 0000000
• •
12-15 ksi 9-12 ksi Figure 10.4 Von Mises contour plots for biaxially (1:1) loaded cruciform plate with four diffusion slots in each load
arm and center 5.1-cm-long flaw; the inner diffusion slots are shorter by 0.5 cm
200°F/min or greater down to 600°F. The blanks are then tempered for 5 h at 950°F ± 25°F. This will result in a yield strength in the range of 110 to 130 ksi, which is high enough to provide elastic beam arm response over the range of probable test loads.
Material from Plate 14 was transmitted to Task H3 for use in developing the appropriate heat-treating procedures for the test sections. This heat treating should elevate the yield strength to simulate radiation damage. The target yield strength is 90 ksi. When the heat-treating procedures have been qualified, material for the six heat-treated specimens will be treated, and specimens will be machined.
Task H3 is also developing/selecting the cladding material and clad deposition process. When available, a minimum of six clad specimens will be fabricated, repeating material and test conditions. When the test specimen and fabrication procedures are fully qualified, a detailed matrix of test conditions and initial flaw geometries will be specified.
Conventionally, laboratory-scale specimens use fatigue precracking to sharpen the flaws with the intent of achieving reduced scatter in the data. For a finite-length flaw with a general aspect ratio, the fatigue crack growth will be nonuniform around the crack front, as was discussed earlier in selection of the reference flaw geometry. It is thus
99 NUREG/CR-4219, Vol. 10, No. 2

Fracture ORNL-DWG 94-3698 ETD
es o < Ex.
>
Z Ed E -z •"«
c« W as E -CA
30 40 50 60
ANGLE (Degrees)
Figure 10.5 Calculated SIF along flaw front as function of angle from surface for family of flaws ranging from semicircular (1.27-cm radius) to semielliptic (1.27 cm deep by 5.08 cm long) for beam in bending
ORNL-DWG 94-3699 ETD
• I
o u <
Z Ed H Z CA cw w K H
10 20 30 40 50 60
ANGLE (Degrees)
80 90
Figure 10.6 Calculated SIF along flaw front as function of angle from surface for family of flaws ranging from semicircular (1.52-cm radius) to semielliptic (1.52 cm deep by 3.81 cm long) for beam in bending
NUREG/CR-4219, Vol. 10, No. 2 100

Fracture ORNL-DWG 94-3700 ETD
„ I
SPECIMEN DETAIL
FLAW CROSS SECTION
Figure 10.7 Preliminary test section design details for laboratory-scale finite-length flaw specimens
anticipated that some shakedown testing will be required to develop procedures yielding the desired flaw geometries. It is not known if consistent flaw geometries of the desired aspect ratios can be achieved using conventional fatigue precracking. Also, because it is the intent to perform verification tests using mechanically loaded full-thickness beams and thermally shocked clad cylinder tests, it is required that the same flaw geometries and crack-tip conditions be maintained to ensure proper modeling of the results. For example, conventional fracture-toughness data
are generated using fatigue precracked compact tension (CT) specimens, while previous thermally shocked cylinder tests incorporated flaws prepared using the EB weld-hydrogen charge technique. These two concerns have led to investigation of alternate flawing techniques using a series of 36 1TCT specimens. Twelve specimens were prepared in each of three configurations: (1) conventional chevron-grooved CT, (2) ram electrodischarge machined (EDM) straight-through flaw with minimum achievable flaw-tip radius, and (3) straight-through flaw sharpened using the
101 NUREG/CR-4219, Vol. 10, No. 2

Fracture EB weld-hydrogen charge technique. The EDM flawing procedure with no fatigue precrackmg was considered because this represents a very simple, inexpensive, and highly controllable technique for flaw preparation. It is the intent that comparison of the results from these specimens will provide the final basis for the preferred flawing technique to be used in the matrix of finite-length flaw specimens.
Testing of 30 of the planned 36 ITCT flaw development specimens was completed during this reporting period. The results are reported under Task H3 and are shown here in Fig. 10.8. The specimens tested included all 12 of the chevron-grooved and fatigue-precracked specimens, all 12 of the straight-through EDM-notched specimens, and 6 of the EB weld-hydrogen charged specimens. The fatigue-precracked specimens gave very consistent results at both test temperatures. The EDM flaw (no fatigue precracking) appears not to be a viable option for these tests. This observation is somewhat at variance with the work of Wilshaw
et al., which indicated that there was a lower bound to crack-tip sharpness (-0.005 cm) below which indicated toughness would not change.5 However, the results are consistent with the recent work of Joyce and Link.^ The EB weld-hydrogen charged specimens gave inconsistent results such that use of an EDM flaw followed by fatigue precracking seems to be required. Three of the EB weld-hydrogen specimens resulted in pop-ins at low toughness values followed by failure at relatively high toughness values (compared to the results for the fatigue-precracked specimens). The remaining three EB weld-hydrogen specimens failed at toughness values less than the fatigue-precracked specimens tested at the same temperature. It is hypothesized that residual hydrogen at the crack tip may be the cause of the erratic behavior. The last six EB weld-hydrogen charged specimens are to be heat treated to remove excess hydrogen and will be tested under the same conditions as the previous six to evaluate this hypothesis and to determine if this provides a viable flawing alternative.
ORNL-DWG 94-3701 ETD
s et
a z ffl O o H Q H
P*
<
350 r^
300 t
250
200
150
100
50
0
•Master Curve Fatigue Pre-Cracked EDM Flawed Hydr-Chg Pop-in Hydr-Chg Pop-in/Fail Hydr-Chg Fail
i
_J L
20 40 -120 -100 -80 -60 -40 -20 0 TEMPERATURE (°C)
Figure 10.8 Comparison of fracture toughness measured using ITCT specimens with different flawing techniques
NUREG/CR-4219, Vol. 10, No. 2 102

Fracture
10.4 Material Requests Requests for material (A 533 B) are normally handled on a case-by-case basis. Other than ORNL usage, specifically cutup of Plate 14 for beam specimens and for characterization as discussed above, there have been no requests for material during this reporting period.
References
1. U.S. Nuclear Regulatory Commission, Regulatory Guide 1.154, "Format and Content of Plant-Specific Pressurized Thermal Shock Safety Analyses Reports for Pressurized Water Reactors."*
2. J. Keeney-Walker et al., Martin Marietta Energy Systems, Inc., Oak Ridge National Laboratory, "Finite-Length Surface Crack Propagation in Clad Cylinders," USNRC Report NUREG/CR-5915 (ORNL/TM-12166), November 1992.t
3. T. J. Theiss et al., Martin Marietta Energy Systems, Inc., Oak Ridge National Laboratory, "Initial Results of the Influence of Biaxial Loading on Fracture Toughness," USNRC Report NUREG/CR-6036 (ORNL/TM-12349), June 1993.t
4. J. C. Newman, Jr., and I. S. Raju, "Analysis of Surface Cracks in Finite Plates Under Tension or Bending Loads," NASA Technical Paper 1578, National Aeronautics and Space Administration, Scientific and Technical Branch, December 1979.
5. T. R. Wilshaw et al., "A General Model to Predict the Elastic-Plastic Stress Distribution and Fracture Strength of Notched Bars in Plane Strain Bending," Eng. Fract. Mech., 1, 191-211 (1968).*
6. J. A. Joyce and R. E. Link, "The Effect of Electric Discharge Machined Notches on the Fracture Toughness of Several Structural Alloys," USNRC Report NUREG/CR-5981 (CDNSWC/SSM-61-93/01), September I993.1"
Copies are available from U.S. Government Printing Office, Washington, D.C. 204CG. ATTN: Regulatory Guide Account.
'Available for purchase from the National Technical Information Service, Springfield, VA 22161.
••"Available in public technical libraries.
103 NUREG/CR-4219, Vol. 10, No. 2


11 Warm Prestressing
No activity in the current reporting period.
105 NUREG/CR-4219, Vol. 10, No. 2


12 Biaxial Loading Effects on Fracture Toughness
T. J. Theiss £
This task focuses on investigating the influence of biaxial loading on the shallow-crack, fracture-toughness of reactor pressure vessel (RPV) material. The task was begun in FY 1993 and includes all costs in direct support of the biaxial testing program. Previously, the components of the biaxial testing program were included in Tasks 2,6, and 10. During this report period, the development phase of the testing program was completed. The development phase was successful because a system of producing biaxially loaded or uniaxially loaded fracture toughness data was developed in which the only variable is the loading condition. Results from the development phase of the biaxial program are being reported at this t ime 1 - 3 and are summarized here.
12.1 Development-Phase Test Matrix
The development-phase test matrix for the biaxial testing program consisted of five cruciform specimens. These "development" specimens were used to evaluate the performance of the test specimen and test fixture and to develop and verify test procedures. In addition, these tests served to develop and refine a test specimen geometry suitable for the generation of biaxial fracture-toughness data. These tests also provide a limited set of test data that will indicate whether a significant effect of out-of-plane loading on shallow-Saw fracture toughness exists. Based on these test results, additional tests are defined in Sect. 12.6.
To provide a baseline for assessment of any potential effects of biaxial loading on shallow-flaw fracture toughness, the test conditions for these crucifonn specimens were selected to compare with previous Heavy-Section Steel Technology (HSST) shallow-crack data generated under uniaxial conditions.4 One set of uniaxial shallow-crack tests was conducted at T - RTNDT of-10°C (-18°F), which is in the transition region of the deep-crack toughness curve for A 533 B [RTN DT of-35°C (-3I°F) for this material].4 The test temperature for the cruciform specimens was -45°C (-49°F), that is, a normalized test temperature (T- RTKDT) of-10°C (-18°F). The cruciform specimens were 91 mm (3.6 in.) deep with a crack depth of 10 mm (0.4 in.), yielding an a/W ratio approximately the same as that for the HSST shallow-crack beams. Three specimen configurations shown in Fig. I2.l(b-d) were tested. To ensure that initiation did not occur at the crack-slot intersection of configuration (d), each corner of the crack was blunted with a slitting saw. The test matrix is shown in Table 12.1. Four of the cruciform specimens were
W. J. McAfee
tested with a transverse-to-longitudinal load ratio of 0.6:1; one was tested under uniaxial loading. The uniaxially loaded cruciform specimen allowed comparison with previous uniaxial shallow-crack specimens4 under identical test conditions (crack depth, temperature, etc.).
To monitor and control test conditions and to collect data from which toughness could be determined, each specimen was instrumented with strain gages, potentiometers, clip gages, and thermocouples. Strain gages were installed at various locations on the arms and test section of the specimens. A detailed discussion of these gages, their use, and results is provided in Sect. 10.3. The gage results indicated that the desired load was applied uniformly to the test section. Additional details can be found in Ref. 3.
The basic temperature control system was essentially the same as that used for the previously tested shallow-crack specimens. Use of surface temperature measurements to estimate crack-tip temperature was verified by measurements on a test block using both surface and embedded thermocouples in conjunction with one-dimensional heat transfer analysis.
Four clip gages, mounted directly on the mouth of the crack, provided crack-mouth-opening displacement (CMOD) data. The gages were located at the specimen centerline, 19 mm (0.75 in.) norm and south of the center-line, and 38 mm (1.5 in.) south of the centerline. Typical load vs CMOD response for each clip gage is illustrated in Fig. 12.2. For each test, general agreement between the "north, south, and middle" clip gages was found, indicating symmetric loading of the specimen and a relatively constant CMOD profile across the central 40 mm (1.5 in.) of the crack. The "far south" CMOD is 25% less than the middle CMOD as expected, based on pretest analysis. Future references to CMOD refer to the middle CMOD.
Potentiometers were used to measure the displacement of the arms relative to the test section, that is, load-line displacement (LLD), for each test. The LID was taken as the average of the displacements of the two longitudinal arms (i.e., the east and west arms). The north and south potentiometers record the deflection of the arms parallel to the crack plane. In all cases, close agreement was indicated between the east vs west arms and the north vs south arms, revealing symmetric loading as illustrated in Fig. 12.3. The
NUREG/CR-4219, Vol. 10, No. 2

Biaxial ORNL-DWQ 93-2729 ETD
Test Section
Shallow Through-Crack
(a)
Outer Slot
Center Slot
Outer Slot
ft ft i <
- ***** J-=> 8 9 mm--**-) *-*«•-
| (b) 1 •
5 1 mm-
(c) nn 8 9 mm r £L
h*- 5.1 mm • I-*-
(d)
Figure 12.1 Slot configurations used in analyses of cruciform bend specimen: (a) uniform slots on test section boundary, (£») outer slots extended inward by 8.9 mm (0.35 in.) across test section boundary, (c) center slot contracted away by 5.1 mm (0.2 in.) from test section boundary, and (d) a superposition of configurations (b) and (c)
Table 12.1 Test matrix for development phase of biaxial testing program
Specimen No. Load ratio Test section configuration
BB-1 0.6:1 b BB-2 0:1 c BB-3 0.6:1 c BB-4 0.6:1 d BB-5 0.6:1 d
potentiometers require some travel to seat and record displacements properly. Initial nonlinearity in the readings was eliminated, and the data were adjusted such that the initial potentiometer readings project back to zero displacement at zero load.
12.2 Experimental Results and Data Reduction Procedures
12.2.1 Initiation Site Location One criterion for a satisfactory biaxial specimen design is that the crack-driving forces be relatively constant along the crack tip with no significant edge effects. The primary concern is the stress concentration at the intersection of the crack and the two central load-diffusion control (LDC) slots. The specimen should generate data in which the initiation is not influenced by the intersection of the crack and the LDC slots. Analytical results indicated a reduction in Kj c at the comer location for the specimen configurations shown in Fig. 12.1(Z>, c, and d). The fractographically determined initiation location for each specimen tested is listed in Table 12.2. Specimen configuration (c) produced an acceptable result under uniaxial loading (BB-2) but not under biaxial loading (BB-3). For BB-3, initiation occurred directly in the corner of the crack and slot. It is not known
NUREG/CR-4219, Vol. 10, No. 2 108

Biaxial ORNL-DWG 93-2737 ETD
800 -T—t—T—1—I—I- -T—T—I— I I I T T * T - • ^ - " l - ^ - T "
0.1 0.2 0.3 0.4 CMOD (mm)
Figure 12.2 Load vs CMOD response for all four clip gages for specimen BB-5
ORNL-DWG 93-2738 ETD
800
2 3 4 Potentiometer Reading (mm)
Figure 12.3 Load vs potentiometer response for all four potentiometers on specimen BB-5
if biaxial loading was responsible for shifting the initiation location to the corner. To ensure that crack initiation would occur away from the corner of the crack and slot, specimen configuration (d) was developed and tested as specimens
BB-4 and BB-5. Both specimens were tested under biaxial loading, and initiation occurred well away from the corner. Configuration (d) has been judged satisfactory for the generation of uniaxial and biaxial fracture-toughness data.
109 NUREG/CR-4219, Vol. 10, No. 2

Biaxial Table 12.2 Location of initiation sites for
cruciform specimens
Specimen Load Initiation Result No. ratio location
BB-1 0.6:1 2.5 mm from south edge
Acceptable
BB-2 0:1 20 mm from north edge
Acceptable
BB-3 0.6:1 North comer Not acceptable0
BB-4 0.6:1 18 mm from north edge
Acceptable
BB-5 0.6:1 50 mm from south edge
Acceptable
a D u e to initiation in the corner.
12.2.2 Load vs Deflection Behavior
The load (P) vs LLD and the P vs CMOD curves for each beam are shown in Figs. 12.4 and 12.5, respectively. The conditions of each specimen at failure, test temperature, and specimen geometry are tabulated in Table 12.3. Also included in Table 12.3 are the plastic components of area under each P vs LLD curve (defined as Upi) and P vs CMOD curve (defined as Apj). Table 12.3 also lists the estimated toughness values for the tests with the parameters used to estimate the toughness, as discussed later. The load indicated in Figs. 12.4 and 12.5 or Table 12.3 refers to the
total load (as measured by the load cell) divided by 1.6 for the biaxial tests. The results indicated in Figs. 12.4 and 12.5 and Table 12.3 reveal consistent, repeatable mechanical responses for the five tests.
The critical load for each specimen was similar, but the uniaxial test (BB-2) sustained substantially more (60%) deflection (LLD or CMOD) than the biaxial tests (BB-1, -4, and -5). In addition, the plastic "work" at the crack tip, as defined by either U pi or Ap\ in the three biaxial tests, was about one-third that of the corresponding uniaxial value. These results indicate a pronounced reduction in the ductility of the material (as measured by critical displacement or plastic work) due to biaxial loading. The critical displacements and plastic work performed were consistent for the three interpretable biaxial test results.
The initial compliance (P vs CMOD) data for the five tests are shown in Fig. 12.5. These results show that specimens BB-2 and -3, configuration (c), are stiffer than the other three specimens, which would be expected due to the shorter outboard slots in these specimens. Figure 12.5 also indicates that specimen BB-3 is somewhat stiffer than BB-2 once yielding begins at the crack tip, which is consistent with pretest analysis of the P vs CMOD curves at various load ratios. Note, however, that no influence of biaxial loading was evident in the linear-elastic portion of either the P vs LLD response or P vs CMOD response.
ORNL-DWG 93-2739 ETD 1000
800 -
600 -
400 -
200
4 6
LLD (mm)
Figure 12.4 Load vs LLD response for all five specimens
10
NUREG/CR-4219, Vol. 10, No. 2 110

Biaxial ORNL-DWG 93-2740 ETD
1000
800
600
400 -
200
0.4 0.6 CMOD (mm)
Figure 12.5 Load vs CMOD response for ail five specimens
For a successful cruciform specimen design, the specimen must yield uniaxial results that are similar to those from previous shallow-crack beam testing.4 Comparison of measured responses in BB-2 (uniaxial) and shallow-crack beams indicates consistent load vs CMOD behavior. As expected, the cruciform specimen is stiffer than the shallow-crack beams due to the addition of the transverse arms.
12.2.3 Toughness Estimation Techniques
Because the cruciform specimen differs from standard American Society of Testing and Materials (ASTM) testing specimens, reduction of the experimental data to determine fracture toughness requires finite-element analysis of the specimen geometry and comparison with the experimental data. For these tests, fracture toughness was estimated in terms of the critical J-integral and then converted into an elastic-plastic stress-intensity factor (SIF), Kj c. Two techniques have been developed to estimate the toughness from these specimens; both methods are based on the "work" at the crack tip as measured by the area under the load vs deflection (either LLD or CMOD) curves. The methods require an rj-factor, which relates work at the crack tip to initiation toughness, determined from finite-element analysis; it is used with the test results to estimate toughness. The r|-factor technique is advantageous because a different finite-element analysis is not required for each specimen with a slightly different geometry. Specimens with small variations in crack depth or beam thickness can use the
same -p-factor, and the toughness values will reflect the differences in geometry. By using the work at the crack tip, both critical load and critical displacement are considered in estimating toughness.
The first method of estimating J is similar to the technique in ASTM E813 because the P vs LLD test record is used as input for the toughness estimate. This technique has been used satisfactorily on previous HSST shallow-crack cleavage fracture data.4 The J-integral is divided into elastic and plastic terms given by
J = Jel + IplUpl
Bb
where Upi is the plastic component of the area under the P vs LLD curve, B is specimen thickness, b is the remaining ligament (W-a), and T^J is the dimensionless constant relating the area term (Upif to Jpi. Finite-element analyses were used to provide values of r\ j as a function of Upi for each loading and specimen configuration and to determine the relationship between J ei and P because the standard ASTM equations are inappropriate for the cruciform geometry. The measured and computed quantities (LLD, CMOD, J) vary from the centerline to the edge of the test section. Centerline quantities are used in the analysis to determine the ri-factor and the load vs Jei relationship. The variations of r^j as a function of Upi for tests BB-2 (uniaxial loading) and tests BB-4 and -5 (0.6:1 biaxial
111 NUREG/CR-4219, Vol. 10, No. 2

Biaxial Table 12.3 Summary of results of the development phase of the biaxial
testing program
Average SENB BB-1 BB-2 BB-3 BB-4 BB-5 data (for
comparison)
Load ratio 0.6:1 0:1 0.6:1 0.6:1 0.6:1 Geometry
B, mm 102 11 112 111 111 101 W, mm 91 91 91 91 91 102 a, mm 11.1 10.6 8.8 10.1 10.0 10.7
Temperature, °C ^ 5 -4\ -47 ^ 6 -44 -23 Failure conditions b
P.kN 784 784 818 751 763 LLD, mm 4.20 8.51 5.10 5.08 4.06 CMOD,mm 0.47 0.82 0.47 0.51 0.65 Upi, kN-mm 958 4,110 1,523 1,501 1163 Api, kN-mm 168 455 181 206 329
•n-factors b
<l 0.195 0.117 0.189 0.190 1.15
Fracture toughness 3.53 2.76 3.55 3.61
Fracture toughness b Elastic component
Jel, kN/m 66.7 67.4 72.6 61.2 67 Ki, MPaVm 120 120 125 115 122
P vs CMOD Jpl kN/m 73.3 141 71.8 82.8 125 Total J, kN/m 140 209 144 144 192 Kjc, MPaVm 175 214 178 178 206
PvsLLD Jpl 23. 1 54.1 32.1 31 .7 145 Total J 89.7 122 105 92.9 212 K j c
140 163 151 143 216 aRTNDT f° r this material is -15°C, so T - RTjvjrjr f° r t h e s e t a s t s & the same. ''Not reported due to initiation in the corner.
loading) are shown in Figs. 12.6 and 12.7, respectively. Analysis of specimen BB-1 was not performed, but the measured response of this specimen is consistent with the measured response of BB-4 and -5. Thus, Fig. 12.7 was used to determine the values of T\pl for BB-1 as well. The TT t values used to estimate J in each test were determined from the critical (i.e., corresponding to initiation) value of Upi linearly interpolated from finite-element calculations. The Upi value from the load vs LLD curve and the corresponding value of t| j for each test are included in Table 12.3.
The second technique used to determine the critical J-integral is similar to the first but uses the load vs CMOD test record. This technique, first proposed by Kirk and Dodds,5 uses the area under the load vs CMOD curve
rather than the plastic component of CMOD to calculate J. As with the first technique, J is divided into two components. Finite-element analyses were used to determine the load vs Kj relationship and the variation of T|pj as a function of the plastic component of area under the load vs CMOD curve (i.e., Api). The variations of r\% as a function of Api for the uniaxial specimen (BB-2) and the 0.6:1 biaxial specimens (BB-4, -5, and -1) are shown in Figs. 12.8 and 12.9, respectively. The values of r\i^ for each test are listed in Table 12.3 and were interpolated from the finite-element calculations for the critical values of Api.
Both of the above methods for estimating toughness have advantages and disadvantages. These are discussed fully in Ref. 4. It was concluded for this application that the
NUREG/CR-4219, Vol. 10, No. 2 112

Biaxial
0.25 ORNL-DWG 93-2769 ETD
0.15
0.05
0 . . i . . . i . . . i . . . i . . . i . . .
0 2000 4000 6000 8000 1.000104 1.200 104 1.400104
U , (kN-mm)
Figure 12.6 Variation of r^j with U p] for specimen BB-2
0.25 I i i i i (
0.15
0.05
ORNL-DWG 932771 ETD i i
0 1000 2000 3000 4000 5000 6000 7000 8000 U p | (kN-mm)
Figure 12.7 Variation of T\L with Upj for specimens BB-4, -5, and -1
CMOD-based T|-factor is considered to be the more reliable method of estimating toughness.
Note that Table 12.3 reveals substantial differences (30 to 60%) between the uniaxial and average biaxial values of
T| j and Tta. These results cannot be used to quantify the influence or biaxial loading on Tj-factors because the specimen configuration was modified between the uniaxial and biaxial tests. Pretest analysis of the different specimen configurations indicated only a 10% increase in T& and tipj for 0.6:1 biaxial loading compared to the uniaxial
113 NUREG/CR-4219, Vol. 10, No. 2

Biaxial ORNL-DWG 93-2770 ETO
3.5
3
2.5
Tl 2 1 Pi
1.5
0.5
l_*J—•——!—•—h—*H •
T < i . . . . i . . . . i . . . . i . . . . t • — • — • _ . i — i — i — • — i —
100 200 300
Ap, <*N-'
400 500 600 700
Figure 12.8 Variation of T ^ with Api for specimen BB-2
ORNL-DWG 9*2772 ETC)
4
3.5
3
2.5
2
1.5
1
0.5
n
4
3.5
3
2.5
2
1.5
1
0.5
n
i /Kii 4
3.5
3
2.5
2
1.5
1
0.5
n
y 1 I 1 1 Pi
4
3.5
3
2.5
2
1.5
1
0.5
n
7l I ; 1 Pi
4
3.5
3
2.5
2
1.5
1
0.5
n
i f I I I ! I l l ;
4
3.5
3
2.5
2
1.5
1
0.5
n
\"t | | | I | I | ;
4
3.5
3
2.5
2
1.5
1
0.5
n
• 1 ! ! ! ! 1 ! :
4
3.5
3
2.5
2
1.5
1
0.5
n •
0 50 100 150 200 250 300 350 400
Ap | (kN-mm)
Figure 12.9 Variation of n^ with Api for specimen BB-4, -5, and -1
values. Differences in specimen configuration then caused greater variations in the values of n?j and vL^ than did load ratio. Thus, the .-factors used tor evaluation of these data are not considered to be applicable to other geometries.
12.2.4 Comparison of Test and Analysis Results
Posttest 3-D elastic-plastic, finite-element analyses were performed on tests of three development beams (BB-2, -4,
NUREG/CR-4219, Vol. 10, No. 2 114

Biaxial and -5). Material properties used in these analyses are shown in Fig. 12.10 and described in Ref. 3. The 3-D finite-element model of a one-fourth section of the cruciform specimen used in these analyses, which is shown in Fig. 12.11 (a), has more than double the mesh refinement of the pretest model. An additional feature of the posttest model was that the full geometry of the LDC slots was represented. In addition, the crack-tip region of the model incorporated collapsed-prism elements to permit blunting of the crack tip [see Fig. 12.11(c)]. Boundary constraints and arm loads were applied to the model of Fig. 12.11 in the same manner as the pretest model and are described in Ref. 3.
Analysis results for tests BB-4 and -5 are given in Figs. 12.15-12.17. Only one analysis was performed because geometry and test conditions were the same for both tests. Excellent agreement is indicated in Figs. 12.15 and 12.16 between the computed and measured load vs deflection curves for both LLD and CMOD response data. From Fig. 12.17, the distribution of applied KT VS distance from midplane of the crack exhibits a substantial gradient outside the midsection of the crack due to the shielding effect of the outboard slot configuration used in tests BB-4 and -5 (see Fig. 12.1). Although the configuration of specimen BB-1 was not specifically analyzed, the comparison of the measured response with the analysis of BB-4 and -5 is also excellent.
A comparison of calculated and experimental results for test BB-2 (uniaxially loaded specimen) is shown in Figs. 12.12 and 12.13. Excellent agreement is exhibited between the computed and measured load vs deflection curves (Fig. 12.12). Also, the calculated CMOD response is well within the scatter band of load vs CMOD data for uniaxially and biaxially loaded specimens tested in this series (Fig. 12.13). The measured load vs CMOD response is more difficult to model analytically than the load vs LLD response for shallow-flaw specimens because the CMOD data are measured much closer to the crack tip than are the LLD data. The distribution of applied, KT vs distance from midplane of the crack, with applied longitudinal load as a parameter, is shown in Fig. 12.14. The Kj distribution remains relatively flat along most of the crack front for the slot configuration of Fig. 12.1(c).
12.3 Interpretation of Results
12.3.1 Fracture-Toughness Results
Toughness data for the biaxial and uniaxial cruciform specimen were calculated using the techniques in Sect 12.2.3. The critical J-integral values were converted to critical elastic-plastic SIFs, Kj c, using the plane strain formulation. The resulting toughness values are tabulated in Table 12.3. The P vs CMOD technique is considered more sensitive for shallow-flaw specimens and is the primary method for determining the toughness of the cruciform data. The single-edge-notch bend (SENB) data4 were determined witii T|-factors based on the P vs LLD
ORNL-DWG 93-2774 ETD 700
0.02 0.04 0.06 0.08
Strain
Figure 12.10 Pretest and posttest material properties
115 NUREG/CR-4219, Vol. 10, No. 2

Biaxial ORNL-DWG 93-2775 ETD
(C)
Figure 12.11 (a)-(c) Posttest 3-D finite-element model of cruciform specimen
NUREG/CR-4219, Vol. 10, No. 2 116

Biaxial ORNL-DWS 93-2776 ETD
1000
800 -
600
400
200
1 • — 1 j 1 1 1 • j 1 1 1 1 1 I 1 1 • • •
\ BB-2
! 1 ! I I : | / £ ^ \ ! EEA '
i i f | | : : / I | | I :
4 6 LLD (mm)
10
Figure 12.12 Comparison of measured load vs LLD response for specimen BB-2 with computed response
1000
800
600
400
200 -
ORNL-DWG 93-2777 ETD i i i
0.4 0.6
CMOD (mm)
0.8
Figure 12.13 Comparison of measured load vs CMOD response for specimen BB-2 with computed response
experimental results. For comparison, the SENB da ta 4
were recalculated using the P vs CMOD method with T|-factors determined as described in Ref. 5. P vs CMOD and P vs LLD yielded comparable toughness results for the SENB data.
Examination of Table 12.3 reveals that K j c between the uniaxial and average biaxial results is reduced -20%. The values of A p j and U p i as a function of load ratio, however, are reduced ~60 to 70%. The elastic component of toughness comprises -74 to 83% of the total toughness for the
117 NUREG/CR-4219, Vol. 10, No. 2

Biaxial ORNL-DWG 93-2778 ETD
1 ' I ' ' 250
200 -
150
* 100
50
- 1 0 0 10 2 0 3 0 4 0 5 0 6 0 7 0 8 0
Distance from Specimen Center (mm)
Figure 12.14 Computed variation of Kj along crack front for specimen BB-2
1000
800
600
400
200
ORNL-DWG 93-2779 ETD
Figure 12.15 Comparison of measured load vs LLD response for specimens BB-4, -5, and -1 with computed response
uniaxial and biaxial specimens, respectively. The elastic component of toughness does not vary as a function of load ratio, and because these tests were conducted at temperatures within the lower transition region, the influence of
biaxial loads would be expected to be relatively small. At higher temperature, the plastic contribution of toughness would be greater; thus, the influence of biaxial loading on toughness should be more pronounced.
NUREG/CR-4219, Vol. 10, No. 2 118
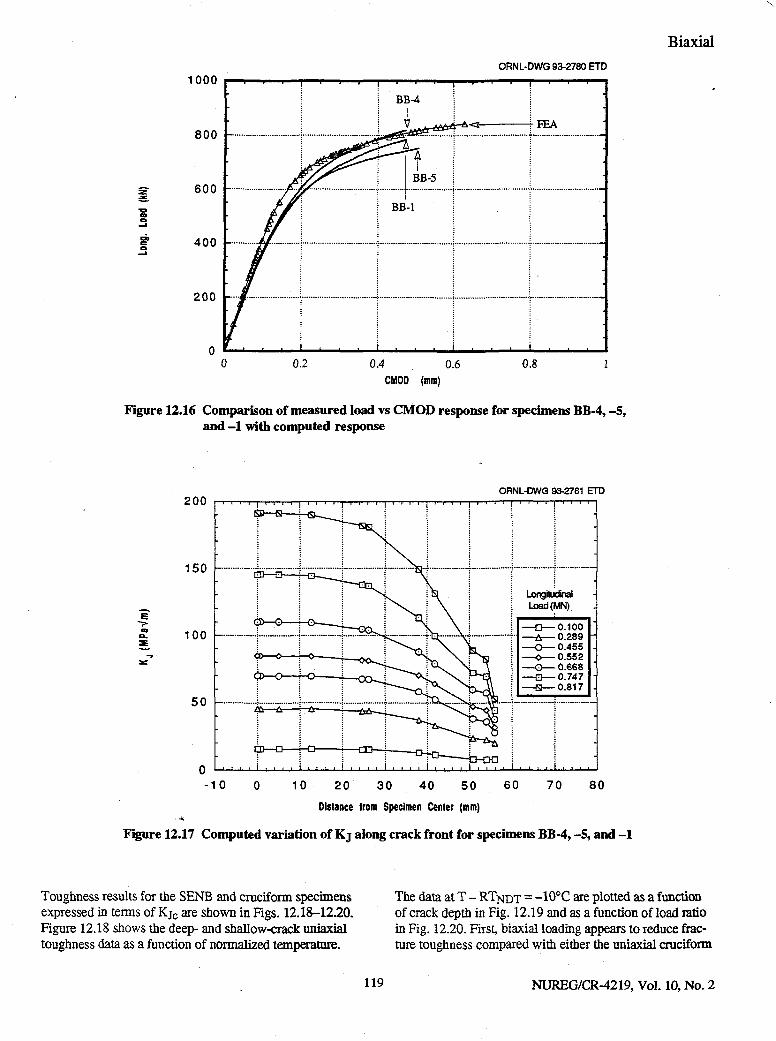
Biaxial
1000
800 -
600 -
400 -
200 -
ORNL-DWG 93-2780 ETD
0.4 0.6 CMOD (mm)
0.8
Figure 12.16 Comparison of measured load vs CMOD response for specimens BB-4, - 5 , and - 1 with computed response
E
0 10 20 30 40 50 60 70 80 Distance Horn Specimen Center (mm)
Figure 12.17 Computed variation of Kj along crack front for specimens BB-4, - 5 , and - 1
Toughness results for the SENB and cruciform specimens expressed in terms of K j c are shown in Figs. 12.18-1220. Figure 12.18 shows the deep- and shallow-crack uniaxial toughness data as a function of normalized temperature.
The data at T - R T N D T = -10°C are plotted as a function of crack depth in Fig. 12.19 and as a function of load ratio in Fig. 12.20. First, biaxial loading appears to reduce fracture toughness compared with either the uniaxial cruciform
119 NUREG/CR-4219, Vol. 10, No. 2

Biaxial ORNL-DWG 93-2782 ETD
100 T - R T N D T (C)
"Figure 12.18 Biaxial and uniaxial shallow-crack toughness data as function of normalized temperature
ORNL-DWG 93-2783 ETD
250
200
150
* 100
50
p • • r •
:iform (3) -•ag1* :iform (3) -
| ! < to
* denotes SE .NB specimer is D
A
\
O
I • : .
10 20 30 40 Crack Depth (mm)
50 60
Figure 12.19 Uniaxial and biaxial toughness data as function of crack depth at T - RTNDT = -10°C
(test BB-2) or the SENB data. The average biaxial toughness is -20% less than the uniaxial cruciform value and -18% less than the average of the uniaxial SENB and cruciform results. Second, the uniaxial cruciform value is con
sistent with the SENB toughness results; this demonstrates that the cruciform specimen yields valid toughness results. Third, as shown in Fig. 12.19 , the biaxially loaded cruciform specimens appear to yield results with reduced scatter
NUREG/CR-4219, Vol. 10, No. 2 120
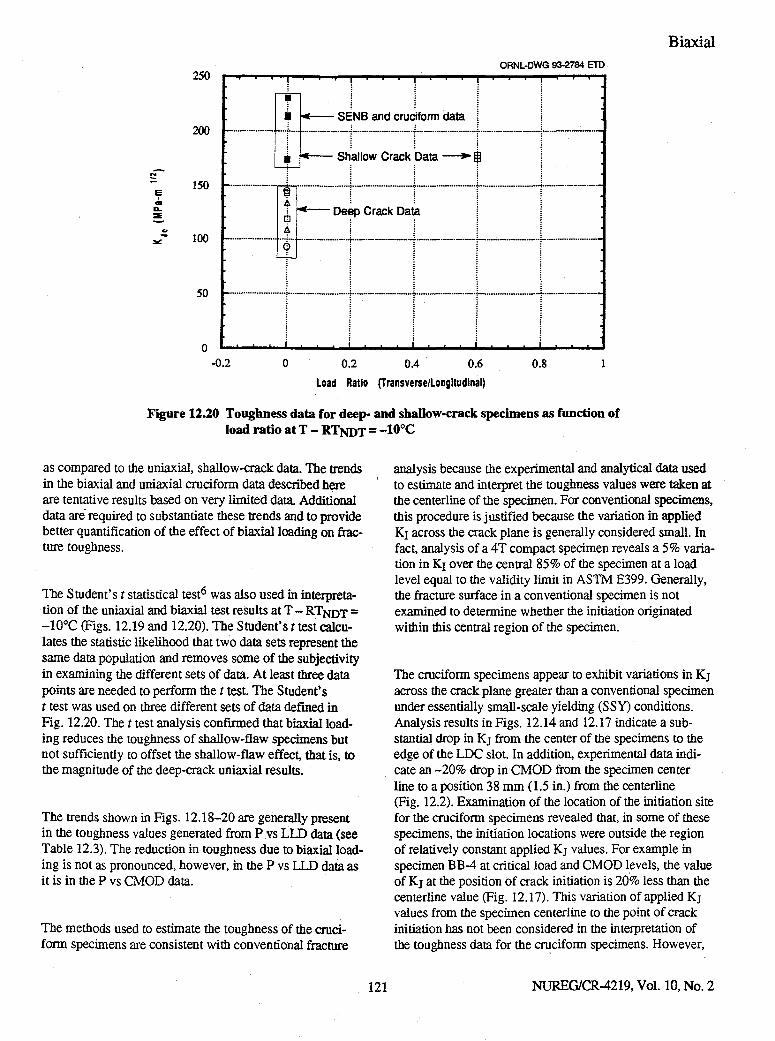
250
200
150
100
50
-0.2
Biaxial
- I T — i - i i i i i ORNL-DWG 93-2784 ETD
i i I ' ' i
SENB and cruciform data
Shallow Crack Data — * - |
Deep Crack Data
_L _L 0.2 0.4 0.6
Load Ratio (Transverse/Longitudinal) 0.8
Figure 12.20 Toughness data for deep- and shallow-crack specimens as function of load ratio at T - RTNDT = -1<>0C
as compared to the uniaxial, shallow-crack data. The trends in the biaxial and uniaxial cruciform data described here are tentative results based on very limited data. Additional data are required to substantiate these trends and to provide better quantification of the effect of biaxial loading on fracture toughness.
The Student's t statistical test6 was also used in interpretation of the uniaxial and biaxial test results at T - RTNJJT = -10°C (Figs. 12.19 and 12.20). The Student's t test calculates the statistic likelihood that two data sets represent the same data population and removes some of the subjectivity in examining the different sets of data. At least three data points are needed to perform the t test. The Student's t test was used on three different sets of data defined in Fig. 12.20. The t test analysis confirmed that biaxial loading reduces the toughness of shallow-flaw specimens but not sufficiently to offset the shallow-flaw effect, that is, to the magnitude of the deep-crack uniaxial results.
The trends shown in Figs. 12.18-20 are generally present in the toughness values generated from P vs LLD data (see Table 12.3). The reduction in toughness due to biaxial loading is not as pronounced, however, in the P vs LLD data as it is in the P vs CMOD data.
The methods used to estimate the toughness of the cruciform specimens are consistent with conventional fracture
analysis because the experimental and analytical data used to estimate and interpret the toughness values were taken at the centerline of the specimen. For conventional specimens, this procedure is justified because the variation in applied Kj across the crack plane is generally considered small. In fact, analysis of a 4T compact specimen reveals a 5% variation in Kj over the central 85% of the specimen at a load level equal to the validity limit in ASTM E399. Generally, the fracture surface in a conventional specimen is not examined to determine whether the initiation originated within this central region of the specimen.
The cruciform specimens appear to exhibit variations in Kj across the crack plane greater than a conventional specimen under essentially small-scale yielding (SSY) conditions. Analysis results in Figs. 12.14 and 12.17 indicate a substantial drop in Kj from the center of the specimens to the edge of the LDC slot. In addition, experimental data indicate an -20% drop in CMOD from the specimen center line to a position 38 mm (1.5 in.) from the centerline (Fig. 12.2). Examination of the location of the initiation site for the cruciform specimens revealed that, in some of these specimens, the initiation locations were outside the region of relatively constant applied Kj values. For example in specimen BB-4 at critical load and CMOD levels, the value of Kj at the position of crack initiation is 20% less than the centerline value (Fig. 12.17). This variation of applied Kj values from the specimen centerline to the point of crack initiation has not been considered in the interpretation of the toughness data for the cruciform specimens. However,
121 NUREG/CR-4219, Vol. 10, No. 2

Biaxial the impact of considering the initiation location in toughness determinations is being assessed for both the cruciform and more conventional fracture specimens and could lead to modifications of these interim conclusions.
12.3.2 Evaluation of Test Specimen and Fixture
At least three of these tests will be conducted under equibi-axial (1:1) loading conditions with all other conditions identical to the previous tests. The purpose of these tests will be to determine which biaxial load ratio (i.e., 0.6:1 or 1:1) has a greater influence on fracture toughness. The results will provide guidance in subsequent planned verification testing.
One of the primary goals of this initial phase of the biaxial testing program was to develop a suitable test specimen for generating biaxial fracture-toughness data. Several functional requirements and criteria for the biaxial specimen were detailed in Refs. 2 and 3. The final cruciform design [configuration (d), in Fig. 12.1] does reproduce the essential features of pressurized-thermal-shock (PTS) loading. The cruciform specimen can be tested either uniaxially or biaxially, allowing the influence of biaxial loading on fracture toughness to be determined by changing only one variable. Both material requirements and specimen cost have been reduced to a level to allow the testing of a statistically meaningful number of specimens. The final specimen design [Fig. 12.1, configuration (d)] has been successfully validated, and no alterations to the specimen design are anticipated for future testing. The biaxial testing system (i.e., specimen and fixture) is capable of generating consistent, reproducible toughness results that can be interpreted to determine the influence of out-of-plane stress on the shallow-crack fracture toughness of RPV material.
12.4 Future Testing
Based on these limited data, sufficient evidence of an influence of biaxial loading on fracture toughness exists to justify additional testing. Testing of an additional three or four specimens using remaining HSST-CE material is planned.
The verification series of tests will incorporate conditions more prototypical of RPV material at end of life. The A 533 B material used will undergo a special heat treatment designed to increase the yield strength and reference nil-ductility transition temperature (RTNOT) t 0 a l e v e * approximating that of a radiation-embrittled RPV. Tests will be conducted in batches of three specimens tested under nominally identical conditions. A tentative test matrix is shown in Table 12.4. Initially, uniaxial and biaxial cruciform specimens will be tested at the same normalized test temperature (T - RTNDT) as was used in the development phase of the program. A sufficient number of specimens will be tested under uniaxial loading conditions to better compare uniaxial cruciform results with previous SENB test results. Tests will then be conducted at different temperatures within the transition region to determine the temperature shift associated wkh the reduction of shallow-crack toughness data due to biaxial loading. One batch of specimens will be tested on the lower shelf to investigate the assumption that biaxial loading has no effect on fracture toughness under essentially SSY or linear-elastic conditions.
Several additional specimens will be tested at a single temperature within the transition region in an attempt to quantify the scatter band of the biaxial toughness data. The development-phase tests suggest that biaxial loading may reduce the scatter, as well as the mean value, of the
Table 12.4 Summary of verification phase of biaxial testing
Temperature T - R T N D T
(°C)
Loading configuration
Number of batches" Purpose
Uniaxial 2 Compare SENB and cruciform results Biaxial^ 2 Quantify biaxial effect
Investigate influence on scatter band Biaxial 1 Study biaxial loading under SSY conditions Biaxial 1 Quantify biaxial temperature shift Biaxial 1 Investigate tearing behavior under biaxial loading ? 1-2 As needed, based on previous testing
"Three identical specimens constitute one batch; eight to nine batches require 24 to 27 specimens. biaxial load ratio will be 0.6:1 or 1:1, whichever is the more severe ratio. Three 1:1 biaxial tests will precede the
verification-phase tests and will use specimens simitar to those in the development phase.
-10 -10
-100 -+10
10
NUREG/CR-4219, Vol. 10, No. 2 122

Biaxial toughness data. Because PTS analyses use probabilistic fracture mechanics assessments to determine the likelihood of vessel failure, a reduction in the scatter of the toughness data could greatly impact results of these assessments.
An additional variable for investigation is the temperature at which the failure mode becomes primarily ductile tearing rather than cleavage. A comparison of this mode-transfer temperature with uniaxial data could provide additional insight into the basic failure mechanisms that govern transition temperature toughness data.
Once the verification series of tests has been completed, a limited number of large-scale cruciform specimens will be tested. These large-scale specimens will be -200 mm (7.9 in.) deep to more closely match the constraint conditions in an RPV. A more detailed test matrix will be developed after the verification-phase results become available.
References
1. B. R. Bass et al., "Determination of Out-of-Plane Biaxial Stress Effects on Fracture Toughness for Shallow Surface Cracks in Reactor Pressure Vessel Steels," Proceedings ofASME Pressure Vessel and Piping Conference, Denver, Colorado, July 1993, ASME, 1993.*
2. T. J. Theiss et al., "Preliminary Results from Biaxial Shallow-Flaw Fracture Toughness Tests on Reactor
Pressure Vessel Steel," Proceedings ofASME Pressure Vessel and Piping Conference, Denver, Colorado, July-1993, ASME, 1993.*
3. T. J. Theiss et al., Martin Marietta Energy Systems, Inc., Oak Ridge National Laboratory, "Initial Results of the Influence of Biaxial Loading on Fracture Toughness," USNRC Report NUREG/CR-6063 (ORNL/TM-12349), June 1993.t
4. T. J. Theiss, D. K. M. Shum, and S. T. Rolfe, Martin Marietta Energy Systems, Inc., Oak Ridge National Laboratory, "Experimental and Analytical Investigation of the Shallow-Flaw Effect in Reactor Pressure Vessels," USNRC Report NUREG/CR-5886 (ORNL/TM-12115), July 1992.*
5. M. T. Kirk and R. H. Dodds, Jr., "J and CTOD Estimation Equations for Shallow Cracks in Single Edge Notch Bend Specimens," Proceedings of the TWI Shallow Crack Fracture Mechanics Toughness Tests and Applications Conference, Cambridge, U.K., Sept. 23-24,1992.
6. I. Miller and J. E. Freund, Probability and Statistics for Engineers, Prentice-Hall, Inc., Englewood Cliffs, New Jersey, 1977.
Available in public technical libraries. 'Available for purchase from the National Technical Information Service, Springfield, VA 22161.
123 NUREG/CR-4219, Vol. 10, No. 2


CONVERSION FACTORS"
SI unit English unit Factor
mm in. 0.0393701 cm in. 0.393701 m ft 3.28084 m/s ft/s 3.28084 kN lbf 224.809 kPa psi 0.145038 MPa ksi 0.145038 MPa»Vm ksi^VSu 0.910048 J fflb 0.737562 K °For°R 1.8 kJ/m 2 in.-lb/in.2 5.71015 W'm-2'K- 1 Btu/h»ft2»°F 0.176110 kg lb 2.20462 kg/m 3 lb/in.3 3.61273 x 10- 5
mm/N inVlbf 0.175127 T(°F) = 1.8(°C) + 32
^Multiply SI quantity by given factor to obtain English quantity.
125 NUREG/CR-4219, Vol. 10, No. 2


Prior Heavy-Section Steel Technology Program Publications
The work reported here was performed at Oak Ridge National Laboratory under the Heavy-Section Steel Technology (HSST) Program, W. E. Pennell, Program Manager. The program is sponsored by the Office of Nuclear Regulatory Research of the U.S. Nuclear Regulatory Commission (NRC). The technical monitor for NRC is S. N. M. Malik. Prior and future reports in this series are listed below.
1. S. Yukawa, General Electric Company, Schenectady, N.Y., Evaluation of Periodic Proof Testing and Warm Prestressing Procedures for Nuclear Reactor Vessels, HSSTP-TR-1, July 1,1969.
2. L. W. Loechel, Martin Marietta Corporation, Denver, Colo., The Effect of Testing Variables on the Transition Temperature in Steel, MCR-69-189, November 20,1969.
3. P. N. Randall, TRW Systems Group, Redondo Beach, Calif., Gross Strain Measure of Fracture Toughness of Steels, HSSTP-TR-3, November 1,1969.
4. C. Visser, S. E. Gabrielse, and W. VanBuren, Westinghouse Electric Corporation, PWR Systems Division, Pittsburgh, Pa., A Two-Dimensional Elastic-Plastic Analysis of Fracture Test Specimens, WCAP-7368, October 1969.
5. T. R. Mager and F. O. Thomas, Westinghouse Electric Corporation, PWR Systems Division, Pittsburgh, Pa., Evaluation by Linear Elastic Fracture Mechanics of Radiation Damage to Pressure Vessel Steels, WCAP-7328 (Rev.), October 1969.
6. W. O. Shabbits, W. H. Pryle, and E. T. Wessel, Westinghouse Electric Corporation, PWR Systems Division, Pittsburgh, Pa., Heavy-Section Fracture Toughness Properties ofA533 Grade B Class 1 Steel Plate and Submerged Arc Weldment, WCAP-7414, December 1969.
7. F. J. Loss, Naval Research Laboratory, Washington, D.C., Dynamic Tear Test Investigations of the Fracture Toughness of Thick-Section Steel, NRL-7056, May 14,1970.
8. P. B. Crosley and E. J. Ripling, Materials Research Laboratory, Inc., Glenwood, 111., Crack Arrest Fracture Toughness ofA533 Grade B Class 1 Pressure Vessel Steel, HSSTP-TR-8, March 1970.
9. T. R. Mager, Westinghouse Electric Corporation, PWR Systems Division, Pittsburgh, Pa., Post-Irradiation Testing of 2T Compact Tension Specimens, WCAP-7561, August 1970.
10. T. R. Mager, Westinghouse Electric Corporation, PWR Systems Division, Pittsburgh, Pa., Fracture Toughness Characterization Study ofA533, Grade B, Class 1 Steel, WCAP-7578, October 1970.
11. T. R. Mager, Westinghouse Electric Corporation, PWR Systems Division, Pittsburgh, Pa., Notch Preparation in Compact Tension Specimens, WCAP-7579, November 1970.
12. N. Levy and P. V. Marcal, Brown University, Providence, R.I., Three-Dimensional Elastic-Plastic Stress and Strain Analysis for Fracture Mechanics, Phase I: Simple Flawed Specimens, HSSTP-TR-12, December 1970.
13. W. O. Shabbits, Westinghouse Electric Corporation, PWR Systems Division, Pittsburgh, Pa., Dynamic Fracture Toughness Properties of Heavy Section A533 Grade B Class 1 Steel Plate, WCAP-7623, December 1970.
14. P. N. Randall, TRW Systems Group, Redondo Beach, Calif., Gross Strain Crack Tolerance of A 533-B Steel, HSSTP-TR-14, May 1,1971.
15. H. T. Corten and R. H. Sailors, University of Illinois, Urbana, 111., Relationship Between Material Fracture Toughness Using Fracture Mechanics and Transition Temperature Tests, T&AM Report 346, August 1, 1971.
16. T. R. Mager and V. J. McLaughlin, Westinghouse Electric Corporation, PWR Systems Division, Pittsburgh, Pa., The Effect of an Environment of High Temperature Primary Grade Nuclear Reactor Water on the Fatigue Crack Growth Characteristics ofA533 Grade B Class 1 Plate and Weldment Material, WCAP-7776, October 1971.
17. N. Levy and P. V. Marcal, Brown University, Providence, R.I., Three-Dimensional Elastic-Plastic Stress and Strain Analysis for Fracture Mechanics, Phase II: Improved Modelling, HSSTP-TR-17, November 1971.
18. S. C. Grigory, Southwest Research Institute, San Antonio, Tex., Tests of6-in.-Thick Flawed Tensile Specimens, First Technical Summary Report, Longitudinal Specimens Numbers 1 through 7, HSSTP-TR-18, June 1972.
19. P. N. Randall, TRW Systems Group, Redondo Beach, Calif., Effects of Strain Gradients on the Gross Strain Crack Tolerance ofA533-B Steel, HSSTP-TR-19, June 15,1972.
20. S. C. Grigory, Southwest Research Institute, San Antonio, Tex., Tests of6-Inch-Thick Flawed Tensile
127 NUREG/CR-4219, Vol. 10, No. 2

Prior Specimens, Second Technical Summary Report, Transverse Specimens Numbers 8 through 10, Welded Specimens Numbers 11 through 13, HSSTP-TR-20, June 1972.
21. L. A. James and J. A. Williams, Hanford Engineering Development Laboratory, Richland, Wash., Heavy Section Steel Technology Program Technical Report No. 21, The Effect of Temperature and Neutron Irradiation Upon the Fatigue-Crack Propagation Behavior ofASTMA533 Grade B, Class 1 Steel, HEDL-TME 72-132, September 1972.
22. S. C. Grigory, Southwest Research Institute, San Antonio, Tex., Tests of6-Inch-Thick Flawed Tensile Specimens, Third Technical Summary Report, Longitudinal Specimens Numbers 14 through 16, Unflawed Specimen Number 17, HSSTP-TR-22, October 1972.
23. S. C. Grigory, Southwest Research Institute, San Antonio, Tex., Tests of 6-lnch-Thick Tensile Specimens, Fourth Technical Summary Report, Tests of 1-Inch-Thick Flawed Tensile Specimens for Size Effect Evaluation, HSSTP-TR-23, June 1973.
24. S. P. Ying and S. C. Grigory, Southwest Research Institute, San Antonio, Tex., Tests of 6-lnch-Thick Tensile Specimens, Fifth Technical Summary Report, Acoustic Emission Monitoring of One-Inch and Six-Inch-Thick Tensile Specimens, HSSTP-TR-24, November 1972.
25. R. W. Derby, J. G. Merkle, G. C. Robinson, G. D. Whitman, and F. J. Witt, Oak Ridge Nad. Lab., Oak Ridge, Tenn., Test of 6-lnch-Thick Pressure Vessels. Series 1: Intermediate Test Vessels V-l and V-2, ORNL-4895, February 1974.
26. W. J. Stelzman and R. G. Berggren, Oak Ridge Nad. Lab., Oak Ridge, Tenn., Radiation Strengthening and Embrittlement in Heavy Section Steel Plates and Welds, ORNL-4871, June 1973.
27. P. B. Crosley and E. J. Ripling, Materials Research Laboratory, Inc., Glenwood, 111., Crack Arrest in an Increasing K-Field, HSSTP-TR-27, January 1973.
28. P. V. Marcal, P. M. Stuart, and R. S. Bettes, Brown University, Providence, R.I., Elastic Plastic Behavior of a Longitudinal Semi-Elliptic Crack in a Thick Pressure Vessel, HSSTP-TR-28, June 1973.
29. W. J. Stelzman, R. G. Berggren, and T. N. Jones, Oak Ridge Natl. Lab., Oak Ridge, Tenn., ORNL Characterization of Heavy-Section Steel Technology Program Plates 01, 02 and 03, USNRC Report NUREG/ CR-4092 (ORNL/TM-9491), April 1985.
30. Canceled.
31. J. A. Williams, Hanford Engineering Development Laboratory, Richland, Wash., The Irradiation and Temperature Dependence of Tensile and Fracture Properties ofASTMA533, Grade B, Class 1 Steel Plate and Weldment, HEDL-TME 73-75, August 1973.
32. J. M. Steichen and J. A. Williams, Hanford Engineering Development Laboratory, Richland, Wash., High Strain Rate Tensile Properties of Irradiated ASTM A533 Grade B Class 1 Pressure Vessel Steel, July 1973.
33. P. C. Riccardella and J. L. Swedlow, Westinghouse Electric Corporation, Pittsburgh, Pa., A Combined Analytical-Experimental Fracture Study of the Two Leading Theories of Elastic-Plastic Fracture (J-Integral and Equivalent Energy), WCAP-8224, October 1973.
34. R. J. Podlasek and R. J. Eiber, Battelle Columbus Laboratories, Columbus, Ohio, Final Report on Investigation of Mode III Crack Extension in Reactor Piping, December 14,1973.
35. T. R. Mager, J. D. Landes, D. M. Moon, and V. J. McLaughlin, Westinghouse Electric Corporation, Pittsburgh, Pa., Interim Report on the Effect of Low Frequencies on the Fatigue Crack Growth Characteristics ofA533 Grade B Class 1 Plate in an Environment of High-Temperature Primary Grade Nuclear Reactor Water, WCAP-8256, December 1973.
36. J. A. Williams, Hanford Engineering Development Laboratory, Richland, Wash., The Irradiated Fracture Toughness ofASTMA533, Grade B, Class 1 Steel Measured with a Four-Inch-Thick Compact Tension Specimen, HEDL-TME 75-10, January 1975.
37. R. H. Bryan, J. G. Merkle, M. N. Raftenberg, G. C. Robinson, and J. E. Smith, Oak Ridge Natl. Lab., Oak Ridge, Tenn., Test of 6-lnch-Thick Pressure Vessels. Series 2: Intermediate Test Vessels V-3, V-4, and V-6, ORNL-5059, November 1975.
38. T. R. Mager, S. E. Yanichko, and L. R. Singer, Westinghouse Electric Corporation, Pittsburgh, Pa., Fracture Toughness Characterization ofHSST Intermediate Pressure Vessel Material, WCAP-8456, December 1974.
39. J. G. Merkle, G. D. Whitman, and R. H. Bryan, Oak Ridge Nad. Lab., Oak Ridge, Tenn., An Evaluation of the HSST Program Intermediate Pressure Vessel Tests in Terms of Light-Water-Reactor Pressure Vessel Safety, ORNL/TM-5090, November 1975.
40. J. C. Merkle, G. C. Robinson, P. P. Holz, J. E. Smith, and R. H. Bryan, Oak Ridge Nad. Lab., Oak Ridge,
NUREG/CR-4219, Vol. 10, No. 2 128

Prior Tenn., Test of6-In.-Thick Pressure Vessels. Series 3: Intermediate Test Vessel V-7, USNRC Report ORNL/ NUREG-1, August 1976.
41. J.A.Davidson,L.J.Ceschini,R.P.Shogan,and G. V. Rao, Westinghouse Electric Corporation, Pittsburgh, Pa., The Irradiated Dynamic Fracture Toughness of ASTMA533, Grade B, Class 1 Steel Plate and Submerged Arc Weldment, WCAP-8775, October 1976.
42. R. D. Cheverton, Oak Ridge Nad. Lab., Oak Ridge, Tenn., Pressure Vessel Fracture Studies Pertaining to a PWR LOCA-ECC Thermal Shock: Experiments TSE-1 and TSE-2, USNRC Report ORNL/NUREG/ TM-31, September 1976.
43. J. G. Merkle, G. C. Robinson, P. P. Holz, and J. E. Smith, Oak Ridge Nad. Lab., Oak Ridge, Tenn., Test of6-In.-Thick Pressure Vessels. Series 4: Intermediate Test Vessels V-5 and V-9 with Inside Nozzle Corner Cracks, USNRC Report ORNL/NUREG-7, August 1977.
44. J. A. Williams, Hanford Engineering Development Laboratory, Richland, Wash., The Ductile Fracture Toughness of Heavy Section Steel Plate, USNRC Report NUREG/CR-0859, September 1979.
45. R..H. Bryan, T. M. Cate, P. P. Holz, T. A. King, J. G. Merkle, G. C. Robinson, G. C. Smith, J. E. Smith, and G. D. Whitman, Oak Ridge Nad. Lab., Oak Ridge, Tenn., Test of 6-in.-Thick Pressure Vessels. Series 3: Intermediate Test Vessel V-7A Under Sustained Loading, USNRC Report ORNL/NUREG-9, February 1978.
46. R. D. Cheverton and S. E. Bolt, Oak Ridge Nad. Lab., Oak Ridge, Tenn., Pressure Vessel Fracture Studies Pertaining to a PWR LOCA-ECC Thermal Shock: Experiments TSE-3 and TSE-4 and Update of TSE-1 and TSE-2 Analysis, USNRC Report ORNL/ NUREG-22, December 1977.
47. D. A. Canonico, Oak Ridge Nad. Lab., Oak Ridge, Tenn., Significance of Reheat Cracks to the Integrity of Pressure Vessels for Light-Water Reactors, USNRC Report ORNL/NUREG-15, July 1977.
48. G. C. Smith and P. P. Holz, Oak Ridge Nad. Lab., Oak Ridge, Tenn., Repair Weld Induced Residual Stresses in Thick-Walled Steel Pressure Vessels, USNRC Report NUREG/CR-0093 (ORNL/NUREG/ TM-153), June 1978.
49. P. P. Holz and S. W. Wismer, Oak Ridge Nad. Lab., Oak Ridge, Tenn., Half-Bead (Temper) Repair Welding for HSST Vessels, USNRC Report NUREG/ CR-0113 (ORNL/NUREG/TM-177), June 1978.
50. G. C. Smith, P. P. Holz, and W. J. Stelzman, Oak Ridge Nad. Lab., Oak Ridge, Tenn., Crack Extension and Arrest Tests ofAxially Flawed Steel Model Pressure Vessels, USNRC Report NUREG/CR-0126 (ORNL/NUREG/TM-196), October 1978.
51. R. H. Bryan, P. P. Holz, J. G. Merkle, G. C. Smim, J. E. Smim, and W. J. Stelzman, Oak Ridge Nad. Lab., Oak Ridge, Tenn., Test of6-in.-Thick Pressure Vessels. Series 3: Intermediate Test Vessel V-7B, USNRC Report NUREG/CR-0309 (ORNL/ NUREG-38), October 1978.
52. R. D. Cheverton, S. K. Iskander, and S. E. Bolt, Oak Ridge Nad. Lab., Oak Ridge, Tenn., Applicability of LEFM to the Analysis of PWR Vessels Under LOCA-ECC Thermal Shock Conditions, USNRC Report NUREG/CR-0107 (ORNL/NUREG-40), October 1978.
53. R. H. Bryan, D. A. Canonico, P. P. Holz, S. K. Iskander, J. G. Merkle, J. E. Smim, and W. J. Stelzman, Oak Ridge Natl. Lab., Oak Ridge, Tenn., Test of6-in.-Thick Pressure Vessels, Series 3: Intermediate Test Vessel V-8, USNRC Report NUREG/ CR-0675 (ORNL/NUREG-58), December 1979.
54. R. D. Cheverton and S. K. Iskander, Oak Ridge Nad. Lab., Oak Ridge, Tenn., Application of Static and Dynamic Crack Arrest Theory to TSE-4, USNRC Report NUREG/CR-0767 (ORNL/NUREG-57), June 1979.
55. J. A. Williams, Hanford Engineering Development Laboratory, Richland, Wash., Tensile Properties of Irradiated and Unirradiated Welds ofA533 Steel Plate andA508 Forgings, USNRC Report NUREG/ CR-1158 (ORNL/Sub/79-50917/2), July 1979.
56. K. W. Carlson and J. A. WOliams, Hanford Engineering Development Laboratory, Richland, Wash., The Effect of Crack Length and Side Grooves on the Ductile Fracture Toughness Properties ofASTM A533 Steel, USNRC Report NUREG/CR-1171 (ORNL/Sub/79-50917/3), October 1979.
57. P. P. Holz, Oak Ridge Nad. Lab., Oak Ridge, Tenn., Flaw Preparations for HSST Program Vessel Fracture Mechanics Testing; Mechanical-Cyclic Pumping and Electron-Beam Weld-Hydrogen Charge Cracking Schemes, USNRC Report NUREG/CR-1274 (ORNL/ NUREG/TM-369), May 1980.
58. S. K. Iskander, Computer Sciences Div., Union Carbide Corp. Nuclear Div., Oak Ridge, Tenn., Two Finite Element Techniques for Computing Mode I Stress Intensity Factors in Two- or Three-Dimensional Problems, USNRC Report NUREG/CR-1499 (ORNL/NUREG/CSD/TM-14), February 1981.
129 NUREG/CR-4219, Vol. 10, No. 2

Prior 59. P. B. Crosley and E. J. Ripling, Materials Research
Laboratory, Glenwood, 111., Development of a Standard Test for Measuring Kja with a Modified Compact Specimen, USNRC Report NUREG/ CR-2294 (ORNL/Sub/81-7755/1), August 1981.
60. S. N. Atluri, B. R. Bass, J. W. Bryson, and K. Kathiresan, Computer Sciences Div., Oak Ridge Gaseous Diffusion Plant, Oak Ridge, Tenn., NOZ~ FLAW: A Finite Element Program for Direct Evaluation of Stress Intensity Factors for Pressure Vessel Nozzle-Corner Flaws, USNRC Report NUREG/ CR-1843 (ORNL/NUREG/CSD/TM-18), March 1981.
61. A. Shukla, W. L. Fourney, and G. R. Irwin, University of Maryland, College Park, Md., Study of Energy Loss and Its Mechanisms in Homalite 100 During Crack Propagation and Arrest, USNRC Report NUREG/CR-2150 (ORNL/Sub/79-7778/1), August 1981.
62. S. K. Iskander, R. D. Cheverton, and D. G. BaU, Oak Ridge Natl. Lab., Oak Ridge, Tenn., OCA-I, A Code for Calculating the Behavior of Flaws on the Inner Surface of a Pressure Vessel Subjected to Temperature and Pressure Transients, USNRC Report NUREG/CR-2113 (ORNL/NUREG-84), August 1981.
63. R. J. Sanford, R. Chona, W. L. Fourney, and G. R. Irwin, University of Maryland, College Park, Md., A Photoelastic Study of the Influence of Non-Singular Stresses in Fracture Test Specimens, USNRC Report NUREG/CR-2179 (ORNL/Sub/79-7778/2), August 1981.
64. B. R. Bass, S. N. Atluri, J. W. Bryson, and K. Kathiresan, Oak Ridge Natl. Lab., Oak Ridge, Tenn., OR-FLA W: A Finite Element Program for Direct Evaluation of K-Factors for User-Defined Flaws in Plate, Cylinders, and Pressure-Vessel Nozzle Corners, USNRC Report NUREG/CR-2494 (ORNL/CSD/TM-165), April 1982.
65. B. R. Bass and J. W. Bryson, Oak Ridge Natl. Lab., Oak Ridge Tenn., ORMGEN-3D: A Finite Element Mesh Generator for 3-Dimensional Crack Geometries, USNRC Report NUREG/CR-2997, Vol. 1 (ORNL/TM-8527/V1), December 1982.
66. B. R. Bass and J. W. Bryson, Oak Ridge Natl. Lab., Oak Ridge, Tenn., ORVIRT: A Finite Element Program for Energy Release Rate Calculations for 2-Dimensional and 3-Dimensional Crack Models, USNRC Report NUREG/CR-2997, Vol. 2 (ORNL/ TM-8527/V2), February 1983.
67. R. D. Cheverton, S. K. Iskander, and D. G. Ball, Oak Ridge Natl. Lab., Oak Ridge, Tenn., PWR Pressure Vessel Integrity During Overcooling Accidents: A Parametric Analysis, USNRC Report NUREG/ CR-2895 (ORNL/TM-7931), February 1983.
68. D. G. Ball, R. D. Cheverton, J. B. Drake, and S. K. Iskander, Oak Ridge Natl. Lab., Oak Ridge, Tenn., OCA-II, A Code for Calculating Behavior of2-D and 3-D Surface Flaws in a Pressure Vessel Subjected to Temperature and Pressure Transients., USNRC Report NUREG/CR-3491 (ORNL-5934), February 1984.
69. A. Sauter, R. D. Cheverton, and S. K. Iskander, Oak Ridge Nad. Lab., Oak Ridge, Tenn., Modification of OCA-I for Application to a Reactor Pressure Vessel with Cladding on the Inner Surface, USNRC Report NUREG/CR-3155 (ORNL/TM-8649), May 1983.
70. R. D. Cheverton and D.G. Ball, Martin Marietta Energy Systems, Inc., Oak Ridge Nad. Lab., Oak Ridge, Tenn., OCA-P, A Deterministic and Probabilistic Fracture-Mechanics Code for Application to Pressure Vessels, USNRC Report NUREG/CR-3618 (ORNL-5991), May 1984.
71. J. G. Merkle, Martin Marietta Energy Systems, Inc., Oak Ridge Natl. Lab., Oak Ridge, Tenn., An Examination of the Size Effects and Data Scatter Observed in Small Specimen Cleavage Fracture Toughness Testing, USNRC Report NUREG/ CR-3672 (ORNL/ TM-9088), April 1984.
72. C. E. Pugh et al., Martin Marietta Energy Systems, Inc., Oak Ridge Natl. Lab., Oak Ridge, Tenn., Heavy-Section Steel Technology Program—Five-Year Plan FY 1983-1987, USNRC Report NUREG/CR-3595 (ORNL/TM-9008), April 1984.
73. D. G. Ball, B. R. Bass, J. W. Bryson, R. D. Cheverton, and J. B. Drake, Martin Marietta Energy Systems, Inc., Oak Ridge Natl. Lab., Oak Ridge, Tenn., Stress Intensity Factor Influence Coefficients for Surface Flaws in Pressure Vessels, USNRC Report NUREG/CR-3723 (ORNL/CSD/TM-216), February 1985.
74. W. R. Corwin, R. G. Berggren, and R. K. Nanstad, Martin Marietta Energy Systems, Inc., Oak Ridge Natl. Lab., Oak Ridge, Tenn., Charpy Toughness and Tensile Properties of Neutron Irradiated Stainless Steel Submerged-Arc Weld Cladding Overlay, USNRC Report NUREG/CR-3927 (ORNL/TM-9309), September 1984.
75. C. W. Schwartz, R. Chona, W. L. Fourney, and G. R. Irwin, University of Maryland, College Park, Md., SAMCR: A Two-Dimensional Dynamic Finite
NUREG/CR-4219, Vol. 10, No. 2 130

Prior Element Code for the Stress Analysis of Moving CRacks, USNRC Report NUREG/CR-3891 (ORNL/ Sub/79-7778/3), November 1984.
76. W. R. Corwin, G. C. Robinson, R. K. Nanstad, J. G. Merkle, R. G. Berggren, G. M. Goodwin, R. L. Swain, and T. D. Owings, Martin Marietta Energy Systems, Inc., Oak Ridge Natl. Lab., Oak Ridge, Tenn., Effects of Stainless Steel Weld Overlay Cladding on the Structural Integrity of Flawed Steel Plates in Bending, Series 1, USNRC Report NUREG/ CR-4015 (ORNL/TM-9390), April 1985.
77. R. H. Bryan, B. R. Bass, S. E. Bolt, J. W. Bryson, D. P. Edmonds, R. W. McCulloch, J. G. Merkle, R. K. Nanstad, G. C. Robinson, K. R. Thorns, and G. D. Whitman, Martin Marietta Energy Systems, Inc., Oak Ridge Natl. Lab., Oak Ridge, Tenn., Pres-surized-Thermal-Shock Test of 6-in.-Thick Pressure Vessels. PTSE-1: Investigation of Warm Prestressing and Upper-Shelf Arrest, USNRC Report NUREG/ CR-4106 (ORNL-6135), April 1985.
78. R. D. Cheverton, D. G. Ball, S. E. Bolt, S. K. Iskander, and R K. Nanstad, Martin Marietta Energy Systems, Inc., Oak Ridge Natl. Lab., Oak Ridge, Term., Pressure Vessel Fracture Studies Pertaining to the PWR Thermal-Shock Issue: Experiments TSE-5, TSE-5A, and TSE-6, USNRC Report NUREG/ CR-4249 (ORNL-6163), June 1985.
79. R. D. Cheverton, D. G. Ball, S. E. Bolt, S. K. Iskander, and R. K. Nanstad, Martin Marietta Energy Systems, Inc., Oak Ridge Natl. Lab., Oak Ridge, Tenn., Pressure Vessel Fracture Studies Pertaining to the PWR Thermal-Shock Issue: Experiment TSE-7, USNRC Report NUREG/CR-4304 (ORNL-6177), August 1985.
80. R. H. Bryan, B. R. Bass, S. E. Bolt, J. W. Bryson, J. G. Merkle, R. K. Nanstad, and G. C. Robinson, Martin Marietta Energy Systems, Inc., Oak Ridge Natl. Lab., Oak Ridge, Tenn., Test of6-in.-Thick Pressure Vessels. Series 3: Intermediate Test Vessel V-8A—Tearing Behavior of Low Upper-Shelf Material, USNRC Report NUREG/CR-4760 (ORNL-6187), May 1987.
81. R. D. Cheverton and D. G. Ball, Martin Marietta Energy Systems, Inc., Oak Ridge Natl. Lab., Oak Ridge, Tenn., A Parametric Study of PWR Pressure Vessel Integrity During Over cooling Accidents, Considering Both 2-D and 3-D Flaws, USNRC Report NUREG/CR-4325 (ORNL/TM-9682), August 1985.
82. E. C. Rodabaugh, E. C. Rodabaugh Associates, Inc., Hilliard, Ohio, Comments on the Leak-Before-Break Concept for Nuclear Power Plant Piping Systems,
USNRC Report NUREG/CR-4305 (ORNL/ Sub/82-22252/3), August 1985.
83. J. W. Bryson, Martin Marietta Energy Systems, Inc., Oak Ridge Nad. Lab., Oak Ridge, Tenn., ORVIRT.PC: A 2-D Finite Element Fracture Analysis Program for a Microcomputer, USNRC Report NUREG/CR-4367 (ORNL-6208), October 1985.
84. D. G. Ball and R. D. Cheverton, Martin Marietta Energy Systems, Inc., Oak Ridge Natl. Lab., Oak Ridge, Tenn., Adaptation ofOCA-P, A Probabilistic Fracture-Mechanics Code, to a Personal Computer, USNRC Report NUREG/CR-4468 (ORNL/CSD/TM-233), January 1986.
85. J.W. Bryson and B.R. Bass, Martin Marietta Energy Systems, Inc., Oak Ridge Natl. Lab., Oak Ridge, Tenn., ORMGEN.PC: A Microcomputer Program for Automatic Mesh Generation of 2-D Crack Geometries, USNRC Report NUREG/CR-4475 (ORNL-6250), March 1986.
86. G. D. Whitman, Martin Marietta Energy Systems, Inc., Oak Ridge Natl. Lab., Oak Ridge, Tenn., Historical Summary of the Heavy-Section Steel Technology Program and Some Related Activities in Light-Water Reactor Pressure Vessel Safety Research, USNRC Report NUREG/CR-4489 (ORNL-6259), March 1986.
87. C. Inversini and J. W. Bryson, Martin Marietta Energy Systems, Inc., Oak Ridge Natl. Lab., Oak Ridge, Tenn., ORPLOTPC: A Graphic Utility for ORMGEN.PC and ORVIRT.PC, USNRC Report NUREG/CR-4633 (ORNL-6291), June 1986.
88. J. J. McGowan, R. K. Nanstad, and K. R. Thorns, Martin Marietta Energy Systems, Inc., Oak Ridge Natl. Lab., Oak Ridge, Tenn., Characterization of Irradiated Current-Practice Welds and A533 Grade B Class 1 Plate for Nuclear Pressure Vessel Service, USNRC Report NUREG/CR-4880 (ORNL/ TM-10387), July 1988.
89. K. V.Cook and R.W.McClung, Martin Marietta Energy Systems, Inc., Oak Ridge Natl. Lab., Oak Ridge, Tenn., Flaw Density Examinations of a Clad Boiling Water Reactor Pressure Vessel Segment, USNRC Report NUREG/CR-4860 (ORNL/ TM-10364), April 1987.
90. D. J. Naus, B. R. Bass, C. E. Pugh, R. K. Nanstad, J. G. Merkle, W. R. Corwin, and G. C. Robinson, Martin Marietta Energy Systems, Inc., Oak Ridge Natl. Lab., Oak Ridge, Term., Crack-Arrest Behavior in SEN Wide Plates of Quenched and Tempered A 533 Grade B Steel Tested Under Nonisothermal
131 NUREG/CR-4219, Vol. 10, No. 2

Prior Conditions, USNRC Report NUREG/CR-4930 (ORNL-6388), August 1987.
91. D. B. Barker, R. Chona, W. L. Fourney, and G. R. Irwin, University of Maryland, College Park, Md., A Report on the Round Robin Program Conducted to Evaluate the Proposed ASTM Standard Test Method for Determining the Plane Strain Crack Arrest Fracture Toughness, Kja, of Ferritic Materials, USNRC Report NUREG/CR-4966 (ORNL/Sub/79-7778/4), January 1988.
92. W. H. Bamford, Westinghouse Electric Corporation, Pittsburgh, Pa., A Summary of Environmentally Assisted Crack-Growth Studies Performed at Westinghouse Electric Corporation Under Funding from the Heavy-Section Steel Technology Program, USNRC Report NUREG/CR-5020 (ORNL/ Sub/82-21598/1), May 1988.
93. R. H. Bryan, B. R. Bass, S. E. Bolt, J. W. Bryson, W. R. Corwin, J. G. Merkle, R. K. Nanstad, and G. C. Robinson, Martin Marietta Energy Systems, Inc., Oak Ridge Natl. Lab., Oak Ridge, Term., Pressurized-Thermal-Shock Test of 6-in.-Thick Pressure Vessels. PTSE-2: Investigation of Low Tearing Resistance and Warm Prestressing, USNRC Report NUREG/ CR-4888 (ORNL-6377), December 1987.
94. J. H. Giovanola and R. W. KIopp, SRI International, Menlo Park, Calif., Viscoplastic Stress-Strain Characterization ofA533B Class 1 Steel, USNRC Report NUREG/CR-5066 (ORNL/Sub/87-SA193/l), September 1989.
95. L. F. Miller et al., Martin Marietta Energy Systems, Inc., Oak Ridge Natl. Lab., Oak Ridge, Tenn., Neutron Exposure Parameters for the Metallurgical Test Specimens in the Fifth Heavy-Section Steel Technology Irradiation Series Capsules, USNRC Report NUREG/ CR-5019 (ORNL/TM-10582), March 1988.
96. Canceled.
97. D. J. Naus, J. Keeney-Walker, and B. R. Bass, Martin Marietta Energy Systems, Inc., Oak Ridge Natl. Lab., Oak Ridge, Term., High-Temperature Crack-Arrest Behavior in 152-mm-Thick SEN Wide Plates of Quenched and Tempered A 533 Grade B Steel, USNRC Report NUREG/CR-5330 (ORNL/ TM-11083), April 1989.
98. K. V. Cook, R. A. Cunningham, Jr., and R. W. McClung, Martin Marietta Energy Systems, Inc., Oak Ridge Natl. Lab., Oak Ridge, Tenn., Detection and Characterization of Indications in Segments of Reactor Pressure Vessels, USNRC Report NUREG/ CR-5322 (ORNL/TM-11072), August 1989.
99. R. D. Cneverton, W. E. Pennell, G. C. Robinson, and R. K. Nanstad, Martin Marietta Energy Systems, Inc., Oak Ridge Natl. Lab., Oak Ridge, Tenn., Impact of Radiation Embrittlement on Integrity of Pressure Vessel Supports for Two PWR Plants, NUREG/ CR-5320 (ORNL/TM-10966), February 1989.
100. D. J. Naus, J. Keeney-Walker, B. R. Bass, S. K. Iskander, R. J. Fields, R. deWitt, and S. R. Low m, Martin Marietta Energy Systems, Inc., Oak Ridge Natl. Lab., Oak Ridge, Tenn., SEN Wide-Plate Crack-Arrest Tests Utilizing A 533 Grade B Class I Material: WP-CE Test Series, USNRC Report NUREG/CR-5408 (ORNL/TM-11269), November 1989.
101. D. J. Naus, J. Keeney-Walker, B. R. Bass, S. K. Iskander, R. J. Fields, R. deWitt, and S. R. Low m, Martin Marietta Energy Systems, Inc., Oak Ridge Natl. Lab., Oak Ridge, Tenn., High Temperature Crack-Arrest Tests Using 152-mm-Thick SEN Wide Plates of Low Upper-Shelf Base Material: Tests WP-2.2 and WP-2.6, USNRC Report NUREG/CR-5450 (ORNL/TM-11352), February 1990.
102. Canceled.
103. D. J. Naus, J. Keeney-Walker, B. R. Bass, G. C. Robinson, S. K. Iskander, D. J. Alexander, R. J. Fields, R. deWitt, S. R. Low, C. W. Schwartz, and I.-B. Johansson, Martin Marietta Energy Systems, Inc., Oak Ridge Natl. Lab., Oak Ridge, Tenn., Crack-Arrest Behavior in SEN Wide Plates of Low Upper-Shelf Base Metal Tested Under Nonisothermal Conditions: WP-2 Series, USNRC Report NUREG/ CR-5451 (ORNL-6584), August 1990.
104. T. L. Dickson, R. D. Cheverton, and D. K. Shum, Martin Marietta Energy Systems, Inc., Oak Ridge Natl. Lab., Oak Ridge, Tenn., Inclusion of Unstable Ductile Tearing and Extrapolated Crack-Arrest Toughness Data in PWR Vessel Integrity Assessment, USNRC Report NUREG/CR-5473 (ORNL/ TM-11450), May 1990.
105. T. J. Theiss, Martin Marietta Energy Systems, Inc., Oak Ridge Natl. Lab., Oak Ridge, Tenn., Recommendations for the Shallow-Crack Fracture Toughness Testing Task Within the HSST Program, USNRC Report NUREG/CR-5554 (ORNL/TM-11509), September 1990.
106. J. G. Merkle, Martin Marietta Energy Systems, Inc., Oak Ridge Natl. Lab., Oak Ridge, Tenn., An Overview of the Low Upper ShelfToughness Safety Margin Issue, USNRC Report NUREG/CR-5552 (ORNL/TM-11314), August 6,1990.
NUREG/CR-4219, Vol. 10, No. 2 132

Prior 107. D. K. M. Shum, J. G. Merkle, J. Keeney-Walker,
and B. R. Bass, Martin Marietta Energy Systems, Inc., Oak Ridge Natl. Lab., Oak Ridge, Tenn., Analytical Studies of Transverse Strain Effects on Fracture Toughness for Circumferentially Oriented Cracks, USNRC Report NUREG/CR-5592 (ORNL/ TM-11581), April 1991.
108. J. D. Landes, The University of Tennessee for Martin Marietta Energy Systems, Inc., Oak Ridge natl. Lab., Oak Ridge, Tenn., Extrapolation of the J-R Curve for Predicting Reactor Vessel Integrity, USNRC Report NUREG/CR-5650 (ORNL/Sub/89-99732/1), January 1992.
109. J. Keeney-Walker, B. R. Bass, and J. D. Landes, (The University of Tennessee), Martin Marietta Energy Systems, Inc., Oak Ridge Nad. Lab., Oak Ridge, Tenn., An Investigation of Crack-Tip Stress-Field Criteria for Predicting Cleavage-Crack Initiation, USNRC Report NUREG/ CR-5651 (ORNL/TM-11692), September 1991.
110. G. R. Irwin, University of Maryland, for Martin Marietta Energy Systems, Inc., Oak Ridge Nad. Lab., Oak Ridge, Tenn., Use of Thickness Reduction to Estimate Values ofK, USNRC Report NUREG/CR-5697 (ORNL/Sub/79-7778/5), November 1991.
111. P. Albrecht and X. Chen, University of Maryland for Martin Marietta Energy Systems, Inc., Oak Ridge Natl. Lab., Oak Ridge, Tenn., Limit Pressure Analysis ofPTSE-2 Vessel, USNRC Report NUREG/CR-5698 (ORNL/Sub/79-7778/6) (to be published).
112. J. W. Dally, W. L. Fourney, and G. R. Irwin, University of Maryland for Martin Marietta Energy Systems, Inc., Oak Ridge Natl. Lab., Oak Ridge, Tenn., Lower-Bound Initiation Toughness with a Modified-Charpy Specimen, USNRC Report NUREG/CR-5703 (ORNL/ Sub/79-7778/7), November 1991.
113. S. K. Iskander, G. C. Robinson, W. R. Corwin, B. C. Otend, D. J. Alexander, and K. V. Cook, Martin Marietta Energy Systems, Inc., Oak Ridge Natl. Lab., Oak Ridge, Tenn., Experimental Results of Tests to Investigate Flaw Behavior of Mechanically Loaded Stainless Steel Clad Plates, USNRC Report NUREG/ CR-5785 (ORNL/TM-11950), April 1992.
114. S.T. Rolfe, University of Kansas for Martin Marietta Energy Systems, Inc., Oak Ridge Nad. Lab., Oak Ridge, Tenn., Interpretive Report on the Application of Shallow-Flaw CTOD Test Data to the Structural Margin Assessment of Reactor Pressure
Vessels with Flaws, USNRC Report NUREG/CR-5767 (ORNL/Sub/90-SH640/1), November 1991.
115. D. E. McCabe, Martin Marietta Energy Systems, Inc., Oak Ridge Natl. Lab., Oak Ridge, Tenn., Comparison of Weibull and /Jfc Analysis of Transition Range Fracture Toughness Data, USNRC Report NUREG/CR-5788 (ORNL/ TM-11959), January 1992.
116. R. D. Cheverton, T. L. Dickson, J. G. Merkle, and R. K. Nanstad, Martin Marietta Energy Systems, Inc., Oak Ridge Natl. Lab., Oak Ridge, Tenn., Review of Reactor Pressure Vessel Evaluation Report for Yankee Rowe Nuclear Power Station (YAECNo. 1735), USNRC Report NUREG/CR-5799 (ORNL/ TM-11982), March 1992
117. T. L. Dickson, R. D. Cheverton, and J. W. Bryson, Martin Marietta Energy Systems, Inc., Oak Ridge Natl. Lab., Oak Ridge, Tenn., Pressurized-Thermal-Shock Probabilistic Fracture Mechanics Sensitivity Analyses for Yankee Rowe Reactor Pressure Vessel, USNRC Report NUREG/CR-5782 (ORNL/TM-11945) (to be published).
118. Cancelled
119. J. W. Dally, G. R. Irwin, X-J. Zhang, and R. J. Bonenberger, University of Maryland for Martin Marietta Energy Systems, Inc., Oak Ridge Nad. Lab., Oak Ridge, Tenn., The Influence of Precompression on the Lower-Bound Initiation Toughness of A 533 B Reactor Grade Steel, USNRC Report NUREG/ CR-5847 (ORNL/Sub/79-7778/8), May 1992.
120. Cancelled
121. C. W. Schwartz, University of Maryland for Martin Marietta Energy Systems, Inc., Oak Ridge Nad. Lab., Oak Ridge, Tenn., Crack Speed Relations Inferred from Large SEN Specimens of A 533 B Steel, USNRC Report NUREG/CR-5861 (ORNL/Sub/79-7778/9) (to be published).
122. A. R. Rosenfield and C. W. Marschall, Battelle Columbus Division for Martin Marietta Energy Systems, Inc., Oak Ridge Natl. Lab., Oak Ridge, Tenn., Fracture-Mechanics-Based Failure Analysis, USNRC Report NUREG/CR-5860 (ORNL/Sub/82-17651/1), June 1992.
123. G. R. Irwin and X-J. Zhang, University of Maryland for Martin Marietta Energy Systems, Inc., Oak Ridge Natl. Lab., Oak Ridge, Tenn., Gradient Study of a Large Weld Joining Two Forged A 508 Shells of the Midland Reactor Vessel, USNRC Report
133 NUREG/CR-4219, Vol. 10, No. 2
Prior NUREG/CR-5867 (ORNL/Sub/79-7778/10), June 1992.
124. J. Keeney-Walker and B.R. Bass, Martin Marietta Energy Systems, Inc., Oak Ridge Natl. Lab., Oak Ridge, Tenn., ORNOZL: A Finite-Element Mesh Generator for Nozzle-Cylinder Intersections Containing Inner-Corner Cracks, USNRC Report NUREG/CR-5872 (ORNL/TM-11049), September 1992.
125. J. Keeney-Walker and B. R. Bass, Martin Marietta Energy Systems, Inc., Oak Ridge Natl. Lab., Oak Ridge, Tenn., A Comparison of Analysis Methodologies for Predicting Cleavage Arrest of a Deep Crack in a Reactor Pressure Vessel Subjected to Pressurized-Thermal-Shock Loading Conditions, USNRC Report NUREG/CR-5793 (ORNL/TM-11969), September 1992.
126. T. J. Theiss, D. K. M. Shum, and S. T. Rolfe (University of Kansas), Martin Marietta Energy Systems, Inc., Oak Ridge Natl. Lab., Oak Ridge, Tenn., Experimental and Analytical Investigation of the Shallow-Flaw Effect in Reactor Pressure Vessels, USNRC Report NUREG/CR-5886 (ORNL/TM-12115), July 1992.
127. B. R. Bass, D. K. M. Shum, and J. Keeney-Walker, Martin Marietta Energy Systems, Inc., Oak Ridge Natl. Lab., Oak Ridge, Term., Constraint Effects on Fracture Toughness for Circumferentially Oriented Cracks in Reactor Pressure Vessels, USNRC Report NUREG/CR-6008, (ORNL/TM-12131), August 1992.
128. R. E. Stoller, Martin Marietta Energy Systems, Inc., Oak Ridge Natl. Lab., Oak Ridge, Tenn., Modeling the Influence of Irradiation Temperature and Displacement Rate on Radiation-Induced Hardening in Ferritic Steels, USNRC Report NUREG/CR-5859 (ORNL/TM-12073), July 1992.
129. J. Keeney-Walker, J. G. Merkle, S. K. Iskander, and T. L. Dickson, Martin Marietta Energy Systems, Inc., Oak Ridge Natl. Lab., Oak Ridge, Tenn., Recommendations for Thermal-Shock Testing of Clad Cylinders with Shallow Surface Cracks, USNRC Report NUREG/CR-5915 (ORNL/TM-12166), November 1992.
130. W. E. Pennell, B. R. Bass, R. K. Nanstad, J. G. Merkle, T. L. Dickson, T. J. Theiss, J. Keeney-Walker, and D. K. Shum, Heavy-Section Steel Technology Program Semiannual Progress Report for October 1991 through March 1992, NUREG/CR-4219 (ORNL/TM-9593/V9&N1) June 30,1992.
131. W. E. Pennell, Martin Marietta Energy Systems, Inc., Oak Ridge Natl. Lab., "Heavy-Section Steel Technology Program: Recent Developments in Crack Initiation and Arrest Research," Nineteenth Water Reactor Safety Information Meeting, NUREG/CP-0119, Vol. 1, pp. 29-51, October 1992.
132. W. E. Pennell, Martin Marietta Energy Systems, Inc., Oak Ridge Natl. Lab., "Aging Impact on the Safety and Operability of Nuclear Reactor Pressure Vessels," Proceedings of the Aging Research Information Conference, USNRC Conference Proceeding NUREG/CP-0122, Vol. 1, pp. 431-453, March 1992.
133. T. L. Dickson and F. A. Simonen, Martin Marietta Energy Systems, Inc., Oak Ridge Natl. Lab., "The Application of Probabilistic Fracture Analysis to Residual Life Evaluation of Embrittled Reactor Vessels," Proceedings of the Aging Research Information Conference, USNRC Conference Proceeding NUREG/CP-0122, Vol. 1, pp. 454-467, March 1992.
134. R. K. Nanstad, F. M. Haggag, D. E. McCabe, S. K. Iskander, K. O. Bowman, and B. H. Menke, Martin Marietta Energy Systems, Inc., Oak Ridge Natl. Lab., Irradiation Effects on Fracture Toughness of Two High-Copper Submerged-Arc Welds, HSSI Series 5, USNRC Report NUREG/CR-5913, Vol. 1 (ORNL/TM-12156/V1) October 1992.
135. D. E. McCabe, Martin Marietta Energy Systems, Inc., Oak Ridge Natl. Lab., Evaluation of Crack Pop-ins and the Determination of Their Relevance to Design Consideration, USNRC Report NUREG/CR-5952 (ORNL/TM-12247), February 1993.
136. Cancelled
137. R. K. Nanstad, D.E. McCabe, R. L.Swain, and M. K. Miller, Martin Marietta Energy Systems, Inc., Oak Ridge Natl. Lab., Chemical Composition and RTNDT Determinations for Midland Weld WF-70, USNRC Report NUREG/CR-5914 (ORNL-6740) December 1992.
138. T. J. Theiss, B. R. Bass, J. W. Bryson, W. J. McAfee, R. K. Nanstad, W. E. Pennell, and M. C. Rao, Martin Marietta Energy Systems, Inc., Oak Ridge Natl. Lab., Initial Results of the Influence of Biaxial Loading on Fracture Toughness, USNRC Report NUREG/CR-6036 (ORNL/TM-12349), to be published.
139. D. K. Shum, J. W. Bryson, and J. G. Merkle, Martin Marietta Energy Systems, Inc., Oak Ridge Natl. Lab., Potential Change in Flaw Geometry of an
NUREG/CR-4219, Vol. 10, No. 2 134

Prior Initially Shallow Finite-Length Surface Flaw During a Pressurized Thermal Shock Transient, NUREG/CR-5968 (ORNL/TM-12279), to be published.
140. T. L. Dickson, Martin Marietta Energy Systems, Inc., Oak Ridge Natl. Lab., Generic Analyses for Evaluation of Low Charpy Upper-Shelf Energy Effects on Safety Margins Against Fracture of Reactor Pressure Vessel Materials, USNRC Report NUREG/CR-6023 (ORNL/TM-12340), July 1993.
141. C. W. Schwartz, Department of Civil Engineering, University of Maryland, Crack-Speed Relations Inferred from Large Single-Edge-Notched Specimens ofA533 B Steel, NUREG/CR-5861 (ORNL/Sub/79-7778/9), to be published.
143. J. A. Keeney, B. R. Bass, W. J. McAfee, S. K. Iskander, Martin Marietta Energy Systems, Inc., Oak Ridge Natl. Lab., Preliminary Assessment of the Fracture Behavior of Weld Material in Full-Thickness Clad Beams, NUREG/CR-6228 (ORNL/TM-12375), to be published.
144. Cancelled
145. B. R. Bass, J. W. Bryson, T. J. Theiss, Martin Marietta Energy Systems, Inc., Oak Ridge Natl. Lab., and M. C. Rao, Consultant, Biaxial Loading and Shallow Flaw Effects on Crack-Tip Constraint and Fracture Toughness, NUREG/CR-6132 (ORNL/TM-12498), to be published.
146. T. L. Dickson etal., Martin Marietta Energy Systems, Inc., Oak Ridge Natl. Lab., Pressurized Thermal Shock Probabilistic Fracture Mechanics Sensitivity Analysis for Yankee Rowe Reactor Pressure Vessel, NUREG/CR-5782 (ORNL/TM-11945), August 1993.
W. E. Pennell, B. R. Bass, J. W. Bryson, W. J. McAfee, T. J. Theiss, and M. C. Rao, Martin Marietta Energy Systems, Inc., Oak Ridge Natl. Lab., Biaxial Loading and Shallow-Flaw Effects on Crack-Tip Constraint and Fracture Toughness, NUREG/CR-6132 (ORNL/TM-12498), to be published.
135 NUREG/CR-4219, Vol. 10, No. 2


NUREG/CR-4219 ORNL/TM-9593/V10&N2
Vol. 10, No. 2 DistCategory RF
Internal Distribution
14. R. K. Nanstad 15. D. J. Naus
16-19. W. E. Pennell 20. C. E. Pugh 21. C. C. Southmayd 22. ORNL Patent Section 23. Central Research Library 24. Document of Reference 25. Laboratory Records 26. Laboratory Records (RC)
External Distribution
27. R. D. Thompson, Office of Aminstration, Divison of Contracts and Properties, U. S. Nuclear Regulatory Commission, Mailstop T17/G-21, Mailstop T17/G21, Washington, DC, 20555-0001.
28. J. Strosnider, Division of Engineering, NRR, U.S. Nuclear Regulatory Commission, Mailstop 07-D4, Washington, DC 20555-0001
29.. E. M. Hackett, Materials and Chemical Engineering Branch, Mailstop 07-D4, U.S. Nuclear Regulatory Commission, Washington, DC 20555-0001
30-32. S. N. M. Malik, EMMEB/DET/RES, U.S. Nuclear Regulatory Commission, Washington, DC 20555-001 33. M. E. Mayfield, EMMEB/DET/RES, U.S. Nuclear Regulatory Commission, Washington, DC
20555-0001 34. G. C. Millman, Division of Engineering, U.S. Nuclear Regulatory Commission, Washington, DC 20555-
0001 35. M. Vassilaros, EMMEB/DET/RES, Mailstop T10-E10, U.S. Nuclear Regulatory Commission,
Washington, DC 20555-0001 36. J. W. Dally, Department of Mechanical Engineering, University of Maryland, College Park, Maryland
20742 37. G. R. Irwin, Department of Mechanical Engineering, University of Maryland, College Park, Maryland
20742 38. L. James, Westinghouse Bettis Lab., P.O. Box 79, ZAP 13A, 814 Pittsburgh McKeesport Blvd., West
Mifflin, Pennslyvania 15122 39. C. F. Shih, Box D, Division of Engineering, Brown University, Providence, Rhode Island, 02912 40. R. Dodds, 3140 Newmark Laboratory, 205 North Matthews, Urbana, Illinois 61801 41. R. Fields, National Inst, of Standards and Technology, Bldg. 223, B144, Gaithersburg, Maryland 20899 42. W. L. Fourney, Department of Mechanical Engineering, University of Maryland, College Park, Maryland
20742 43. J. D.Landes, The University of Tennessee, Knoxville, Tennessee 37996-2030 44. S. T. Rolfe, The University of Kansas, Lawrence, Kansas 66045-2235 45. A. R. Rosenfield, Battelle Columbus Division, Columbus, Ohio 43201 50. C. W. Schwartz, Department of Civil Engineering, University of Maryland, College Park, Maryland
20742 51. E. T. Wessel, 312 Wolverine, Haines City, Florida 33844 52. Office of Assistant Manager for Energy Research and Development, DOE-ORO, Oak Ridge, Tennessee
37831 53-54. Office of Scientific and Technical Information, P. O. Box 62, Oak Ridge, Tennessee 37831
1. D.J.Alexander 2. B.R.Bass 3. J. W. Bryson 4. W. G. Craddick 5. W. R. Corwin 6. T. L. Dickson 7. R. G. Gilliland 8. W. F. Jackson 9. S. K. Iskander
10. J. A. Keeney 11. W.J.McAfee 12. D. E. McCabe 13. J. G.Merkle
137

NRC FORM 335 U.S. NUCLEAR REGULATORY COMMISSION
(2-89)
Swvsa?' BIBLIOGRAPHIC DATA SHEET (See instructions on the reverse)
1. REPORT NUMBER (Atsisned by NRC. Add Vol., Supp., Rev., and Addendum Numbers, if any.)
NUREG/CR-4219 0RNL/TM-9593/V10&N2
2. T I T L E A N D SUBTITLE
Heavy-Section Steel Technology Program
Semiannual Progress Report fo r April-September 1993
Vol. 10, No. 2 2. T I T L E A N D SUBTITLE
Heavy-Section Steel Technology Program
Semiannual Progress Report fo r April-September 1993
3. DATE REPORT PUBLISHED
2. T I T L E A N D SUBTITLE
Heavy-Section Steel Technology Program
Semiannual Progress Report fo r April-September 1993 MONTH I YEAR
May 1995
2. T I T L E A N D SUBTITLE
Heavy-Section Steel Technology Program
Semiannual Progress Report fo r April-September 1993
4. FIN OR GRANT NUMBER
B0119 5. AUTHOR (S)
W. E. Pennell
6. TYPE OF REPORT
Technical
5. AUTHOR (S)
W. E. Pennell 7. PERIOD COVERED (Inclusive Dates)
3 P E R F O R M I N G O R G A N I Z A T I O N — N A M E A N D A D D R E S S (If NRC, provide Division, Office or Region, U.S. Nuclear Regulatory Commission, and matting address; if contractor, provide name and mailing address.)
Oak Ridge National Laboratory Oak Ridge, TN 37831-6285
9 . S P O N S O R I N G O R G A N I Z A T I O N - N A M E A N D A D D R E S S (If NRC, type "Same as above"; if contractor, provide NRC Division, Office or Region, US. Nuclear Regulatory Commission, and mailing address.}
Divis ion of Engineering Technology Off ice of Nuclear Regulatory Research U. S. Nuclear Regulatory Commission Washington, DC 20555-0001
10. SUPPLEMENTARY NOTES
11. ABSTRACT 1200 words or less)
The Heavy-Section Steel Technology (HSST) Program is conducted for the Nuclear Regulatory Commission by Oak Ridge National Laboratory (0RNL). The program focuses on the development and va l idat ion of technology for the assessment of fracture-prevention margins in commercial nuclear reactor pressure vessels. The HSST Program is organized in 12 tasks: (1) program management, (2) f racture methodology and analysis, (3) material characterizations and propert ies, (4) special technical assistance, (5) f racture analysis computer programs, (6) cleavage-crack i n i t i a t i o n , (7) cladding evaluations, (8) pressurized-thermal-shock technology, (9) analysis methods va l ida t ion , (10) fracture evaluation tes t s , (11) warm prestressing, and (12) b iax ia l loading effects on fracture toughness. The program tasks have been structured to emphasize the resolut ion f racture issues with near-term l icensing s ign i f icance. Resources to execute the research tasks are drawn from ORNL with subcontract support from univers i t ies and other research laborator ies. Close contact is maintained with the s i s te r Heavy-Section Steel I r rad ia t ion Program at ORNL and with related research programs both in the United States and abroad. This report provides an overview of pr incipal developments in each of the 12 program tasks from Apr i l - September 1993.
1 2 . K E Y W O R D S / D E S C R I P T O R S (List words or phrases that will assist researchers in locating the report. 1
A533B Class 1 s t e e l E l a s t i c - p l a s t i c f r a c t u r e mechanics Sha l low-c rack beam Pressu r i zed - the rma l shock Sur face-cracked specimens L o a d - l i n e displacement-Crack-growth behav ior CT Specimen S e m i e l l i p t i c a l su r face crack P o s i t i v e temperature g rad ien t S ing le-edge notched specimens Sha l l ow- f l aw F in i t e -e l emen ts a n a l y s i s J R c o r r e l a t i o n
13. AVAI LABi LITY STATEMENT
Unlimited 1 2 . K E Y W O R D S / D E S C R I P T O R S (List words or phrases that will assist researchers in locating the report. 1
A533B Class 1 s t e e l E l a s t i c - p l a s t i c f r a c t u r e mechanics Sha l low-c rack beam Pressu r i zed - the rma l shock Sur face-cracked specimens L o a d - l i n e displacement-Crack-growth behav ior CT Specimen S e m i e l l i p t i c a l su r face crack P o s i t i v e temperature g rad ien t S ing le-edge notched specimens Sha l l ow- f l aw F in i t e -e l emen ts a n a l y s i s J R c o r r e l a t i o n
14. SECURITY CLASSIFICATION
1 2 . K E Y W O R D S / D E S C R I P T O R S (List words or phrases that will assist researchers in locating the report. 1
A533B Class 1 s t e e l E l a s t i c - p l a s t i c f r a c t u r e mechanics Sha l low-c rack beam Pressu r i zed - the rma l shock Sur face-cracked specimens L o a d - l i n e displacement-Crack-growth behav ior CT Specimen S e m i e l l i p t i c a l su r face crack P o s i t i v e temperature g rad ien t S ing le-edge notched specimens Sha l l ow- f l aw F in i t e -e l emen ts a n a l y s i s J R c o r r e l a t i o n
(This Page)
Unclassified
1 2 . K E Y W O R D S / D E S C R I P T O R S (List words or phrases that will assist researchers in locating the report. 1
A533B Class 1 s t e e l E l a s t i c - p l a s t i c f r a c t u r e mechanics Sha l low-c rack beam Pressu r i zed - the rma l shock Sur face-cracked specimens L o a d - l i n e displacement-Crack-growth behav ior CT Specimen S e m i e l l i p t i c a l su r face crack P o s i t i v e temperature g rad ien t S ing le-edge notched specimens Sha l l ow- f l aw F in i t e -e l emen ts a n a l y s i s J R c o r r e l a t i o n
(This Report)
Unclassified
1 2 . K E Y W O R D S / D E S C R I P T O R S (List words or phrases that will assist researchers in locating the report. 1
A533B Class 1 s t e e l E l a s t i c - p l a s t i c f r a c t u r e mechanics Sha l low-c rack beam Pressu r i zed - the rma l shock Sur face-cracked specimens L o a d - l i n e displacement-Crack-growth behav ior CT Specimen S e m i e l l i p t i c a l su r face crack P o s i t i v e temperature g rad ien t S ing le-edge notched specimens Sha l l ow- f l aw F in i t e -e l emen ts a n a l y s i s J R c o r r e l a t i o n 15. NUMBER OF PAGES
16. PRICE
NRC FORM 335 (2-89)