heavy transcription of yeast genes correlates with ...rchereji/publications/cole et al. -...
TRANSCRIPT

Nucleic Acids Research, 2014 1doi: 10.1093/nar/gku1013
Heavy transcription of yeast genes correlates withdifferential loss of histone H2B relative to H4 andqueued RNA polymerasesHope A. Cole, Josefina Ocampo, James R. Iben, Razvan V. Chereji and David J. Clark*
Program in Genomics of Differentiation, Eunice Kennedy Shriver National Institute for Child Health and HumanDevelopment, National Institutes of Health, Bethesda 20892, MD, USA
Received July 30, 2014; Revised September 18, 2014; Accepted October 8, 2014
ABSTRACT
Eukaryotic chromatin is composed of nucleosomes,which contain nearly two coils of DNA wrappedaround a central histone octamer. The octamer con-tains an H3-H4 tetramer and two H2A-H2B dimers.Gene activation is associated with chromatin disrup-tion: a wider nucleosome-depleted region (NDR) atthe promoter and reduced nucleosome occupancyover the coding region. Here, we examine the natureof disrupted chromatin after induction, using MNase-seq to map nucleosomes and subnucleosomes, anda refined high-resolution ChIP-seq method to mapH4, H2B and RNA polymerase II (Pol II) genome-wide. Over coding regions, induced genes show adifferential loss of H2B relative to H4, which corre-lates with Pol II density and the appearance of sub-nucleosomes. After induction, Pol II is surprisinglylow at the promoter, but accumulates on the geneand downstream of the termination site, implying thatdissociation is very slow. Thus, induction-dependentchromatin disruption reflects both eviction of H2A-H2B dimers and the presence of queued Pol II elonga-tion complexes. We propose that slow Pol II dissocia-tion after transcription is a major factor in chromatindisruption and that it may be of critical importancein gene regulation.
INTRODUCTION
The basic subunit of chromatin is the nucleosome core,which contains ∼147 bp of DNA wrapped in ∼1.7 neg-ative superhelical turns around a central core histone oc-tamer (1). The octamer is composed of two molecules eachof H3, H4, H2A and H2B. In vitro, nucleosome assemblyon DNA by salt-gradient dialysis is a two-step process, in-volving the initial binding of an (H3-H4)2 tetramer to theDNA, followed by the binding of two H2A-H2B dimers,
one on each side of the tetramer, to complete the nucleo-some (1,2). The high stability and compact structure of thenucleosome, together with limited DNA accessibility due tosteric hindrance by histones, result in inhibition of DNA-dependent processes such as transcription, replication andrepair.
The question of how RNA polymerase II (Pol II) nego-tiates the nucleosome is of particular interest. In vitro, PolII transcribes through a nucleosome causing the loss of asingle H2A-H2B dimer, leaving behind an (H3-H4)2/H2A-H2B hexamer (3). Thus, the passage of polymerase causespartial disassembly of the nucleosome. This effect is exacer-bated at high Pol II density, where multiple passages by PolII result in loss of the entire nucleosome (4). In vivo, vari-ous elongation factors remove and replace histones duringtranscription, resulting in dynamic histone exchange fromcoding regions and accelerating transit of Pol II throughnucleosomes (5–14). Single-gene studies suggest that com-plete nucleosomes are displaced from highly transcribedgenes (11,12). More generally, heavy transcription in vivocorrelates with chromatin disruption, both at the promoterand on the gene (15–21). At the promoter, the nucleosome-depleted region (NDR) is wider and deeper, partly dueto depletion of upstream nucleosomes. On the coding re-gion, nucleosome occupancy decreases, nucleosomes tendto pack closer together and phasing is disrupted (15–21).
Previously, we have identified a set of genes in buddingyeast which exhibit a major change in chromatin structureafter induction, involving a loss of nucleosome occupancyacross the coding region that can extend into flanking genes(19). These genes represent a subset of the genes that are in-duced by 3-aminotriazole (3AT), an inhibitor of the enzymeencoded by HIS3, which elicits the starvation response me-diated by translational control of the Gcn4 transcriptionalactivator: GCN4 mRNA is rapidly translated in response toamino acid starvation (22,23). Specific binding of Gcn4 tothe promoters of many genes results in activation mediatedby various cofactors, including the SWI/SNF chromatin re-modeling complex and the SRB/mediator (24). Here, we ex-amine the structural basis of this chromatin disruption by
*To whom correspondence should be addressed. Tel: +1 301 496 6966; Fax: +1 301 480 1907; Email: [email protected]
Published by Oxford University Press on behalf of Nucleic Acids Research 2014.This work is written by (a) US Government employee(s) and is in the public domain in the US.
Nucleic Acids Research Advance Access published October 27, 2014 by guest on O
ctober 27, 2014http://nar.oxfordjournals.org/
Dow
nloaded from

2 Nucleic Acids Research, 2014
comparing genome-wide maps of nucleosomes and subnu-cleosomes (defined as histone-containing particles smallerthan the core particle) prepared using MNase, with maps ofhistones and Pol II (prepared using sonication) in untreatedand 3AT-induced cells. We show that chromatin disruptionreflects a differential loss of H2A-H2B dimers relative to(H3-H4)2 tetramers that correlates with the appearance ofsubnucleosomes on the coding region and is proportionalto Pol II density. Remarkably, the distribution of Pol II issuch that it is lowest at the transcription start site (TSS)and highest on the distal coding region and at the 3’-end,where it overshoots the transcript end site (TES) and accu-mulates, sometimes invading the gene downstream. Thus,Pol II elongation complexes appear to queue up on the gene,waiting to complete transcription and dissociate.
MATERIALS AND METHODS
Yeast strains
The HIS3 gene is required for 3AT induction. YDC111(MATa ade2–1 can1-100 leu2-3,112 trp1-1 ura3-1) (25)was used for MNase digestion and Pol II experiments.For H4 experiments, YDC439 (W303 MATa ade2–1 leu2-3,112 trp1-1 ura3-1 hht1-hhf1Δ::LEU2 URA3::HHT2-HA-HHF2) was constructed by transformation of BUY815 (astrain carrying a single HA tag at the N-terminus of H4;the gift of Namrita Dhillon and Rohinton Kamakaka) withan EcoRI fragment containing HIS3, as described (25). ForH2B experiments, YDC443 (W303 MATa can1-100 his3-11 leu2-3,112 lys2Δ trp1-1 ura3-1 hta2-htb2Δ::TRP1 HA-6His-HTB1::HIS3) was constructed in two steps. Firstly,wild-type strain JRY4012 (26) was transformed with a poly-merase chain reaction (PCR) fragment to delete the HTA2-HTB2 locus by replacing it with TRP1, to obtain YDC417.Secondly, YDC417 was transformed with a PacI-EcoRI di-gest of p676 to integrate a 6-His tag followed by a singleHA tag at the N-terminus of H2B, at the HTB1 locus. p676was obtained by insertion of a 6-His and an HA tag (VSH-HHHHHGSMYPYDVPDYAGSM) between the first andsecond codons of HTB1 in p592 (27). All inserts and tagswere verified by PCR analysis and sequencing.
Paired-end sequencing of chromatin immunoprecipitates
YDC111, YDC439 and YDC443 were grown to log-phaseeither in synthetic complete (SC) medium (untreated) orin SC-histidine followed by induction with 10 mM 3AT(Sigma 61-82-5) for 20 min. Cells were fixed with 1%formaldehyde (15 min at room temperature) and glycinewas added to 0.5 M for 5 min. Cells were collected by fil-ter, washed with 20 mM Tris–HCl pH 8.0, 0.15 M NaCl,aliquoted in batches of ∼70 OD600 units and stored at−80◦C. The frozen cell pellet was resuspended in 0.5 ml 0.1M Tris–HCl pH 8.0, 20% (v/v) glycerol with protease in-hibitors (Roche 05 056 489 001). An equal volume of glassbeads (0.5 mm soda-lime BioSpec 11079105) was added andthe cells were vortexed for 40 min at 4◦C. The beads were re-moved, 1 ml FA buffer (50 mM HEPES-K pH 7.5, 0.15 MNaCl, 1 mM NaEDTA, 1% Triton X100, 0.1% Na deoxy-cholate, with protease inhibitors as above) was added andthe lysate was spun for 10 min at 14 000 rpm and 4◦C. The
pellet was resuspended in 1 ml FA buffer and spun again.The final pellet was resuspended in 0.5 ml FA buffer andsonicated using a Diagenode Bioruptor 300 at 4◦C with 40cycles of 30 s high power and 30 s rest, with a 15-min cool-ing period after 20 cycles. Debris was removed by spinningfor 20 min at 14 000 rpm and 4◦C. The supernatant wasaliquoted and stored at −80◦C. DNA was quantified usingthe Hoechst assay. For IP, 2.5 �g DNA was adjusted to 250�l with FA buffer, any insoluble material was removed witha brief spin and the supernatant was added to 30 �l anti-HAagarose (Sigma A2095) that had been washed three timeswith PBS. Binding was performed in an Eppendorf Ther-momixer for 2 h at 1000 rpm and 4◦C. The supernatant wasremoved. The HA-agarose was washed twice with FA bufferand three times with S-RIPA buffer (10 mM Tris–HCl pH8.0, 0.14 M NaCl, 1% Na-deoxycholate, 1% Triton X100,0.1% sodium dodecyl sulphate (SDS)) in the Thermomixer(5 min, 1000 rpm, 4◦C). Bound DNA was eluted with 50�l HA-peptide (Roche 11666975001) at 0.1 mg/ml S-RIPAbuffer in the Thermomixer (30 min, 1000 rpm, 4◦C). Theeluate was removed, the elution was repeated, the eluateswere pooled and adjusted to 150 �l and ethylenediaminete-traacetic acid (EDTA) was added to 5 mM. Cross-links werereversed by incubation at 65◦C overnight, followed by pro-teinase K digestion (0.25 mg/ml, 5 h, 55◦C). The digest wascooled, SDS was added to 1% and mixed, one-fifth volumeof 5 M potassium acetate was added, and extracted twicewith an equal volume of chloroform. DNA was precipi-tated with 0.7 volume of isopropanol in the presence of 5 �gglycogen, washed once with 70% ethanol and dissolved in45 �l TE (10 mM Tris–HCl pH 8.0, 0.1 mM NaEDTA). IP-DNA was repaired as described (28), purified using a Qia-gen PCR column and eluted with 50 �l TE. A 5’-phosphateand a 3’-dA were added, followed by the Illumina paired-end adaptor (#1005711) (28). Purified IP-DNA (4 �l) wassubjected to PCR (21 cycles) in 50 �l with Illumina paired-end primers (InPE1.0 and InPE2.0) and an index primerat the recommended concentrations (Illumina). DNA waspurified using a Qiagen PCR column and its concentrationmeasured by A260 (10–30 �g/ml was in the linear range). In-put DNA (∼10 �g) was adjusted to 200 �l with FA bufferand then to 20 mM Tris–HCl pH 8.0 and 5 mM EDTA.Cross-links were reversed as described above. The purifiedDNA was incubated in 15 �l TE with 0.1 mg RNase/mlfor 2 h at 37◦C. The volume was adjusted to 50 �l with 0.2M NaCl in TE. The DNA was eluted from a Qiagen PCRcolumn with 50 �l TE and quantified by A260. Input DNA(0.8 �g) was prepared for paired-end sequencing as above;PCR (17 cycles) was performed according to Illumina, us-ing ∼20 ng input DNA. DNA was purified by Qiagen PCRcolumn and its concentration measured by A260. IP-DNAfrom YDC111 (no tag control) was prepared for sequenc-ing in parallel, but little final product was obtained (notsequenced). Pol II paired-end sequencing of chromatin im-munoprecipitate (PESCI) was performed as described forhistones, except that an Rpb3 monoclonal antibody (Neo-clone WP012) was bound to Protein A Sepharose beads(GE Healthcare 17-5280-01). For IP, 4 �g anti-Rpb3 wasmixed with 30 �l beads (1:1 slurry) for 1 h at room tempera-ture and washed three times with phosphate buffered saline(PBS) containing IgG-free BSA at 5 mg/ml before adding
by guest on October 27, 2014
http://nar.oxfordjournals.org/D
ownloaded from

Nucleic Acids Research, 2014 3
2.5 (Experiment 1) or 6.25 �g (Experiment 2) DNA, ad-justed to 250 �l with FA buffer. Controls without antibodywere also done. The IP was performed as above, except forthe elution, for which the beads were resuspended in 150 �l0.14 M NaCl, 50 mM Tris–HCl pH 8, 5 mM Na-EDTA,0.5% SDS. PCR amplification required ∼30 cycles.
Nucleosome sequencing and data analysis
MNase experiments were carried out as described (28).DNA was prepared for Illumina paired-end sequencing(50 nt reads) and mapped as described (28,29). Occupancymaps were constructed using raw data smoothed using a 21-bp window moving average filter and normalized to the to-tal number of read pairs in the untreated sample. Phasinganalysis was performed using custom Perl programs (avail-able on request (30)) combined with TSS and TES data(31). PESCI data were normalized to the genome averageof the sample; the IP value at each chromosomal positionwas then divided by the input value at the same position.Plots of PESCI data for individual genes represent averagevalues for each gene from two biological replicate experi-ments. Paired-end data are summarized in SupplementaryTable S1.
RESULTS
Previously, we mapped nucleosomes genome-wide in yeastcells by digesting nuclei with MNase and subjecting purifiedcore particle DNA to paired-end sequencing, which pro-vides the lengths of all the DNA fragments, after alignmentto the yeast genome. Induction by 3AT results in a majorloss of nucleosome occupancy from 49 genes, including thewell-studied ARG1 gene (19) (Figure 1A). This loss of oc-cupancy occurs over the entire coding region and, in somecases, spreads a significant distance into a flanking gene. Wesought to distinguish between three possible explanations:(i) Simple nucleosome loss. In this model, induction resultsin the complete removal of a large fraction of the nucleo-somes on these genes, resulting in stretches of protein-freeDNA that are highly accessible to MNase. (ii) Eviction ofH2A-H2B dimers from nucleosomes. In this model, (H3-H4)2 tetramers and/or (H3-H4)2/H2A-H2B hexamers re-main on the gene after induction, protecting significantlyshorter lengths of DNA than the intact nucleosome. (iii)Nucleosomes are conformationally altered after induction,such that their DNA is more accessible and digested fasterby MNase. The three models differ in their predictions con-cerning the effect of induction on the sizes of DNA frag-ments protected from MNase digestion and which histonesare retained or lost. Here we test these predictions, usingARG1 as a specific example and a set of strongly inducedgenes to obtain a general perspective.
Increased levels of subnucleosomal particles on inducedARG1
Our nucleosome occupancy maps indicate the distributionand relative levels of canonical nucleosomes, as defined byprotection of ∼147 bp from MNase. If other particles arepresent, protecting different lengths of DNA, they would
GPD2 ARG1 YOL057W
0
200
400
600Limit digest: Core particles
0
100
200
300
400
0
100
200
300
400
217000 219000 221000 2230000
50
100
150
No.
of s
eque
nces
incl
udin
g co
ordi
nate
nuc
leot
ide
(nor
mal
ized
to u
ntre
ated
sam
ple)
NDR
NDR
NDR
NDR
TSS TESA
B
C
D
Figure 1. Induction with 3AT correlates with increased levels ofsubnucleosome-sized particles on the ARG1 coding region. Occupancymaps for untreated (black line) and induced cells (green line). (A) Core par-ticles (limit digest). (B) Underdigested chromatin (50–180 bp fragments).(C) Mononucleosomes (140–180 bp) from underdigested chromatin. (D)Subnucleosomal particles (80–120 bp) from underdigested chromatin.Dashed lines: TSS and TES. Block arrow: NDR.
not be included, because the nucleosomal DNA was gel-purified prior to mapping. The models predict different de-grees of MNase sensitivity: nucleosome loss would result instretches of protein-free DNA and rapid digestion. Loss ofH2A-H2B dimers would result in tetrasomes and/or hexas-omes, which confer relatively weak protection of ∼80 and∼110 bp, respectively (2,32). The conformational changemodel predicts rapid destruction of nucleosomes due to amore accessible structure.
To address this question, we subjected significantly un-derdigested chromatin from untreated and induced cells topaired-end sequencing without gel purification. These sam-ples displayed a typical nucleosome ladder, with bands cor-responding to mono, di and trinucleosomes (Figure 2A).For comparison, we also mapped gel-purified core particleDNA from the same digestion series. The length distribu-tions of the core particle samples showed a major peak at
by guest on October 27, 2014
http://nar.oxfordjournals.org/D
ownloaded from

4 Nucleic Acids Research, 2014
0 100 200 300 400 5000
2
4
6
8Core particles
Length of sequenced DNA fragment (bp)
Per
cent
age
(%)
Untreated+3AT
0 100 200 300 400 5000
1
2
3Underdigested
Length of sequenced DNA fragment (bp)
Untreated+3AT
128 bp
150 bp
159 bp166 bp
148 149 bp
Dimers
A
B
Cor
e pa
rtic
les
Und
erdi
gest
ed
Cor
e pa
rtic
les
Und
erdi
gest
ed
160 bp 147 bp
MNase MNase
Digestion of nuclei with MNase Untreated Induced (+3AT)
Figure 2. Length distributions of MNase-digested DNA from untreatedand 3AT-induced cells. (A) Analysis of DNA extracted from nuclei di-gested with different amounts of MNase in an agarose gel stained withethidium bromide. The underdigested samples chosen for analysis repre-sent a compromise between the requirements for preservation of MNase-sensitive particles (short digestion times) and for identifying the particlesby their lengths, which is improved by removing protruding linker DNA(longer digestion times). The red box shows where the gel was cut to obtaincore particle DNA (MNase limit digest). (B) Lengths of DNA fragmentsderived from the gel in (A), as determined by paired-end sequencing. Thelength cut-off at 50 bp reflects the sequence read length of 50 bp.
148 or 149 bp, corresponding to core particles, and a mi-nor peak at 128 bp, corresponding to digestion within thenucleosome (Figure 2B). The underdigested samples gavea strong mononucleosome peak composed of subpeaks at150, 159 and 166 bp, corresponding to core particles andmononucleosomes with some protruding linker DNA, stillpresent because the relatively slow exonuclease activity ofMNase did not have time to remove it. In addition, therewere significant amounts of DNA shorter than the core par-ticle, although there were no clearly defined peaks at ∼80or ∼110 bp perhaps because, like mononucleosomes, tetra-somes and hexasomes have variable amounts of protrudingDNA. Given the rapid rate at which MNase digests protein-free DNA relative to chromatin, it is unlikely that theseshort DNA fragments represent partially digested protein-free DNA.
Nucleosome maps of ARG1 constructed using the coreparticle data confirmed our previous observations (19):induction resulted in a major loss of occupancy overthe entire ARG1 locus, extending both upstream of theNDR at the ARG1 promoter, such that the -1 nucleosomepeak was strongly reduced, and downstream of ARG1,into YOL057W, which has no known functional connec-tion to ARG1 (Figure 1A). However, the equivalent occu-pancy map for underdigested ARG1 obtained using DNAmolecules of 50–180 bp showed little loss of occupancy in
induced cells (Figure 1B), indicating that the DNA frag-ments missing from the induced core particle map (Fig-ure 1A) were present in the underdigested sample (Figure1B). To identify these DNA fragments, we sorted the un-derdigested samples into mononucleosomes (140–180 bp)and subnucleosomes (80–120 bp, reflecting the expected sizerange for tetrasomes and hexasomes) in silico. Mononucle-osomes gave the same result as core particles (Figure 1C).However, subnucleosomes increased over the ARG1 cod-ing region after induction (Figure 1D). Thus, the loss ofcanonical nucleosomes from ARG1 after induction can beaccounted for by an increase in subnucleosome-sized par-ticles, which might derive from hexasomes and tetrasomes,or from partially digested conformationally altered nucle-osomes. It is important to note that particles containing80–120 bp DNA could be subnucleosomes (tetrasomes andhexasomes), or large non-histone complexes (see below).
The maps also revealed that the NDRs at the ARG1and YOL057W promoters were occupied in the underdi-gested samples (Figure 1B). Both NDRs were apparentwhen only mononucleosomes were considered (Figure 1C),but there were peaks in subnucleosomal DNA fragments(Figure 1D), indicating that particles of subnucleosome sizeare present at the NDRs, as observed previously (33,34).
Differential loss of H2B relative to H4 from induced genes
The three models make different predictions concerningthe histones bound to induced genes: nucleosome removalwould result in loss of all four histones, dimer loss predictsloss of H2A and H2B but not of H3 and H4, whereas a con-formational change in the nucleosome predicts retention ofall four histones. To determine which histones are bound,we performed a modified ChIP-seq (‘Paired-end sequenc-ing of chromatin immunoprecipitates (PESCI)’) experimentusing yeast strains with HA-tagged H2B or HA-tagged H4.Untreated and induced cells were fixed with formaldehydein the usual way and sonicated to obtain short DNA frag-ments. After immunoprecipitation (IP), the DNA was sub-jected to paired-end sequencing. Histone occupancy mapscan be constructed for direct comparison with those ofMNase-digested samples. Furthermore, the resolution ofthe IP is higher for shorter DNA fragments and can be im-proved by selection in silico of just the shortest DNA frag-ments to construct the map. The length distributions of thePESCI inputs and IPs showed that the inputs had peaksat ∼90 bp, with a wide range of DNA fragments from 50to 500 bp, whereas the IP samples were longer on average,with peaks at ∼125 bp (Supplementary Figure S1). The rea-son for this difference in average length is unclear, althoughno difference was observed for the Rpb3 subunit of Pol II(see below). The partially cross-linked nucleosome might besomewhat protected against sonication, although the peakfragment length is well below the size of a nucleosome.There is also uncertainty over whether uncross-linked his-tones are removed from the DNA in the sonication buffer,which contains a mixture of detergents.
PESCI maps for H4 and H2B at ARG1 constructed us-ing only 50–150 bp fragments showed that there was a ma-jor loss of both histones from ARG1 after induction, witha significantly greater loss of H2B than of H4 over the cod-
by guest on October 27, 2014
http://nar.oxfordjournals.org/D
ownloaded from

Nucleic Acids Research, 2014 5
No.
of s
eque
nces
incl
udin
g co
ordi
nate
nuc
leot
ide
(nor
mal
ized
to u
ntre
ated
sam
ple)
GPD2 ARG1 YOL057W
0
50
100
150
200
250
0
50
100
150
200
250
0
50
100
150
200
250
217000 219000 221000 2230000
50
100
150
200
250
NDR
NDR
Figure 3. Induction of ARG1 by 3AT results in some loss of H4 and amajor loss of H2B over the coding region. PESCI ChIP for H4 and H2B.Occupancy maps constructed using 50–150 bp fragments (normalized tothe total aligned read-pair count for untreated cells and smoothed witha 21-bp moving average). Untreated (black line) and induced cells (greenline). Inputs are shown in separate panels for clarity.
ing region (Figure 3). This observation is consistent withthe presence of tetrasomes and/or hexasomes on inducedARG1. Theoretically, the input should give a flat line at aver-age genome coverage because all genomic DNA fragmentsshould be present. This was reasonably true at the ARG1 lo-cus; the variations can be attributed to PCR bias, or to dif-ferential sensitivity to sonication. The NDRs were severelydepleted of both histones, independently of induction, indi-cating that these NDRs are histone-free. The -1 nucleosome,located upstream of the ARG1 NDR, was clearly resolvedin untreated cells but was depleted of both histones to sim-ilar levels after induction. Thus, the -1 nucleosome was re-moved on induction, resulting in a wider NDR, extendedupstream. This is intriguing given that the known regula-tory elements––binding sites for the Gcn4 activator and theArg80 repressor (35)––are located within the narrow NDRthat exists prior to induction.
To determine whether differential loss of H2B relative toH4 was generally true for induced genes, we analyzed ourpreviously reported list of 49 genes with disrupted chro-
A
B
0 100 200 300 400 500 6000
100
200
300
400
500
600
H4 occupancy in untreated cells
ARG1
ICY2YPR036W-A
0 100 200 300 400 500 6000
100
200
300
400
500
600
H2B occupancy in untreated cells
LYS2YPR036W-A
ICY2ARG1
ARG4HIS4
0 100 200 300 400 500 6000
100
200
300
400
500
600
LYS2
H4 occupancy in untreated cells
H2B
occ
upan
cy in
unt
reat
ed c
ells
0 100 200 300 400 500 6000
100
200
300
400
500
600
ICY2ARG1
LYS2
ARG4YPR036W-A
C
D
Figure 4. Differential loss of H2B relative to H4 from highly induced genes.Analysis of 49 genes exhibiting major chromatin disruption (19). AverageH4 and H2B occupancies were calculated for the coding region of eachgene. The average value for each gene obtained from two biological repli-cate experiments was plotted. (A) H4 occupancy in untreated and inducedcells. (B) H2B occupancy in untreated and induced cells. (C) H2B versusH4 occupancy in untreated cells. (D) H2B versus H4 occupancy in inducedcells. Dashed line indicates no change in occupancy. Note: LYS2 is low inthe HA-H2B strain because part of the gene is deleted (lys2Δ).
matin structure, measured by loss of core particle occu-pancy using MNase (19). The average histone occupancyof each gene in untreated cells was compared with its av-erage occupancy in induced cells. Only the three most dis-rupted genes as measured by the MNase assay were obvi-ously depleted of H4 after induction (YPR036W-A, ICY2and ARG1) (Figure 4A). The other genes were either unaf-fected or perhaps slightly depleted of H4. In contrast, mostof the 49 genes were substantially depleted of H2B in in-duced cells (Figure 4B). Differential loss of H2B relativeto H4 after induction was clearly demonstrated in plots ofH2B occupancy against H4 occupancy for untreated and in-duced cells (Figure 4C and D). Moreover, H2B occupancycorrelated well with the extent of chromatin disruption mea-sured by MNase (Supplementary Figure S2).
In conclusion, our histone PESCI experiments indicatethat H2B is differentially lost from induced genes, suggest-ing that many nucleosomes have lost one or both of theirH2A-H2B dimers. The fact that a few genes are also de-pleted of some H4 indicates that some nucleosomes arecompletely removed from these genes. Thus, some completenucleosomes (H4 loss) and more H2A-H2B dimers are lostfrom ARG1, ICY2 and YPR036W-A after induction, butmost induced genes show significant loss of H2B only.
Queued polymerases on induced genes
The role of Pol II in chromatin disruption was addressedby PESCI using an antibody against the Rpb3 subunit. Thelength distributions for inputs and IPs were almost identi-cal, with a peak at ∼100 bp and ranging from 50 to 500 bp
by guest on October 27, 2014
http://nar.oxfordjournals.org/D
ownloaded from

6 Nucleic Acids Research, 2014
GPD2 ARG1 YOL057W
217000 219000 221000 2230000
20
40
60
Chromosome XV coordinate (bp)No.
of s
eque
nces
incl
udin
gco
ordi
nate
nuc
leot
ide
(nor
mal
ized
to u
ntre
ated
)
Rpb3 IP (untreated)Rpb3 IP (+3AT)Input (untreated)Input (+3AT)
Limit digest: Core particles
3
4TES
Distance from TES (bp)
3
4TSS
Distance from TSS (bp)
IP/In
put
(nor
m. t
o ge
nom
e av
erag
e)
Rpb3 IP/Input (untreated)
Rpb3 IP/Input (+3AT)
0 6
0
6
SNZ1HIS4
ARG1
Log (Rpb3 occupancy in untreated cells)Log
A
B
C
Figure 5. Pol II accumulates at the 3′-ends of induced genes. PESCI forthe Rpb3 subunit. (A) Pol II occupancy map for ARG1 constructed using50–150 bp fragments. (B) Global analysis of average Pol II occupancy onthe coding region in untreated and induced cells for 4145 genes. The valuefor each gene is the average of two biological replicate experiments (Pear-son correlation coefficients for the replicates were 0.94 for both untreatedcells and induced cells). Individual genes are marked by blue circles; thecoloring indicates increased density of spots (red is maximum). The dataare plotted on a log2 scale; red dashed lines represent 2-fold change. Twohundred seventy-two genes were activated > 2-fold by 3AT. (C) Distribu-tion of Pol II relative to the TSS and TES for 244 genes induced > 2-foldand longer than 500 bp.
(Supplementary Figure S3A). Induction resulted in a hugeincrease in the amount of Pol II bound to the ARG1 codingregion (Figure 5A). In contrast, there was relatively little PolII at the ARG1 TSS. Furthermore, Pol II was very high evendownstream of the ARG1 TES, suggesting that Pol II over-shot the TES and invaded YOL057W. This overshoot wasnot due to long DNA fragments in the IP, because the Pol IIpeak extends up to ∼350 bp downstream of the ARG1 TESand the map is composed of 50–150 bp fragments.
An alternative explanation for the Pol II peak at theYOL057W promoter is that it represents Pol II waiting totranscribe YOL057W, but this is unlikely because the peakwas not present in untreated cells. Another interpretationis that the overshoot peak represents paused Pol II readyto transcribe the ARG1 anti-sense transcript, which is ini-tiated in the 3’-UTR (36). This possibility is more difficultto rule out, but the same observations were true of HIS4,another gene strongly induced by 3AT (Supplementary Fig-ure S3B), which has no anti-sense transcript (37). Instead,we propose that the Pol II overshoot peak represents Pol II
waiting to dissociate from the DNA and that dissociation israte-limiting for transcription of ARG1 and HIS4.
To determine the generality of our observations forARG1 and HIS4, we identified strongly induced genes bycomparing the average Pol II occupancy on the coding re-gions of all genes in untreated and induced cells (Figure 5B).In induced cells, ARG1 was actually the most heavily tran-scribed gene, and HIS4 was also very heavily transcribed.Of the 49 genes that show reduced nucleosome occupancyafter induction (>25% loss) mentioned above (19), 35 haveassociated TSS/TES data (31); 28 of these 35 (80%) wereinduced >2-fold (defined by increased Rpb3 occupancy be-tween the TSS and the TES). We analyzed the Pol II distri-bution on the 244 genes that were induced >2-fold (abovethe upper dashed line in Figure 5B) with coding regions>500 bp (Figure 5C). Relative to the TSS, the level of PolII at the promoter was low and increased to a high plateauover distal coding regions in induced cells. Relative to theTES, the level of Pol II was high over the distal coding re-gion, there was a slight decrease near the TES itself and anovershoot peak ∼140 bp downstream of the TES in inducedcells. The implication is that Pol II elongation complexes up-stream of the TES are queued, waiting for the terminatingPol II to dissociate.
High Pol II density correlates with differential loss of H2B
The relationship between high levels of transcription andloss of H2A-H2B dimers was addressed by correlating theoccupancy levels of H4 and H2B with those of Pol II on in-duced genes. There was no correlation between the levels ofH4 and Pol II in untreated or induced cells, with little loss ofH4 from any induced genes except ARG1 (Figure 6A). Thiswas also true for H2B in untreated cells, because inducedgenes are not heavily transcribed in the absence of 3AT.In contrast, there was a strong inverse correlation betweenH2B and Pol II levels in induced cells (Figure 6A). Thus,Pol II density correlates with loss of H2A-H2B dimers.
Analysis of nucleosome phasing on induced genes re-vealed substantial 3AT-dependent disruption on both sidesof the TSS, with reduced core particle signal consistent withloss of nucleosomes from these genes (Figure 6B), as ob-served previously (20). Increased levels of 80–120 bp par-ticles were present in the NDR and upstream of the NDR(Figure 6C). If inverted, the shape of the 80–120 bp parti-cle peak is an approximate match for the shape of the NDR(Figure 6B), implying that these particles fill the NDR. Asimilar analysis of H4 occupancy revealed H4 phasing inuntreated cells (Figure 6D), providing confirmation of nu-cleosome phasing independent of MNase. H4 phasing wasweaker in induced cells, with a slight reduction in the +1nucleosome and a slight expansion of the NDR upstream,as observed for core particles (Figure 6B). However, unlikecore particles, there was little loss of H4 over the codingregion. In contrast, H2B occupancy was significantly re-duced over the coding region (P-value < 0.001, Welch’s t-test) and upstream in induced cells (Figure 6E). Thus, H2Boccupancy correlates more precisely with core particle oc-cupancy than H4, as expected if there is a differential loss ofH2A-H2B dimers, resulting in disassembly of core particles.In untreated cells, the much weaker phasing of H2B relative
by guest on October 27, 2014
http://nar.oxfordjournals.org/D
ownloaded from

Nucleic Acids Research, 2014 7
Core particles
Distance from TSS (bp)
Occ
upan
cy
Untreated+3AT
H4
Distance from TSS (bp)
IP/In
put
Untreated+3AT
2
H2B
Distance from TSS (bp)
IP/In
put
Untreated+3AT
A
B
D
C
E
0 1 2 3 4 50
0.2
0.4
0.6
0.8
1
1.2
H4 untreated
R2 = 0.075
0 1 2 3 4 50
0.2
0.4
0.6
0.8
1
1.2
H2B untreated
R2 = 0.007
0 5 10 15 200
0.2
0.4
0.6
0.8
1
1.2
H4 + 3AT
R2 = 0.011
0 5 10 15 200
0.2
0.4
0.6
0.8
1
1.2
H2B + 3AT
R2 = 0.494
Pol II density (IP/input, norm. to average)
His
tone
occ
upan
cy (
IP/in
put,
norm
. to
aver
age)
Figure 6. Pol II density correlates with differential loss of H2B from in-duced genes. (A) Strong inverse correlation between Pol II and H2B levelson 244 genes induced by 3AT > 2-fold and longer than 500 bp (ICY2 andYPR036W-A are shorter than 500 bp and are therefore not included). Oc-cupancy phasing analysis on the induced genes relative to the TSS: (B)Nucleosome core particles (140–160 bp). (C) 80–120 bp particles in under-digested chromatin. (D) H4 (50–150 bp fragments). (E) H2B (50–150 bpfragments).
to H4 might reflect the fact that the two H2B molecules ina nucleosome are farther apart than the two H4 molecules,resulting in a broader signal (clear phasing of H2B was ob-served using dyad phasing analysis, which has higher res-olution; see below). Finally, both H4 and H2B (Figure 6Dand E) showed a trough at the NDR similar to that observedfor core particles (Figure 6B), with no peak correspondingto the subnucleosomal particles (Figure 6C), indicating thatthe 80–120 bp particles in these NDRs do not contain H4or H2B and are therefore non-histone complexes.
0 0.5 1 1.50
0.5
1
1.5
All genes
0 0.5 1 1.50
0.5
1
1.5
All genes
0 0.5 1 1.50
0.5
1
1.5
Inducible genes
0 0.5 1 1.50
0.5
1
1.5
Induced genes
0 0.5 1 1.50
0.5
1
1.5
Heavily transcribed genes
0 0.5 1 1.50
0.5
1
1.5
Heavily transcribed genes
3AT–induced cells
Untreated cells
H4 occupancy (IP/input, norm. to average)
H4 occupancy (IP/input, norm. to average)
H2B
occ
upan
cy (
IP/in
put,
norm
. to
aver
age)
A
B
C
D
E
F
Figure 7. Heavily transcribed genes show reduced levels of H2B relative toH4. Scatter plots comparing H2B occupancy with H4 occupancy for allgenes longer than 500 bp: (A) Untreated cells; (B) 3AT-induced cells; (C)As in (A), but with the 244 inducible genes (black circles) superimposedon the plot for all genes (gray circles); (D) As in (B), but with the 244 3AT-induced genes superimposed (green circles); (E) As in (A), but with the250 most heavily transcribed genes in untreated cells superimposed (redcircles); (F) As in (B), but with the 250 most heavily transcribed genes in3AT-induced cells superimposed (red circles).
Heavily transcribed genes also show differential loss of H2Band queued polymerases
We have shown that, for induced genes, Pol II density cor-relates with loss of H2B (Figure 6). Is this effect peculiar togenes induced by 3AT, or is it a general property of heavilytranscribed genes? We constructed scatter plots to comparethe average H2B occupancy of a gene with its average H4 oc-cupancy in untreated cells (Figure 7A) and in induced cells(Figure 7B). Most, but not all, of the genes had occupan-cies close to the normalized average value of 1. The histoneoccupancy values of the 244 inducible genes in untreatedcells were superimposed on the scatter plot for untreatedcells (compare Figure 7C with Figure 7A): these genes showa distribution of values similar to that for all genes, as ex-pected, because most of them are poorly transcribed in theabsence of 3AT. For comparison, the histone occupancyvalues of the 244 induced genes in induced cells were super-imposed on the scatter plot for induced cells (compare Fig-ure 7D with Figure 7B): many induced genes shift to lowerH2B occupancy and a few also show lower H4 occupancy.Some genes show little shift (as in Figure 6A), most likelybecause a high level of induction does not necessarily re-sult in a high level of transcription: a gene can be stronglyinduced but still only transcribed at moderate levels. Conse-quently, we examined heavily transcribed genes in both un-treated and induced cells. We identified the 250 genes withthe highest Pol II density in untreated cells and in inducedcells; 123 genes appeared in both lists (49%), indicating thatthey are heavily transcribed independently of 3AT. Their hi-stone occupancy values were superimposed on the scatterplots for untreated and induced cells (compare Figure 7Ewith 7A and Figure 7F with 7B). In both cases, it is clear
by guest on October 27, 2014
http://nar.oxfordjournals.org/D
ownloaded from

8 Nucleic Acids Research, 2014
that heavily transcribed genes tend to be depleted of H2Band a few genes also show some loss of H4. This differ-ential loss of H2B from heavily transcribed genes in bothuntreated and induced cells was confirmed by plots of aver-age histone occupancy against average Pol II density (Sup-plementary Figure S4; compare with Figure 6A). Thus, like3AT-induced genes, heavily transcribed genes exhibit a dif-ferential loss of H2B relative to H4, reinforcing the correla-tion between Pol II density and H2B loss.
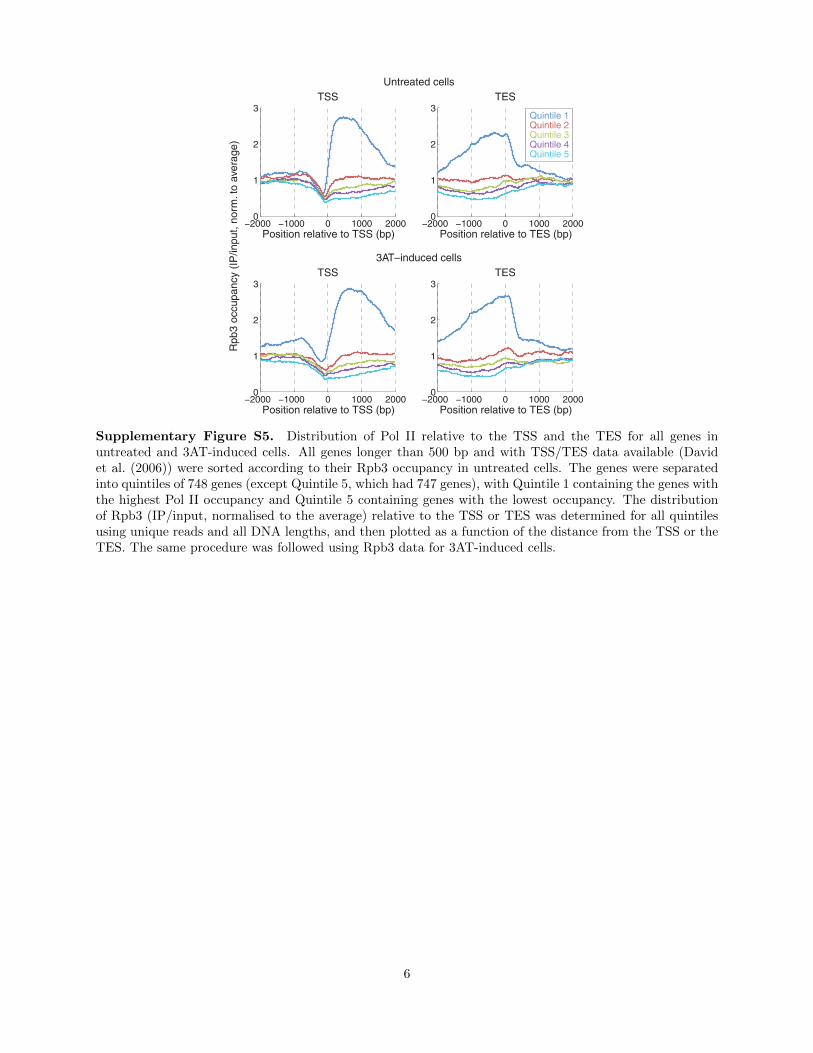
We also asked whether the two surprising characteristicsof the Pol II distribution––low levels at the promoter andhigh levels post-TES––are properties of heavily transcribedgenes, or whether they are peculiar to 3AT-induced genes.For both untreated and induced cells, all genes were sortedaccording to their Pol II density and then divided into quin-tiles, such that the first quintile contained the most tran-scribed genes and the last quintile contained the least tran-scribed genes. The distribution of Pol II relative to the TSSor the TES was then calculated as an IP/input ratio (Supple-mentary Figure S5). As observed for induced genes (Figure5C), the most heavily transcribed genes (quintile 1) in bothuntreated and induced cells, showed the lowest Pol II lev-els at promoters (TSS plots) and the highest levels on bothsides of the TES, with significant overshoot (TES plots).The amount of Pol II on the genes in the other quintilesis much lower than for quintile 1, although the plots are inthe order expected from the sort. The disproportionate ge-nomic distribution of Pol II has been commented on previ-ously (38). We conclude that our observations for inducedgenes are generally true for heavily transcribed genes.
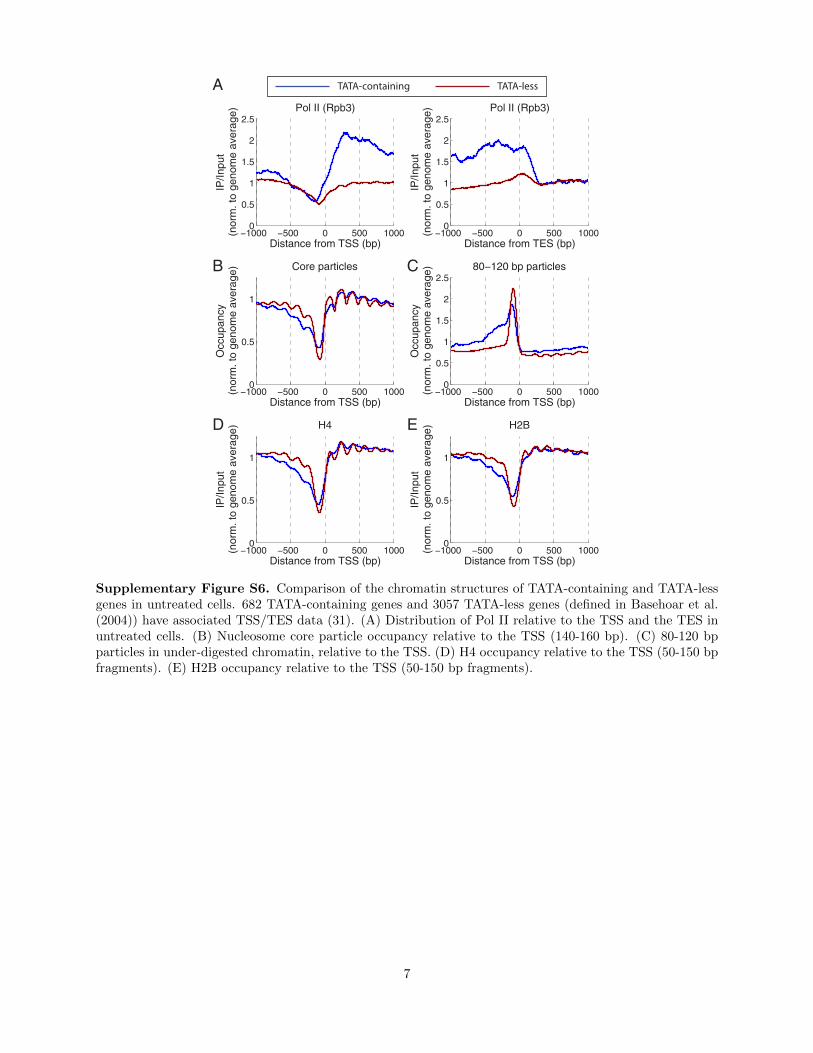
In addition, we asked whether the chromatin structure ofTATA box-containing genes (regulated by the SAGA com-plex and mostly inducible) is different from that of geneslacking TATA boxes (regulated by TFIID and mostly con-stitutively expressed) (39). On average, TATA-containinggenes displayed the characteristics of highly active genes:high Pol II over the coding region and around the TES,a wider NDR and weaker phasing, and a slight decreasein H2B relative to H4 (Supplementary Figure S6). Theseobservations can be explained by the fact that TATA-containing genes are enriched for highly transcribed genesrelative to TATA-less genes (23% of the TATA-containinggenes are in the most highly transcribed gene quintile (seeSupplementary Figure S5); only 10% of the TATA-lessgenes are present in this quintile). Consequently, the dif-ference in chromatin structure between TATA-containingand TATA-less genes can be accounted for by the fact thatTATA-containing genes have a higher proportion of heavilytranscribed genes.
DISCUSSION
Induced genes show differential loss of H2B from coding re-gions
Our initial aim was to understand the structural basis of theloss of nucleosome occupancy from genes induced by 3AT.We considered three models: loss of complete nucleosomes,loss of H2A-H2B dimers or a conformational change. Atinduced ARG1, we observed an increase in particles of sub-nucleosomal size, reduced H4 and a larger reduction in H2B(Figure 8A). These observations are consistent with a lim-
GPD2 ARG1 YOL057W
217000 219000 221000 2230000
200
400
600Untreated
Chromosome XV coordinate (bp)
Core particles
217000 219000 221000 2230000
200
400
600+3AT
Chromosome XV coordinate (bp)
Core particles
Num
ber
of s
eque
nces
incl
udin
g co
ordi
nate
nuc
leot
ide
(nor
mal
ized
to c
ore
part
icle
s)
Pol II recycling?
SLOW bindingof Pol II
SLOW dissociationof Pol II
Pol II overshoots the TESand piles up
RAPID initiation andpromoter clearance
TSS TES
Non-histone complexesHistone octamer
Histone hexamer
Histone tetramer RNA polymerase II (Pol II)
Differential loss ofH2A-H2B dimers
Runaway Pol II?
A
B
Figure 8. Chromatin structure of a heavily transcribed gene. (A) Summaryof data for the ARG1 locus in untreated and induced cells: core particles,80–120 bp particles, H4, H2B and Pol II. All data were normalized to thenumber of sequences obtained for untreated core particles and smoothedusing a 21-bp moving average. (B) Model: The NDR is expanded upstreamto accommodate additional non-histone complexes (both H4 and H2B arepartially lost). Pol II binds near the TSS and clears the promoter rapidly(low Pol II at the TSS). Pol II levels over the remainder of the gene are highand coincide with some loss of H4 and heavy loss of H2B, resulting in sub-nucleosomal particles (tetrasomes and hexasomes). Pol II overshoots theTES and accumulates ∼140 bp downstream, sometimes farther (‘runaway’Pol II). Accumulation of Pol II downstream of the TES implies that dis-sociation from DNA is relatively slow, such that more Pol II queues upbehind it. Slow dissociation might facilitate transfer of Pol II back to thepromoter (‘recycling’), increasing the transcription rate.
ited loss of complete nucleosomes (reduced H4 and H2B)and loss of H2A-H2B from some of the remaining nucleo-somes (greater loss of H2B), resulting in tetrasomes and/orhexasomes. Thus, our data support a combination of thefirst two models for ARG1 and a few other very heavily tran-scribed genes. However, genes with somewhat lower Pol IIdensity exhibit a major loss of H2B but not of H4, indi-cating that H2A-H2B dimer loss is predominant. The dis-turbance of the chromatin structure of flanking genes canbe explained by expansion of the NDR upstream of the in-duced gene and by invasion of the downstream gene by PolII prior to dissociation.
Increased levels of subnucleosome-sized particles overthe coding regions of induced genes are consistent withtetrasomes and/or hexasomes but when considered alone,do not prove that they are present. This is because theyconfer weaker protection from MNase than complete nu-cleosomes and so must be detected in underdigested sam-ples, in which protruding linker DNA has not yet been re-moved from the particles by MNase, making it difficult to be
by guest on October 27, 2014
http://nar.oxfordjournals.org/D
ownloaded from

Nucleic Acids Research, 2014 9
certain that they protect the characteristic lengths of DNA(∼80 and ∼110 bp). Indeed, alternative interpretations arethat the shorter protected DNA fragments derive from in-ternal digestion of intact nucleosomes, or from stable non-histone complexes. However, our histone-PESCI data showthat there are higher levels of H4 than of H2B on codingregions, leading to the conclusion that some particles mustlack one or both of their H2A-H2B dimers. It should benoted that the tetrasomes and hexasomes are not necessar-ily compact; they might be unfolded. In addition, we can-not distinguish between the conventional tetrasome, whichcontains negatively wrapped DNA, and the reversome (40),which contains positively wrapped DNA, because both arecompact and should protect similar lengths of DNA fromdigestion.
Our data are consistent with a genome-wide tiling-arraystudy (13) showing a similar, limited loss of H4 from codingregions that correlates with transcription level (neither H2Anor H2B was measured in this study). ChIP studies of theactive yeast GAL genes indicate that both H2B and H4 arereduced to similar levels on the coding regions, suggestingthat complete nucleosome displacement occurs (6,11,12).However, we observe a greater loss of H2B relative to H4.The fact that this differential loss is not observed at the GALgenes might reflect their extreme activity in galactose, suchthat complete nucleosome loss is predominant. In conclu-sion, we have demonstrated that loss of H2A-H2B dimers,not complete nucleosome loss, is the predominant conse-quence of transcription.
The disruption of the coding region chromatin that weobserve on heavily transcribed genes can be accountedfor by in vitro experiments showing that a single passagethrough a nucleosome by Pol II results in displacement ofone H2A-H2B dimer, whereas multiple passages, expectedat high Pol II density, result in complete nucleosome loss(3,4). Consistent with this, exogenous RNA polymerase IIpreferentially displaces H2A-H2B dimers from nucleosomecore particles derived from active genes (41). Our observa-tion that genes with lower Pol II density show proportion-ately reduced H2B loss and only marginal loss of H4 is con-sistent with this scenario. In vivo, exchange of all four hi-stones occurs at highly transcribed genes (7–9), indicatingthat nucleosomes are not just disassembled on active genesbut are also re-assembled. Histone exchange occurs mostoften at promoters but also happens on coding regions, fa-cilitated by elongation factors, histone chaperones and his-tone acetylation (5–7,10,11,42). Exchange of H2A and H2Bis much more rapid than that of H3 and H4 (43,44), consis-tent with our observation that much more H2B is displacedthan H4. The fact that we can detect subnucleosomes on ac-tive coding regions indicates that re-assembly of H2A-H2Bdimers into nucleosomes is relatively slow. The molecularmechanism by which dimers are replaced in vivo is unclear,but is likely to involve histone chaperones, Spt6 and/or theFACT complex (reviewed in ref. 21).
Slow dissociation after transcription results in queued poly-merases
Transcription involves several steps: recruitment of Pol IIto form a ‘closed’ preinitiation complex (PIC), melting of
promoter DNA to form the ‘open’ initiation complex, ini-tiation, a conformational change to form a stable elonga-tion complex, elongation and perhaps pausing, terminationand dissociation. The paradigm for transcriptional regula-tion has been that initiation is the slowest step and thereforethe natural target for regulation (45). More recently, it wasdiscovered that many genes in higher eukaryotes are associ-ated with a Pol II elongation complex paused in the vicinityof the +1 nucleosome (46). Single-gene studies in higher eu-karyotes show that, on some genes, Pol II overshoots theTES and pauses several hundred base pairs downstream,where it binds mRNA processing factors prior to termina-tion (47). Genome-wide, the distribution of Pol II on highereukaryotic genes is consistent with these studies, showing alarge Pol II peak around the TSS and relatively low Pol IIlevels along the gene (48,49). A small subset of genes ex-hibits a strong peak in the termination region, but there areno queued polymerases (48,49).
In yeast, relatively low-resolution ChIP-on-chip studieshave demonstrated the expected correlation between theamount of Pol II on coding regions and mRNA levels (50).More recently, higher resolution microarray studies haveshown that some highly transcribed genes accumulate Pol IIdownstream of the TES, which could reflect either slow dis-sociation or anti-sense transcription (38,51,52). Our high-resolution Pol II PESCI data extend and clarify these find-ings, by examining the effect of induction on Pol II distribu-tion, rather than by correlation with expression data. Sur-prisingly, we find that the lowest level of Pol II is at the TSS,suggesting that initiation is not rate-limiting. However, ifPol II promoter binding is very slow, rapid initiation andpromoter clearance might be important, making the pro-moter immediately available to bind another Pol II. The factthat Pol II is not in direct contact with DNA in the ini-tial form of the PIC (53) should also be considered, sinceit might result in inefficient cross-linking of Pol II to DNAand underestimate the amount of Pol II bound at the pro-moter. The highest levels of Pol II occur just upstream of theTES and ∼140 bp downstream of the TES, indicating thatPol II overshoots the TES and is slow to dissociate fromthe DNA. It will be important to examine whether Pol IIbinding downstream of the TES is functional, perhaps bydemonstrating the presence of the melted DNA indicativeof open complex formation.
In summary, we propose that Pol II dissociation is theslowest step in transcription of heavily transcribed genes.The delay in dissociation results in a queue of polymeraseson the gene, waiting to complete transcription and then dis-sociate in turn. It is likely that this polymerase queue con-tributes to chromatin disruption, because Pol II is a largecomplex and physically occupies more DNA than a typicallinker in yeast: either each polymerase is paused within adisrupted nucleosome, or some nucleosomes must be par-tially or completely removed in order to accommodate it(Figure 8B).
ACCESSION NUMBERS
GEO database GSE54524.
by guest on October 27, 2014
http://nar.oxfordjournals.org/D
ownloaded from

10 Nucleic Acids Research, 2014
SUPPLEMENTARY DATA
Supplementary Data are available at NAR Online.
ACKNOWLEDGMENTS
We thank Gary Felsenfeld, Alan Hinnebusch, Vasily Studit-sky and Carl Wu for helpful comments on the manuscript.We thank the NHLBI Core Facility (Yoshi Wakabayashi,Yan Luo, Ting Ni and Jun Zhu) for paired-end sequenc-ing, Namrita Dhillon and Rohinton Kamakaka for yeaststrains with HA-tagged H4 and H2B, and Bruce Howardand Nguyet Dang for help with bioinformatic analysis.
FUNDING
Intramural Research Program of the National Institutesof Health (NICHD). Funding for open access charge: In-tramural Research program of the National Institutes ofHealth (NICHD).Conflict of interest statement. None declared.
REFERENCES1. Luger,K., Mader,A.W., Richmond,R.K., Sargent,D.F. and
Richmond,T.J. (1997) Crystal structure of the nucleosome coreparticle at 2.8 A resolution. Nature, 389, 251–260.
2. Camerini-Otero,R.D., Sollner-Webb,B. and Felsenfeld,G. (1976) Theorganization of histones and DNA in chromatin: evidence for anarginine-rich histone kernel. Cell, 8, 333–347.
3. Kireeva,M.L., Walter,W., Tchernajenko,V., Bondarenko,V.,Kashlev,M. and Studitsky,V.M. (2002) Nucleosome remodelinginduced by RNA polymerase II: loss of the H2A/H2B dimer duringtranscription. Mol. Cell, 9, 541–552.
4. Kulaeva,O.I., Hsieh,F. and Studitsky,V.M. (2010) RNA polymerasecomplexes cooperate to relieve the nucleosomal barrier and evicthistones. Proc. Natl Acad. Sci. U.S.A., 107, 11325–11330.
5. Kaplan,C.D., Laprade,L. and Winston,F. (2003) Transcriptionelongation factors repress transcription initiation from cryptic sites.Science, 301, 1096–1099.
6. Schwabish,M.A. and Struhl,K. (2006) Asf1 mediates histone evictionand deposition during elongation by RNA polymerase II. Mol. Cell,22, 415–422.
7. Rufiange,A., Jacques,P.E., Bhat,W., Robert,F. and Nourani,A. (2007)Genome-wide replication-independent histone H3 exchange occurspredominantly at promoters and implicates H3 K56 acetylation andAsf1. Mol. Cell, 27, 393–405.
8. Dion,M.F., Kaplan,T., Kim,M., Buratowski,S., Friedman,N. andRando,O.J. (2007) Dynamics of replication-independent histoneturnover in budding yeast. Science, 315, 1405–1408.
9. Jamai,A., Imoberdorf,R.M. and Strubin,M. (2007) Continuoushistone H2B and transcription-dependent histone H3 exchange inyeast cells outside of replication. Mol. Cell, 25, 345–355.
10. Jamai,A., Puglisi,A. and Strubin,M. (2009) Histone chaperone Spt16promotes redeposition of the original H3–H4 histones evicted byelongating RNA polymerase. Mol. Cell, 35, 377–383.
11. Schwabish,M.A. and Struhl,K. (2004) Evidence for eviction andrapid deposition of histones upon transcriptional elongation byRNA polymerase II. Mol. Cell. Biol., 24, 10111–10117.
12. Kristjuhan,A. and Svejstrup,J.Q. (2004) Evidence for distinctmechanisms facilitating transcript elongation through chromatin invivo. EMBO J., 23, 4243–4252.
13. Lee,C.K., Shibata,Y., Rao,B., Strahl,B.D. and Lieb,J.D. (2004)Evidence for nucleosome depletion at active regulatory regionsgenome-wide. Nat. Genet., 36, 900–905.
14. Boeger,H., Griesenbeck,J., Strattan,J.S. and Kornberg,R.D. (2004)Removal of promoter nucleosomes by disassembly rather thansliding in vivo. Mol. Cell, 14, 667–673.
15. Field,Y., Kaplan,N., Fondufe-Mittendorf,Y., Moore,I.K., Sharon,E.,Lubling,Y., Widom,J. and Segal,E. (2008) Distinct modes of
regulation by chromatin encoded through nucleosome positioningsignals. PLoS Comp. Biol., 4, e1000216.
16. Shivaswamy,S., Bhinge,A., Zhao,Y., Jones,S., Hirst,M. and Iyer,V.R.(2008) Dynamic remodeling of individual nucleosomes across aeukaryotic genome in response to transcriptional perturbation.PLoS Biol., 6, e65.
17. Zawadzki,K.A., Morozov,A.V. and Broach,J.R. (2009)Chromatin-dependent transcription factor accessibility rather thannucleosome remodeling predominates during global transcriptionalrestructuring in Saccharomyces cerevisiae. Mol. Biol. Cell, 20,3503–3513.
18. Weiner,A., Hughes,A., Yassour,M., Rando,O.J. and Friedman,N.(2010) High-resolution nucleosome mapping revealstranscription-dependent promoter packaging. Genome Res., 20,90–100.
19. Cole,H.A., Howard,B.H. and Clark,D.J. (2011) Activation-induceddisruption of nucleosome position clusters on the coding regions ofGcn4-dependent genes extends into neighbouring genes. NucleicAcids Res., 39, 9521–9535.
20. Cui,F., Cole,H.A., Clark,D.J. and Zhurkin,V.B. (2012)Transcriptional activation of yeast genes disrupts intragenicnucleosome phasing. Nucleic Acids Res., 40, 10753–10764.
21. Rando,O.J. and Winston,F. (2012) Chromatin and transcription inyeast. Genetics, 190, 351–387.
22. Natarajan,K., Meyer,M.R., Jackson,B.M., Slade,D., Roberts,C.,Hinnebusch,A.G. and Marton,M.J. (2001) Transcriptional profilingshows that Gcn4p is a master regulator of gene expression duringamino acid starvation in yeast. Mol. Cell. Biol., 21, 4347–4368.
23. Hinnebusch,A.G. and Natarajan,K. (2002) Gcn4, a master regulatorof gene expression, is controlled at multiple levels by diverse signalsof starvation and stress. Eukaryot Cell, 1, 22–32.
24. Natarajan,K., Jackson,B.M., Zhou,H., Winston,F. andHinnebusch,A.G. (2001) Transcriptional activation by Gcn4 involvesindependent interactions with the SWI/SNF complex and theSRB/mediator. Mol. Cell, 4, 657–664.
25. Kim,Y., McLaughlin,N., Lindstrom,K., Tsukiyama,T. andClark,D.J. (2006) Activation of Saccharomyces cerevisiae HIS3results in Gcn4p-dependent, SWI/SNF-dependent mobilization ofnucleosomes over the entire gene. Mol. Cell. Biol., 26, 8607–8622.
26. Nagarajavel,V., Iben,J.R., Howard,B.H., Maraia,R.J. and Clark,D.J.(2013) Global ‘bootprinting’ reveals the elastic architecture of theyeast TFIIIB-TFIIIC transcription complex in vivo. Nucleic AcidsRes., 41, 8135–8143.
27. Eriksson,P.R., Ganguli,D. and Clark,D.J. (2011) Spt10 and Swi4control the timing of histone H2A/H2B gene activation in buddingyeast. Mol. Cell. Biol., 31, 557–572.
28. Cole,H.A., Howard,B.H. and Clark,D.J. (2012) Genome-widemapping of nucleosomes in yeast using paired-end sequencing.Methods Enzymol., 513, 145–168.
29. Cole,H.A., Howard,B.H. and Clark,D.J. (2011) The centromericnucleosome of budding yeast is perfectly positioned and covers theentire centromere. Proc. Natl Acad. Sci. U.S.A., 108, 12687–12692.
30. Ganguli,D., Chereji,R.V., Iben,J.R., Cole,H.A. and Clark,D.J. (2014)RSC-dependent constructive and destructive interference betweenopposing arrays of phased nucleosomes in yeast. Genome Res., 24 ,1637–1649.
31. David,L., Huber,W., Granovskaia,M., Toedling,J., Palm,C.J.,Bofkin,L., Jones,T., Davis,R.W. and Steinmetz,L.M. (2006) Ahigh-resolution map of transcription in the yeast genome. Proc. NatlAcad. Sci. U.S.A., 103, 5320–5325.
32. Studitsky,V.M., Clark,D.J. and Felsenfeld,G. (1994) A histoneoctamer can step around a transcribing polymerase without leavingthe template. Cell, 76, 371–382.
33. Kent,N.A., Adams,S., Moorhouse,A. and Paszkiewicz,K. (2011)Chromatin particle analysis: a method for comparative chromatinstructure analysis using paired-end mode next-generation DNAsequencing. Nucleic Acids Res., 39, e26.
34. Henikoff,J.G., Belsky,J.A., Krassovsky,K., MacAlpine,D.M. andHenikoff,S. (2011) Epigenome characterization at single base-pairresolution. Proc. Natl Acad. Sci. U.S.A., 108, 18318–18323.
35. Yoon,S. and Hinnebusch,A.G. (2009) Mcm1p binding sites in ARG1positively regulate Gcn4p binding and SWI/SNF recruitment.Biochem. Biophys. Res. Commun., 381, 123–128.
by guest on October 27, 2014
http://nar.oxfordjournals.org/D
ownloaded from

Nucleic Acids Research, 2014 11
36. Crisucci,E.M. and Arndt,K.M. (2012) Paf1 restricts Gcn4occupancy and antisense transcription at the ARG1 promoter. Mol.Cell. Biol., 32, 1150–1163.
37. Yassour,M., Pfiffner,J., Levin,J.Z., Adiconis,X., Gnirke,A.,Nusbaum,C., Thompson,D., Friedman,N. and Regev,A. (2010)Strand-specific RNA sequencing reveals extensive regulated longantisense transcripts that are conserved across yeast species. GenomeBiol., 11, R87.
38. Venters,B.J. and Pugh,B.F. (2009) A canonical promoterorganization of the transcription machinery and its regulators in theSaccharomyces genome. Genome Res., 19, 360–371.
39. Basehoar,A.D., Zanton,S.J. and Pugh,P.F. (2004) Identification anddistinct regulation of yeast TATA box-containing genes. Cell, 116,699–709.
40. Lavelle,C. and Prunell,A. (2007) Chromatin polymorphism and thenucleosome superfamily. Cell Cycle, 6, 2113–2119.
41. Baer,B.W. and Rhodes,D. (1983) Eukaryotic RNA polymerase IIbinds to nucleosome cores from transcribed genes. Nature, 301,482–488.
42. Govind,C.K., Qiu,H., Ginsburg,D.S., Ruan,C., Hofmeyer,K., Hu,C.,Swaminathan,V., Workman,J.L., Li,B. and Hinnebusch,A.G. (2010)Phosphorylated Pol II CTD recruits multiple HDACs, includingRpd3C(S), for methylation-dependent deacetylation of ORFnucleosomes. Mol. Cell, 39, 234–246.
43. Kimura,H. and Cook,P.R. (2001) Kinetics of core histones in livinghuman cells: little exchange of H3 and H4 and some rapid exchangeof H2B. J. Cell Biol., 153, 1341–1353.
44. Thiriet,C. and Hayes,J.J. (2005) Replication-independent corehistone dynamics at transcriptionally active loci in vivo. Genes Dev.,19, 677–682.
45. Wade,J.T. and Struhl,K. (2008) The transition from transcriptionalinitiation to elongation. Curr. Opin. Genet. Dev., 18, 130–136.
46. Adelman,K. and Lis,J. (2012) Promoter-proximal pausing of RNApolymerase II: emerging roles in metazoans. Nat. Rev. Genet., 13,720–731.
47. Mischo,H.E. and Proudfoot,N.J. (2013) Disengaging polymerase:terminating RNA polymerase II transcription in budding yeast.Biochim. Biophys. Acta, 1829, 174–185.
48. Grosso,A.R., de Almeida,S.F., Braga,J. and Carmo-Fonseca,M.(2012) Dynamic transitions in RNA polymerase II density profilesduring transcription termination. Genome Res., 22, 1447–1456.
49. Le Martelot,G., Canella,D., Symul,L., Migliavacca,E., Gilardi,F.,Liechti,R., Martin,O., Harshman,K., Delorenzi,M., Desvergne,B.et al. (2012) Genome-wide RNA polymerase II profiles and RNAaccumulation reveal kinetics of transcription and associatedepigenetic changes during diurnal cycles. PLoS Biol., 10, e1001442.
50. Steinmetz,E.J., Warren,C.L., Kuehner,J.N., Panbehi,B., Ansari,A.Z.and Brow,D.A. (2006) Genome-wide distribution of yeast RNApolymerase II and its control by Sen1 helicase. Mol. Cell, 24,735–746.
51. Kim,T.S., Liu,C.H., Yassour,M., Holik,J., Friedman,N.,Buratowski,S. and Rando,O.J. (2010) RNA polymerase mappingduring stress responses reveals widespread nonproductivetranscription in yeast. Genome Biol., 11, R75.
52. Perales,R., Erickson,B., Zhang,L., Kim,H., Valiquett,E. andBentley,D. (2013) Gene promoters dictate histone occupancy withingenes. EMBO J., 32, 2645–2656.
53. Murakami,K., Elmlund,H., Kalisman,N., Bushnell,D.A.,Adams,C.M., Azubel,M., Elmlund,D., Levi-Kalisman,Y., Liu,X.and Gibbons,B.J., et al. (2013) Architecture of an RNA polymeraseII transcription pre-initiation complex. Science, 342,doi:10.1126/science.1238724.
by guest on October 27, 2014
http://nar.oxfordjournals.org/D
ownloaded from

Supplemental Material
Heavy transcription of yeast genes correlates with differential loss of
histone H2B relative to H4 and queued RNA polymerases
Hope A. Cole, Josefina Ocampo, James R. Iben, Razvan V. Chereji, and David J. Clark
Program in Genomics of Differentiation, Eunice Kennedy Shriver National Institute forChild Health and Human Development, National Institutes of Health, Bethesda, Maryland
20892, USA
Contents
Supplementary Figures 2Supplementary Figure S1 . . . . . . . . . . . . . . . . . . . . . . . . . . . . . . . . . . . . . . . . . 2Supplementary Figure S2 . . . . . . . . . . . . . . . . . . . . . . . . . . . . . . . . . . . . . . . . . 3Supplementary Figure S3 . . . . . . . . . . . . . . . . . . . . . . . . . . . . . . . . . . . . . . . . . 4Supplementary Figure S4 . . . . . . . . . . . . . . . . . . . . . . . . . . . . . . . . . . . . . . . . . 5Supplementary Figure S5 . . . . . . . . . . . . . . . . . . . . . . . . . . . . . . . . . . . . . . . . . 6Supplementary Figure S6 . . . . . . . . . . . . . . . . . . . . . . . . . . . . . . . . . . . . . . . . . 7
Supplementary Tables 8
Supplementary References 10
1

Supplementary Figures
0 100 200 300 400 5000
0.2
0.4
0.6
0.8H4
Length of sequenced DNA fragment (bp)
Per
cent
age
(%)
IP (untreated)IP (+3AT)Input (untreated)Input (+3AT)
0 100 200 300 400 5000
0.2
0.4
0.6
0.8H2B
Length of sequenced DNA fragment (bp)
Per
cent
age
(%)
IP (untreated)IP (+3AT)Input (untreated)Input (+3AT)
A
B
Supplementary Figure S1. Length distributions of HA-histone ChIP samples. Untreated and 3AT-induced cells carrying either HA-tagged H4 or HA-tagged H2B were cross-linked with formaldehyde andsonicated. The cross-linked chromatin was subjected to IP using immobilised anti-HA antibody. Inputs andIP samples were amplified and subjected to paired-end sequencing (PESCI). Inputs and IPs from one of twobiological replicate experiments are shown.
2

0 0.2 0.4 0.6 0.80
0.2
0.4
0.6
0.8
1
1.2
MNase disruption score for core particles (+3AT occupancy/untreated occupancy)
H4
codi
ng r
egio
n oc
cupa
ncy
ratio
(+3A
T/u
ntre
ated
)
H4
0 0.2 0.4 0.6 0.80
0.2
0.4
0.6
0.8
1
1.2
H2B
cod
ing
regi
on o
ccup
ancy
rat
io(+
3AT
/unt
reat
ed)
H2BA B
ARG1
ICY2ICY2
ARG1
ARG4
ARG4
HIS4
HIS4
YPR036W-A YPR036W-A
Supplementary Figure S2. Correlation of H2B loss from coding regions measured by PESCI and chro-matin disruption score measured by nucleosome loss. Chromatin disruption was measured by Cole et al.(2011) as a “disruption score” equal to the nucleosome core particle occupancy on the coding region in3AT-induced cells/occupancy in untreated cells. A total of 49 genes had a disruption score of < 0.75, indi-cating that > 25% of the nucleosome occupancy was lost from the gene in 3AT. The disruption scores forthese 49 genes were plotted against the equivalent average occupancy ratio (3AT/untreated) for H4 or H2B,which is the average of two normalised biological replicate experiments. A ratio of 1.0 indicates no changein occupancy with 3AT. The red dashed lines indicate a direct correspondence between histone occupancyratio and nucleosome occupancy (disruption score).
3

STE50 RRP7 HIS4 BIK1
64000 66000 68000 700000
10
20
30
Chromosome III coordinate (bp)No.
of s
eque
nces
incl
udin
gco
ordi
nate
nuc
leot
ide
(nor
mal
ized
to u
ntre
ated
)
Rpb3 IP (untreated)Rpb3 IP (+3AT)Input (untreated)Input (+3AT)
0 100 200 300 400 5000
0.2
0.4
0.6
0.8Pol II (Rpb3)
Length of sequenced DNA fragment (bp)
Per
cent
age
(%)
IP (untreated)IP (+3AT)Input (untreated)Input (+3AT)
A
B
Supplementary Figure S3. PESCI-ChIP for Pol II (Rpb3 subunit). Untreated and 3AT-induced cells werecross-linked with formaldehyde and sonicated. The cross-linked chromatin was subjected to IP using anti-Rpb3 antibody. Inputs and IP samples were amplified and subjected to paired-end sequencing. Only uniquepaired reads were used (to eliminate some PCR artefacts, although the results are essentially identical if allpaired reads are included). Inputs and IPs from one of two biological replicate experiments are shown. (A)Length distributions. (B) Pol II occupancy map of the HIS4 locus, constructed using 50-150 bp fragments.
4

0 5 10 15 200
0.2
0.4
0.6
0.8
1
1.2
H4 + 3AT
R2 = 0.008
0 5 10 15 200
0.2
0.4
0.6
0.8
1
1.2
H2B + 3AT
R2 = 0.324
Pol II density (IP/input, norm. to average)
His
tone
occ
upan
cy (
IP/in
put,
norm
. to
aver
age)
0 5 10 15 200
0.2
0.4
0.6
0.8
1
1.2
H4 untreated
R2 = 0.037
0 5 10 15 200
0.2
0.4
0.6
0.8
1
1.2
H2B untreated
R2 = 0.310
Supplementary Figure S4. Pol II density correlates with differential loss of H2B from heavily transcribedgenes in both untreated and 3AT-induced cells. Strong inverse correlation between Pol II and H2B levelson the 250 most heavily transcribed genes (> 500 bp) in untreated and 3AT-induced cells. The data areexpressed as IP/input ratios for each gene, normalised to the average for the entire data set.
5
3AT–induced cells
Untreated cells
Rpb
3 oc
cupa
ncy
(IP
/inpu
t, no
rm. t
o av
erag
e)
3TSS
Position relative to TSS (bp)
3TES
Position relative to TES (bp)
3TSS
Position relative to TSS (bp)
3TES
Position relative to TES (bp)
Quintile 1Quintile 2Quintile 3Quintile 4Quintile 5
Supplementary Figure S5. Distribution of Pol II relative to the TSS and the TES for all genes inuntreated and 3AT-induced cells. All genes longer than 500 bp and with TSS/TES data available (Davidet al. (2006)) were sorted according to their Rpb3 occupancy in untreated cells. The genes were separatedinto quintiles of 748 genes (except Quintile 5, which had 747 genes), with Quintile 1 containing the genes withthe highest Pol II occupancy and Quintile 5 containing genes with the lowest occupancy. The distributionof Rpb3 (IP/input, normalised to the average) relative to the TSS or TES was determined for all quintilesusing unique reads and all DNA lengths, and then plotted as a function of the distance from the TSS or theTES. The same procedure was followed using Rpb3 data for 3AT-induced cells.
6
2
Pol II (Rpb3)
Distance from TSS (bp)
IP/In
put
2
Pol II (Rpb3)
Distance from TES (bp)
IP/In
put
Core particles
Distance from TSS (bp)
Occ
upan
cy
2
H4
Distance from TSS (bp)
IP/In
put
H2B
Distance from TSS (bp)
IP/In
put
TATA-containing TATA-lessA
B C
D E
Supplementary Figure S6. Comparison of the chromatin structures of TATA-containing and TATA-lessgenes in untreated cells. 682 TATA-containing genes and 3057 TATA-less genes (defined in Basehoar et al.(2004)) have associated TSS/TES data (31). (A) Distribution of Pol II relative to the TSS and the TES inuntreated cells. (B) Nucleosome core particle occupancy relative to the TSS (140-160 bp). (C) 80-120 bpparticles in under-digested chromatin, relative to the TSS. (D) H4 occupancy relative to the TSS (50-150 bpfragments). (E) H2B occupancy relative to the TSS (50-150 bp fragments).
7

Supplementary Tables
Summary of paired-end sequencing data. Numbers of aligned paired reads (using Bowtie2 to align to theSacCer2 version of the genome sequence).
Table S1. MNase digestion studies
Sample Yeast strain No. of aligned paired reads
Core particles (untreated)∗ YDC111 25,856,234Core particles (+3AT)∗ YDC111 8,175,739Under-digested (untreated) Experiment 1 YDC111 49,944,791Under-digested (+3AT) Experiment 1 YDC111 30,026,825Under-digested (untreated) Experiment 2 YDC111 52,714,905Under-digested (+3AT) Experiment 2 YDC111 38,528,572
Pearson correlations between occupancy profiles for core particles derived from untreated cells:Experiment 1 vs. Experiment 2: 0.966 (data in Cole et al. (2011)).Experiment 1 vs. Experiment 3: 0.958.Experiment 2 vs. Experiment 3: 0.920.Pearson correlations between occupancy profiles for core particles derived from 3AT-induced cells:Experiment 1 vs. Experiment 2: 0.977 (data in Cole et al. (2011)).Experiment 1 vs. Experiment 3: 0.930.Experiment 2 vs. Experiment 3: 0.918.Pearson correlations between occupancy profiles for under-digested chromatin (Experiment 1 vs. Experiment2): 0.973 (untreated), 0.955 (3AT-induced).
Histone-PESCI studies
Sample Yeast strain No. of aligned paired reads
Input IP
H4 (untreated) Experiment 1 YDC439 7,461,155 30,028,933H4 (+3AT) Experiment 1 YDC439 4,139,949 25,771,133H4 (untreated) Experiment 2 YDC439 4,000,441 8,393,763H4 (+3AT) Experiment 2 YDC439 7,183,029 8,893,552H2B (untreated) Experiment 1 YDC443 7,848,262 24,524,668H2B (+3AT) Experiment 1 YDC443 5,090,847 31,632,822H2B (untreated) Experiment 2 YDC443 4,292,637 8,510,404H2B (+3AT) Experiment 2 YDC443 5,982,957 8,933,222
Pearson correlations between occupancy profiles for Experiment 1 vs. Experiment 2:H4-IPs: 0.964 (untreated), 0.977 (3AT-induced).H4-Inputs: 0.964 (untreated), 0.978 (3AT-induced).H2B-IPs: 0.983 (untreated), 0.973 (3AT-induced).H2B-Inputs: 0.974 (untreated), 0.980 (3AT-induced).
∗We have published two data sets for core particles (+/- 3AT) previously (Cole et al. (2011)).
8

Rpb3-PESCI studies
Sample Yeast strain No. of aligned paired reads
Input IP
Rpb3 (untreated) Experiment 1 YDC111 10,867,490 354,654Rpb3 (+3AT) Experiment 1 YDC111 12,544,602 310,003Rpb3 (untreated) Experiment 2 YDC111 4,730,919 213,517Rpb3 (+3AT) Experiment 2 YDC111 6,976,483 414,051
Pearson correlations between occupancy profiles (smoothed with a 101-bp moving average filter) for Exper-iment 1 vs. Experiment 2:Rpb3-IPs: 0.726 (untreated), 0.496 (3AT-induced).Rpb3-Inputs: 0.996 (untreated), 0.997 (3AT-induced).
Note: An apparent PCR artefact resulted in many identical DNA fragments in the Rpb3-IPs.Identical DNA fragments were removed from the analysis by eliminating all but one copy to obtain only“unique” read pairs.
9
Supplementary References
Cole, H.A., Howard, B.H. and Clark, D.J. (2011) Activation-induced disruption of nucleosome positionclusters on the coding regions of Gcn4-dependent genes extends into neighbouring genes. Nucl. Acids Res.,39, 9521-9535.
David, L., Huber, W., Granovskaia, M., Toedling, J., Palm, C.J., Bofkin, L., Jones, T., Davis, R.W. andSteinmetz, L.M. (2006) A high-resolution map of transcription in the yeast genome. Proc. Natl. Acad. Sci.USA, 103, 5320-5325.
Basehoar, A.D., Zanton, S.J. and Pugh, P.F. (2004) Identification and distinct regulation of yeast TATAbox-containing genes. Cell, 116, 699-709.
10