heavy vehicle wheel detachment and possible solutions ... · this is the final project report for...
TRANSCRIPT

Published Project Report PPR475
Heavy vehicle wheel detachment and possible solutions Phase 2 – final report
M Dodd


Transport Research Laboratory
PUBLISHED PROJECT REPORT PPR 475
Heavy vehicle wheel detachment and possible solutions Phase 2 - Final Report
by M Dodd (TRL)
Prepared for: Project Record: PPRO 4/12/38
Heavy Vehicle Wheel Detachment and Possible Solutions
Client: Department for Transport, Transport Technology and Standards (TTS) 6
(Lawrence Thatcher)
Copyright Transport Research Laboratory March 2010
This Published Report has been prepared for Department for Transport. Published Project Reports are written primarily for the Client rather than for a general audience and are published with the Client’s approval.
The views expressed are those of the author(s) and not necessarily those of Department for Transport.
Name Date
Approved
Project Manager
James Nelson 08/04/2010
Technical Referee
Iain Knight 08/04/2010

Published Project Report
TRL PPR 475
When purchased in hard copy, this publication is printed on paper that is FSC (Forest Stewardship Council) registered and TCF (Totally Chlorine Free) registered.

Published Project Report
TRL iii PPR 475
Contents
Executive summary vi
1 Introduction 1
2 Methodology 2
2.1 Mathematical analysis 2
2.2 Standardisation of best practice for wheel tightening methods and maintenance 2 2.2.1 Initial tightening procedure 3 2.2.2 Re-torquing procedure 3
2.3 Effectiveness and durability of various countermeasures 5
2.4 Accelerated wear tests 6
2.5 Cost benefit analysis 7
3 Test Results – standard wheel nuts 8
3.1 Mathematical analysis 8
3.2 Standardisation of best practice for wheel tightening methods and maintenance 10 3.2.1 Initial tightening procedure 10 3.2.2 Relaxation and re-torquing 15 3.2.3 Effectiveness and durability 17 3.2.4 Accelerated wear tests 18
4 Test results - potential solutions 28
4.1 Initial tightening tests 28
4.2 Effectiveness and durability 28 4.2.1 Standard tests 28 4.2.2 Extended tests 32
4.3 Accelerated wear tests 32
5 Cost benefit analysis 35
5.1 Option A: Do nothing 35
5.2 Option B: Introduce voluntary or compulsory procedures 35
5.3 Option C: Re-introduce directional threads 36
5.4 Option D: Implement a review of hub and wheel fixing design. 37
5.5 Option E: Require wheel nut retention devices to be fitted to all vehicles. 37 5.5.1 Option E1: Eliminate 100% of wheel fixing problems 38 5.5.2 Option E2: Eliminate wheel detachments only 39 5.5.3 Option E3: Effectiveness of devices based on Junkers results 40
5.6 Option F: Fit wheel nut movement indicators. 41
Discussion 42
6 Conclusions 45
7 Acknowledgements 46

Published Project Report
TRL iv PPR 475
References 46
Appendix A Summary of accelerated wear test conditions 47
Appendix B Description of devices tested 48
Appendix C Cost benefit analysis 52

Published Project Report
TRL v PPR 475

Published Project Report
TRL vi PPR 475
Executive summary Heavy vehicle wheel detachment is relatively rare with respect to the very large distances travelled by such vehicles. However, when it does occur the consequences can be severe and the problem has been very well publicised for many years. TRL’s research in Phase 1 of this project focussed on estimating the frequency of wheel fixing problems and identifying potential countermeasures to prevent or mitigate future problems. The project estimated there were between 7,500 and 11,000 cases of loose wheel nuts and between 150 and 400 wheel detachments resulting in 10 to 27 injury accidents and 3-7 fatal accidents each year in the UK. TRL’s research also found that the causes of the problem were relatively well understood and there was considerable, if sometimes inconsistent, guidance on how to maintain wheel fixings.
Evidence from survey results suggested that maintenance guidelines were not always followed and there was evidence to suggest that those that failed to follow them had a higher incidence of wheel fixing problems. A range of solutions intended to tackle wheel nut loosening were identified.
This second phase of the project was again commissioned by the UK Department for Transport (DfT) and has built upon the 2006 research by TRL in order to identify best practice for wheel tightening and maintenance, and to assess the potential effectiveness of the identified countermeasures.
The second phase of the project involved a mathematical analysis of the clamp force required during normal driving, laboratory and vehicle-based tests to investigate various procedures for initial tightening and re-torquing. Accelerated wear tests were also completed to assess the effectiveness of the various countermeasures.
This is the final project report for Phase 2 of the project. It describes the methodologies and results from the tests undertaken during phase 2. The main conclusions from the study are:
1. The age, condition and level of lubrication applied to the mating surfaces and threads of standard wheel studs and nuts was found to affect the magnitude and consistency of clamp force generated during the tightening tests.
2. Tests also showed some evidence of substantial variation between individual studs/nuts with nominally the same specification. It is recommended that, if it is considered appropriate to do so, a review of BS AU 50 is undertaken to investigate if any potential improvements to the magnitude and consistency of the clamp force generated could be achieved by amending the technical requirements to reduce variation in the material properties of wheel studs and nuts.
3. Standard OEM studs that had previously been used in normal service and the new locking devices tested during the tightening tests were found to generate a clamp force below the value required as part of BS AU 50, and below the value calculated as part of the mathematical analysis.
4. The tests to assess the relaxation and re-torquing methods showed that only a small percentage (<10%) of the initial clamp force was lost during the different test procedures. The results did, however, suggest that it is necessary for the vehicle to be driven, rather than left stationary, to induce the greatest loss in clamp force.
5. The Junkers tests showed that the various locking and retention devices offered some level of benefit over the standard OEM nuts alone by retaining a greater proportion of the initial clamp force.
6. During the Junkers tests the Visilok device maintained a high proportion of the initial clamp force but there was evidence that it had bound up on the threads

Published Project Report
TRL vii PPR 475
and, in some cases, deformed during testing therefore this result is not considered representative of how the device was designed to work in real service.
7. Using accelerated wear tests with a test vehicle it was not possible, within the timescales of this project, to develop a test procedure, representative of real world service, which quickly and consistently caused standard OEM wheel nuts to loosen. Therefore it has not been possible to conclusively compare the real-world effectiveness of the different devices used in this project.
a. During one of the accelerated wear tests the clamp force for all 10 of the Disc-locks devices fitted to one wheel fell to zero within four days of the start of one particular test cycle. It should be noted that configuration for this test was not in accordance with Disc-lock’s recommended tightening procedure because they had been tightened to a lower torque to try and induce wheel nut loosening more quickly. The standard OEM wheel nut and the other devices fitted to the vehicle at the same time also lost some clamp force but showed no sign of vibration loosening. The reason for this result is not known and could not be repeated when the nuts were re-tightened.
b. The vehicle tests indicated that maintenance of the wheel fixing joint is important because the vehicle tests undertaken without any artificial contamination maintained a greater proportion of the initial clamp force that similar tests with contaminations.

Published Project Report
TRL viii PPR 475

Published Project Report
TRL 1 PPR 475
1 Introduction Heavy vehicle wheel detachment is relatively rare with respect to the very large distances travelled by such vehicles. However, when it does occur the consequences can be severe and the problem has been very well publicised for many years. TRL’s research in Phase 1 of this project focussed on estimating the frequency of wheel fixing problems and identifying potential countermeasures to prevent or mitigate future problems. The project estimated there were between 7,500 and 11,000 cases of loose wheel nuts and between 150 and 400 wheel detachments resulting in 10 to 27 injury accidents and 3-7 fatal accidents each year in the UK. TRL’s research found that the causes of the problem were relatively well understood and there was considerable, if sometimes inconsistent, guidance on how to maintain wheel fixings.
Evidence from survey results suggested that maintenance guidelines were not always followed and there was evidence to suggest that those that failed to follow them had a higher incidence of wheel fixing problems. A range of solutions intended to tackle wheel nut loosening were identified.
This second phase of the project was again commissioned by the UK Department for Transport (DfT) and has built upon the 2006 research by TRL in order to identify best practice for wheel tightening and maintenance, and to assess the potential effectiveness of the identified countermeasures.
The second phase of the project involved a mathematical analysis of the clamp force required during normal driving, laboratory and vehicle-based tests to investigate various procedures for initial tightening and re-torquing. Accelerated wear tests were also completed to assess the effectiveness of the various countermeasures.
This is the final project report for Phase 2 of the project. It describes the methodologies and results from the tests undertaken during phase 2 and includes the main conclusions from the study.

Published Project Report
TRL 2 PPR 475
2 Methodology
2.1 Mathematical analysis
A mathematical analysis of the standard heavy vehicle wheel fixing was undertaken for single and twin-wheel configurations. Input forces were calculated assuming that wheels were subject to maximum axle loads and this was used to determine the minimum levels of clamp force required for different applications. Some simplification and assumptions were necessary for this work. In particular the following assumptions were made:
Coefficient of friction between wheel and hub was 0.2;
No shear loading on studs, wheel held in position by clamp force alone;
Wheel and hub act as rigid bodies, therefore force seen by each stud was assumed to be proportional to the distance of the stud from the pivot point; and
For twin wheels load was assumed to be evenly distributed between both wheels.
The results were compared with the actual level of clamp force supplied by various specifications to determine the factors of safety inherent in the design. These results were also used to predict theoretically how effective increasing the diameter of wheel studs or increasing the number of wheel studs may be.
2.2 Standardisation of best practice for wheel tightening methods and maintenance
TRL’s work in Phase 1 of this project identified that there had been extensive research into the design of wheel fixings and the tightening methods used with relation to the problems of loose fixings and wheel detachments. Problems involving joint relaxation, torque-to-clamp ratio and temperature effects that could affect the security of the fastening were identified along with research and procedures published by a variety of organisations, recommending good practice in terms of how to re-fit a wheel and tighten the nuts. In general, many of the requirements are now common to all but there are still some areas, such as actual torque levels and the issue of lubrication where there is no standard approach.
Furthermore, maintenance guidance varies on the procedure for re-torquing wheels. Some guidance recommends re-torquing after a defined time period where a vehicle is stationary. Other guidance recommends that wheels are re-torqued after a defined distance has been driven.
To investigate these main areas of disagreement a programme of physical tests was carried out to investigate the initial tightening and re-torquing procedure, specifically:
Initial tightening procedure
o The tightening torque/angle required,
o Whether lubrication of the stud/nut threads and interfaces is required
Re-torquing procedure
o Time or distance travelled before re-torquing is required.
o Procedure for re-torquing, i.e. should the nuts be slackened and re-tightened?
Spigot type wheel fixings were used because that is the modern standard and formed by far the largest proportion of failures found in the VOSA survey in Phase 1 of this project.

Published Project Report
TRL 3 PPR 475
2.2.1 Initial tightening procedure
For the initial tightening procedure, two methods were considered:
Torque tightening; and
Angle tightening.
The purpose of these tests was to assess the magnitude of the clamp force generated and to assess the level of consistency between individual tests.
For the torque tightening method new wheel studs and nuts were incrementally tightened to 500Nm, 600Nm, 700Nm and 800Nm and the clamp force was measured for each test.
Volvo’s recommended tightening procedure is to tighten each wheel nut to an initial torque of 200Nm and to then angle tighten each nut by turning them through a further 90 degrees. Finally the tightening torque is checked against their recommended value of 670±30Nm (Bridgestone, 2008). To assess this type of approach new wheel studs and nuts were tightened to 200Nm and then incrementally tightened further to 60°, 90°, 120° and 150°.
The test programme was comprised of two distinct elements. The first element involved tests using DAF original equipment studs and nuts to investigate the effect of the tightening method, stud age/condition and lubrication on the clamp force achieved.
Two different sets of studs and nuts were tested and the above processes were repeated five times for each stud and nut combination to give 10 repeats for each of the following levels of lubrication:
“As received” the condition when delivered from the manufacturer;
“Degreased” – soaked in degreaser and then dried;
“Light lubrication” - Nut & captive washer lightly lubricated; and
“Full lubrication” - Threads, nut and captive washer lubricated.
Additional tests were also undertaken with ‘used’ studs and nuts. These were obtained from a fleet of vehicles that had been used by a haulage company. The studs had been fitted to the vehicles for approximately eight years, since the vehicles were new.
The second element of the test programme used the initial results to investigate the clamp load achieved when different types of devices, claimed to maintain clamp load and/or resist vibration loosening, were tightened. A similar procedure of tightening was used.
2.2.2 Re-torquing procedure
Having investigated the various methods for the initial tightening of the wheel studs and nuts, this phase of testing was designed to investigate the various re-torquing methods recommended in manufacturer wheel fitting procedures and by groups representing the haulage industry. Specifically the following procedures were assessed:
‘Stationary vehicle’ – Wheel nuts tightened and the vehicle remained stationary for 1 hour;
‘Straight line braking’ –heavy braking from 10, 20 and 30km/h;
‘Normal driving’ – replicate on road driving up to a total distance of 185 km;
‘Figure-of-8 tests’ – vehicle manoeuvred at approximately 10km/h
For this test programme, and the validation trials (described later in the report), a DAF 75 CF 290 three axle tipper (GVW 26t), as shown in Figure 1, was purchased.

Published Project Report
TRL 4 PPR 475
The results of the VOSA survey Phase 1 indicated that there was a strong bias towards problems occurring on drive axles compared with steer axles or free rolling axles. Furthermore, the vehicle Inspectorate (VI) survey showed that there was a steady increase in the number of wheel fixing problems as the age of a vehicle increased.
For these reasons the vehicle was chosen because it had a twin drive axle and (at the time of purchase) was eight years old. The hubs of the drive axles were instrumented with wheel studs fitted with the Intellifast measurement transducers to allow the clamp load to be measured in-situ.
Figure 1: Test vehicle
The Intellifast clamp load measurement and recording instrumentation, included a digital torque wrench, to measure and record the torque applied, the angle of rotation of the torque wrench and the clamp load applied (Figure 2).
Figure 2: Intellifast clamp load measurement kit
The system uses ultrasonic measurement technology to measure the clamp load generated in the stud. A small transducer is mounted to the head of each wheel stud and the measurement pin on the end of the torque wrench sends an ultrasonic pulse down the wheel stud (Figure 3). The system measures the time taken for an echo of the pulse to return to the measurement pin and compares this to a similar value taken before the nut is tightened. Using a calibration factor, the resulting clamp load is then calculated.

Published Project Report
TRL 5 PPR 475
Figure 3: Intellifast measurement principle
2.3 Effectiveness and durability of various countermeasures
To quickly and efficiently simulate the problem of wheel detachment, and to test a number of potential solutions a series of vibration tests were undertaken. Specifically tests in accordance with DIN standard 65151 “Dynamic testing of the locking characteristics of fasteners under transverse loading conditions (vibration test)” were carried out. This test is also known as a Junkers test and has been used in the field of fasteners by the manufacturers of some of the wheel nut retention devices identified in the first phase of this research.
In this test a vibration machine oscillates a moving plate in the transverse direction at controlled frequency and amplitude. This moving plate is secured to a fixed base via the stud/nut arrangement that is the subject of the test. Needle roller bearings are placed between the moving plate and the fixed base such that friction between the two surfaces is eliminated and the wheel stud/nut sustains all of the transverse loading. The arrangement is shown in Figure 4, below.
Figure 4: Cross section of the arrangement of test pieces in a Junkers test.

Published Project Report
TRL 6 PPR 475
The advantage of this test is that it is able to loosen nuts and reduce clamp force in a short space of time, thus allowing a range of variables to be assessed quickly and cheaply. However, it is recognised that it does not necessarily accurately replicate exactly what happens to a wheel stud/nut assembly in service on a heavy vehicle. This is because the needle roller bearings used between the two plates of the Junkers machine reduce the friction between the mating surfaces to almost zero such that, irrespective of the clamp load applied by the stud/nut, relative motion is possible between the mating surfaces, thus guaranteeing that vibration loosening of a standard nut will occur.
Despite the above limitations it was still considered that the Junkers test was the most cost-effective means of assessing the ability of a wide variety of solutions.
A Junkers vibration test machine (Figure 5) was provided by Disc-Lock and installed at TRL. The machine was adapted to accommodate the standard OEM wheel stud fitted to the test vehicle, replicating the dimensions of the hub/drum/wheel joint to facilitate testing of the various locking/retention devices.
Figure 5: Junkers machine
Tests lasting approximately 80 seconds were undertaken using new and used studs and nuts. These were supplements by a small number of extended tests which each lasted for five minutes.
2.4 Accelerated wear tests
Whilst the above test methods produce sound scientific results, none of the methods can be considered fully representative of the behaviour of a nut and stud on a vehicle in real service. Also, the above tests are not suitable for the assessment of the capabilities of directional threads. Therefore, a full scale trial was carried out to compare the findings of the earlier tests.
However, as stated earlier, assessment of the devices in ordinary road use would be expected to take a very long time and was beyond the scope of this project. Therefore, a compromise solution of an accelerated wear test on a proving ground was used. The tests involved a series of repeated harsh cornering, braking and acceleration cycles coupled with driving over specially designed uneven surfaces to provide a severe source of vertical, rotational and lateral vibrations. A summary of the initial conditions for each of the test cycles is provided in Appendix A.
The DAF test vehicle and Intellifast measurement system, previously described in section 2.2.2, were used for this part of the test programme.

Published Project Report
TRL 7 PPR 475
2.5 Cost benefit analysis
A cost benefit analysis was carried out as part of the previous phase of the project. However, at that time, little information was available on the likely effectiveness of different solutions. The cost benefit analysis was updated to include, where appropriate, revised estimates for maintenance costs and revised estimates of casualties based on the results of the effectiveness and durability tests carried out in this project.

Published Project Report
TRL 8 PPR 475
3 Test Results – standard wheel nuts
3.1 Mathematical analysis
A mathematical analysis of standard heavy vehicle wheel fixings was carried out to determine the minimum levels of clamp force required for different applications and to compare this with the actual level of clamp force supplied by various wheel fixing specifications to determine the factors of safety inherent in the design.
For a static condition the total clamp force required at each wheel is the sum of force required at each wheel fixing position to generate sufficient frictional force between the wheel and hub mating faces in order to resist the vertical tyre load (shared equally between all wheel fixings), and to resist the moment occurring because of the offset between the tyre centre of contact and the mating face.
Figure 6 shows the estimated clamp force required for different angular positions around a wheel for both single and twin wheels. It was estimated that peak clamp forces of 82kN and 69kN would be required to secure single and twin wheels respectively when vehicle is stationary with a maximum axle weight of approximately 10,000kg. The variation in the clamp forces required for a single wheel is caused by the moment generated by the wheel offset. With a twin wheel assembly there is less variation in the clamp forces required because the effective centre of contact of the twin wheel assembly is almost aligned with the hub mating face.
Figure 6: Distribution of clamp force required around wheel for stationary vehicle
A similar analysis of the clamp forces required to secure the wheel onto the hub under various worst case driving conditions (limit braking, cornering etc.) was also completed for both single and twin wheels.
The analysis for a cornering manoeuvre again assumed that a single or twin wheel would be loaded to their maximum axle weights. The results for the cornering manoeuvre showed a substantial increase in the peak clamp loads (212kN and 183kN for single and twin wheels respectively), as shown in Figure 7.
As described later in this report, a clamp load of approximately 200kN was typically generated from torquing a standard DAF fixing to 700Nm. This is evidence to show that the difference between the clamp loads typically generated and the peak clamp loads that could be experienced is small.

Published Project Report
TRL 9 PPR 475
Figure 7: Distribution of clamp force required around wheel during limit cornering
Previous research (Knight et al, 2002) identified that HGVs can achieve a peak deceleration of 0.7g during emergency braking. A short wheelbase HGV fully laden with a high centre of gravity load is a vehicle configuration most likely to maximise the weight transfer onto the front axle under braking thus yielding the worst case condition. For this analysis the typical dimensions for an 18tonne rigid HGV were used for the calculations. This assumed that, when fully laden, the vehicle would have a front axle load of 7,000kg (39% of total mass) and a rear axle load of 11,000kg. Furthermore it was assumed that the centre of gravity for this vehicle was quite high at 2.3m above the ground plane.
For this configuration, the analysis showed that for a deceleration of 0.7g, 66% of the vehicle mass would be transferred to the front axle. It was also calculated that a peak clamp force of 190kN would be required to secure a single wheel. The distribution of clamp force required around the wheel fixings differs from that of the static, dynamic and cornering analyses because of the additional moments generated from the braking forces.
Figure 8: Distribution of clamp force required around wheel during limit braking

Published Project Report
TRL 10 PPR 475
3.2 Standardisation of best practice for wheel tightening methods and maintenance
3.2.1 Initial tightening procedure
As described in section 2.2.1, a series of tightening tests were undertaken using DAF original equipment studs and nuts for different levels of lubrication. Two different sets of studs and nuts were used for each level of lubrication and five tests were completed with each stud and nut combination to give a total of 10 repeats.
The purpose of these tests was to answer a number of questions related to the tightening procedure in terms of the magnitude and consistency of clamp force generated.
One of the main disagreements between the tightening procedures for different manufacturers relates to whether or not lubrication should be added to the fixing.
The recommended wheel nut torque settings specified in the Truck Point Re-Torque Manual (Bridgestone, 2008) showed that some manufacturers recommend lubricating the nuts and studs with engine oil whereas other recommend using clean, dry threads (Table 1). It should be noted that there are some slight variations for different manufacturers. For example, the recommended procedure for DAF indicates that lubrication is not required. However, a side note in the manual states that the captive washer interface should be lubricated with oil to eliminate undue friction between the nut and its captive washer.
Table 1: Recommended lubrication by vehicle manufacturer (Bridgestone, 2008).
Lubricate Do not lubricate
Dennis Eagle BMC
Iveco DAF
Renault Mercedes-Benz
Scania Foden
MAN-ERF
Seddon Atkinson
Volvo
Figure 9 shows the mean clamp force generated for each the individual tests for each lubrication condition using the torque tightening method during the bench tests undertaken during this project. It shows that the fully degreased condition generated the lowest clamp force for each level of torque. Also, it can be seen that the two conditions where the stud and nut were either lightly or fully lubricated offered the highest level of clamp force.

Published Project Report
TRL 11 PPR 475
Figure 9: Mean clamp force generated by torque tightening method using new studs and nuts.
These results can also be compared to the requirements of BS AU 50 (BSi, 1994). Annex G in Part 3 of this standard specifies a torque/clamping force test for flat faced nut-type fixings. For this test an M22 fixing tightened with a torque of 600Nm and is required to achieve a clamping force of between 190kN and 240kN. The clamping force is recorded after each of the 100 tests that must be completed. Furthermore the test specifies that there must be a pause of not less than 100 seconds between tests to avoid excessive frictional heating. The standard also states that if it has been necessary to apply a lubricant to achieve a clamping force with the required range, then the type of lubricant and the parts of the assembly to which it was applied must be noted in the test result.
Figure 10 shows the clamp force generated during each individual test using the new studs and nuts for an applied torque of 600Nm. The red box in the graph highlights the corridor of performance as specified by BS AU 50. It can be seen that the fully lubricated condition gave the most consistent clamp force with all the results falling within the performance corridor.
The average clamp force generated by the tests in the lightly lubricated condition fell within the corridor but some individual tests did produce a clamp force outside of the permitted range. The clamp force produced by the ‘as received’ and ‘degreased’ conditions were generally lower than the other conditions with many of the individual tests falling below the lower permitted limit.
For each of the lubrication conditions, except for degreased studs when one of the studs yielded during the tests, the results from each the two test samples are presented individually. For example, Figure 10 shows that for the lightly lubricated condition, the first test sample produced a clamp force of between 200-260kN, and the second sample produced between 170kn and 210kN.
It can be seen that on a couple of occasions individual tests with the lightly lubricated studs and nuts produced a clamp force higher than those that were fully lubricated. This result cannot be fully explained however it is possible that this result, and other similar cases presented later in the report, could be at least in part caused by variations in the material properties of the stud or nut that were used.

Published Project Report
TRL 12 PPR 475
Figure 10: Comparison of requirements of BS AU 50 to the mean clamp force generated with new studs and nuts using the torque tightening method and an
applied torque of 600Nm.
In real service wheel studs and nuts are not replaced with new devices every time a wheel is removed and/or changed. Therefore the performance of used wheel studs and nuts is an important consideration when assessing different tightening procedures.
Figure 11 shows mean clamp force generated for each the individual tests for each lubrication condition with ‘used’ studs and nuts. This shows that the clamp forces generated were lower than for the equivalent tests with new studs and nuts. The fully lubricated condition again gave the highest clamp force at each value of torque. Unlike the results for the new studs and nuts, Figure 11 shows that the degreased condition gave, on average, a higher clamp force than the lightly lubricated condition.
Figure 11: Mean clamp force generated by torque tightening method using used studs and nuts.
Figure 12 shows the clamp force generated during each individual test using the used studs and nuts for an applied torque of 600Nm. It clearly shows how the clamp force

Published Project Report
TRL 13 PPR 475
generated with the used studs and nuts is much lower compared with the new studs and nuts.
Figure 12: Comparison of requirements of BS AU 50 to the mean clamp force generated with used studs and nuts using the torque tightening method and an
applied torque of 600Nm.
Whilst the majority of vehicle manufacturers recommend a torque tightening procedure Volvo recommends tightening procedure is to tighten each wheel nut to an initial torque of 200Nm and to then angle tighten each nut by turning them through a further 90 degrees (Bridgestone, 2008).
To assess whether angle tightening wheel nuts could produce a similar magnitude and more consistent clamp force a series of tests were carried out whereby each nut was tightened using a torque to 200Nm and then tightened further through a specific angle of rotation.
Figure 13 shows the clamp force generated for each individual test and lubrication conditions with new studs and nuts. The graph compares the clamp force generated when the nuts were either torque tightened to 700Nm or angle tightened to 200Nm plus a further 90 degrees.
It can be seen that for the angle tightening method the degreased condition gave the lowest clamp force but, unlike the torque tightening method, the studs and nuts in the ‘as received condition’ gave the highest clamp force.
There was some overlap between the individual test results of the torque tightening tests and the angle tightening tests. However, Figure 13 does show that the angle tightening method offered a slight improvement in consistency because the individual tests are grouped closer together.
Similarly to the results shown earlier in Figure 10, it can be seen that for the torque tightened samples, the lightly lubricated condition produced higher clamp forces than the fully lubricated condition. All tests were undertaken to tightly controlled procedure so it is again possible that there was some difference in the material properties of the different test samples that has contributed to this difference. It has not been possible to confirm this theory within this project.

Published Project Report
TRL 14 PPR 475
Figure 13: Comparison of clamp force generated by a) torque tightening to 700Nm and b) tightening to 200Nm and then angle tightening to 90 degrees
with new studs and nuts.
For the tests with the used studs and nuts and the angle tightening method, the clamp force generated by the degreased samples was similar to the new studs however it was only possible to rotate the nut by 90 degrees before the nut became too difficult to turn. The clamp forces generated by the lubricated conditions were again similar but overall the magnitude of clamp force was slightly lower compared with the new studs and nuts.
Figure 14: Clamp force generated by torque tightening to 700Nm and angle tightening to 90 degrees with used studs and nuts.
Figure 14 shows that for both the torque tightening and angle tightening methods the consistency of the clamp force generated by each sample was quite good. However, it can be seen that there were some differences between the two samples used. For example, using the angle tightening method in the lightly lubricated condition, there was approximately 50kN difference between the clamp forces that was generated by the two samples. This could be because of variation in the condition of the studs and nuts that were tested as the ‘used’ samples that were obtained from the haulage company originated from several different vehicles.

Published Project Report
TRL 15 PPR 475
3.2.2 Relaxation and re-torquing
Figure 15 – Figure 18 show how the clamp force changed for each of the different test methods used to assess the relaxation of the wheel fixings. Overall, the tests showed that less than 10% of the initial clamp force was lost during each test. The greatest reduction was from the straight line braking and figure-of-8 tests.
Figure 15: Residual clamp force as a percentage of initial force – stationary vehicle.
Figure 16: Residual clamp force as a percentage of initial force – normal driving tests.

Published Project Report
TRL 16 PPR 475
Figure 17: Residual clamp force as a percentage of initial force – straight line braking.
Figure 18: Residual clamp force as a percentage of initial force – figure-of-8 tests.
The relatively consistent relaxation across the majority of the various types of fixings used suggests that during the relaxation most of the reduction in clamp force was due to settlement between the mating faces rather than the fixings coming undone.
During the tests it was evident that the heat generated during braking in the various driving manoeuvres had an adverse effect on the accuracy of the clamp force measurement. The temperature gradient along the wheel stud resulted in non-uniform thermal expansion along its length, thus the temperature reading from the probe attached to the wheel face did not thoroughly compensate for the thermal expansion. In conjunction with Intellifast, TRL developed a method that accurately compensated for the thermal gradient which occurred during normal driving. This involved measuring the temperature of the captive washer and the brake drum and determining an average value at which to compensate.

Published Project Report
TRL 17 PPR 475
As part of these tests the influence of the heat generated during braking was investigated. Following a period of normal driving, the fixings on one wheel were immediately re-torqued whilst the wheel was still warm. Another wheel was not re-torqued until several hours after driving to allow the wheel to cool down. The results showed that the fixings on the wheel that had been allowed to cool could only be rotated a very small amount before the initial torque was reached. This small movement was consistent with the typical level of relaxation seen during the tests.
For the wheel that was re-torqued when warm, it was possible to rotate the fixings a further 30 degrees before the torque wrench recorded that the initial torque had been reached. Once this wheel had cooled down the clamp force was re-measured and an average value of ~275kN was recorded, this is compared with the initial clamp force of ~200kN.
It is possible that the elevated temperature in the wheel lowered the friction between the stud and nut allowing it to be rotated further, or that the non-uniform thermal expansion meant that the stud expanded by more than the wheel, thus reducing the clamp load, again allowing the nut to be turned. This result also highlights the potential to over tighten a fixing if it is re-torqued when the wheel is still warm, which could potentially lead to a stud failure if the stud has a relatively low yield strength.
3.2.3 Effectiveness and durability
Each of the Junkers tests lasted approximately 80 seconds and was undertaken using both new and used studs and nuts. The tightening procedure for these tests was the same as that recommended for DAF wheel fixings with a minor amendment to lightly lubricate the threads to improve the consistency of the initial clamp load.
Figure 19 and Figure 20 show that there was some variation in the rate at which the nuts loosened during individual tests however, in general it can be seen that the new studs lost a greater amount of clamp force compared to the used studs. It is possible that although the used studs gave a slightly lower initial clamp force because of excessive friction in the threads, this same friction helped to prevent the nuts from loosening as quickly.
Figure 19: Time histories for Junkers tests using new studs and nuts.

Published Project Report
TRL 18 PPR 475
Figure 20: Time histories for Junkers tests using used studs and nuts.
An extended test, lasting approximately five minutes was also carried out with a new stud and nut. Figure 21 shows that over the first two minutes the clamp force dropped in a similar manner to the shorter tests. After this time the residual clamp force levelled off and remained fairly constant at about 6%-7% for the rest of the test.
Figure 21: Time history of extended Junkers test.
3.2.4 Accelerated wear tests
The original aim of this part of the test programme was to verify the results of the lab-based tests in a situation representative of the behaviour in real world service.
This involved developing a test specification in which standard OEM wheel nuts could be made to loosen in a quick and consistent manner, and then using this test procedure to run comparative tests using wheel nut locking/retention devices to assess their ‘real-world’ effectiveness.
Full vehicle tests were undertaken using a variety of accelerated wear test surfaces at Millbrook Proving Ground. Unfortunately, despite considering a wide range of factors and test conditions the tests were unable to consistently loosen the standard OEM wheel

Published Project Report
TRL 19 PPR 475
nuts. Therefore it has not been possible to provide conclusive results, from this phase of the tests, about the relative effectiveness of different solutions.
The following section of the report presents the results from the validation trials in relation to the different factors that were considered during the test programme, namely:
Measurement method;
Contamination between mating surfaces;
Spigot clearance;
Effect of combining different devices on one wheel;
Age/condition of wheel studs and nuts; and
Test procedure.
3.2.4.1 Measurement method
When comparing test results it is important to ensure that the readings that have been taken are as accurate and reliable as possible. For the vehicle-based trials the Intellifast measurement system was used to measure the clamp force at each of the instrumented wheels.
As part of the bench tests carried out earlier in this project clamp force measurements were taken using the Intellifast measurement system at the same time as the clamp force was measured using a calibrated load cell.
To ensure that the readings taken during the vehicle were accurate and repeatable results a comparison was made between readings taken during the bench tests using the load cell and the Intellifast system.
The results of this comparison show that there is good evidence to indicate that the ultrasonic clamp force measurement system has been working as expected. Although there is some minor variation the absolute magnitude of the clamp force recorded, the relative change in clamp force is consistent between the two measurement techniques.
A comparison of the values recorded by these two methods showed that for nearly two-thirds of the readings taken during the initial tightening tests, the Intellifast reading was within 5% of the load cell reading, and for 96% of readings it was within 10% of the load cell reading.
Figure 22: Comparison of clamp force measured using a load cell and the Intellifast system during the bench tests.

Published Project Report
TRL 20 PPR 475
The results from the track tests also suggest that the Intellifast method has continued to operate correctly. The load cell was not fitted to the test vehicle so it was not possible to carry out a similar comparison to the results of the bench tests however, the values recorded during the track trials fell within the expected range, based on the applied torque, and there was one occasion where one of the wheel nut locking devices came loose during a test cycle. The test engineer noted that the nuts had become hand loose and at the same time the ultrasonic measurement system also recorded a clamp load of zero.
3.2.4.2 Contamination between mating surfaces
The findings from Phase 1 of this project revealed that there was common agreement amongst the different recommended tightening procedures that all mating surfaces should be free from rust and dirt, etc. To try and initiate wheel nut loosening as quickly as possible artificial contamination (in the form of dirt and a thick layer paint) was added between the mating surfaces of the wheels.
For these tests there was a similar pattern during each test cycle. There was an initial reduction in clamp force during the first two days of running after which the rate of loosening began to slow and/or the clamp force remained approximately constant. An example of this is shown in Figure 23.
Figure 23: Time history for clamp force recorded during a test where contamination was added between the mating surfaces of the wheel.
For one test cycle, the contamination was removed from all of the mating surfaces to provide an ‘ideal’ interface that was as clean as possible. Figure 24 shows that during this test there was no evidence of an initial reduction in clamp load and that it remained approximately constant for the entire test. This suggests that the contamination between the mating surfaces did contribute to the reduction in clamp load.

Published Project Report
TRL 21 PPR 475
Figure 24: Time history for clamp load recorded during a test without any contamination between the mating surfaces of the wheel.
3.2.4.3 Spigot clearance
The total clamp force required at each wheel fixing position is the sum of that required to generate sufficient frictional force between the mating surfaces to resist the vertical tyre load (shared equally between all wheel fixings) and to resist the moment occurring because of the offset between the tyre centre of contact and the mating surface.
It was considered that if the clamp force was low enough to allow relative movement between the mating surfaces then a larger clearance between the spigot and wheel would increase the magnitude of any relative movement and thus increase the rate at which the clamp force reduced. Therefore tests were undertaken with a nominal clamp force of 100kN which was approximately half the required clamp force as calculated in the mathematical analysis described in section 3.1.
Initially tests were carried out with the clearance between the spigot and wheel in the “as-received” condition from when the vehicle was purchased. For subsequent tests the clearance was increased slightly to 0.5mm across the diameter and then to 1 mm and finally 3 mm across the diameter during the most recent test cycle.
Figure 25 shows a comparison between two tests with different levels of clearance. Although there is a slight difference between the two, the overall shape of the graphs is similar. A graph for the test cycle with a clearance of 1mm across the diameter is not presented because for this test the artificial contamination had also been removed and, as shown in Figure 24, there was no significant reduction in clamp force.

Published Project Report
TRL 22 PPR 475
Figure 25: Comparison of change in clamp force for tests with a 0.2mm (left) and 0.5mm (right) clearance between the spigot and wheel.
Following a workshop with a number of industry experts (further details of which are described in section 3.2.4.6) the clearance was further increased to 3mm, the maximum clearance permitted by the annual roadworthiness test.
Once again the overall pattern of the results was found to be similar to the previous tests, although in this case the magnitude of the loss of clamp force was less than the previous tests with the smaller clearance. This suggests that, for the tests carried out in the project, the influence of spigot clearance was minimal on the rate of clamp force reduction.
3.2.4.4 Effect of combining types of wheel nut on the same wheel
For the first test cycles the aim was to test as many different types of wheel locking or retention devices as possible in the limited available time. Furthermore it was also important to test as many standard wheel nuts as possible to increase the likelihood of one of the standard nuts loosening during the test programme. For these reasons, standard wheel studs and nuts were fitted to three of the four wheels but for each wheel only five of the ten wheel studs and nuts were fitted with the standard nuts. The remaining five studs and nuts on each wheel were fitted with a different type of locking or retention device, as shown in Figure 26.
Figure 26: Example test configuration when testing multiple devices on each wheel.
The results of the first test cycles showed that the clamp force for both types of wheel nut and locking device on each wheel were very similar. To assess whether the effectiveness of one device was affecting the other, the set-up of the vehicle was changed so that one of the wheels had 10 standard nuts fitted to it only.

Published Project Report
TRL 23 PPR 475
Figure 27 shows that over an extended test period of 13 days the wheel fitted with only standard nuts exhibited a steady decline in clamp force. In comparison the standard nuts fitted alongside one of the nut locking devices initially showed a similar reduction in clamp load before stabilising towards the end of the test. This suggests that when more than one type of device was fitted to the same wheel there was some interaction between the devices which had some effect in mitigating the reduction in clamp force.
Figure 27: Comparison of reduction in clamp load
3.2.4.5 Condition of wheel studs and nuts
The results of the bench tests (described earlier in section 3.2.1) showed that a new fully lubricated nut and stud achieved a higher initial level of clamp load for a given input torque compared to ‘used’ nut and stud. The Junkers tests carried out earlier in this project also showed that because of the additional friction in the older nuts and studs the rate at which the clamp load fell was slower than for the new studs and nuts.
At the start of the first test cycle the studs and nuts fitted to the vehicle were new. They were re-used through several test cycles, and although they were regularly lubricated they were only replaced if a change to the set-up was needed. As these devices became more used through each test there is some evidence that the ratio of torque to clamp force reduced. This is consistent with the findings of the bench tests which also produced a lower clamp force with used nuts and studs.
To test whether the change in torque to clamp ratio was because the friction between the threads and washer interfaces had increased some additional bench tests were undertaken with some studs that had previously been used on the test vehicle during the validation trials.
The purpose of these tests was to measure the clamp force for different levels of applied torque. The following five test conditions were considered to assess whether the condition and/or level of lubrication had an effect on the result:
Used studs & nuts (‘as received’ after vehicle testing) Used studs and new nuts Cleaned and lubricated used studs with old ‘as received’ nuts Cleaned and lubricated used studs and nuts

Published Project Report
TRL 24 PPR 475
Different pair of new studs and nuts1
The results of these tests were then compared to the results of the original bench tests and the readings taken during the vehicle trials.
Figure 28 shows that there was very little difference between the five different conditions assessed in the latest programme of bench tests. The levels of clamp load for these tests were all slightly lower than the original bench tests but greater than the values from the vehicle trials. The fact that the same nuts and studs, which gave a low level of clamp load during the vehicle trials, produced a higher torque to clamp ratio that was close to the original bench tests suggests that the age of the studs and nuts used during the vehicle trials has not had a substantial influence on the results.
It also suggests that the difference between the vehicle and the bench tests could be because of another factor such as the presence of contamination on the vehicle, or a difference in material properties between the test rig and the vehicle.
Figure 28: Results of bench tests to assess influence of age and lubrication of studs and nuts.
3.2.4.6 Test conditions
For the majority of the accelerated wear tests were carried out using one of three different test conditions. Firstly, the vehicle was driven on a “rough track” surface. This is a 675m circuit designed for suspension evaluation of large vehicles. It consists of square blocks projecting out of the ground, over which the vehicle drives at approximately 10-15mile/h.
The second surface was the “Belgian Pave” which was a 1.5km circuit of uneven block paving with a variety of bends and banking. This course was less severe than the rough track and so the vehicle could be driven at about 20-30mile/h.
Finally, the third type of test was a “sprag test”. These involved repeatedly driving the vehicle forward at a low speed and then applying heavy braking and then immediately reversing the vehicle and braking again.
1 The ‘new’ nuts had previously been used during the original bench tests but were all well lubricated and run smoothly down the threads. These were the newest studs/nuts that were available.

Published Project Report
TRL 25 PPR 475
Figure 29: Rough track (left) and Belgian pave (right) test surfaces.
The first vehicle tests were carried out on the rough track surface and one of the test cycles was extended for a further two days of sprag testing followed by another two days of testing on the Belgian pave (Figure 30). This was the first incidence where the clamp load had continued to decline for the entire test and so it was considered that the introduction of the Belgian pave and sprag tests had been a factor.
Figure 30: Time history of clamp force for test cycle using three different test surfaces/methods.
For this reason the next test cycle was carried out using a combination of Belgian pave and sprag tests (Figure 31). However, the results of this test showed that after an initial reduction in clamp load there was no further decline. Therefore it is questionable whether there was any difference in the effectiveness of the above tests methods in reducing the clamp force.

Published Project Report
TRL 26 PPR 475
Figure 31: Time history for clamp force when a combination of Belgian pave and sprag tests was used.
3.2.4.7 Stakeholder workshop
Since the above test methods and test conditions were unsuccessful in consistently loosening the standard wheel nuts fitted to the vehicle a workshop was held at TRL to canvas input and feedback from interested stakeholders regarding the methodology used and the results obtained up to that point. Attendees at this meeting included representatives of vehicle manufacturers, industry organisations, bolt and fastening experts and manufacturers of wheel nut locking devices.
The main discussion points of the meeting concluded that although the tests had resulted in a reduction in clamp load there had been no evidence that the wheel nuts had rotated. This suggested that, despite the low clamp force and spigot clearances, there had been insufficient relative movement between the mating surfaces to induce vibration loosening. Instead, if tested for a prolonged period, it was considered likely that the tests could have resulted in stud failure.
Furthermore, it was suggested that mixing up the order of the wheel and nuts relative to the studs and their original mounting location could help to induce vibration loosening because the fit between the threads would not be perfect or settled.
It was also recommended that increasing the spigot clearance to 3mm across the diameter and reducing the coefficient of friction between any mating surfaces (i.e. in threads, and between wheels and hub) could also lead to more relative movement.
As a result of the discussions at the stakeholder workshop modifications were made to the test conditions and test procedure for the validation trials. In particular the wheels and nuts were repositioned onto different axles and studs respectively and a coat of graphite/molybdenum disulfide lubricant (which is resistant to temperature) was applied to the mating surfaces and threads.
The test procedure was also modified to incorporate all of the tests surfaces previously used as well as some additional manoeuvres. The revised test cycle included:
Rough track driving;
Driving over kerbs;
Spike and sprag tests;
Figure-of-eight tests;

Published Project Report
TRL 27 PPR 475
Laps of a high speed circuit;
High-G deceleration;
Driving over speed humps;
Belgian Pave; and
Laps of a handling circuit.
In spite of the changes to the test procedure, the results of the final round of testing produced similar results. Figure 32 shows that there was an initial reduction in clamp load over the first couple of days after which the clamp force started to stabilise.
Figure 32 also shows two data points where the clamp force was recorded to be much lower than the overall trend of the graph. The same drop in clamp force was exhibited by each individual wheel stud fitted to the vehicle. It is unclear what caused these lower readings but it is possible that it was because of an intermittent fault with the measurement equipment or human error. The trendline shown on the graph was generated excluding these two data points.
Figure 32: Change in clamp force for tests with a 3mm clearance between the spigot and wheel.

Published Project Report
TRL 28 PPR 475
4 Test results - potential solutions During Phase 1 of this project a number of potential solutions to loosening wheel nuts were identified. For this second phase of the project samples of these devices were tested to assess their effectiveness and durability.
Appendix B provides further detail of the devices used during this project.
4.1 Initial tightening tests
Bench tests were undertaken with the Disc-lock, Spiralock and Visilok devices. Tests were not carried out with the Wheelsure device because this product uses a standard OEM wheel stud and nut and tests with this combination had previously been completed.
Figure 33 shows that the three devices tested gave substantially lower clamp force than the standard OEM nuts. Figure 33 also shows that for an applied torque of 600Nm, the three locking devices tested all produced a clamp force below the performance corridor specified in BS AU 50 (highlighted by the red box).
Figure 33: Mean clamp force generated by torque tightening method for different wheel locking devices.
4.2 Effectiveness and durability
4.2.1 Standard tests
Junkers tests were undertaken using a range of wheel nut locking/retention devices and wheel nut movement indicators. Two samples of each device were tested and five tests were completed with each of these samples. For each test the residual clamp force as a percentage of the clamp force at the start of the test was recorded.
Figure 34 shows a box plot displaying the variation in results for each of the devices. A statistical analysis of these results revealed that, for a 95% confidence level, the residual clamp force for the Disc-lock, Spiralock, Visilok, Wheelsure, Checklink and Ric-clip devices were all statistically greater than the residual clamp force for the Standard OEM wheel nuts. Interestingly, although the Checklock device produced good consistency in results which were, on average, slightly higher than the standard OEM nuts, the

Published Project Report
TRL 29 PPR 475
difference was not great enough for it to be considered statistically different to the standard OEM wheel nuts.
One manufacturer declined permission for us to attribute specific results to their device because the results showed it had very little effect on resisting wheel nut loosening under the test conditions. However, it is important to note that this is not the primary aim of this product. It is designed to allow a driver to easily see if there has been any rotation. This device was only tested in the Junkers tests and has been labelled as “Other device” for the following two graphs.
Other device
Ric-clipChecklockChecklinkWheelsureVisilokSpiralockDisc-lockStandard OEM
Device
100%
80%
60%
40%
20%
Res
idu
al c
lam
p f
orc
e as
pe
rcen
tag
e o
f in
itia
l cla
mp
fo
rce
(%)
40
39
63
22
Figure 34: Box plot of Junkers test results.
Furthermore, the results indicate that the clamp force retained by the Spiralock device was significantly greater than the clamp force retained by the Disc-lock and Wheelsure devices. No significant difference was found between the results of the tests with the Disc-lock and Wheelsure devices.
Figure 35 shows an example of a time history for each of the wheel nut locking devices in comparison to the standard OEM nuts when used with new wheel studs. These examples are typical of the average of the individual tests undertaken.

Published Project Report
TRL 30 PPR 475
Figure 35: Example time histories of Junkers tests with wheel nut locking devices used on new wheel studs.
For the Visilok device although the results of the Junkers tests showed that a high proportion of the initial clamp force was maintained some caution must be noted in this result because a visual inspection of the device during and after the tests showed that, in some cases, the device might not have worked as intended.
For example, in some tests the wheel nut initially rotated slightly causing the clamp force to drop, but then stopped and locked in position without rotating sufficiently for the pins to activate in the grooves in the stud. This result suggests that the wheel nut was in some way binding on the wheel stud because the torque required to undo the nut was greater than was originally used to tighten it. It should be noted that the Visilok devices used during the project were prototype versions and the wheel nuts had cut threads rather than rolled threads. Therefore it is possible that this may have affected the test in some way. This unusual result was discussed with Visilok who reported that during their own test programme they had not encountered any problems like this.
Also in some other tests the pins did activate as designed but they deformed during the test as the nut continued to rotate. In some cases the tip of the pins sheared off completely (Figure 36). It is acknowledged the Junkers test is a very harsh test and so it is possible that the design would be sufficient for the loads experienced during normal driving, however this could not be confirmed.
Figure 36: Example of deformation of Visilok pins during Junkers test. Sheared pins displayed on the right.

Published Project Report
TRL 31 PPR 475
Similar tests were also undertaken with the above devices but in combination with used wheel studs. In general the results of these tests were very similar to the test with new wheel studs with all of the devices maintaining a large proportion of the initial clamp force.
For the Ric-clip a large scatter was evident from the individual results. A closer analysis (Figure 37) showed that for the first of the two Ric-clip samples tested, the clamp force at the end of the test was, on average, 60% of its initial value. In contrast, the final clamp force for the second sample was only 30% of the initial value. If these samples were considered separately then the results from the first sample would have been statistically greater than the standard OEM nuts, whereas the second sample showed no significant difference to the standard OEM nuts. This might indicate that the first sample had a tighter fit on the wheel nut and was able to resist the loosening slightly better than the second sample.
Figure 37: Difference in Junkers test results for two different samples of Ric-clip.
The Checklink product is a plastic device designed as a restraining device to be fitted to adjacent wheel nuts. Figure 38 shows how, during the Junkers test, the wheel nut was still able to rotate, causing the device to deform. The manufacturer of this device has indicated that its deformation under the conditions of a loose wheel nut developing is intrinsic within its design to show, by that deformation, that the wheel nuts require inspection.

Published Project Report
TRL 32 PPR 475
Figure 38: Before (top) and after (bottom) images of Junkers test with Checklink device.
Both the Checklock and Ric-clip devices are metallic and are designed to grip the outer edge of the wheel nut. An inspection of these devices after each test revealed evidence of light scratches on the inner faces of the device. It is unclear if these marks were caused by the wheel nut rotating within the device during the tests or whether the marks were caused during fitment where the metallic springs need to be expanded over the nuts and then allowed to relax and grip the nut.
4.2.2 Extended tests
Figure 39 shows the results of the extended tests that were undertaken with the standard OEM nuts as well as the Disc-lock, Spiralock, Visilok and Wheelsure devices. It can be seen that all the devices maintained a high proportion of the initial clamp force
Figure 39: Extended Junkers tests.
4.3 Accelerated wear tests
It was not possible to develop a test procedure representative of real world behaviour that caused the standard OEM wheel nuts to loosen in a consistent manner.
As a result it has not been possible to conclusively compare the real-world effectiveness of the different devices used in this project. The performance of the standard OEM wheel nuts were described earlier in section 3. These results suggested that when two different types of wheel nut/locking device were fitted to the same wheel (i.e. five of one device and five of another) the performance of one type of device could affect the other. For

Published Project Report
TRL 33 PPR 475
this reason, the following analysis has been limited to only include tests where each wheel had only one type of wheel nut/device fitted to it.
Only one test cycle provided notable results for the locking devices. Figure 40 shows that the clamp force for all 10 of the Disc-locks devices fitted to one wheel fell to zero within four days of the start of one particular test cycle, although no wheel loss or detachment happened because the tests were closely monitored and testing was stopped shortly after.
Figure 40: Residual clamp force during validation trials.
It should be noted that the configuration for this test was not in accordance with Disc-lock’s recommended tightening procedure of tightening the nut to 700Nm because they had been tightened to a lower torque to try and induce wheel nut loosening more quickly. Furthermore, the Disc-lock nuts were not brand new because they had been used for several test cycles.
It was unclear if the loosening of the Disc-lock nuts had been caused because ‘used’ nuts had been used and the ramps had become worn. Therefore five of the 10 Disc-lock nuts were replaced with new Disc-lock nuts and all 10 nuts were re-torqued and the test cycle was continued. As shown in Figure 41 during the extended test all of the devices maintained a constant clamp force.

Published Project Report
TRL 34 PPR 475
Figure 41: Residual clamp force during validation trials – extended test.
The final test cycle of the project used the revised test methodology described in section 3.2.4.7. Figure 42 shows that each of the devices that were tested lost a similar amount of clamp force during the test cycle. It also illustrates that although the devices were all tightened to the same nominal torque (200Nm) the clamp force generated by some devices was a lot lower than the other devices, as previously demonstrated in the bench tests.
Figure 42: Clamp force during final test cycle – validation trials.
Figure 41 and Figure 42 also shows that there was no significant difference in the performance of the standard OEM (right hand threads) or the directional (left-hand threads).

Published Project Report
TRL 35 PPR 475
5 Cost benefit analysis As part of this project a cost benefit analysis was undertaken. This used the accident statistics and surveys undertaken in Phase 1 of the project, as well as the results of the tests in Phase 2 to consider the effect of the following options for possible new regulations, Codes of Practice, or maintenance policies:
Option A: Do Nothing
Option B; Introduce voluntary or compulsory procedures;
Option C: Re-introduce the use of directional threads;
Option D: Implement a review of heavy vehicle hub and wheel fixing design;
Option E: Introduce wheel nut retention devices on all vehicles; and
Option F: Introduce wheel nut movement indicators on all vehicles.
The following sub-sections summarise the main findings of each option. Full details on the analyses are provided in Appendix C to this report.
5.1 Option A: Do nothing
This option considered the costs of continuing with the existing situation based on available data on the frequency of occurrence of wheel loosening and detachment incidents and their consequences including that obtained in the latest surveys.
Using published casualty valuations and operators’ own estimates of the cost of detachments, the current costs of the UK’s wheel fixing/detachment problems are summarised in Table 2 below.
Table 2: Current costs of the UK’s wheel fixing/detachment problems.
Estimated number of incidents per year (with costs)
Wheel fixing
defects*
Wheel detachment
[no collision]
Wheel detachment
[damage only
accident]
Wheel detachment
[injury accident]
Wheel detachment
[fatal accident]
Total costs
Upper estimate
11,000 (£4.78m)
400 (£0.60m) 134 (£0.47m) 27 (£1.04m) 7 (£11.79m) (£18.68m)
Lower estimate
7,500 (£3.26m)
150 (£0.23m) 50 (£0.18m) 10 (£0.39m) 3 (£5.05m) (£9.10m)
Unit costs £435 £1,500 £3,500 £38,594 £1.68m -
*: loose, missing, damaged nuts, damaged, failed studs
It was estimated that there is an ongoing cost to the industry and society as a whole of between approximately £9million and £19 million per year. There were 547,300 trucks and buses licensed in the UK in 2008 (DfT, 2009). This means that approximately £16 to £34 could be spent on every vehicle in the UK in order to eliminate the problem and provide a net financial benefit in the first year of implementation.
5.2 Option B: Introduce voluntary or compulsory procedures
This option was concerned with establishing and maintaining operational procedures designed to minimise and, if possible, eradicate wheel loosening and detachments. It

Published Project Report
TRL 36 PPR 475
considered two ways of achieving this (1) voluntary procedures and (2) compulsory procedures.
Some information was obtained on maintenance costs. For example, re-torquing has been estimated at £6 per wheel. Furthermore, at least one operator consulted stated that they were now re-torquing wheel nuts every week for all vehicles in order to try to avoid wheel detachment.
In practice, many operators/drivers already re-torque their wheels either at regular intervals or whenever a wheel has been removed and replaced for any reason. Table 3 shows the additional cost of weekly re-torquing for different proportions of the HGV population.
Table 3: Additional costs for weekly re-torquing
Percentage of wheels needing
re-torquing
Additional annual costs
(£m)
1% 8.1
2% 16.1
10% 80.6
The benefits would be to save a proportion of the incident and accident costs shown in Table 2. The result suggests that re-torquing would not be cost effective if more than about 2% of wheels needed weekly attention.
5.3 Option C: Re-introduce directional threads
Directional threads (left hand threads on the nearside wheels) were in general use up to about 15 or 20 years ago but are no longer offered as an option on new vehicles. One of the reasons for their withdrawal was the additional stock cost of two sets of nuts and, more important, because a wheel stud could be damaged by the careless use of a nut with the wrong thread direction especially if forced onto the stud with a pneumatic wrench.
It has been suggested that a return to the use of directional threads might result in fewer wheel losses. The test results gathered during the accelerated vehicle trials showed no significant difference to the standard OEM (right-hand) threads. However, the results of the vehicle trials were inconclusive about the relative effectiveness of a range of potential countermeasures designed to prevent or mitigate heavy vehicle wheel detachment. Therefore, if it were assumed that the directional threads did offer some level of benefit of standard right-hand threads the costs per vehicle that could be spent to achieve a benefit-to-cost ratio of 1 (i.e. break-even) in the first year of implementation can be calculated, as shown below:
Assuming 100% effective at preventing all wheel detachments – between approximately £10.70 and £25.40 per vehicle
Assuming that the frequency of occurrence at the nearside is reduced to that of the offside (equivalent of a reduction to 42% of the current level) – between approximately £4.50 and £10.70 per vehicle
Assuming that the bias becomes 60% nearside and 40% offside (equivalent to a reduction to 52% of the current level) – between approximately £5.60 and £13.20 per vehicle

Published Project Report
TRL 37 PPR 475
5.4 Option D: Implement a review of hub and wheel fixing design.
In Phase 1 of this project some respondents to the questionnaires suggested that the basic design of wheel hub and nuts may be contributing to the wheel detachment problem, although it should be noted that 75% of manufacturers and 38% of operators disagreed with this.
The purpose of this option was to consider whether clamp loads would be maintained more consistently (given a suitable re-torquing regime) with a change to 12 studs per wheel (instead of 10) or with larger diameter studs (possibly 26mm instead of 22/24mm) or with both changes together.
An alternative may be a complete re-design of the hub and wheel carrying function. Reviews of standards in the airline industry have shown that differing designs that do not rely solely on clamp force are in existence.
This option has the potential to eliminate wheel fixing problems entirely. As such the benefits in terms of reducing incidents and accidents are equivalent to the costs described for option A and between £16 and £34 per vehicle could be spent to achieve this and achieve a cost benefit ratio of one. However, some large operators are known to already implement periodic torque checks at intervals of 1 week to 6 weeks. The maintenance costs derived for Option B showed that the cost per vehicle of a weekly torque check was approximately £1,532 per annum. It is not known how many vehicles nationally undergo this type of regime but if it was assumed that 1% of all vehicles currently have this type of maintenance the annual cost to industry would be approximately £8.1 million. If 10% of vehicles were subject to such maintenance it would cost approximately £80.6 million per year.
If a maintenance free wheel fixing design could be implemented it would save the costs of wheel fixing problems but would also save the costs of the maintenance regimes that at least some operators currently employ. However, there are currently no proposals for a revised wheel fixing design so the actual costs of this measure are not yet known. The costs of designing, developing and implementing the change are likely to be significant but the ongoing costs per vehicle once the new design is in production could range from cheaper than currently to considerably more expensive, depending on the design.
5.5 Option E: Require wheel nut retention devices to be fitted to all vehicles.
This option would require the fitment of an approved wheel nut retention devices to all heavy vehicles. This could be implemented as a type approval requirement for new vehicles but for the purpose of this simplified analysis it has been assumed that a retro-fit would be required such that at the time this measure was implemented all heavy vehicles (HGVs and PSVs) currently licensed in Great Britain would need to be fitted with a nut retention device.
Since the vehicle tests in this project were unable to provide conclusive results about the relative effectiveness of the different devices the following theoretical scenarios have been considered for the range of devices identified and tested earlier in the project:
Option E1: All accidents and casualties resulting from loose wheel fixings and/or wheel detachments are eliminated by the fitment of a nut retention device;
Option E2: Incidents of wheel detachment are eliminated by the fitment of a nut retention device, but clamp loss over time is still evident and would still require routine maintenance; and
Option E3: Effectiveness of various nut retention devices is based on the assumption that the results of the Junkers tests in this project are representative of their real world effectiveness.

Published Project Report
TRL 38 PPR 475
The cost associated with purchasing each of these devices was obtained, where possible, from the manufacturer. If this data was unavailable then an estimated cost for each device was used. The estimated unit cost for low volume represents the approximate price assuming that a single company or operator purchased a batch to fit to their own vehicles. The high volume costs assumes that a discount of approximately 30%-50% could be achieved if these devices were produced and purchased in large numbers, sufficient to equip the entire UK fleet.
Table 4: Costs to purchase various countermeasures.
Device Unit cost (£) Cost per wheel (£)*1
Low volume
High volume
Low volume
High volume
DAF Nut £2.00 £1.00 £20.00 £10.00
Wheelsure £4.75 £2.38 £47.50 £23.75
Disc-lock £3.65 £1.83 £36.50 £18.25
Visilok £11.50 £8.05 £115.00 £80.50
Spiralock*2 £4.00 £2.00 £40.00 £20.00
Ric-clip £2.87 £1.44 £14.36 £7.18
Checklink £1.00 £0.80 £5.00 £4.00
Checklock £1.50 £0.75 £7.50 £3.75
*1: Assuming 10 wheel studs per wheel. *2: Cost estimated by TRL because costs from manufacturer were unavailable at time of writing
Using data from Transport Statistics (DfT, 2009) it was estimated that there are approximately 25.8 million wheel studs on the UK heavy vehicle fleet.
5.5.1 Option E1: Eliminate 100% of wheel fixing problems
For this scenario it has been assumed that for the year of implementation all currently licensed vehicles in Great Britain would need to be retro-fitted with a nut retention device. For subsequent years, it has been assumed that nut retention devices would only need to be fitted to new registrations.
By eliminating 100% of all accidents and casualties associated with wheel fixing problems and/or wheel detachments it has been estimated that the potential casualty savings of £9.1m to £18.7m per year could be achieved, as illustrated in Table 2.
The analysis in Option D assumed that between 1% and 10% of vehicles currently undergo a weekly torque check. If this maintenance could be eliminated by fitting a nut retention device then this could potentially offer a further saving of between £8.1million and £80.6million per year.
Considering the different costs for each device the following break even periods (Table 5) were estimated assuming each was 100% effective at eliminating wheel fixing problems and wheel detachments. Unsurprisingly it showed that devices with the lowest cost per wheel offered the shortest time to break-even. It can also be seen that reducing the unit cost of each device would be critical in reducing the period of time needed before a benefit-to-cost ratio of 1 could be achieved.

Published Project Report
TRL 39 PPR 475
Table 5: Estimated time to break-even assuming 100% effectiveness at eliminating wheel fixing and wheel detachment problems.
Device Number of years to break-even
Lower Estimate Upper Estimate
Wheelsure 1 10+
Disc-lock 1 7
Visilok 1 10+
Spiralock 1 9
Ric-clip 1 3
Checklink 1 1
Checklock 1 2
5.5.2 Option E2: Eliminate wheel detachments only
In reality it is unlikely that 100% of problem could be eliminated therefore, for this scenario, it was assumed that each device would be unable to prevent some loss of clamp force but would be capable of preventing the wheel nuts falling off, thus eliminating wheel detachments.
For this scenario the same costs to purchase the different devices as used in Option E1 were applied. Using the figures only associated with wheel detachments in Table 2, it was estimated that there could be an annual casualty saving of between £5.8million and £13.9million per year. Finally, because this scenario assumes that there would remain some loss of clamp force, the potential benefits from reduced maintenance were not applied because it was assumed that torque checks would still be necessary.
Table 6 shows that the estimated time to break even, if each of these devices were fitted to the vehicle fleet. It can be seen without the potential benefits from preventing clamp loss and from reduced maintenance; the time taken for each device to achieve a benefit-to-cost ratio of 1 is increased by several years over the scenario that 100% of all problems would be eliminated.
Table 6: Estimated time to break-even assuming only wheel detachment problems were eliminated.
Device Number of years to break-even
Lower Estimate Upper Estimate
Wheelsure 6 10+
Disc-lock 4 10+
Visilok 10+ 10+
Spiralock 5 10+
Ric-clip 2 10+
Checklink 1 3

Published Project Report
TRL 40 PPR 475
Checklock 1 5
5.5.3 Option E3: Effectiveness of devices based on Junkers results
During Phase 2 of this project Junkers tests were used to compare how well the different devices maintained clamp force when subject to severe vibrations. For the purpose of this scenario it has been assumed that the results of the Junkers tests represent the relative performance of the different devices during normal service. Since the vehicles trials did not provide conclusive results the validity of this approach should be treated with caution because it is questionable whether the results of Junkers test are truly indicative of their real world effectiveness, especially since it is recognised that the Junkers tests is a particularly harsh test causing standard wheel nuts to come loose in a matter of minutes.
Table 7 shows the average proportion of the initial clamp force retained by each device during the Junkers tests. These figures have been normalised in relation to the result of the standard OEM wheel nuts to estimate their relative effectiveness in preventing wheel fixing problems and/or wheel detachment.
Table 7: Estimated real-world effectiveness of devices based on Junkers tests results.
Device Average proportion of initial clamp force
retained during Junkers tests (%)
Estimated effectiveness of device
based on Junkers results (%)
Standard OEM nuts 29.4 0
Wheelsure 85.6 80
Disc-lock 79.6 71
Visilok 89.2 85
Spiralock 92.7 90
Ric-clip 44.7 22
Checklink 42.6 19
Checklock 40.3 15
For this scenario, the same estimated costs used in the previous two scenarios for each device have been applied. However, the estimated casualty benefits and the estimated maintenance benefits used in Option E1 have been multiplied by the estimated effectiveness of each device to calculate the approximate number of years required for each device to achieve a benefit-to-cost ratio of 1, as shown in Table 8.

Published Project Report
TRL 41 PPR 475
Table 8: Estimated time to break-even assuming Junkers test results represent real-world effectiveness of each device.
Device Number of years to break-even
Lower Estimate Upper Estimate
Wheelsure 1 10+
Disc-lock 1 10+
Visilok 3 10+
Spiralock 1 10
Ric-clip 1 10+
Checklink 1 7
Checklock 1 10+
5.6 Option F: Fit wheel nut movement indicators.
It should be stressed that the purpose of this device is simply to alert drivers and maintenance engineers of any wheel nut movements; their use cannot prevent wheel nut loosening and can only prevent wheel detachment if used diligently.
The retail cost of these devices is currently about 42p each. Assuming a 50% discount if purchased in bulk, the estimated cost to fit indicators to the entire UK fleet (25.8million studs) would be approximately £5.4million to £10.8million.
These devices would only be effective if drivers/operators systematically used the indicators and took any necessary corrective action. There would not, therefore, be any expected benefit from reduced maintenance bills. If it is assumed that these devices will not affect wheel nut loosening but would eliminate wheel detachment then the benefits would be between £5.8m and £13.9m per year. This would give a cost benefit ratio of between 0.5 and 2.6 in the first year. However, given the human involvement in this solution, it seems unlikely that the problem of wheel detachment will be entirely eliminated.

Published Project Report
TRL 42 PPR 475
Discussion There were several aims for the second phase of the project into heavy vehicle wheel detachment. The first aim was to evaluate the consistency of clamp forces generated by different tightening methods and to evaluate the different recommendations for re-torquing the wheels in order to provide further standardisation of best practice.
Overall, the tightening tests showed that the use of lubrication on some or all of the mating surfaces and threads helped to increase the magnitude of clamp force that was generated. The tests also showed that lubrication was necessary with used studs and nuts in order to achieve a clamp force of 190-240kN at a torque of 600Nm (as specified in BS AU 50).
Used studs were obtained from several vehicles that had been used by a haulage company for many years. They were in particularly poor condition but were considered to represent the type of conditions that could be experienced in service. Almost all of the studs were suffering from corrosion and many also had damage to some of the threads.
One of the most interesting results from the tightening tests was the variation that could be seen between some studs and nuts of nominally the same specification. Figure 13 & Figure 14 showed that some studs produced very repeatable results whilst others exhibited much greater scatter and a substantially different magnitude of clamp force. For example, with the used devices in the degreased condition one stud/nut combination gave a clamp force of approximately 40-60kN lower than the other. Furthermore, substantial differences in clamp force were also found between nuts that were tightened, using the same procedure, on the laboratory test rig and the test vehicle. Specifically, the magnitude of clamp force generated on the vehicle was found to be lower than in the bench tests. It is possible that these differences are caused by different material properties between the test rig and vehicle or by the artificial contamination that was introduced for the accelerated wear tests.
Whilst there have been many advances in manufacturing technology, the requirements and tolerances specified in BS AU 50 have remained unchanged for many years. The variation in results, between nominally identical studs and nuts, suggest that improvements to the magnitude and consistency of clamp force could be achieved if the technical requirements of BS AU 50 were reviewed and, if necessary, revised. If such an exercise were undertaken then the various locking and retention devices should also be included in the analysis because the tightening tests showed that for the same nominal level of torque, a much lower clamp force was generated when compared to the standard OEM wheel nuts. It should be noted that some of the manufacturers of these devices acknowledge, in their promotional literature, that additional torque is required to achieve a suitable clamp force.
The graphs also showed that for each group of tests undertaken with an individual stud/nut combination there was often a single test that produced a clamp force with a magnitude either much higher or lower than the other tests. This result supports the theory suggested during the stakeholder meeting that repeatedly fitting wheel nuts to the same studs would produce a better, more settled, fit than when a nut was first fitted to a different stud. It could be that tightening a wheel nut, releasing it and then re-tightening it could be recommended as a procedure when re-fitting a wheel. Further work would be necessary to investigate this to ensure that there were no adverse effects, such as over-tightening or stud failure from undertaking this method.
The tests to assess the relaxation and re-torquing methods showed that only a small percentage (<10%) of the initial clamp force was lost during the different test procedures. The straight-line braking and figure-of-8 manoeuvres produced the greatest reduction, probably because these types of manoeuvre also generate the greatest longitudinal or lateral forces on the wheels. The results suggest that it is necessary for the vehicle to be driven, rather than left stationary, to induce the greatest loss in clamp force. However, given that the accelerated wear tests with the same test vehicle did not

Published Project Report
TRL 43 PPR 475
show much evidence of vibration loosening during the tests there is some uncertainty about whether the magnitude of clamp loss during the relaxation tests is representative of real service.
In general the tests undertaken with the vehicle produced unremarkable results and despite deliberately trying to induce loosening by using low clamp forces and introducing contamination it was not possible to develop a test procedure to consistently induce vibration loosening of the standard OEM wheel nuts.
The mathematical analysis that was undertaken at the start of the project estimated that a clamp force of approximately 200kN would be required to secure a wheel during normal service. However, some of the vehicle tests were undertaken with a much lower clamp force (less than 100kN in some cases) without any sign of vibration loosening. It is unclear why the wheel nuts failed to loosen under these conditions especially since efforts were made to induce loosening by also introducing contamination to the mating faces.
In the past it has been suggested that a lack of maintenance or human error during fitting could be a main cause of wheel fixing problems. It could be argued that the lack of vibration loosening during the tests in this study supports this theory. However, although accelerated wear tests were used, it should be remembered that incidents of wheel detachments and wheel fixing problems are statistically very rare and careful attention was made to tighten wheel nuts to very specific conditions during these trials.
If it was assumed that all incidents of wheel detachment and fixing problems were caused by problems during wheel fitting then this would only represent a very small proportion of all wheel and wheel nut changes. For example, there are approximately 440,000 HGVs licensed in Great Britain (DfT, 2008) that each have between two and six axles. Results from the consultation in Phase 1 of this project indicated that vehicles in the waste sector typically have their wheels removed 7-10 times per year, and vehicles in other sectors have their wheels removed approximately twice per annum.
This equates to between 3.5million to 36.9million wheel changes per annum, and 35.2million and 370million individual nut removal and returns per annum.
The results from Phase 1 of this study estimated that there were approximately 150-400 incidents of wheel detachment per annum in the UK and approximately 7,500 – 11,000 incidents of wheel fixing problems a year. If it were assumed that all of these wheel detachment and fixing problems were caused by problems during wheel fitting then they would only represent 0.0004% - 0.01% of all wheel changes (i.e. one wheel detachment every 8,800 – 246,400 wheel changes). Similarly if all incidents of wheel fixing problems were assumed to be caused by problems during fitting then the number of incidents would only represent 0.002% - 0.03% of all the times a wheel nut is tightened (i.e. one loose or missing wheel nut every 3,200 – 49,280 changes).
It is questionable whether the frequency of problems is low enough to be caused solely by human error but the above example does highlight the large number of wheel and wheel nut changes made in Great Britain each year in comparison to the estimated number of incidents. It doesn’t however; explain why some problems occur many weeks after the last wheel change.
For the vehicle tests a range of test methods and test surfaces were used throughout the programme to apply different magnitudes and frequencies of force through the wheels. Of the different parameters considered the most noticeable effect was the introduction of artificial contamination. When it was introduced it could be seen that there was initially a small reduction in clamp force as the contamination was worn away. Inspection of the wheels after one test showed how the devices which exhibited the greatest reduction in clamp force also displayed the most evidence that the contamination had been worn away. Also, the one test cycle undertaken without any contamination introduced showed that there was no reduction in clamp force during the test, highlighting the importance of clean mating surfaces.

Published Project Report
TRL 44 PPR 475
Another aim of the study was to assess the ability of different wheel nut locking/retention devices to reduce the frequency of wheel nut loosening and wheel detachment, and to evaluate the durability and practicality of the different devices. Since it was not possible to cause the standard OEM nuts to loosen in a consistent manner it has not been possible to produce a baseline result against which other devices could be compared. Therefore it has not been possible to draw robust conclusions as to their real-world effectiveness.
The Junkers test is acknowledged to be a harsh test that is not fully representative of real world conditions. For example, by using needle roller bearings between the two plates of the Junkers machine, the friction between the mating surfaces is reduced to almost zero such that, irrespective of the clamp load applied by the stud/nut, relative motion is possible between the mating surfaces, thus guaranteeing that vibration loosening of a standard nut will occur. Additionally the rapid nature by which the standard OEM nuts loosen suggests that the forces exerted on the device are much greater than those typically seen on a real vehicle. Therefore it is possible that some of the deformation and failures seen during the Junkers tests might never actually occur in service.
If the Junkers results were assumed to be representative of real world results then a statistical analysis showed that all but one of the devices tested did offer some improvement in the amount of clamp force retained. The Visilok device maintained a high proportion of clamp force but the result is questionable because there was some evidence of binding of the threads and damage to the device during the test.
During the accelerated wear tests with the test vehicle the only device to come loose during the tests was the Disc-lock device. During that particular test all of the devices fitted to the vehicle tested lost a large proportion of their clamp force. However, the test result could not be repeated and when the Disc-locks were retightened they maintained a consistent clamp force for the remainder of the test.
The biggest unanswered question from this study remains why none of the wheel nuts suffered from vibration loosening during the accelerated wear trials. The test procedure used a variety of methods that included cornering, braking, high and low speed driving as well as a range of tests surfaces with differing levels of bumps. Furthermore the tests vehicle was selected based on the results of Phase 1 which indicated that older tipper trucks, that more frequently have wheel changes, are one of the vehicle types most frequently involved in incidents of wheel nut loosening or wheel detachment. By the end of the test programme the test vehicle was suffering from severe wear and tear. For example, the fuel tank and headlights were starting to loosen, chassis blocks were missing and the differential was leaking (Figure 43). Yet despite the obviously harsh tests the wheel nuts had failed to loosen.
Figure 43: Wear and tear to the test vehicle.

Published Project Report
TRL 45 PPR 475
6 Conclusions 1. During this phase of the project tests were undertaken to assess the different
procedures for tightening and re-torquing wheel nuts in different conditions. Junkers tests were used as a quick and efficient method to assess the relative performance of potential countermeasures, and full vehicle test were carried out to provide test conditions more representative of real world conditions.
2. The age, condition and level of lubrication applied to the mating surfaces and threads of standard wheel studs and nuts was found to affect the magnitude and consistency of clamp force generated during the tightening tests.
3. Tests also showed some evidence of substantial variation between individual studs/nuts with nominally the same specification. It is recommended that a review of BS AU 50 is undertaken to investigate if any potential improvements to the magnitude and consistency of the clamp force generated could be achieved by amending the technical requirements to reduce variation in the material properties of wheel studs and nuts.
4. Standard OEM studs that had previously been used in normal service and the new locking devices tested during the tightening tests were found to generate a clamp force below the value required as part of BS AU 50, and below the value calculated as part of the mathematical analysis.
5. The tests to assess the relaxation and re-torquing methods showed that only a small percentage (<10%) of the initial clamp force was lost during the different test procedures. The results did suggest that it is necessary for the vehicle to be driven, rather than left stationary, to induce the greatest loss in clamp force.
6. The Junkers tests showed that the various locking and retention devices offered some level of benefit over the standard OEM nuts alone by retaining a greater proportion of the initial clamp force.
7. During the Junkers tests the Visilok device maintained a high proportion of the initial clamp force but there was evidence that it had bound up on the threads and, in some case, deformed during testing therefore this result is not considered representative of how the device was designed to work in real service.
8. Using accelerated wear tests with a test vehicle it was not possible to develop a test procedure, representative of real world service, which quickly and consistently caused standard OEM wheel nuts to loosen. Therefore it has not been possible to conclusively compare the real-world effectiveness of the different devices used in this project.
a. During one of the accelerated wear tests the clamp force for all 10 of the Disc-locks devices fitted to one wheel fell to zero within four days of the start of one particular test cycle. It should be noted that configuration for this test was not in accordance with Disc-lock’s recommended tightening procedure because they had been tightened to a lower torque to try and induce wheel nut loosening more quickly. The standard OEM wheel nut and the other devices fitted to the vehicle at the same time also lost some clamp force but showed no sign of vibration loosening. The reason for this result is not known and could not be repeated when the nuts were re-tightened.
b. The vehicle tests indicate that maintenance of the wheel fixing joint is important because the vehicle tests undertaken without any artificial contamination maintained a greater proportion of the initial clamp force that similar tests with contaminations.

Published Project Report
TRL 46 PPR 475
7 Acknowledgements The work described in this report was carried out in the Safety Division of the Transport Research Laboratory. The author is grateful to Iain Knight who carried out the technical review and auditing of this report.
References Main Report
Bridgestone (2008), Truck Point Re-torque manual, Issue 2:2008, Bridgestone Uk Ltd.
BSi (1994), BS AU 50: Tyres and wheels. Part 2: Wheels and rims. Section &: Code of practice for the selection and care of wheels for commercial vehicles. British Standards Institution, 1994.
DfT (2009), Transport Statistics Great Britain 2009 Edition. The Stationary Office, London, September 2009.
Knight I, Chinn B, Fenn B & Dodd M (2002), Factors that limit improvements in commercial vehicle brake performance – final report, PR/SE/543/02, TRL Limited, Crowthorne.
Knight I, Dodd M, Grover C, Bartlett R & Brightman T (2006), Heavy vehicle wheel detachment: frequency of occurrence, current best practice and potential solutions. PPR086, TRL Limited, Crowthorne.

Published Project Report
TRL 47 PPR 475
Appendix A Summary of accelerated wear test conditions
Test N° Test Type Initial tightening ContaminationTest
Duration
1 Rough Track ~200kN Dirt 5 days
2 Rough Track ~200kN Dirt + Paint 5 days
3 Rough Track ~100kN Dirt + Paint 8 days
4 Sprag TestsContinued from test 3
(~30-60kN)Dirt + Paint 2 days
5 PavéContinued from Test 4
(~20-60kN)Dirt + Paint 2 days
7 Sprag & PavéContinued from test 6
(~15-20kN)Dirt 6 days
8 Rough track ~100kN None 5 days
9 Revised procedure* ~200Nmgraphite/molybdenum
disulfide lubricant 10 days
* included Rough track driving, Driving over kerbs, Spike and sprag tests, Figure-of-eight tests, Laps of a high speed circuit, High-G deceleration, Driving over speed humps, Belgian Pave, and Laps of a
handling circuit.
6 Sprag + Pavé ~100kN Dirt + Paint 5 days

Published Project Report
TRL 48 PPR 475
Appendix B Description of devices tested
B.1 Disc-Lock nut
The Disc-Lock nut is a free spinning nut split into two sections comprising a nut and a hexagon washer. Both sections have interlocking cams which, when subjected to shock or vibration, attempt to rise against each other. The angle of the cams is greater than the pitch angle of the stud and nut thread, causing a wedging action to take place thus resisting vibration loosening. The fitment of the Disc-Lock nut does not require any stud modification.
Figure A1: Disc-Lock nut
B.2 Spiralock nut
The Spiralock nut is a free spinning nut with a re-engineered internal thread form incorporating a 30 wedge ramp at the root of the thread. The wedge ramp allows the bolt to spin freely relative to the female threads until clamp load is applied. When tightened, the crests of the standard male thread form are drawn tightly against the wedge ramp, eliminating radial clearances and creating a continuous spiral line contact along the entire length of the thread engagement. Its manufacturers claim that this continuous line contact spreads the clamp force more evenly over all the engaged threads, improving joint fatigue life as well as the integrity of the threaded surface by eliminating the transverse motion that causes loosening under vibration. The Spiralock thread form mates with the standard 60 thread form and fitment of the nut does not require any stud modification. Spiralock advise that a threaded joint containing the Spiralock internal thread form will require approximately 10% to 15% higher torque in order to generate the same tension as that in a similar joint containing a standard internal thread form.
Figure A2: Spiralock thread form

Published Project Report
TRL 49 PPR 475
B.3 Wheelsure
The Wheelsure device augments the standard stud and nut assembly with a counter-threaded locking stud and a cap which covers the Wheelsure stud and original wheel nut. It is claimed that in the event of the wheel nut starting to loosen the Wheelsure stud tightens in the opposite direction, locking the nut in place preventing further loosening. Fitment of the Wheelsure device requires the drilling and tapping of a small hole in the end of the wheel stud to accept fitment of the Wheelsure stud. For the purposes of the research a modified design, operating on an identical principle to the production device, was used that was compatible with the clamp load measurement instrumentation.
Figure A3: Wheelsure production (left) and modified (right) devices
B.4 VisiLok nut
The VisiLok device comprises a nut incorporating a spring driven lock and flag mechanism, which operates in conjunction with a modified, slotted stud. In the event of relaxation and movement, the mechanism drops three securing pins into the slots in the stud while simultaneously raising three bright yellow flags above the surface of the nut. It is claimed that clamp load and other specification characteristics of the VisiLok nut are exactly as the original equipment manufacturers specification because the VisiLok device is effectively incorporated into the existing nut and stud design, and that when triggered the flags arrest any further movement. To be effective three longitudinal slots must be machined on the stud. Fitment is performed with a normal socket.
Figure A4: VisiLok nut and stud with flags raised

Published Project Report
TRL 50 PPR 475
B.5 Checklink
The Checklink is not a wheel nut locking device. It works by linking adjacent nuts together so that a loosened wheel nut will not rotate off the stud. Distortion of the wheel nut link indicates that a wheel nut has loosened off.
Figure A6: Checklink
B.6 Checklock
The Checklock is a wound wire device that links adjacent nuts together. Squeezing the arms together expands the coils allowing it to be pushed onto the nuts, and once in position releasing the arms secures the device.
Figure A7: Checklock
B.7 Ric-Clip
The Ric-Clip is a wound wire device that links adjacent wheel nuts together. Fitment follows a similar procedure to that described for the Checklock with an additional step of hooking the ends of the arms over each other to lock the device in position. It is claimed that with the device correctly locked in position, if a nut starts to loosen the spiral action spring gripping it is wrapped even tighter, and it is virtually impossible to slacken the nut with a spanner, yet it is easily removed when the two arms are unlocked and pulled apart.

Published Project Report
TRL 51 PPR 475
Figure A8: Ric-Clip

Published Project Report
TRL 52 PPR 475
Appendix C Cost benefit analysis
C.1 Title of proposal
Possible new regulations, Codes of Practice or maintenance policies relating to the provision of wheel fixings on heavy vehicles, and the consequences for accident reductions.
C.2 Purpose and intended effect
C.2.1 Objectives
To improve the safety record of heavy vehicles in relation to the frequency with which wheels become detached and so make a contribution towards the accident reduction targets.
The specific objectives of this project, together with the research methods, are described in the project’s final report (Knight et al, 2006).
C.2.2 Background
The detachment of wheels from heavy commercial vehicles has been an issue for many years and there has been a considerable amount of investigative work and comment on the subject.
There have been accidents due to wheels becoming detached and some have resulted in fatalities. Before the start of this project anecdotal information was available that suggested that there could be between 2000 - 3000 cases of wheel detachment per annum and The Department of Transport undertook a survey (1997) throughout Great Britain to identify the potential scale of the problem. It recorded a total of 427 cases with 99 instances where the wheel was completely detached which resulted in 4 cases of personal injury. The survey was run for three months by the Association of Chief Police Officers (ACPO) and for two months by the Vehicle Inspectorate [now Vehicle Operator and Services Agency (VOSA)]. There was a strong indication that, in 46% of the incidents, maintenance was a contributory factor. Following this, the Department produced a guidance leaflet to industry ("Careless Torque Costs Lives") which was produced to raise the profile of wheel detachment and provide some recommendations that might help to improve the situation.
It is generally understood that the key method of avoiding wheel loosening is to maintain the clamp load at its design level. The specification of torque settings is the generally accepted method employed to achieve this.
The primary cause of wheel loosening & detachment is thought to result from the harsh environment experienced by the wheels – vibration, sudden shock loads, braking loads and high torque loads (for driven wheels). Gross Vehicle Weights (GVWs) and engine power and torque have both increased significantly in recent years which have been reported to have worsened the situation. Increases in braking performance have also been cited as an influence.
Re-torquing of wheel nuts (some time after initial torquing) has been mentioned by many to be of paramount importance. Different views have been expressed as to how this is best achieved. Some manufacturers & operators re-torque after 30 minutes (the vehicle having remained stationary) but others re-torque after a certain distance (50 to 100 km). However, the second of these options is not always convenient or even possible especially on vehicles involved in long haul operations.
Although there is no specific legislation covering the technical and construction aspects of wheel fixings, British Standard BS AU 50: Part 2: Section 3: 1994, which specifies

Published Project Report
TRL 53 PPR 475
dimensions and performance requirements for a range of wheel nuts bolts and studs for road vehicles, is applicable to the fasteners which are in current use (spigot-located wheels with hexagonal nuts and flat captive washers, BS cone fixings and DIN spherical-faced nuts).
C.2.3 Rationale for government intervention
Strongly held perceptions by the various sectors of the industry make it difficult for a consensus to be reached about the precise nature of the wheel detachment problem and how to solve it. In this context, government involvement/intervention would seem to be essential in order to make progress.

Published Project Report
TRL 54 PPR 475
C.3 Consultation
C.3.1 Stakeholders consulted
A programme of information gathering & consultation has been carried out with a number of stakeholders:
Heavy vehicle drivers;
Heavy vehicle operators;
Heavy vehicle manufacturers/component suppliers, and
Vehicle regulation enforcement agencies.
C.3.1.1 Questionnaire surveys
Formal surveys have been carried out with the first three groups (drivers, operators and vehicle manufacturers/component suppliers) using specially designed questionnaires.
The results of these surveys are presented and discussed in subsections 3.2 to 3.4.
C.3.1.2 Surveys of enforcement agencies
In order to obtain an independent estimate of the current frequency of wheel detachment and loose wheel fixings, surveys were carried out throughout Great Britain by VOSA (formerly VI) and by the Association of Chief Police Officers (ACPO). Both surveys were three months in duration. The VOSA survey started in November 2005 and finished at the end of January 2006. The ACPO survey started in January 2006 and finished at the end of March 2006.
Data capture forms were designed by TRL to gather the following information:
Inspection or accident and injury details;
Vehicle details, including vehicle type, gross weight, age, wheel size and configuration;
Defect details, including type of defect, number of defects and position on vehicle;
The presence of any locking mechanism or movement indicators, and
The date of last wheel removal, re-torque or torque check.
Consideration was given to the type of information recorded during the VI (now VOSA) and ACPO survey carried out in 1998 so that the current data could be compared with the previous study. VOSA was tasked with examining vehicles at operators’ premises and carrying out roadside spot checks as well as attending post-collision vehicle examinations and reporting the above information for all examinations that concerned a wheel defect.
Similarly, ACPO were asked to distribute the data capture form to all of their officers involved in collision investigation such that any HGVs with wheel defects that were examined as part of an investigation were reported. In order to ensure that the number of observed failures could be scaled up to an estimate of annual incidents in the UK, exposure data was requested from VOSA. The data was compiled into a database and analysed to produce national estimates of the scale of the problem and to identify common features of the problems.

Published Project Report
TRL 55 PPR 475
C.3.1.3 Informal discussions
In addition to these surveys, informal discussions took place with a number of heavy vehicle operators and a heavy vehicle tyre supplier. Their views are reported and discussed in subsection 3.5.
C.3.2 Driver questionnaire survey and responses
C.3.2.1 Description of the survey
The objective of this survey was to obtain 500 questionnaires completed by a variety of drivers in a number of UK locations; Table C1 summarises the numbers & sources of the driver questionnaires that were completed.
Table C1: Numbers and sources of the driver questionnaires
Dates Number Source Location
18 to 24 Nov 05 75 VOSA Dagenham
15 to 22 Dec 05 and 5 Jan 06
335 M3 Service Area (London bound)
Fleet, Hampshire
Dec 05/Jan 06 11 English HV Operators Southern England
Dec 05/Jan 06 83 M8 Service Area
(Westbound)
Harthill (between Edinburgh & Glasgow)
Dec 05/Jan 06 17 Scottish HV Operators Scotland
Nov 05 to Jan 06 521 All sources UK
It was considered that this coverage of drivers was suitably broad & varied for the purposes of the survey.
C.3.2.2 Survey results
A key question within this survey concerns the frequency of occurrence of three wheel fixing problems:
Loose wheel fixings;
Lost wheel nuts, and
Wheel detachments.
Reported frequencies vary – from “Less than once every 2 years” to “More than once every 3 months”. These responses have been converted into annual numbers of occurrences. In order to achieve this, assumptions have been made about the end values. The minimum frequency “Less than once every 2 years” has been defined as 0.25 occurrences per annum while the maximum “More than once every 3 months” has been defined as 6 occurrences per annum.
Table C2 summarises the responses from the 521 respondents. The penultimate row gives the total numbers of occurrences per annum of these wheel fixing problems as reported by these driver respondents.

Published Project Report
TRL 56 PPR 475
Table C2: Driver responses - reported frequencies of wheel fixing problems
Frequency of occurrence
Equivalent number of
occurrences per annum
Numbers of responses
Loose wheel fixings
Missing wheel nuts
Wheel detachment
More than once every
three months
6(1)
7
5
3
About once every
three months
4 5 3 3
About once every
six months
2 12 7 0
About once a year 1 14 9 1
About once every two years
0.5 12 5 0
Less than once every two years
0.25(2) 67 30 13
Never 0 368 406 445
Total responses - 485 465 465
(Missing data) - 36 56 56
Total numbers of occurrences per annum
-
122.75
75
34.25
Total numbers of occurrences per annum
per 1,000 drivers
-
253.093
161.290
73.656
Notes: (1) Value must be > 4; a value of 6 has been assumed. (2) Value must be < 0.5; a value of 0.25 has been assumed.
Some of these reported frequencies are very high, for example, three respondents reported wheel detachments occurring “More than once every 3 months”. This frequency seems very unlikely unless the driver is interpreting the word “encountered” within this question to mean “within his firm” or wider still and not just in relation to the vehicle which he personally drives.
The reported frequency of these wheel fixing problems has also been broken down by a number of important factors to investigate whether any of them appeared to be causative or contributory in the occurrence of problems:
driver type;
types of goods carried;
reported use of wheel locking/retention devices;
reported use of movement indicators, and
reported use of directionally threaded fixings.

Published Project Report
TRL 57 PPR 475
Additional results are given in the Final Report (Knight et al, 2006); selected results are presented in the next two tables in this subsection.
Table C3: Wheel fixing problems by type of driver: Numbers of occurrences per year and numbers of occurrences per year per driver response
Wheel fixing problem
Driver Type
(a) Loose wheel fixings
(b) Missing wheel nuts
(c) Wheel detachment
N° of occurrences
(N° of responses)
Ratio N° of occurrences
(N°of responses)
Ratio N° of occurrences
(N° of responses)
Ratio
Agency Driver 13 (51) 0.25 10.25 (47) 0.22 0.25 (46) 0.005
Owner/operator 0.5 (11) 0.05 0 (9) 0 6.00 (10) 0.600
Owner of company (2 or
more HVs)
0.75 (11) 0.07 0 (10) 0 0 (9) 0
Employed by small company
(<10 HVs)
34.75 (115) 0.30 18 (107) 0.17 8.75 (110) 0.080
Employed by large company
(>10 HVs)
73.5 (294) 0.25 46.75 (289) 0.16 19.25 (287) 0.067
All types of HV driver
122.5 (482) 0.25 75 (462) 0.16 34.25 (462) 0.074
The highest reported rates of wheel detachment occurred for owner/operators though the sample size was small (10). Drivers employed by small companies (i.e. <10 HVs) reported slightly higher than average rates of occurrence for each of the wheel fixing problems.

Published Project Report
TRL 58 PPR 475
Table C4: Wheel fixing problems by commodity carried: numbers of occurrences per year and numbers of occurrences per year per driver response
Wheel fixing
problem
Type of Goods
(a) Loose wheel fixings
(b) Missing wheel nuts
(c) Wheel detachment
N° of occurrences
(N° of responses)
Ratio N° of occurrences
(N°of responses)
Ratio N° of occurrences
(N° of responses)
Ratio
(a) Foodstuffs 26.5 (156) 0.17 12.5 (153) 0.08 0.75 (150) 0.005
(b) Livestock 1.25 (15) 0.08 0.25 (13) 0.02 0 (13) 0
(c) Construction & waste goods
28 (127) 0.22 11.75 (124) 0.09 0 (120) 0
(d) Chemicals (incl. Hazchem)
11.25 (64) 0.18 10 (63) 0.16 0.5 (64) 0.008
(e) Machinery & vehicles
25.75 (76) 0.34 11.5 (71) 0.16 10 (70) 0.143
(f) Consumer or ‘white’ goods
14.5 (95) 0.15 7 (90) 0.08 0.75 (89) 0.008
(g) Other 40.75 (146) 0.28 35 (138) 0.25 8.25 (137) 0.093
All types of goods 148 (679) 0.22 88 (652) 0.13 20.25 (643) 0.031
For all three categories of wheel fixing problem, type of goods (e) ‘Machinery & vehicles’ and (g) ‘Other’ had higher than average values. The subjective opinions of the operators interviewed (see section 3.5) had led us to expect higher than average occurrences for (c) ‘Construction & waste goods’; this was not borne out in the survey (particularly as regards wheel detachments).
C.3.2.3 Comment
Detailed inspection of the questionnaires has indicated that seven of the 521 drivers may have misinterpreted the questions about the frequency of occurrence of wheel fixing problems. If these responses are removed from the analysis, the final two rows of Table 2 need to be modified, as shown in Table C5.

Published Project Report
TRL 59 PPR 475
Table C5: Driver responses – modified frequencies of wheel fixing problems
Frequency of occurrence
Equivalent number of
occurrences per annum
Numbers of responses
Loose wheel fixings
Missing wheel nuts
Wheel detachment
Total numbers of occurrences per
annum
-
96.75
55
3.25
Total numbers of occurrences per
annum per 1,000 drivers
-
201.983
119.565
7.096
The major impact of this revision is in the predicted numbers of wheel detachments, reducing the annual number by a factor of just over 10.
It is not known exactly how many drivers regularly drive heavy vehicles in the UK. In many operations, a vehicle will have been driven for one shift per day with one driver. However, for others there may be two or three shifts per day where the vehicle is driven by different drivers. If it is assumed that there are 1.2 drivers for every registered vehicle, then in 2004 there would have been 640,800 regular drivers of heavy vehicles in the UK. Using this number of drivers means that the survey results predict that there would be approximately 129,430 incidences of loose wheel nuts per year, 76,617 incidences of missing wheel nuts each year and 4,547 full wheel detachments each year.
C.3.3 Operator questionnaire survey and responses
C.3.3.1 Description of the survey
The objective was to obtain 30 completed questionnaires from heavy vehicle operators including those operating goods vehicles and those operating coaches/buses. A variety of firms was required both in terms of distances travelled and commodities carried.
A number of firms offered to take part in the survey having seen TRL’s September 2005 Press Release. Some were keen to share their experiences of wheel fixing problems and, in some cases, their ideas for solving the problem.
In the event, 21 completed operator questionnaires were received. Table C6 provides a brief summary of the numbers & types of firm who responded.

Published Project Report
TRL 60 PPR 475
Table C6: Operator questionnaires - numbers and types of firm surveyed
Type of firm or commodity
Number Comment
Foodstuffs 4 Includes firms carrying other categories of goods as well as foodstuffs
Construction & waste
8 Includes firms carrying other categories of goods as well as construction & waste
Chemicals 2 -
General haulage 2 Includes firms carrying at least three different categories of goods
Other types of goods
1 -
Bus/coach operators
4 -
Total 21 -
C.3.3.2 Survey results
Two key questions within this survey concern the frequency of occurrence of three wheel fixing problems: (1) Loose wheel fixings, (2) Lost wheel nuts and (3) Wheel detachments.
Reported Wheel Detachments
Table C7 combines the responses on fleet size, mileage and wheel detachment.
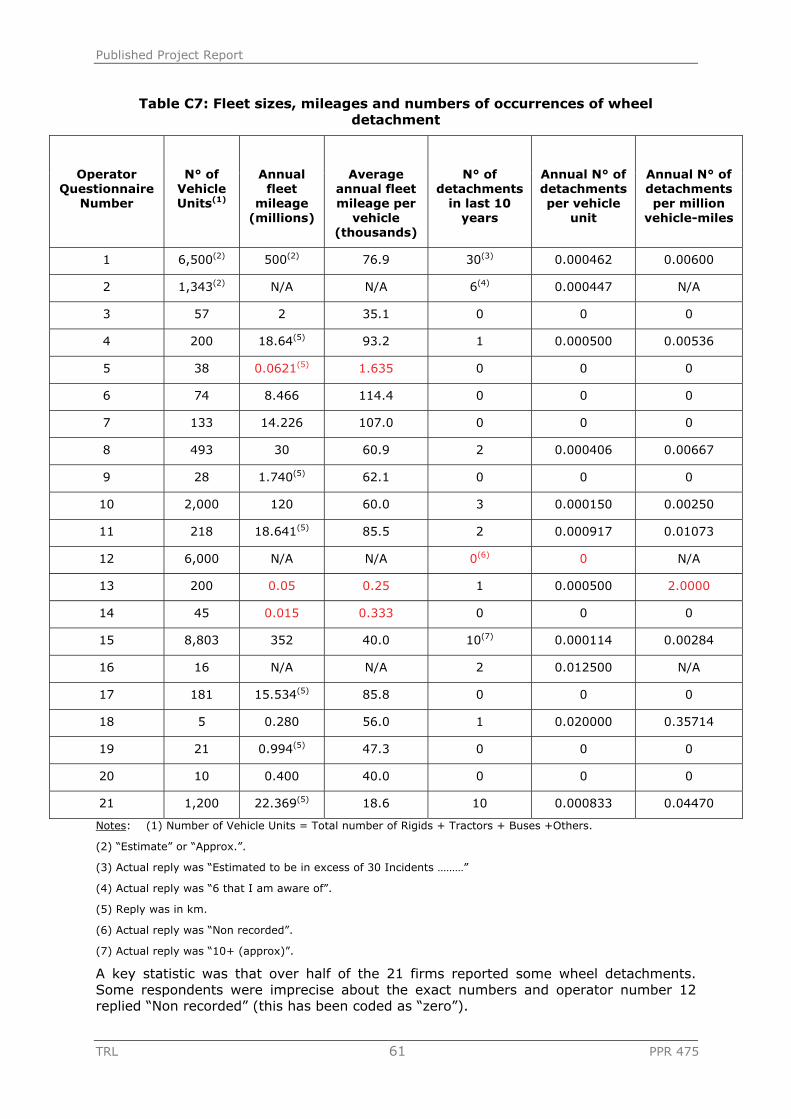
Published Project Report
TRL 61 PPR 475
Table C7: Fleet sizes, mileages and numbers of occurrences of wheel detachment
Operator Questionnaire
Number
N° of Vehicle Units(1)
Annual fleet
mileage (millions)
Average annual fleet mileage per
vehicle (thousands)
N° of detachments
in last 10 years
Annual N° of detachments per vehicle
unit
Annual N° of detachments per million
vehicle-miles
1 6,500(2) 500(2) 76.9 30(3) 0.000462 0.00600
2 1,343(2) N/A N/A 6(4) 0.000447 N/A
3 57 2 35.1 0 0 0
4 200 18.64(5) 93.2 1 0.000500 0.00536
5 38 0.0621(5) 1.635 0 0 0
6 74 8.466 114.4 0 0 0
7 133 14.226 107.0 0 0 0
8 493 30 60.9 2 0.000406 0.00667
9 28 1.740(5) 62.1 0 0 0
10 2,000 120 60.0 3 0.000150 0.00250
11 218 18.641(5) 85.5 2 0.000917 0.01073
12 6,000 N/A N/A 0(6) 0 N/A
13 200 0.05 0.25 1 0.000500 2.0000
14 45 0.015 0.333 0 0 0
15 8,803 352 40.0 10(7) 0.000114 0.00284
16 16 N/A N/A 2 0.012500 N/A
17 181 15.534(5) 85.8 0 0 0
18 5 0.280 56.0 1 0.020000 0.35714
19 21 0.994(5) 47.3 0 0 0
20 10 0.400 40.0 0 0 0
21 1,200 22.369(5) 18.6 10 0.000833 0.04470
Notes: (1) Number of Vehicle Units = Total number of Rigids + Tractors + Buses +Others.
(2) “Estimate” or “Approx.”.
(3) Actual reply was “Estimated to be in excess of 30 Incidents ………”
(4) Actual reply was “6 that I am aware of”.
(5) Reply was in km.
(6) Actual reply was “Non recorded”.
(7) Actual reply was “10+ (approx)”.
A key statistic was that over half of the 21 firms reported some wheel detachments. Some respondents were imprecise about the exact numbers and operator number 12 replied “Non recorded” (this has been coded as “zero”).

Published Project Report
TRL 62 PPR 475
For the data as a whole, the reported occurrence of wheel detachments was strikingly split by fleet size. Nine out of the ten firms operating at least 200 vehicle units reported some wheel detachments over a ten year period (the exception being the firm mentioned in the previous paragraph) while only two of the eleven smaller firms reported them.
For the firms reporting some detachments, there was a strong correlation between the annual numbers of reported detachments and fleet size. Linear and quadratic fits have been derived for the numbers of detachments as dependent variable and different measures of fleet size as independent variable. Three alternative measures of fleet size have been assessed: (1) the number of vehicle units, (2) the number of vehicle wheels and (3) the number of driven wheels. Estimates of the numbers of wheels and driven wheels per vehicle have been made for each vehicle type listed in the questionnaire. In view of the uncertainty about the response of operator number 12, it has been omitted from this regression analysis.
It was found that the best fits (highest values of R2) for both linear and quadratic regressions occur for the correlation of the numbers of detachments against the second measure of fleet size (i.e. numbers of vehicle wheels). This relationship is shown in Figure C1, below.
Figure C1: Relationship between wheel detachment and number of wheels per vehicle.
In the light of the majority of operator responses, it seems surprising that an operator having a fleet of 6,000 vehicle units (40,000 vehicle wheels) experienced no detachments within a 10 year period. The best fit curves derived from all the data (except this operator) predict between 13 and 15 detachments over a ten year period for a fleet of this size and make-up. However, there may be some other factor, such as the firm’s maintenance regime or the regular replacement of wheel studs or nuts, which could explain the difference. On the other hand, it may be that the response “Non recorded” is a true reflection of events; detachments have occurred but have not been recorded.
For the nine larger operators who reported wheel detachments, the average annual number of detachments per vehicle-unit ranged from 0.000114 to 0.000917 with five values in a much narrower range (0.000406 to 0.000500); the average value of this factor over these nine operators was 0.000481. The values of this factor for the two smaller firms were very much larger (0.0125 and 0.0200).
y = 0.3681x + 0.6263
R 2 = 0.9094
y = 0.0009x2 + 0.3003x + 0.7881
R2 = 0.9114
0
5
10
15
20
25
30
35
0 10 20 30 40 50 60 70 80 90 Total Numbers of Wheels (000s)
Wheel detachments
Wheel Detachments Linear (Wheel Detachments) Poly. (Wheel Detachments)

Published Project Report
TRL 63 PPR 475
Wheel fixing policies, procedures and record keeping
Operators’ responses on wheel fixing policies, procedures and record keeping are presented in Table C8.
Table 8: Wheel fixing: reported company policies, procedures & record keeping
Operator Questionnaire
Number
Do you have a formally
documented company policy on daily wheel
checking?
Do you have a formally
documented company policy on
wheel fitting?
Do you operate a procedure for ensuring that checking is
carried out soon after a wheel has
been fitted?
Do you keep records on the replacement of wheel fitting
components on individual vehicles?
Have you carried out any research to identify why wheel
fixing problems occur and how
their frequency can be reduced?
1 Yes Yes Yes Yes Yes
2 Yes Yes Yes(1) Yes Yes
3 Yes No(2) Yes(1) Yes Yes
4 Yes Yes Yes Yes Yes
5 Yes Yes Yes Yes No
6 Yes Yes Yes Yes No
7 Yes Yes No Yes No
8 Yes Yes Yes Yes Yes(3)
9 Yes Yes Yes Yes No
10 Yes Yes Yes Yes Yes(3)
11 Yes Yes Yes Yes Yes(3)
12 Yes Yes Yes Yes No
13 Yes Yes Yes Yes No
14 Yes Yes Yes Yes Yes
15 Yes Yes Yes Yes Yes
16 Yes Yes Yes Yes(4) Yes(3)
17 Yes No(5) Yes Yes No
18 No No No Yes No
19 No No No Yes(4) No
20 No Yes Yes Yes(6) No
21 Yes Yes Yes Yes Yes(3)
Notes: (1) Torque tags used.
(2) Manufacturer’s recommended torque settings used.
(3) The research was undertaken to investigate a wheel detachment occurrence.
(4) Records kept on ‘which?’ and ‘when?’ but not ‘why?’.
(5) Tyre maintenance contractor’s recommended torque settings used.
(6) Records kept on ‘when?’ and ‘why?’ but not ‘which?’.

Published Project Report
TRL 64 PPR 475
It seems clear from Table C8 that these companies take the problem of wheel loosening and detachment seriously. For example, each of these twenty one firms keeps records on wheel component replacements, some using “torque tags” to ensure compliance (see columns 4 & 5). In addition, most (86%) of the companies have formally documented company policies on daily wheel checking and on wheel fitting; the exceptions in each case are three of the smaller firms. Furthermore, 11 of the 21 respondents (52%) have carried out or sponsored research into the wheel loosening/detachment problem. Some of this research has followed the occurrence of a problem within the firm’s fleet (see column 6).
Despite this care and use of resources, nearly all of the larger firms report the occurrence of wheel detachment over a ten year period, as already reported in subsection C.3.3.1.
Reported Wheel Loosening and Lost Wheel Nuts
Seventeen of the twenty one firms reported occurrences of wheel loosening and lost wheel nuts within their fleets and gave an indication of their frequencies. Reported frequencies varied from “Less than once every 2 years” to “More than once every 3 months” (as already noted in relation to the driver questionnaire). All the responses have been converted into annual numbers of occurrences with the maximum & minimum answers defined earlier (6 & 0.25 occurrences per annum, respectively).
In Table C9, the responses on the reported frequency of occurrence of wheel fixing problems and on their associated costs have been combined to give operator estimates of their total annual costs arising from wheel fixing problems. In calculating the total annual cost of loose wheel fixings or lost wheel nuts for each operator, a choice has to be made whether to use the cost given for “single” or “repeated” occurrences. If the frequency of occurrence of these wheel fixing problems is given as twice a year, or more frequently, the cost given for “repeated occurrences” has been used. Otherwise, the cost of a “single loose or lost wheel fixing” has been used.
In the table, the ninth column gives these annual costs while the right hand (10th) column shows the annual costs per vehicle-unit within each firm’s fleet.
The likely validity of these results provided by the operators themselves is discussed in subsection C.3.5.

Published Project Report
TRL 65 PPR 475
Table C9: Operator responses: Reported frequencies of wheel fixing problems and associated costs
Operator Questionn
aire
Number
Fleet size
Annual numbers of occurrences within
operator’s fleet
Costs of Wheel Fixing Problems (£) [respondents’ estimates]
Total Annual Costs (£)
Total Annual Costs per
vehicle (£)
Single loose or
lost wheel fixing
Repeated occurrences of single loose or
lost wheel fixing
Wheel detachments Loose
wheel fixings
Lost wheel nuts
Wheel detachm
ents
1 6,500 6 2 3.0 50 500 to 1,000 2,000 to 3,000 10,000 to
17,000
1.5 to 2.6
2 1,343 4 4 0.6 50(1) 200 to 300 2,000 to 3,000 2,800 to
4,200
2.1 to 3.1
3 57 0.25 0 0 250 500 1,000+ 62.5 1.1
4 200 0 0 0.1 100 1,000 3,000 300 1.5
5 38 0 0 0 50 500 1,000 0 0
6 74 0.25 0 0 250 1,000 10,000+ 62.5 0.84
7 133 0 2 0 5 150 500 300 2.3
8 493 0.25 0.25 0.2 500 1,000 1,000 450 0.91
9 28 0 0 0 N/A (100s) (1,000s) 0 0
10 2,000 0.5 0.25 0.3 35 70 U/K U/K U/K
11 218 1 0.5 0.2 150 500 to 600 1,200 465 2.1
12 6,000 0.25 0 0 U/K U/K U/K U/K U/K
13 200 0.25 0.25 0.1 160 2,000 10,000 1,080 5.4
14 45 0.5 0 0 50 1,000 1,500 25 0.56
15 8,803 6 2 1.0 250 1,000 5,000 13,000 1.5
16 16 6 0.25 0.2 30 100 300 667.5 41.7
17 181 0 0 0 50 250 750 0 0
18 5 2 0.5 0.1 20 75 150 175 35.0
19 21 6 4 0 15 200 1,000 2,000 95.2
20 10 1 0 0 45 200 200 45 4.5
21 1,200 6 6 1.0 500 1,500 2,500 20,500 17.1
Note: (1) Actual reply was “less than 100”; 50 has been assumed
From the table, the average costs of the three wheel fixing problems are (a) single loose or lost wheel fixing: £135, (b) repeated occurrences: £635 and (d) wheel detachments: £2,500.
It is interesting to note that, despite large variations in fleet size, the estimated costs per vehicle of the wheel fixing problems (loose fixings, lost wheel nuts and wheel

Published Project Report
TRL 66 PPR 475
detachments) lie in quite a narrow range (0 to £3.1) for many of the operators, especially those with large fleets. However, there are exceptions (operator numbers 13 & 20 and especially 16, 18, 19 & 21) for which the estimated annual cost per vehicle can be as high as £95.2.
Table C10 summarises the responses from the 21 operators on the frequency of occurrence of the wheel fixing problems. The penultimate row gives the total numbers of occurrences per annum of these wheel fixing problems reported by these operators.
In order to provide national estimates of the occurrence of wheel fixing problems, the numbers in the penultimate row have been multiplied by a factor equal to the total number of registered heavy vehicles (i.e. 534,000) divided by the total number of heavy vehicles (HGVs & PSVs) represented by these 21 operators (i.e. 27,565). The value of this factor is 19.372.
Table C10: Operator responses: Reported frequencies of wheel fixing problems
Frequency of occurrence
Equivalent number of
occurrences per annum
Numbers of responses
Loose wheel fixings
Missing wheel nuts
Wheel detachment(1)
More than once every
three months
6(2)
5
1
0
About once every
three months
4 1 2 0
About once every
six months
2 1 3 (1)
About once a year 1 2 0 (2)
About once every two years
0.5 2 2 (1)
Less than once every two years
0.25(3) 5 4 (7)
Never 0 5 9 10
Total responses - 21 21 21
Total numbers of occurrences per annum (for the 21 operators)
-
40.25
22
6.8
UK estimate of the total numbers of occurrences
per annum
-
780
426
132
Notes: (1) The data on wheel detachment frequencies was not provided in this format but is included here for comparison purposes.
(2) Value must be > 4; a value of 6 has been assumed.
(3) Value must be < 0.5; a value of 0.25 has been assumed.

Published Project Report
TRL 67 PPR 475
C.3.4 Manufacturer/component supplier questionnaire survey and responses
C.3.4.1 Description of the survey
The objective was to obtain 30 completed questionnaires from heavy vehicle manufacturers and component suppliers.
A number of firms again offered to take part in the survey. However, these tended to be those involved in the design &/or manufacture of components for solving wheel fixing problems (i.e. locking devices or indicators). The other firms who completed questionnaires were (with two exceptions) manufacturers of vehicle components (e.g. axles or bodies) or vehicle trailers.
In the event, only 12 completed manufacturer/component supplier questionnaires were returned despite repeated attempts to involve a number of heavy vehicle manufacturers, including firms with ongoing links with TRL. Table C11 provides a summary of the numbers & types of firm who responded.
Table C11: Manufacturer questionnaires - numbers and types of firm surveyed
Vehicle or component
manufactured
Number of firms
Comment
Wheel fixing components 6 Includes one firm involved in the design (but not manufacture) of such
components
Trailers 2 -
Body manufacturer 1 -
Axles 1 -
Heavy goods vehicles 1 -
Other 1 Marketing company for bus/coach manufacturer
Total 12 -
C.3.4.2 Survey results
This questionnaire focuses on respondents’ awareness of wheel fixing problems. The answers to a number of key questions are presented in Table C12.

Published Project Report
TRL 68 PPR 475
Table C12: Manufacturer survey - awareness & perceptions of heavy vehicle wheel fixing problems (w.f.p.)
Heavy vehicle Manufacturers &
Component Suppliers
Questionnaire Number/Type of
Company(1)
Are you aware of any
specific vehicle types that appear to be more susceptible to w.f.p.?
Are you aware of any
specific modes of operation
that appear to initiate
w.f.p. more frequently?
Have you encountered
any w.f.p. with the
vehicles or components
you manufacture or supply?
What was suggested
and/or identified as
being the cause of the w.f.p.(2)?
Have you carried out any
research or investigations to identify the reasons why
w.f.p. occur and how their
frequency can be reduced?
Considering the UK as a
whole, please
indicate how much of a
problem you think wheel detachment
on heavy vehicles is?
1/ WHDM Yes Yes No I/(c) & (d) Yes Very serious
2/WHDM Yes Yes No I/(a); S/(c) & (d) Yes Very serious
3/Con. Yes Yes No No reply (Yes) Serious
4/WHDM Yes Yes No No reply Yes Serious
5/WHDM No No No No reply Yes Moderate
6/WHDM Yes Yes No reply S/(e) Yes Very serious
7/TM No No No No reply No Slight
8/TM Yes Yes Yes I/(e) No Serious
9/VBM No reply No reply Yes S/(d) No No reply
10/AM Yes Yes No S/(c) & (d) Yes Very serious
11/Rep. No No No No reply No No reply
12/HVM No No No S/(c) & (d) No reply Slight
Notes: (1) Types of Company - WHDM=Wheel Nut locking/retention Device Manufacturer
Con. = Consultant in bolting technology
TM = Trailer Manufacturer
VBM = Vehicle Body Manufacturer
AM = Axle Manufacturer
Rep. = Representative of marketing company representing manufacturer
HVM = Heavy Vehicle Manufacturer
(2) S/ = Suggested cause; I/ = Identified cause.
(a) = Inadequate product design/specification [1 occurrence]
(b) = Defective materials components [no occurrences]
(c) = Extreme use/overloading beyond design performance envelope [4 occurrences]
(d) = Inadequate maintenance practices [5 occurrences]
(e) = Other [2 occurrences]

Published Project Report
TRL 69 PPR 475
It is a pity that a larger number of heavy vehicle manufacturers did not complete a questionnaire. However, on the basis of the respondents who did reply, Table C12 indicates something of a polarisation between the vehicle manufacturers (and their reps) and the wheel nut locking/retention device manufacturers. This is almost inevitable since the second group came into existence to solve the wheel fixing problems that they had encountered or had perceived which had led to research and, eventually, to product development & marketing to solve the problems. The vehicle manufacturers who replied generally perceived “extreme use” or “inadequate maintenance” as the root cause of the wheel fixing problems which they had encountered or heard about.
In replying to the question “What was suggested and/or identified as being the cause of the wheel fixing problem(s)?”, one manufacturer commented “In our experience, instances of wheel fixing issues are invariably anecdotal”. This comment illustrates the heart of the issue “Is the problem real and, if real, whose problem is it?”
C.3.4.3 Discussion of Operators’ Views
In addition to the questionnaire surveys described previously, informal discussions took place with a number of heavy vehicle operators and a heavy vehicle tyre supplier. Their views are discussed in this subsection.
It was clear that operator’s perceptions about the size and nature (even the existence) of the heavy vehicle wheel fixing problem varied considerably in different sectors of the industry.
There was a general consensus that the problem is related to wheel removal and replacement operations. In consequence, the operators involved believed that the problem is particularly acute in the waste management sector because, typically, these vehicles have wheels taken off and replaced as often as 7 to 10 times a year compared with twice a year as an average in other sectors.
The tyre supplier recommended that:
“Wheel studs be changed every 5 to 7 years (this is normal MOD practice), and wheel nuts where necessary. In addition, we change our customers’ wheels every 7 years in the waste management sector. In order to maintain torque levels at specified levels, we recalibrate our torque wrenches every 6 months (though this will no longer be necessary when digital torque wrenches become available in the next few months).”
It was generally accepted that the re-torquing of wheel nuts is an essential part of wheel maintenance on a heavy vehicle. There were two views on how this should be done:
after the vehicle has been standing for 30 minutes
after use on the road.
The tyre supplier’s view was that ‘after use’ is the better option, though he admitted that ideas vary on this. Although some operators and manufacturers specify that a vehicle should travel roughly 50 km before re-torquing, the tyre supplier’s view was that a single 360 degree movement of the vehicle produces enough movement & stress to settle the wheel down sufficiently for re-torquing to be effective.
Many vehicle operators have introduced policies to maintain strict control of torquing and re-torquing procedures. Drivers are trained and written guidelines are provided which their drivers and tyre suppliers must obey whenever a wheel is changed. Some firms issue “torquing/re-torquing tags” which provide a means of checking that re-torquing has been carried out as specified in their guideline documents.
A commercial market has grown over the years for wheel locking devices and wheel movement indicators. Some operators are enthusiastic about their use; others are not. Manufacturers of wheel locking devices generally consider that, if combined with systematic and conscientious re-torquing, their products could solve the problem.

Published Project Report
TRL 70 PPR 475
The tyre supplier thought that security devices can make operators careless and should not be considered as substitutes for re-torquing procedures. Some of the devices could be effective in supplementing proper maintenance procedures but not as a maintenance free solution.
A major nationwide operator said that he thought the wheel fixing problem could & should be “solved completely” rather than “just managed”.
The view was expressed that vehicle manufacturers seem unwilling to recognise that a problem exists or, at least, they have been slow to admit it. Specialists in the design and performance of bolt fixings (in vehicular and other applications) have expressed the view that current stud/nut designs tend to operate securely for 3 or 4 years from new but not as well once studs become dirty and rusty or worn. These specialists thought that this deterioration “during use” might explain some vehicle manufacturers’ perceptions.
C.3.5 Comment on the Overall Frequency of Wheel Fixing Problems in the UK
C.3.5.1 Frequency estimates available
The research described in this report and in the Final Report (Knight et al, 2006) has resulted in a wide variety of estimates of the frequency of wheel fixing problems in the UK. Table C13 summarises these estimates to allow a comparison and an analysis of their relative strengths and weaknesses.

Published Project Report
TRL 71 PPR 475
Table C13. Summary of estimates of the frequency of wheel fixing problems in the UK.
Information source
Predicted number of incidences per year
Wheel nuts loose or missing
Other fixing defects
(e.g. stud failures)
Wheel detachment
Damage only
collision as a result of
detachment
Injury accidents as a result of wheel
detachment
Fatal accidents as a result of wheel
detachment
VOSA Survey(DfT,
1997)
7,990 175
ACPO Survey (DfT
1997)
368 140 16 0
VOSA Survey (TRL
2005)
3,886 254
TRL driver survey (2005)
206,047 4,547
TRL operator survey (2005)
1,206 132
VOSA prohibition database
(2002-2005)
8,520 2,031 224
VOSA Collision database
80% of all accidents involving
wheel detachment
16% of all accidents involving
wheel detachment
4% of all accidents involving
wheel detachment
HVCIS fatal database
(1988-2001)
4
Shaded cells indicate where the various studies could not produce the defined information.
It can be seen that the estimates vary quite widely but, with the exception of the TRL driver survey, there is general agreement that the frequency of loose or missing wheel nuts is in the low thousands each year, the frequency of wheel detachment is in the low hundreds each year and that fatalities resulting from wheel detachment are likely to be in single figures.
When considering the variation, particularly for the driver survey, it is important to consider the sample sizes, strengths and weaknesses of each method:
VOSA 1997 – VOSA would have examined about 20,000 vehicles during the period of the survey, which represented approximately 4% of the UK heavy vehicle fleet at that time. However, these will have been inspected at roadside inspections, operators’ premises and after accidents. For loose or missing nuts, the sample may be biased toward older vehicles because of the nature of a targeted maintenance enforcement programme. It could be argued that VOSA

Published Project Report
TRL 72 PPR 475
would be likely to be called to a large proportion of incidents involving full wheel detachment so this may be less affected by the bias. The estimate produced from this survey should be reasonably accurate but may tend toward an over-estimate for loose/missing nuts because it has been shown that older vehicles are more likely to suffer such problems.
ACPO 1997 – This was based on the Police completing a form each time they identified a wheel fixing problem. The nature of the division of work between VOSA and the Police has meant that most of the forms completed were for wheel detachment incidents/accidents. The difficulty with this sample was that there was no easy measure of exposure to be used so the estimates in Table 13 were derived by simply multiplying the actual number recorded in three months by four to make an annual estimate. It could be argued that the real number of detachments would be greater because the Police may not be called to every incident. However, it could also be argued that low frequency events such as this vary considerably in frequency on a random basis such that there could be substantial inaccuracy in the annual estimate resulting in either over or under estimation.
VOSA 2005 – This is very similar to VOSA 1997 and has the same strengths and weaknesses. The sample was larger this time because the survey lasted for three months and about 30,000 vehicles, or approximately 5.5% of the vehicle fleet, would have been examined. However, when the survey results were compared with the prohibition database, it became apparent that there seemed to be a substantial level of under-reporting to TRL of wheel nut defects. The number of annual prohibitions for wheel nut defects, divided pro-rata to gain a number for the three month duration of survey, was considerable greater than the number of reports TRL received from VOSA. However, when the numbers of wheel detachments were compared, the two sources offered consistent data, suggesting that it is likely that TRL received a report for nearly all wheel detachments attended by VOSA during the period.
TRL driver survey – 521 drivers were surveyed. The total number of regular heavy vehicle drivers in the UK is unknown but if it is assumed that there are 1.2 drivers for every heavy vehicle, then there are likely to be around 640,800 drivers. This means that the survey sample was approximately 0.08% of the driver population and hence, relatively small. It is apparent that the results of the driver survey predict frequencies of wheel fixing problems that are orders of magnitude greater than any other source of data. The reason for this is not known but it may be due to the small sample size or to a bias introduced by the location and circumstances in which interviews were carried out. It may also be that drivers were estimating the frequencies based on how often they were aware of problems occurring amongst colleagues, acquaintances and other companies, rather than just relating how often it had happened to them personally.
TRL operator survey – twenty one operators responded to the survey but between them they represented organisations that operated 27,565 vehicles, which represents approximately 5% of the current UK fleet. This can, therefore, be considered a reasonably large sample. The sample was varied to get both large and small operators but it is not known how well this mix represents the mix of operator size nationally. It is, therefore, possible that there is some bias toward large or small operators, most likely toward large operators. In a blame culture, where legal liability is likely to rest with the operator in the event of a wheel detachment, there may also be a perceived incentive for operators to under-report problems.
VOSA prohibition data. This is a rigorous database formed from the ongoing enforcement activities of VOSA and a record will be entered every time a prohibition is issued. The sample of vehicles examined is approximately 120,000

Published Project Report
TRL 73 PPR 475
per year, which represents approximately 22% of the vehicle fleet. This is, therefore, a much larger sample than in the other surveys.
VOSA collision data – The collision database is substantially skewed in relation to the national database of accidents, STATS 19. This is because its contents are entirely dependant on what accidents that the Police ask VOSA to get involved in. In general, it is nearly all related to heavy vehicle accidents and it is very strongly biased toward fatal and serious accidents but can also include damage only accidents (which are not recorded on STATS 19). Because of the nature of the incidents that the Police are likely to call VOSA to attend, it can be assumed that wheel loss incidents are more representative, being an area the police are likely to want more mechanical expertise. This can be seen in the fact that the distribution of injury severity in wheel detachment accidents is completely different to that for other accident types. The data can be used to compare the types and severity of wheel loss accident that occurs but the frequency cannot be reliably multiplied up to national level.
HVCIS fatal data – The HVCIS fatal database involves detailed study of police fatal accident reports. The data described in the Final Report represented 40% of all heavy vehicle fatal accidents recorded on STATS 19 for the time period. It is, therefore, a very large sample and it has been shown to be representative of the national situation. This is likely to be a very reliable source of data but can only provide information on the number of fatal accidents, not on the frequency of wheel fixing problems more generally.
C.3.5.2 Analysis
In order to provide a useful cost benefit analysis, TRL had to predict where, within the very wide range of results, it was most likely that the true answer lay. It was not possible to do this in a rigorously scientific manner so a range of assumptions were required, as described below:
The subjective opinions of the drivers surveyed substantially over-estimated the frequency of occurrence and should be ignored.
The frequency of occurrence reported by heavy vehicle operators slightly under-estimated the scale of the problems and should be ignored.
The VOSA prohibition database and the HVCIS fatal database were the most robust and representative sources of information and should be considered.
“Other” wheel fixing defects recorded in the prohibition database could also lead to wheel detachment and should be considered. These defects included wheel fastening defects (such as wheel nut or wheel nut washer or wheel stud fractured or missing and wheel stud holes damaged or elongated) and also wheel/hub defects (such as wheel damaged or distorted or missing and wheel hub fractures).
The ACPO survey in 1997 accurately identified the proportion of wheel detachment incidents that resulted in a collision with another vehicle/road user (42%). This proportion should be used to estimate the number of all accidents based on the estimates of wheel detachment frequency from VOSA surveys and prohibitions data.
The VOSA collision database accurately reflected the distribution of accident severity (4% fatal, 16% injury, 80% damage only) where wheel detachment was involved but not the absolute frequency of occurrence. This should be used to estimate how many of the predicted total number of accidents were damage only, injury or fatal. The HVCIS fatal estimate was used as a “sanity check” for this method of estimating accidents.

Published Project Report
TRL 74 PPR 475
Based on a combination of the strengths and weaknesses of the data sources and the assumptions listed above, TRL has produced a broad range of estimates of the average number of each wheel fixing problem that typically occurs each year. These are presented in Table C14.
Table C14. TRL estimate of frequency of wheel fixing/detachment problems
Estimated number of incidents per year
Wheel fixing defects (i.e.
loose, missing, damaged nuts, damaged, failed
studs)
Wheel detachment
(total)
Wheel detachment
(damage only
accident)
Wheel detachment
(injury accident)
Wheel detachment
(fatal accident)
Upper 11,000 400 134 27 7
Lower 7,500 150 50 10 3
C.3.5.3 Conclusions
The various studies carried out produce quite variable estimates of the frequency of wheel fixing problems. However, with the exception of the TRL driver survey, there is general agreement that the frequency of loose or missing wheel nuts is in the low thousands each year, the frequency of wheel detachment is in the low hundreds each year and that fatalities resulting from wheel detachment are likely to be in single figures. It would seem that the anecdotal suggestion of 2,000 to 3,000 detachments per annum (see subsection C.2.2) is not substantiated.
Based on the data and a range of assumptions about the data, TRL has estimated that the typical annual frequency of wheel fixing problems is between 7,500 and 11,000 wheel fixing defects resulting in between 150 and 400 wheel detachments. Of the wheel detachments it was estimated that between 50 and 134 would result in damage only accidents, 10 to 27 in injury accidents and 3 to 7 in fatal accidents.

Published Project Report
TRL 75 PPR 475
C.4 Options
Option A – Do nothing.
Option B – Introduce voluntary or compulsory procedures applicable to everyone whose work involves the fitting and re-fitting of heavy vehicle wheels & in re-torquing wheel nuts.
Option C – Re-introduce the use of directional threads on all heavy vehicles.
Option D – Implement a review of heavy vehicle hub and wheel fixing design.
Option E – Introduce wheel nut retention devices on all vehicles
Option F – Introduce wheel nut movement indicators on all vehicles
These options are described more fully and assessed in turn in sections C.7 to C.12.

Published Project Report
TRL 76 PPR 475
C.5 Costs and Benefits
C.5.1 Items to be valued
In principle, the costs and benefits of each option should be calculated or estimated and compared in order to determine whether the benefits outweigh the costs. In practice, it is not yet possible to accurately estimate costs or benefits for all options.
In the remainder of this section, the nature of the items to be valued is discussed together with a description of the methods used for estimating their values.
The changes resulting from the adoption of any of the options, or a combination of options, will be a mixture of additional costs and benefits. These may include increased costs to heavy vehicle manufacturers and operators.
The additional costs experienced by manufacturers and operators are reasonably straightforward to describe. It is considerably more difficult to put numerical values on them.
C.6 Valuations
The DfT financial values for the prevention of road accidents include the following elements of cost:
Loss of output due to injury - this is calculated as the present value of the expected loss of earnings plus any non-wage payments (national insurance contributions, etc.) paid by the employer.
Ambulance costs and the costs of hospital treatment.
Human costs - based on the ‘willingness to pay’ values, which represent pain, grief, and suffering to the casualty, relatives and friends, and, for fatal casualties, the intrinsic loss of enjoyment of life over and above the consumption of goods and services.
Costs of damage to vehicles and property.
Costs of police response and the administrative costs of accident insurance.
The 2008 valuations used in this report (see Table C15) are taken from RAGB: 2008 (Department for Transport, 2009).
Table C15: Casualty Valuations
Casualty Severity
Valuation (£)
Fatal 1,683,800
Serious 189,200
Slight 14,600
Based on the frequency of occurrence of serious and slight accidents, the average cost for a non-fatal casualty is £38,594. Damage only accidents are valued at £2,000.

Published Project Report
TRL 77 PPR 475
C.7 Option A – Do Nothing
The costs of continuing with the existing situation have been estimated using available data on the frequency of occurrence of wheel loosening and detachment incidents and their consequences including that obtained in the latest surveys.
C.7.1 The current situation
Table 14 sets out the existing situation as regards the likely numbers of wheel fixings defects, detachments and accidents. These estimates have been used to derive the existing costs of these incidents. These are presented in the rest of this section.
C.7.1.1 Costs/benefits
The likely financial benefits of solving the existing problem include: (1) savings in accident costs and (2) savings by operators of the costs of wheel fixing problems.
Using the valuations from subsection 5.2, the upper and lower estimates of the costs of the fatal accidents and injury accidents are £11.79m to £5.05m and £1.04m to £0.39m, respectively.
Operators’ own estimates of the cost of detachments, as given in Table C9, have been used to calculate the cost of non injury detachments. Two estimates (£10,000 and £10,000+) approximate to the cost of a slight injury accident given in Table 15 (so these have been ignored for this purpose). The average of all the other responses is about £1,500; this has been taken as the cost of “no collision” detachment [this figure represents the operator’s own costs]. In order to cost a “damage only” detachment, the operator’s own cost has been added to the public cost (i.e. £2.000) giving a total of £3,500 per detachment. With these assumptions, the ranges of costs of the wheel detachments are £0.18m - £0.47m (damage only) and £0.23m - £0.60m (no collision).
In subsection C.3.3.2 (Reported wheel loosening and lost wheel nuts), “single” and “repeated” occurrences of wheel fixing problems were defined. In the operators’ survey, about 60% of reported loose or lost wheel fixings would be defined as “repeated”, the remainder as “single”. The average wheel fixing defect would, on this basis, cost £435 (= 0.60 x £635 + 0.40 x £135). The range of costs would amount to £3.26m to £4.78m.
Table C16 summarises all these potential savings.
Table C16. Current costs of the UK’s wheel fixing/detachment problems
Estimated number of incidents per year (with costs)
Wheel fixing defects [i.e.
loose, missing, damaged
nuts, damaged,
failed studs]
Wheel detachment
[no collision]
Wheel detachment
[damage only
accident]
Wheel detachment
[injury accident]
Wheel detachment
[fatal accident]
(Total costs)
Upper estimate
11,000 (£4.78m)
400 (£0.60m) 134 (£0.47m) 27 (£1.04m) 7 (£11.79m) (£18.68m)
Lower estimate
7,500 (£3.26m)
150 (£0.23m) 50 (£0.18m) 10 (£0.39m) 3 (£5.05m) (£9.10m)
Unit costs £435 £1,500 £3,500 £38,594 £1.68m -

Published Project Report
TRL 78 PPR 475
The total cost of the “Do nothing” option is, therefore an ongoing cost to the industry and society as a whole of between approximately £9million and £19 million per year. There were 547,300 trucks and buses licensed in the UK in 2008 (Transport Statistics, 2008). This means that approximately £16 to £34 could be spent on every vehicle in the UK in order to eliminate the problem and provide a net financial benefit in the first year of implementation.
C.7.2 Comment
Objectively, the number of serious accidents reported to be caused directly by wheel detachment incidents is not large in comparison with some other RTA causes. However, each fatality tends to attract intense media attention because the public’s perception seems to be that these accidents are easily preventable or ought to be preventable.

Published Project Report
TRL 79 PPR 475
C.8 Option B – Introduce Voluntary or Compulsory Procedures
Option B is concerned with establishing and maintaining operational procedures designed to minimise and, if possible, eradicate wheel loosening and detachments.
Two ways of achieving this were considered (1) voluntary procedures [Option B1] and (2) compulsory procedures [Option B2].
C.8.1 Option B1 – Voluntary Procedures
It was noted in subsection 2.2 that many vehicle operators have introduced policies to maintain strict control of torquing and re-torquing procedures. These policies include driver training, written guidelines and, in some cases, the issue of “torquing/re-torquing tags” to ensure that re-torquing is carried out as specified in their guideline documents.
In essence, the purpose of a voluntary scheme would be to extend these operational practices throughout the heavy vehicle operations industry especially to those (possibly smaller) operators who are not be aware of the need for re-torquing after a wheel removal & replacement, despite the issue in 1997 of the Department’s guidance leaflet "Careless Torque Costs Lives". Alternatively, some operators may neglect to re-torque wheel nuts on every occasion that a wheel is removed & refitted. It has been noted that some of the smaller operators do not have policies or procedures in place.
There are two elements needed in a voluntary scheme: (a) training for operators & drivers and (b) written information to be available to act as a reminder and as a reference document once training has been given.
(a) Training – a programme designed to provide guidance on:
The need for and value in regular & systematic checking of wheel nuts as part of the daily vehicle checking routine.
The wheel nut locking & retention devices currently on the market.
The wheel nut movement indicators currently on the market.
(b) Documentation
This could be issued in the form of a “Best Practice” guide similar to the policy documents issued by some of the larger transport companies (examples have been made available for the purposes of the project). The document would need to expand on the guidance provided in “Careless Torque Costs Lives”.
Possible mechanisms for providing operators with such information do already exist within the framework of the DfT’s Road Haulage Modernisation initiative.
C.8.2 Option B2 – Compulsory Procedures
An appropriate method for establishing a compulsory scheme may be through the introduction of suitable legislation. Some possible examples are:
Introduce legislation to make it compulsory for every wheel detachment incident to be reported to DfT whether or not an injury accident results from the occurrence. Appropriate methods & levels of reporting would have to be agreed with VOSA and ACPO and other stakeholders (for example, insurance companies).
Introduce legislation to make it compulsory for every operator to introduce a formally documented company policy describing, for their staff, the procedure to be followed following the changing of a wheel on a heavy vehicle. The policy would have to make it clear whose responsibility it was to ensure that the policy

Published Project Report
TRL 80 PPR 475
was implemented (management, maintenance staff or individual drivers). To support this legislation, a briefing note would be written (in collaboration with experts in industry) & distributed to all registered heavy vehicle operators to provide guidance on suitable methods for nut tightening after changing a wheel. It would cover the procedures to be adopted for all existing wheel nut/stud combinations. Firms would be encouraged to incorporate this briefing note (or the advice contained in it) into their company policy document.
Introduce legislation to include in the heavy vehicle driver’s test some questions to test the driver’s knowledge of wheel changing procedures.
Introduce a change in the requirements for O-licence holders to make it specifically compulsory to keep a log of the history of all wheel changes for each heavy vehicle with dates and vehicle mileage and records of re-torquing. A copy of the log would have to be carried in each heavy vehicle and would be subject to inspection by enforcement agencies such as VOSA and the police.
C.8.3 Possible Weaknesses in the Potential Procedures
The main weakness of any procedural approach to solving the wheel fixing problem remains the difficulty with enforcing the policies and ensuring that they are universally implemented. For example, the drivers’ survey showed that a significant number of drivers don’t always do their daily checks, despite the fact that these are a specific requirement.
C.8.4 Cost/benefit
Some information has been obtained on maintenance costs. For example, re-torquing has been costed at £6 per wheel. On this basis, the total cost for re-torquing all the wheels on the UK fleet of heavy vehicles would amount to about £15.5m. At least one operator consulted stated that they were now re-torquing wheel nuts every week for all vehicles in order to try to avoid wheel detachment. If this were done every week for all vehicles, the annual cost to industry would be about £806m.
In practice, many operators/drivers already re-torque their wheels either at regular intervals or whenever a wheel has been removed and replaced for any reason. Table C17 shows the additional cost of weekly re-torquing for different proportions of the HGV population.
Table C17. Additional costs for weekly re-torquing
Percentage of wheels needing re-torquing
Additional annual costs (£m)
1% 8.1
2% 16.1
10% 80.6
The benefits would be to save a proportion of the incident and accident costs discussed in section 6. Re-torquing would not be cost effective if more than about 2% of wheels needed weekly attention.
It should be noted that for operators that are already implementing this type of practice, this cost could be considered an additional cost of the “do nothing” option. Re-calculating the same figures shows that a weekly wheel maintenance programme would on average cost about £1,532 per vehicle per year.

Published Project Report
TRL 81 PPR 475
C.8.5 Comment
It is recognised that the procedures described within this option, especially the compulsory ones, would impose a significant additional burden on the heavy vehicle industry.
In the light of the current government policy to reduce rather than increase the burdens caused by regulations, these compulsory procedures may not be appropriate in the current climate.

Published Project Report
TRL 82 PPR 475
C.9 Option C – Re-introduce Directional Threads
Directional threads (left hand threads on the nearside wheels) were in general use up to about 15 or 20 years ago. They had been originally introduced to combat wheel nut unwinding since, with conventional wheel nuts on nearside wheels, any unwinding motion was in the same rotational direction as caused by the forward motion of the vehicle.
Directional threads are no longer offered as an option on new vehicles. One of the reasons for their withdrawal was the additional stock cost of two sets of nuts and, more important, because a wheel stud could be damaged by the careless use of a nut with the wrong thread direction especially if forced onto the stud with a hydraulic wrench.
It has been suggested that a return to the use of directional threads might result in fewer wheel losses. One operator noted “We never used to lose wheels when we had L/H thread on the N/S/R”. Different views are held on their value but it seems likely that, despite this quoted comment, directional threads would not, in themselves, prevent any loss of clamp force. However, once a loss of clamp force had occurred, directional threads might slow down the process of wheel nuts unwinding on nearside wheels. Re-introducing directional threads is, therefore, unlikely to reduce the cost to operators of loose wheel nuts but may reduce the costs of wheel detachment incidents.
The test results gathered during the accelerated vehicle trials using the directional threads showed no significant difference to the standard OEM (right-hand) threads. However, as described in the final project report, the vehicle trials were inconclusive about the relative effectiveness of a range of potential countermeasures designed to prevent or mitigate heavy vehicle wheel detachment However, if it were assumed that the directional threads did offer some level of benefit of standard right-hand threads the costs per vehicle that could be spent to achieve a cost benefit ratio of 1 in the first year of implementation can be calculated, as shown below:
Assuming 100% effective at preventing all wheel detachments – between approximately £10.70 and £25.40 per vehicle
Assuming that the frequency of occurrence at the nearside is reduced to that of the offside (equivalent of a reduction to 42% of the current level) – between approximately £4.50 and £10.70 per vehicle
Assuming that the bias becomes 60% nearside and 40% offside (equivalent to a reduction to 52% of the current level) – between approximately £5.60 and £13.20 per vehicle

Published Project Report
TRL 83 PPR 475
C.10 Option D – Implement a Review of Hub & Wheel Fixing Design
Some respondents have suggested that the basic design of wheel hub and nuts may be contributing to the wheel detachment problem, although it should be noted that 75% of manufacturers and 38% of operators disagreed with this. Two main issues have been mentioned:
Spigot fixing has been the standard method used for wheel location over recent years. It was introduced primarily to split the location and retention functions of the earlier BS conical and DIN spherical fixings. Some comments have been made that the spigot design seems to have led to more occurrences of wheel loosening and detachment though the contrary view is also held.
Some respondents hold the view that the ‘normal’ ten 22mm diameter stud arrangement may have been adequate for maintaining secure wheel attachment 20 or 30 years ago but not with current vehicles especially with the higher loads and forces of modern vehicles.
The purpose of this option would be to determine whether clamp loads would be maintained more consistently (given a suitable re-torquing regime) with a change to 12 studs per wheel (instead of 10) or with larger diameter studs (possibly 26mm instead of 22/24mm) or with both changes together.
Some respondents thought that such a major change to wheel/hub design was not a practical option for the industry and, in addition, the additional clamp force which could be achieved in this way might affect or even damage other vehicle components, especially brake drums.
An alternative may be a complete re-design of the hub and wheel carrying function. Reviews of standards in the airline industry have shown that differing designs that do not rely solely on clamp force are in existence.
This option has the potential to eliminate wheel fixing problems entirely. As such the benefits in terms of reducing incidents and accidents are equivalent to the costs described for option A and between £16 and £34 per vehicle could be spent to achieve this and achieve a cost benefit ratio of one. However, some large operators are known to already implement periodic torque checks at intervals of 1 week to 6 weeks. The maintenance costs derived for Option B showed that the cost per vehicle of a weekly torque check was approximately £1,532 per annum. It is not known how many vehicles nationally undergo this type of regime but if it was assumed that 1% of all vehicles currently have this type of maintenance the annual cost to industry would be approximately £8.1 million. If 10% of vehicles were subject to such maintenance it would cost approximately £80.6 million per year.
If a maintenance free wheel fixing design could be implemented it would save the costs of wheel fixing problems but would also save the costs of the maintenance regimes that at least some operators currently employ. However, there are currently no proposals for a revised wheel fixing design so the actual costs of this measure are not yet known. The costs of designing, developing and implementing the change are likely to be significant but the ongoing costs per vehicle once the new design is in production could range from cheaper than currently to considerably more expensive, depending on the design.

Published Project Report
TRL 84 PPR 475
C.11 Option E – Require wheel nut retention devices to be fitted to all vehicles
This option would require the fitment of suitable wheel nut retention devices to all heavy vehicles. This could be implemented as a type approval requirement for new vehicles provided that harmonised standards were agreed by the European Union, but for the purpose of this analysis it has been assumed that a retro-fit would be required such that at the time this measure was implemented all heavy vehicles (HGVs and PSVs) currently licensed in Great Britain would need to be fitted with a nut retention device.
During Phase 2 of this project TRL undertook tests to assess the effectiveness of a range of potential countermeasures designed to prevent or mitigate heavy vehicle wheel detachment. These tests were unable to provide conclusive results about the relative effectiveness of the different devices because it was not possible to develop a test procedure that was realistic of real world conditions and which resulted in standard OEM nuts consistently loosening. Therefore for this option the following theoretical scenarios have been considered:
1) All accidents and casualties resulting from loose wheel fixings and/or wheel detachments are eliminated by the fitment of a nut retention device;
2) Incidents of wheel detachment are eliminated by the fitment of a nut retention device, but clamp loss over time is still evident and would still require routine maintenance; and
3) Effectiveness of various nut retention devices is based on the assumption that the results of the Junkers tests in this project are representative of their real world effectiveness
For this option a range of devices were considered and an analysis was undertaken for each based on the following conditions and assumptions.
The cost associated with purchasing each of these devices was obtained, where possible, from the manufacturer and the figures used in the option are presented in Table 18 below. If this data was unavailable then an estimated cost for each device was used. The estimated unit cost for low volume represents the approximate price assuming that a single company or operator purchased a batch to fit to their own vehicles. The high volume costs assumes that a discount of approximately 50% could be achieved if these devices were produced and purchased in large numbers, sufficient to equip the entire UK fleet.

Published Project Report
TRL 85 PPR 475
Table C18. Costs to purchase various countermeasures
Device Unit cost (£) Cost per wheel (£)*1
Low volume
High volume
Low volume
High volume
DAF Nut £2.00 £1.00 £20.00 £10.00
Wheelsure £4.75 £2.38 £47.50 £23.75
Disc-lock £3.65 £1.83 £36.50 £18.25
Visilok £11.50 £8.05 £115.00 £80.50
Spiralock*2 £4.00 £2.00 £40.00 £20.00
Ric-clip £2.87 £1.44 £14.36 £7.18
Checklink £1.00 £0.80 £5.00 £4.00
Checklock £1.50 £0.75 £7.50 £3.75
*1: Assuming 10 wheel studs per wheel. *2: Cost estimated by TRL because costs from manufacturer were unavailable at time of writing
Data from transport statistics (DfT, 2009), shows that in 2008, there were 547,300 heavy vehicles (HGV and PSV) licensed in Great Britain of which approximately 55,000 were new registrations. The data can be broken down by number of axles and gross vehicle weight which allows an estimate that there are approximately 25.8 million wheel studs on the UK fleet, with new registrations representing approximately 259,000 of these.
For the subsequent analyses it was assumed that the following parameters remained constant for the 10 year period over which the analysis was considered:
Number of new vehicle registrations
Casualty valuations
Cost of regular maintenance
C.11.1 Option E1: Eliminate 100% of wheel fixing problems.
For this scenario it has been assumed that for the year of implementation all currently licensed vehicles would need to be retro-fitted with a nut retention device. Therefore the cost associated with this was calculated by multiplying the cost of the device (per wheel) by the number of wheels in the UK fleet, e.g. for the Disc-lock device the lower limit of the cost would be high volume cost of £18.25 x 2.58million wheels = £47.2million, and the upper limit cost would be the low volume cost of £36.50 x £2.58million wheels = £94.3million.
For subsequent years, it has been assumed that nut retention devices would only need to be fitted to new registrations. For the devices that would be fitted instead of the standard OEM nuts (i.e replacement wheel nuts) the cost was calculated as the difference between the nut retention device and the standard OEM nuts, e.g. for the Wheelsure device the lower cost for new registrations would be £23.75 - £10 = £13.75 per wheel. For the other devices that are designed to be fitted in addition to the standard OEM wheel nuts the full cost of these devices were used.
By eliminating 100% of all accidents and casualties associated with wheel fixing problems and/or wheel detachments it has been estimated that the potential casualty savings of £9.1m to £18.7m per year could be achieved, as illustrated in Table C16.

Published Project Report
TRL 86 PPR 475
The analysis in Option D assumed that between 1% and 10% of vehicles currently undergo a weekly torque check. If this maintenance could be eliminated by fitting a nut retention device then this could potentially offer a further saving of between £8.1million and £80.6million per year.
Considering the different costs for each device the following break even periods (Table C19) were estimated assuming each was 100% effective at eliminating wheel fixing problems and wheel detachments. Unsurprisingly it showed that devices with the lowest cost per wheel offered the shortest time to break-even. It can also be seen that reducing the costs of each device would be critical in reducing the period of time needed before a benefit-to-cost ratio of 1 could be achieved.
Table C19. Estimated time to break-even assuming 100% effectiveness at eliminating wheel fixing and wheel detachment problems.
Device Number of years to break-even
Lower Estimate Upper Estimate
Wheelsure 1 10+
Disc-lock 1 7
Visilok 1 10+
Spiralock 1 9
Ric-clip 1 3
Checklink 1 1
Checklock 1 2
C.11.2 Option E2: Eliminate wheel detachments only
The above scenario assumed that all incidents of wheel fixing problems and wheel detachments would be eliminated. In reality it is unlikely that this would happen therefore, for this scenario, it was assumed that each device would be unable to prevent some loss of clamp force but would be capable of preventing the wheel nuts falling off, thus eliminating wheel detachments.
For this scenario the same costs to purchase the different devices as used in Option E1 were applied. Using the figures only associated with wheel detachments in Table C16, it was estimated that there could be an annual casualty saving of between £5.8million and £13.9million. Finally, because this scenario assumes that there would remain some loss of clamp force, the potential benefits from reduced maintenance were not applied.
Table 20 shows that the estimated time to break even, if each of these devices were fitted to the vehicle fleet. It can be seen without the potential benefits from preventing clamp loss and from reduce maintenance; the time taken for each device to achieve a benefit-to-cost ratio of 1 is increased by several years over the scenario that 100% of all problems would be eliminated.

Published Project Report
TRL 87 PPR 475
Table C20. Estimated time to break-even assuming only wheel detachment problems were eliminated.
Device Number of years to break-even
Lower Estimate Upper Estimate
Wheelsure 6 10+
Disc-lock 4 10+
Visilok 10+ 10+
Spiralock 5 10+
Ric-clip 2 10+
Checklink 1 3
Checklock 1 5
C.11.3 Option E3: Effectiveness of devices based on Junkers results
During Phase 2 of this project Junkers tests were used to compare how well the different devices maintained clamp force when subject to severe vibrations. For the purpose of this scenario it has been assumed that the results of the Junkers tests represent the relative performance of the different devices during normal service. Since the vehicles trials did not provide conclusive results the validity of this approach should be treated with caution because it is questionable whether the results of Junkers test are truly indicative of their real world effectiveness, especially since it is recognised that the Junkers tests is a particularly harsh test and standard wheel nuts came loose in a matter of minutes.
Table C21 shows the average proportion of the initial clamp force retained by each device during the Junkers tests. These figures have been normalised in relation to the result of the standard OEM wheel nuts to estimate their relative effectiveness in preventing wheel fixing problems and/or wheel detachment. For example, during the Junkers tests the standard OEM wheel nuts retained, on average, 29% of the initial clamp force recorded at the start of each test. It has been assumed that any device giving the same result (or less) would offer no additional benefit over the standard nuts. If a device had retained 100% of its initial clamp force then it would be assumed that it would also be 100% effective at preventing wheel loss. Any result in between these extremes would therefore represent a relative effectiveness of each device at preventing clamp loss or wheel detachment.

Published Project Report
TRL 88 PPR 475
Table C21. Estimated real-world effectiveness of devices based on Junkers tests results.
Device Average proportion of initial clamp force retained during Junkers tests (%)
Estimated effectiveness of device based on
Junkers results (%)
Standard OEM nuts 29.4 0
Wheelsure 85.6 80
Disc-lock 79.6 71
Visilok 89.2 85
Spiralock 92.7 90
Ric-clip 44.7 22
Checklink 42.6 19
Checklock 40.3 15
For this scenario, the same estimated costs used in the previous two scenarios for each device have been applied. However, the estimated casualty benefits and the estimated maintenance benefits used in Option E1 have been multiplied by the estimated effectiveness of each device to calculate the approximate number of years required for each device to achieve a benefit-to-cost ratio of 1, as shown in Table C22.
Table C22. Estimated time to break-even assuming Junkers test results represent real-world effectiveness of each device.
Device Number of years to break-even
Lower Estimate Upper Estimate
Wheelsure 1 10+
Disc-lock 1 10+
Visilok 3 10+
Spiralock 1 10
Ric-clip 1 10+
Checklink 1 7
Checklock 1 10+

Published Project Report
TRL 89 PPR 475
C.12 Option F – Require wheel nut movement indicators to be fitted to all vehicles
This option would require the fitment of approved wheel nut movement indicators to all heavy vehicles.
It should be stressed that their purpose is simply to alert drivers and maintenance engineers of any wheel nut movements; their use cannot prevent wheel nut loosening and can only prevent wheel detachment if used diligently.
The retail cost of these devices is currently about 42p each. On the assumption that an indicator is placed on each stud (and using the figure of 25.8 million studs in total from Option E), equipping the entire UK fleet would cost approximately £10.8million. If, as in Option E, the unit price was halved by the economies of scale which would result from mandatory fitting, the total cost of equipping the whole UK fleet would be reduced to approximately £5.4million.
As noted above, indicators would not in themselves result in less wheel loosening. Their value is in providing a simple and quick method for drivers to confirm wheel nut security (or otherwise) and so have the potential to be effective at reducing wheel detachment, subject to correct use by drivers and operators. They would only be effective if drivers/operators systematically used the indicators and took any necessary corrective action. There would not, therefore, be any expected benefit from reduced maintenance bills.
If it is assumed that these devices will not affect wheel nut loosening but would eliminate wheel detachment then the benefits would be between £5.8m and £13.9m per year. This would give a cost benefit ratio of between 0.5 and 2.6 in the first year. However, given the human involvement in this solution, it seems unlikely that the problem of wheel detachment will be entirely eliminated.

Published Project Report
TRL 90 PPR 475
C.13 Small Firms Impact Test
Option B would involve the collection of data on occurrences of wheel detachment.
Option C would introduce operational procedures to maintain strict control of wheel nut torquing and re-torquing.
Both these options are likely to affect small firms more than medium sized or large firms. In fact, on the basis of the results of the operator survey (in particular, Table 8 in subsection 3.3.2.2), the majority of larger firms already perform these tasks.
C.14 Competition Assessment
The administrative burden of Options B & C would probably affect small firms more than larger firms. However, this isn’t likely to affect competition as the large and small firms are not likely to be in direct competition and firms of a similar size are likely to be equally affected.
C.15 Enforcement, sanctions and monitoring
Four of the six options (i.e. A, D, E & F) would be non-regulatory. In consequence, they would not be enforceable and no sanctions could be applied.
Option B, the establishment of a wheel detachment database, could be achieved through voluntary efforts or via a compulsory procedure, possibly empowered & supported by legislation.
Option C consists of two alternative procedures – C1 (which would be voluntary) and C2 (compulsory). In the latter case, enforcement would be via any new empowering legislation.
C.16 Conclusions and Recommendations
A variety of evidence on the nature and frequency of occurrence of wheel fixing problems within the UK heavy vehicle fleet has been assembled and presented.
Data on the costs of these problems has also been collected and reported – costs to the community resulting from road traffic accidents and also costs incurred by operators in solving the problems.
A number of options aimed at solving, or helping to solve, these problems has been proposed and evaluated as far as this is currently possible. It is not possible, at present, to recommend the best option because the effectiveness of the options is not yet known.


TRL Crowthorne House, Nine Mile Ride Wokingham, Berkshire RG40 3GAUnited Kingdom
T: +44 (0) 1344 773131 F: +44 (0) 1344 770356E: [email protected] W: www.trl.co.uk
ISSN 0968-4093
Price code: 3X
Published by IHS Willoughby Road, Bracknell Berkshire RG12 8FB United Kingdom
T: +44 (0) 1344 328038 F: +44 (0) 1344 328005E: [email protected] W: http://emeastore.ihs.com PP
R4
75
Heavy vehicle wheel detachment and possible solutions Phase 2 - final report
TRL’s research in Phase 1 of this project focussed on estimating the frequency of wheel fixing problems and identifying potential countermeasures to prevent or mitigate future problems. The project estimated there were between 7,500 and 11,000 cases of loose wheel nuts and between 150 and 400 wheel detachments resulting in 10 to 27 injury accidents and 3-7 fatal accidents each year in the UK.
This second phase of the project was again commissioned by the UK Department for Transport (DfT) and has built upon the 2006 research by TRL in order to identify best practice for wheel tightening and maintenance, and to assess the potential effectiveness of identified countermeasures.
This is the final project report for Phase 2 of the project. It describes the methodologies and results from the tests the second phase of the project including a mathematical analysis of the clamp force required during normal driving, laboratory, vehicle-based tests to investigate various procedures for initial tightening and re-torquing, and accelerated wear tests were also completed to assess the effectiveness of the various countermeasures.
Other titles from this subject area
PPR086 Heavy vehicle wheel detachment: frequency of occurrence, current best practice and potential solutions. I Knight, M Dodd, C Grover, R S Bartlett and T Bright 2006
PPR258 Development of improved global harmonised side impact test procedures final report. J Ellway. 2008
PPR260 Compatibility and frontal impact test procedures – additional work to support VC-COMPAT: final report. H Davies, M J Edwards and A Thompson. 2008
PPR291 Assessment of the Q dummy in the EC CHILD project. C Visvikis, M Le Claire, S Adams, J Carroll et al. 2007
PPR293 An assessment of the durability and reliability of typical hydraulically operated parking brakes fitted to quadricycles. C J Grover. 2007