hedge funds and the future ponzi scheme • bernie madoff – founder of bernard l. madoff...
TRANSCRIPT

The Future of the Hedge Fund Industry
An Overview and Discussion
Christopher C. Geczy, Ph.D.The Wharton School
Email: [email protected]
http://www.wharton.upenn.edu/faculty/geczy.htmlhttp://executiveeducation.wharton.upenn.edu/wmi
The Tokyo Club Foundation for Global StudiesThe Brookings Institution
The Wharton Financial Institutions Center
After the Crash; The Future of Finance
October 2009

2
• Important Items About Which to Talk (among others)
– Industrial Organization and the signal to noise ratio
– Regulation
– Greater democratization and availability of hedge fund-like strategies (replicators, registered funds)
– Overlap between private equity and hedge fund strategies will continue
– Liquidity Generally
– Mark to market rules will make a great deal of difference
Hedge Funds and the Future
© 2009 Christopher C. Geczy where applicable - Do Not Reproduce Without Permission

3
• Important Items About Which to Talk (among others)
– Specific comments on
• Madoff, regulation and the SEC
• Hedge fund performance, specifically– “Vanilla beta” and “Exotic beta”
» Risk exposures and changes in risk exposures» Hedge fund replication» Marking to market, SFAS 157 and beta estimation
– Alpha and its demise– Time-varying beta (well, at least simple market timing measures)
Hedge Funds and the Future
© 2009 Christopher C. Geczy where applicable - Do Not Reproduce Without Permission

4
• Demand in recent history (not as much now) was off the chart! Why?An Institutional Perspective
• Difficult equity markets and investment choices have led to declines in funding status for many plans or have raised levels of concern among others
– S&P500 Pension Plans» 1999: $280Bn overfunded» 2003: $160Bn underfunded» 2004: $165Bn underfunded» 2005: $164Bn+ underfunded» 2006: $100Bn+ underfunded» 2007: $90Bn+ underfunded» 2008: Early in the year…finally overfunded» 2008: End of year, dramatically underfunded!» 2009: 95% of pension plans in the U.S. are underfunded
– Underfunding is affecting business (SEI survey)» 68% say funding obligations have a negative impact on corporate financial statements» 33% say it is causing changes in business plans» 25% say cutting back on CapEx currently» Additional 11% expect to cut back in future
• Search for new ideas?– Hedge funds becoming an asset class? – Were investors disappointed or realistic?
The State of the World - Demand
© 2009 Christopher C. Geczy where applicable - Do Not Reproduce Without Permission

5
The State of the WorldSetting the Stage – The Recent Past
• Hedge Fund Assets Grew to > $2.0 Trillion in 2008 (Hedge Fund Research)– Some say > $3 Trillion in the first half of 2008 with one survey reporting
$3.8 Trillion– However, there has been a mass exit….as much as a third of assets have
fled– Corresponding estimate to the number above is >$1.3 Trillion (a 36.1%
decline)
– Hedge Fund Performance• In 2006, about 9%-13% depending on data provider
– Emerging market funds led (20%+)• 2007 was about 9%-12%• 2008, average was about -20% with some sub-sectors (like convertible bond
arbitrage) down as much as 50%
© 2009 Christopher C. Geczy where applicable - Do Not Reproduce Without Permission

6
Setting the Stage – The Recent Past: Industry Organization
– The PFS Database Study*
• 15,150 single manager hedge funds (20,200 reported performance in 2008)
– 28% onshore; 72% offshore– $1.3 trillion in managed capital
» 200 funds with >$1Bn in managed capital!» About 5,750 with <$25MM in managed capital!
• 5,350 distinct fund companies
• 7,200 funds of funds– By far, mostly offshore (87%)– About $750Bn in capital (23.5% decline over last year)– 46% of them manage < $25MM
The State of the World
© 2009 Christopher C. Geczy where applicable - Do Not Reproduce Without Permission
*Source: PerTrac Financial Solutions LLC 2008 Hedge Fund Database Study

7
Setting the Stage – The Recent Past
The State of the World
© 2009 Christopher C. Geczy where applicable - Do Not Reproduce Without Permission
*Source: PerTrac Financial Solutions LLC 2009 Hedge Fund Database Study

8
Hedge Fund Database Overlap
The State of the World
© 2009 Christopher C. Geczy where applicable - Do Not Reproduce Without Permission
Fund and Hsieh (2006)

9
Estimated Growth of Assets / Net Asset Flow Hedge Fund Industry 1990 – 2008
$ 38,910 $ 58,370$ 95,720
$ 456,430
$ 625,554
$ 820,009
$ 972,608
$ 1,105,385
$ 1,464,526
$ 14,698
$ 91,431
$ 4,406$ 55,340
$ 23,336 $ 46,545$ 99,436
$ 70,635 $ 73,585$ 46,907
$ 126,474
$ 194,515
$ 490,580$ 539,060
$ 374,770
$ 167,360
$ 185,750$ 167,790
$ 367,560
$ 1,407,095
$ 1,868,419
$ 256,720
($ 154,447)
$ 36,918$ 8,463
$ 27,861
($ 1,141)
$ 57,407
($500,000)
($250,000)
$0
$250,000
$500,000
$750,000
$1,000,000
$1,250,000
$1,500,000
$1,750,000
$2,000,000
1990 1991 1992 1993 1994 1995 1996 1997 1998 1999 2000 2001 2002 2003 2004 2005 2006 2007 2008
Ass
ets (
$MM
)
Estimated Assets Net Asset Flow

10
Estimated Number of Funds Launched/Liquidated1996 – Q3 2008
247 240
117
603
(170) (180)
(344)
(693)
507
261
450348 328
673
1,087 1,094
1,435
2,073
1,518
1,197
936
(109)(52)
(115)(57) (71) (92)
(162) (176)
(296)
(848)(717)
(563)
(847)(1,000)
(500)
0
500
1,000
1,500
2,000
2,500
1996 1997 1998 1999 2000 2001 2002 2003 2004 2005 2006 2007 Trailing12-Mos
Q1 2008 Q2 2008 Q3 2008 YTD2008
Num
ber
of F
unds
Launched Liquidated
11
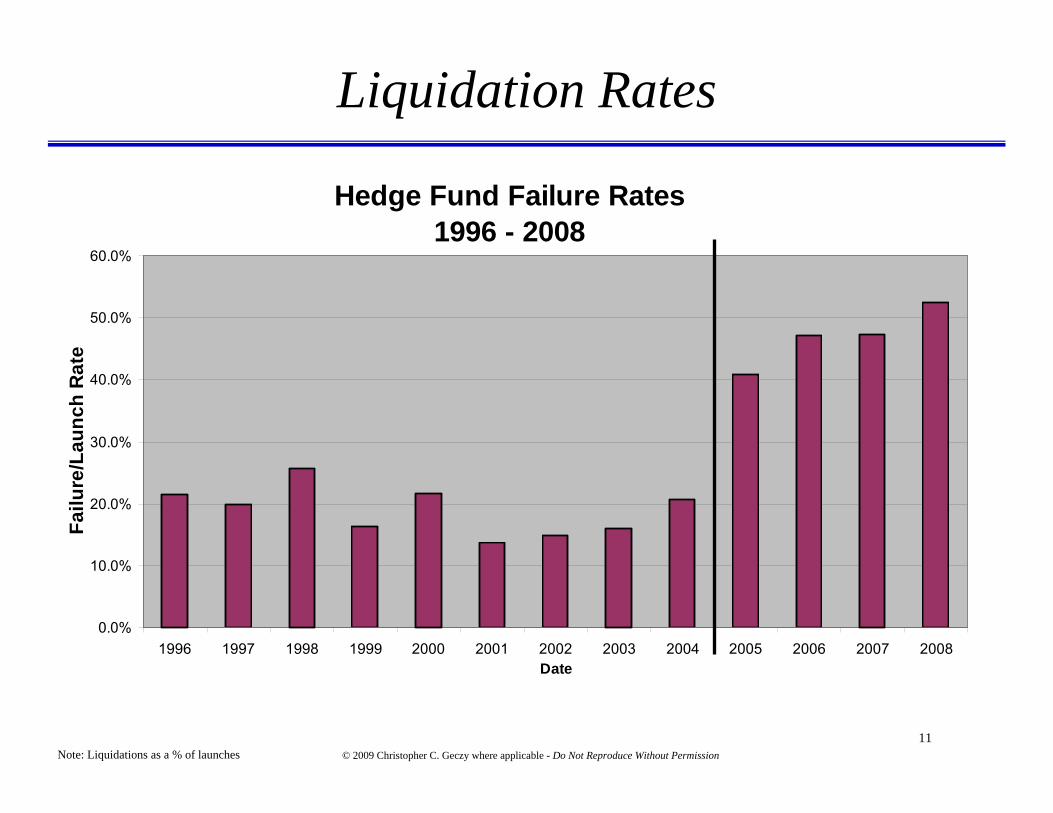
Liquidation Rates
© 2009 Christopher C. Geczy where applicable - Do Not Reproduce Without Permission
Hedge Fund Failure Rates1996 - 2008
0.0%
10.0%
20.0%
30.0%
40.0%
50.0%
60.0%
1996 1997 1998 1999 2000 2001 2002 2003 2004 2005 2006 2007 2008Date
Failu
re/L
aunc
h R
ate
Note: Liquidations as a % of launches

12
Institutions and Hedge Funds• The Casey, Quirk/eVestment Alliance Survey
© 2009 Christopher C. Geczy where applicable - Do Not Reproduce Without Permission

13
Who Invests in Hedge Funds?• The Casey, Quirk and Associates/BoNY Survey
© 2009 Christopher C. Geczy where applicable - Do Not Reproduce Without Permission

14
Hedge Funds* vs. S&P500January, 1997 - August 2009
$-
$500.00
$1,000.00
$1,500.00
$2,000.00
$2,500.00
$3,000.00
$3,500.00
Jan-9
7May
-97Sep
-97Ja
n-98
May-98
Sep-98
Jan-9
9May
-99Sep
-99Ja
n-00
May-00
Sep-00
Jan-0
1May
-01Sep
-01Ja
n-02
May-02
Sep-02
Jan-0
3May
-03Sep
-03Ja
n-04
May-04
Sep-04
Jan-0
5May
-05Sep
-05Ja
n-06
May-06
Sep-06
Jan-0
7May
-07Sep
-07Ja
n-08
May-08
Sep-08
Jan-0
9May
-09
Date
Cum
ulat
ive
Ret
urn
($10
00 B
ase)
S&P 500 Hedge Funds Bonds*CS/Tremont Composite Index
S&P500
Hedge Funds
Bonds
Why The Interest?
© 2009 Christopher C. Geczy where applicable - Do Not Reproduce Without Permission
15
The Regs (U.S.)
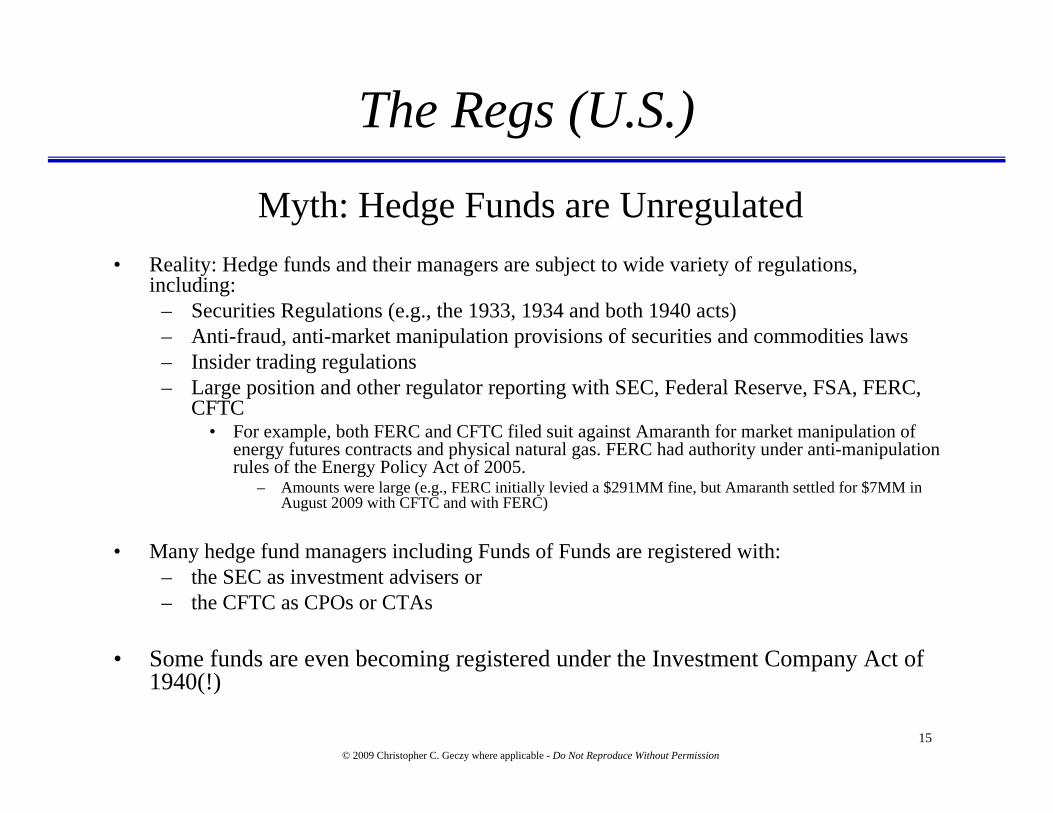
Myth: Hedge Funds are Unregulated• Reality: Hedge funds and their managers are subject to wide variety of regulations,
including:– Securities Regulations (e.g., the 1933, 1934 and both 1940 acts)– Anti-fraud, anti-market manipulation provisions of securities and commodities laws– Insider trading regulations– Large position and other regulator reporting with SEC, Federal Reserve, FSA, FERC,
CFTC• For example, both FERC and CFTC filed suit against Amaranth for market manipulation of
energy futures contracts and physical natural gas. FERC had authority under anti-manipulation rules of the Energy Policy Act of 2005.
– Amounts were large (e.g., FERC initially levied a $291MM fine, but Amaranth settled for $7MM in August 2009 with CFTC and with FERC)
• Many hedge fund managers including Funds of Funds are registered with:– the SEC as investment advisers or – the CFTC as CPOs or CTAs
• Some funds are even becoming registered under the Investment Company Act of 1940(!)
© 2009 Christopher C. Geczy where applicable - Do Not Reproduce Without Permission
16
The Regs (U.S.)
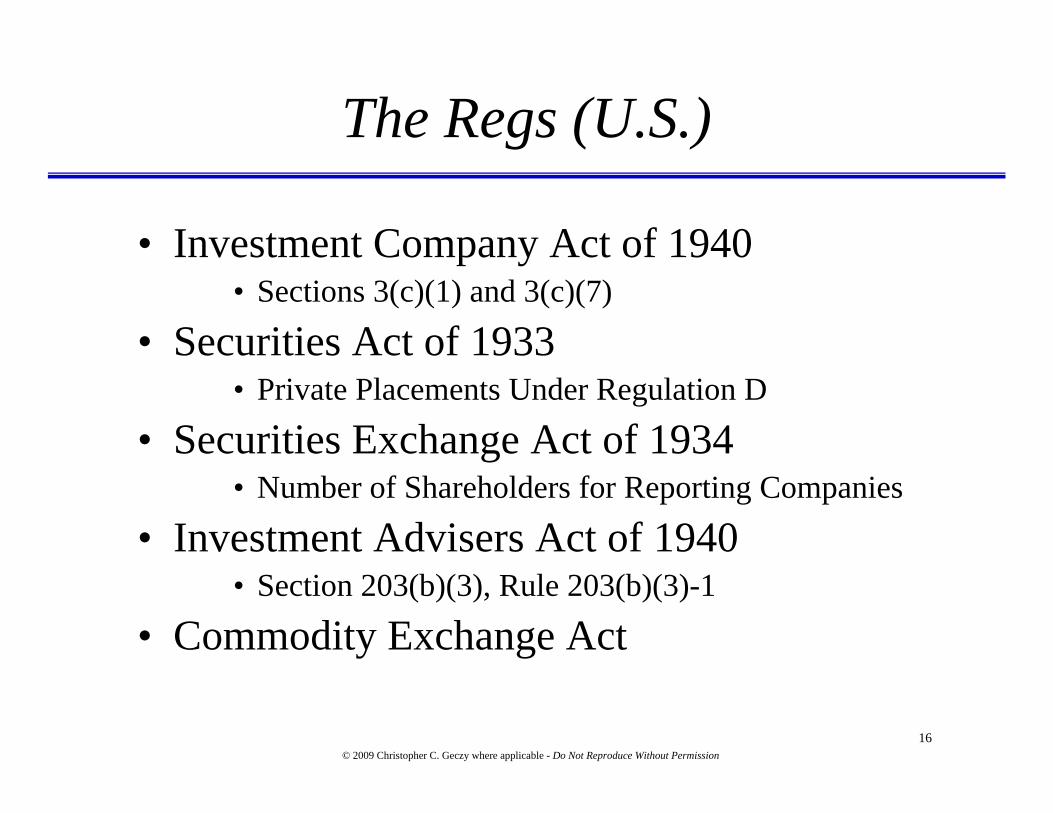
• Investment Company Act of 1940• Sections 3(c)(1) and 3(c)(7)
• Securities Act of 1933• Private Placements Under Regulation D
• Securities Exchange Act of 1934• Number of Shareholders for Reporting Companies
• Investment Advisers Act of 1940• Section 203(b)(3), Rule 203(b)(3)-1
• Commodity Exchange Act
© 2009 Christopher C. Geczy where applicable - Do Not Reproduce Without Permission

17
Hedge Fund vs. Mutual Funds
Management fee and incentive feeManagement fee only
Large minimum investments, often $500,000 to $1 million, or moreFrequently have low minimum investments
3(c)7 vehicle3(c)1 vehicle
Use derivatives more frequently, and able to use nonpublic securities and leverage; can invest in highly illiquid positions
Use only a small amount of leverage, options, futures and short positions and limited to 15% “illiquidity”; must have a reportable daily NAV
More complex tax reporting (typically Schedule K-1)Simple tax reporting (Form 1099)
Only allowed to accept investments from qualified purchasers
Not permitted to actively market its investment products
Limited to 500 qualified purchasersLimited to 99 accredited investorsCan advertise on television or mainstream financial publications
Exempt through section 3(c)7 of National Securities Market Improvement Act of 1996
Exempt through 3(c)1 exemption of Investment Company Act of 1940
Available to all investors
Not necessarily part of an Investment Company (typically find “safe harbor”) Regulated by Investment Company Act of 1940
Able to change investment strategies and the types of assets tradedSometimes maintain more concentrated portfolios
Stable investment strategy in a given asset class
Seek to profit in all market environmentsSeek a high correlation (low “tracking error”) to market benchmarks
Hedge FundsMutual Funds

18
The Regs (U.S.)
• Important Recent “Events”
– The CapCo Study (2002)• Most hedge fund failures are related to operational issues
– SEC’s failed attempt at forcing hedge funds to register in October 2004 (abrogated in 2006 by appellate court)
– The President’s Working Group Report(s)• No regulation
– Then…Madoff (and so many others)
– October 2008 worldwide experiment in short selling restrictions
– And others…
© 2009 Christopher C. Geczy where applicable - Do Not Reproduce Without Permission

19
Madoff Ponzi Scheme
• Bernie Madoff– Founder of Bernard L. Madoff Investment Securities, LLC
(1960’s)– Industry ties
• Former Chairman of NASDAQ• Ties to SIA/SIFMA
– Carried out the world’s largest recorded Ponzi scheme• Supposedly traded “Split-Strike Conversion,” essentially a bounded
bull or bear spread• U.S. Attorney’s office is currently estimating $13Bn from 2,336
victims– Madoff claimed $65Bn
• Raised through direct investments and through so-called feeder funds
© 2009 Christopher C. Geczy where applicable - Do Not Reproduce Without Permission
20
Madoff Ponzi Scheme
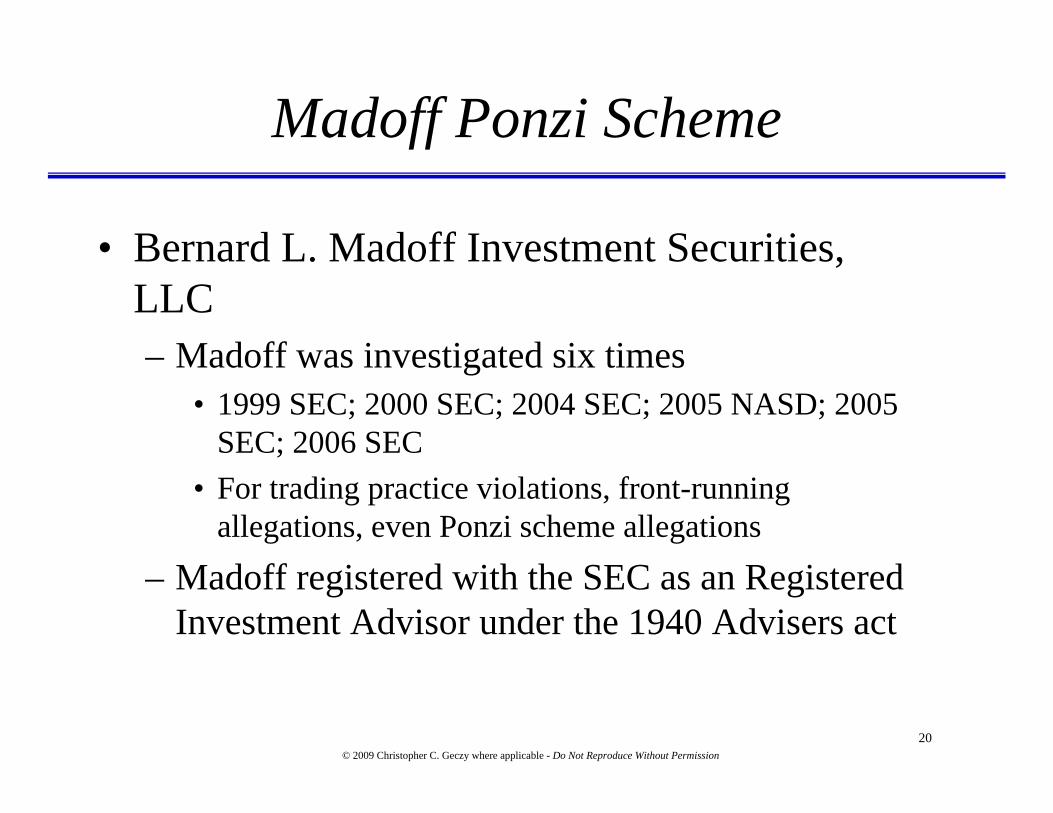
• Bernard L. Madoff Investment Securities, LLC– Madoff was investigated six times
• 1999 SEC; 2000 SEC; 2004 SEC; 2005 NASD; 2005 SEC; 2006 SEC
• For trading practice violations, front-running allegations, even Ponzi scheme allegations
– Madoff registered with the SEC as an Registered Investment Advisor under the 1940 Advisers act
© 2009 Christopher C. Geczy where applicable - Do Not Reproduce Without Permission

21
Madoff Ponzi Scheme• There were problems with the Madoff situation…
– Split-strike conversion was unreplicable by analysts• Other hedge funds have unreplicable returns (e.g., RenTech’s Medallion and other quant funds)
– S&P100 options market would have difficulty handling OTC $13-$17Bn in assets• Excuse was that no one would talk lest Madoff not trade with them in the future
– Madoff Administrator and auditor (Friehling & Horowitz) was a 3-person company (one was 78 years old and lived out of state) and only one other was an accountant; suspiciously small and understaffed
• But feeder funds had top firms (e.g., PWC, KPMG)
– Form 13F positions were very small• Counter claim was that Madoff went to cash at the end of every quarter to hid positions
– Paper statements were issued T+3; no electronic operations
– Family involvement (brother, daughter, sons)• Feeder fund indicated that Peter Madoff “wrote the code” that ran the strategy
– Madoff Securities acted as manager, broker, custodian and administrator, all in one or related organizations
– Still, investors trusted regulators, feeder fund due diligence and representations, and liked the track record!
© 2009 Christopher C. Geczy where applicable - Do Not Reproduce Without Permission

22
Madoff Feeder Fund Returns
Madoff Ponzi Scheme
© 2009 Christopher C. Geczy where applicable - Do Not Reproduce Without Permission
Madoff Feeder Fund

23
Madoff Feeder Fund Returns
Madoff Ponzi Scheme
© 2009 Christopher C. Geczy where applicable - Do Not Reproduce Without Permission
BM1 = Benchmark 1 = S&P500BM2 = Benchmark 2 = Lehman Aggregate Bond Index

24
Regulation
• But not just Madoff– Famous CapCo study
• 50% of hedge fund failures arise due to operational issues including fraud
• Something like 25% of failures step from fraud
– Brown and Goetzmann (2009)• 20% of hedge funds misrepresents its fund or its performance
– The SEC has so far this year identified and prosecuted more than 45 Ponzi schemes
• The Asset Management Unit of the SEC has “…focus on…hedge funds and private equity funds.”
© 2009 Christopher C. Geczy where applicable - Do Not Reproduce Without Permission

25
Regulation
© 2009 Christopher C. Geczy where applicable - Do Not Reproduce Without Permission
SEC Frauds and Ponzi Schemes Investigated Since the end of 2008Name of Litigation Date
SEC v. Frank J. Russo et al. 11/3/2008SEC v. Biltmore Financial Group, Inc., J. V. Huffman, Jr., Defendants, and Gilda Bolick Huffman 11/13/2008SEC v. Bernard L. Madoff and Bernard L. Madoff Investment Securities LLC 12/19/2008SEC v. Creative Capital Consortium, LLC, et. al. 12/30/2008SEC v. Anthony A. James 1/6/2009SEC v. Joseph S. Forte, et al. 1/8/2009SEC v. Gen-See Capital Corp. and Richard S. Piccoli 1/8/2009SEC v. Rod Cameron Stringer, individually and d/b/a RCS Hedge Fund 1/21/2009SEC v. William L. Walters 2/18/2009SEC v. Daren L. Palmer and Trigon Group, Inc. 2/27/2009SEC v. Stanford International Bank, et al. 2/17/2009SEC v. Billion Coupons, Inc. (aka Billion Coupons Investment) and Marvin R. Cooper 2/19/2009SEC v. CRE Capital Corporation and James G. Ossie 1/15/2009SEC v. Craig T. Jolly and Quest Holdings, Inc. 2/9/2009SEC v. Brian J. Smart, et al. 3/12/2009SEC v. Ray M. White and CRW Management, L.P. 3/5/2009SEC v. Shelby Dean Martin, D. Martin Enterprises, Inc. and DM Ventures, LLC 3/6/2009SEC v. Anthony Vassallo, Kenneth Kenitzer, and Equity Investment Management and Trading, Inc.AD 3/11/2009SEC v. John M. Donnelly, et al. 3/11/2009SEC v. Millennium Bank, et al. 3/26/2009SEC v. Oversea Chinese Fund Limited Partnership, et al., 4/6/2009SEC v. Market Street Advisors, Shawn R. Merriman, LLC-1, LLC-2, Marque LLC-3, and LLC-4 4/7/2009SEC v. Robert P. Copeland 4/9/2009SEC v. Maximum Return Investments, Inc. and Clelia A. Flores 4/13/2009SEC v. Edward T. Stein et al. 4/15/2009SEC v. Donald Anthony Walker Young, et al. 4/20/2009SEC v. Bradley L. Ruderman, Ruderman Capital Management, LLC, Ruderman Capital Partners, LLC, and Ruder 4/29/2009SEC v. Gordon A. Driver and Axcess Automation, LLC 5/15/2009SEC v. FTC Capital Markets, Inc., FTC Emerging Markets, Inc. also d/b/a FTC Group, Guillermo David Clamens a 5/20/2009SEC v. David E. Ruskjer 5/29/2009SEC v. Christopher M. Kunkel 6/9/2009SEC v. Peter C. Son, Jin K. Chung, SNC Asset Management, Inc., and SNC Investments, Inc. 6/9/2009SEC v. John S. Morgan, Marian I. Morgan, Morgan European Holdings ApS a/k/a Money Talks, Inc., ApS, Stephe 6/12/2009SEC v. David J. Hernandez, also doing business as “NextStep Financial Services, Inc.,” 6/15/2009SEC v. Horizon Property Holdings, L.C. and Cydney Sanchez, 6/17/2009SEC v. Stanford International Bank, Ltd., et al. 6/19/2009SEC v. Moises Pacheco, Advanced Money Management, Inc., and Business Development & Consulting Co., et a 6/24/2009SEC v. Regan & Company and Michael C. Regan 6/24/2009SEC v. Thomas J. Petters, Gregory M. Bell and Lancelot Investment Management LLC, Defendants, and Inna Go 7/10/2009SEC v. Sean Nathan Healy, Defendant, and Shalese Rania Healy and Sand Dollar Investing Partners, LLC 7/14/2009SEC v. John J. Bravata, et al 7/28/2009SEC v. Diversity Capital Investments, Inc., et al 7/29/2009SEC v. Steven E. Tennies and Price Geld & Company, Inc. 7/31/2009SEC v. Titan Wealth Management, LLC, Point West Partners, LLC, and Thomas Lester Irby II, Defendants, and J 8/26/2009SEC v. Ben-Wal Leasing Company, et al., 8/27/2009SEC v. Provident Royalties, LLC, Provident Asset Management, LLC, Provident Energy 1, LP, Provident Resourc 7/7/2009SEC v. David A. Souza and D.A. Souza Investments, LLC 8/31/2009SEC v. Jeffrey L. Mowen et al. 9/3/2009SEC v. Philip G. Barry, Leverage Group, Leverage Option Management Co., Inc., and North American Financial S 9/8/2009SEC v. Frank Bluestein 9/28/2009SEC v. William A. Huber and Hubadex, Inc., 9/30/2009SEC v. Randy M. Cho 10/7/2009

26
Regulation
• Outcomes– Renewed interest in hedge fund registration
• In the U.S.– Either via changes in sections 501/506 of Regulation D of the 1933
Securities Act– Or Sections 3(c)1 or 3(c)7 of the 1940 Advisors Act– Will likely come from Congress in the U.S.
• In the EU– Directives in place
– Renewed interest in and resources dedicated to detection and enforcement around the world
– Better investor due diligence
– Greater distrust of investments, managers and regulators
© 2009 Christopher C. Geczy where applicable - Do Not Reproduce Without Permission
27
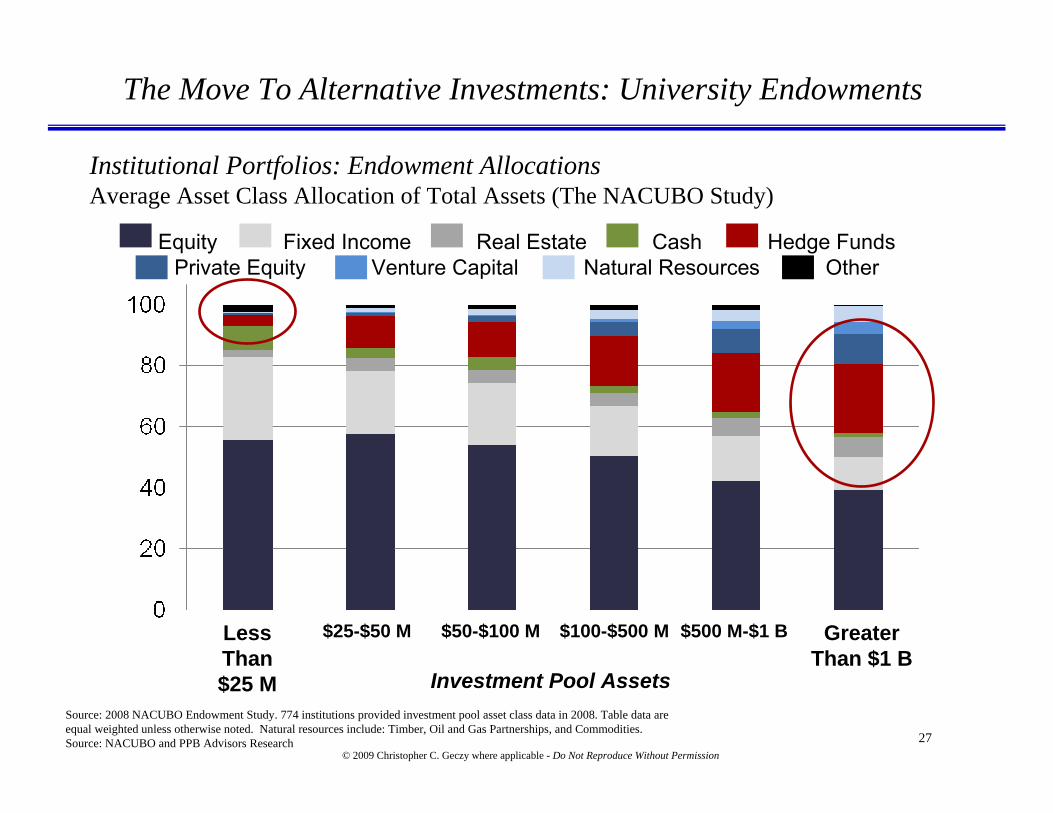
Institutional Portfolios: Endowment AllocationsAverage Asset Class Allocation of Total Assets (The NACUBO Study)
The Move To Alternative Investments: University Endowments
© 2009 Christopher C. Geczy where applicable - Do Not Reproduce Without Permission
Source: 2008 NACUBO Endowment Study. 774 institutions provided investment pool asset class data in 2008. Table data are equal weighted unless otherwise noted. Natural resources include: Timber, Oil and Gas Partnerships, and Commodities. Source: NACUBO and PPB Advisors Research
Less Than $25 M
$25-$50 M $50-$100 M $100-$500 M $500 M-$1 B Greater Than $1 B
Investment Pool Assets
Equity Fixed Income Real Estate Cash Hedge FundsPrivate Equity Venture Capital Natural Resources Other
28
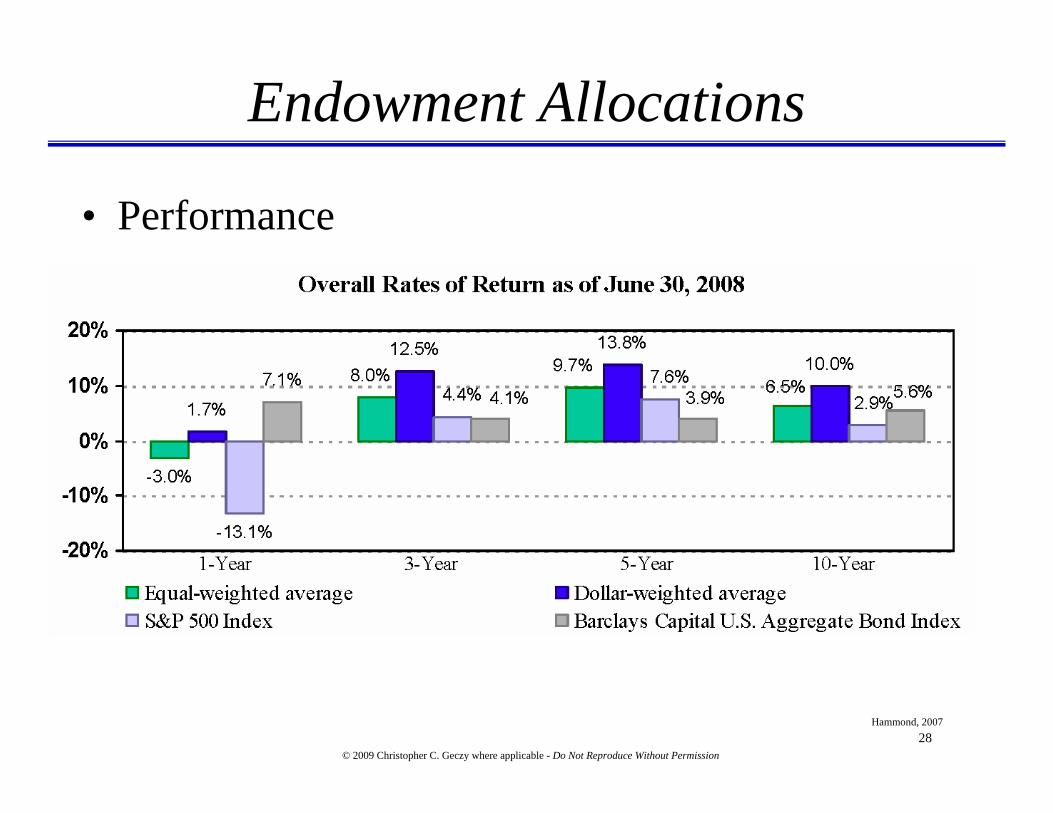
• Performance
Endowment Allocations
Hammond, 2007
© 2009 Christopher C. Geczy where applicable - Do Not Reproduce Without Permission

29
Example: Yale University
Source: PPB Advisors, LLC ResearchData complied from the Yale Investments Office
Market Value (in millions): $22,869.7Return: 4.5%
Fixed Income, 4.0%
Private Equity, 20.2%
Foreign Equity, 15.2%
Domestic Equity, 10.1%
Absolute Return, 25.1%
Real Assets, 29.3%
Cash, -3.9%
Yale’s Asset Allocation as of June
30
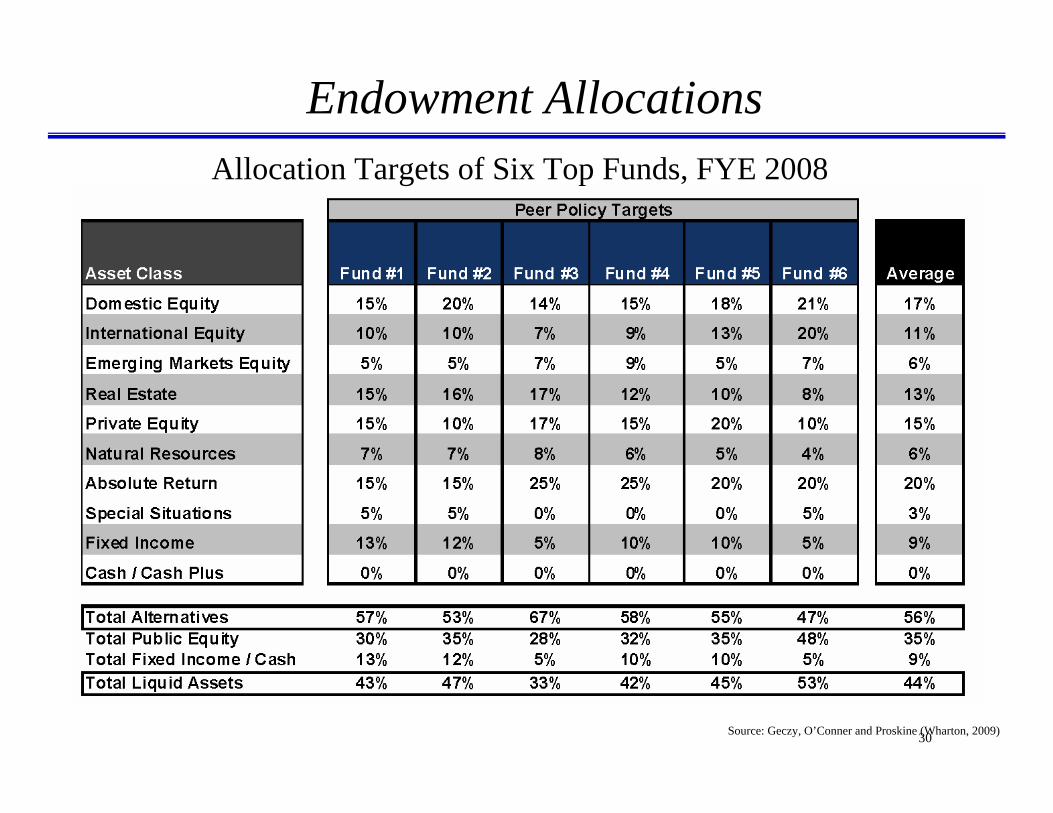
Endowment Allocations
Source: Geczy, O’Conner and Proskine (Wharton, 2009)
Allocation Targets of Six Top Funds, FYE 2008

31
Asset Allocation
Data complied from Yale University Investments Offices and www.seekingalpha.com (August 2007)
Yale Harvard S&P 500
Average Return: 17.14% 15.92% 14.22%Std. Dev.: 10.65% 9.65% 14.89%Sharpe Ratio: 1.23 1.18 0.65
Yale Endowment Portfolio PerformanceFiscal Year 1985-2007
1© 2009 Christopher C. Geczy where applicable - Do Not Reproduce Without Permission

32
Endowment Allocations
Historical Annual Performance of Top 5 Largest University Endowment Funds
-40.00%
-30.00%
-20.00%
-10.00%
0.00%
10.00%
20.00%
30.00%
40.00%
2009 2008 2007 2006 2005 2004 2003
Fiscal year
Retu
rns
(%
Harvard Yale Stanford Princeton MIT S&P 500 Barclays Agg 60S&P/40Barclays

33
Estimated Strategy Composition by # of Hedge Funds and Fund of FundsQ4 2007
Equity Hedge 26.76%
Equity Market Neutral 3.74%
Equity Non-Hedge 3.60%
Event-Driven 6.99%
Fund of Funds 24.37%
Market Timing 0.78%
Merger Arbitrage 1.64%
Regulation D 0.34%
Relative Value Arbitrage 4.76%
Sector (Total) 7.19%
Short Selling 0.42%
Macro 3.79%
FI: Convertible Bonds 0.29%
FI: Diversified 1.62%
FI: High Yield 1.24%
FI: MBS 1.02%
FI: Arbitrage 2.44%
Convertible Arbitrage 1.63%
Distressed Securities 2.48%
Emerging Markets (Total) 4.87%

34
Estimated Strategy Composition by Assets Under ManagementQ4 2007
Equity Hedge 27.15%Macro 10.89%
Market Timing 0.30%
Merger Arbitrage 1.50%
Regulation D 0.22%
Relative Value Arbitrage 14.63% Emerging Markets (Total)
4.64%
Distressed Securities 5.64%
Convertible Arbitrage 3.02%
Equity Non-Hedge3.73%
Short Selling0.28%
Sector (Total)5.24%
FI: MBS 1.84%
FI: High Yield 1.55%
FI: Diversified 1.34%
FI: Convertible Bonds 0.09%
FI: Arbitrage 2.72% Event-Driven13.20%
Equity Market Neutral 2.28%

35
Estimated Strategy Composition by AUM1990
Merger Arbitrage 0.60%
Fixed Income (Total) 3.24%
Event Driven 3.84%
Relative Value Arbitrage 10.08%
Sector (Total) 0.24%
Macro71.07%
Equity Non-Hedge 0.60%
Equity Market Neutral 1.68%
Equity Hedge 5.28%Short Selling 0.12%
Convertible Arbitrage 0.48%
Distressed Securities 2.40% Emerging Markets (Total)
0.36%
Source: HFR Industry Reports, © HFR, Inc. 2007, www.hedgefundresearch.com.”

36
Distributional Properties of Returns:HFRI Index Analysis (through 2008)
In probability theory and statistics, skewness is a measure of the asymmetry of the probability distribution of a real-valued random variable
Positive skew: The right tail is the longest; the mass of the distribution is concentrated on the left of the figure. The distribution is said to be right-skewed. Negative skew: The left tail is the longest; the mass of the distribution is concentrated on the right of the figure. The distribution is said to be left-skewed.
In probability theory and statistics, kurtosis is a measure of the "peakedness" of the probability distribution of a real-valued random variable. Higher kurtosis means more of the variance is due to infrequent extreme deviations, as opposed to frequent modestly-sized deviations.
A high kurtosis distribution has a sharper "peak" and fatter "tails", while a low kurtosis distribution has a more rounded peak with wider "shoulders".
Index Mean StD Skew Kurt Mean StD Skew Kurt Mean StD Skew KurtHFRI Equity Hedge (Total) (26.16) 12.87 (0.43) (0.31) (3.05) 10.24 (1.34) 2.01 1.65 8.83 (1.51) 3.18HFRI EH: Energy/Basic Materials (36.90) 24.08 (0.69) (0.15) (5.16) 17.24 (1.69) 3.54 7.27 15.52 (1.64) 4.52HFRI EH: Equity Market Neutral (6.20) 5.06 (0.28) (0.63) 1.96 3.69 (1.39) 2.00 3.24 3.12 (1.64) 3.53HFRI EH: Quantitative Directional (21.62) 13.44 (0.52) (0.55) 0.69 11.73 (0.84) 0.55 4.93 10.80 (0.80) 0.57HFRI EH: Short Bias 28.62 13.65 0.29 (0.86) 9.45 10.40 1.04 0.57 6.23 9.50 0.94 0.67HFRI EH: Technology/Healthcare (16.72) 10.84 (0.07) (1.03) 2.87 10.34 (0.46) (0.19) 3.89 9.58 (0.41) (0.30)HFRI Event-Driven (Total) (21.26) 9.73 (1.09) 0.93 (1.07) 8.22 (1.52) 3.09 3.62 7.22 (1.59) 4.31HFRI ED: Distressed/Restructuring (24.94) 9.77 (0.87) (0.06) (2.94) 8.23 (1.70) 3.01 3.31 7.10 (1.97) 5.33HFRI ED: Merger Arbitrage (4.62) 5.71 (0.26) (0.65) 5.27 4.76 (0.74) 0.60 5.22 4.17 (0.75) 0.86HFRI ED: Private Issue/Regulation D (5.12) 3.80 (1.22) 1.58 2.62 5.31 0.15 0.58 5.20 5.48 0.33 0.06HFRI Macro (Total) 5.18 6.26 0.29 0.65 8.12 5.39 0.06 (0.19) 7.15 4.94 (0.04) 0.15HFRI Macro: Systematic Diversified 17.70 9.82 0.18 0.15 14.92 9.67 0.16 (0.16) 13.06 8.54 0.14 0.07HFRI Relative Value (Total) (16.77) 9.64 (1.47) 1.76 0.63 6.98 (2.57) 7.81 2.67 5.59 (3.17) 13.10HFRI RV: Fixed Income-Asset Backed (0.08) 3.44 (0.62) (1.17) 3.17 2.70 (1.25) 0.27 5.79 2.36 (1.66) 2.36HFRI RV: Fixed Income-Convertible Arbitrage (34.67) 18.97 (1.84) 2.76 (8.27) 12.78 (3.34) 12.04 (5.18) 10.13 (4.13) 19.82HFRI RV: Fixed Income-Corporate (21.73) 11.19 (1.39) 3.09 (4.88) 8.22 (2.30) 7.10 0.02 6.71 (2.99) 12.28HFRI RV: Multi-Strategy (19.93) 10.36 (1.49) 1.81 (3.87) 7.18 (2.78) 8.79 0.31 5.78 (3.64) 15.68HFRI RV: Yield Alternatives (22.22) 11.72 (0.62) (0.93) (3.94) 8.44 (1.78) 3.05 2.04 8.23 (1.66) 3.05HFRI Fund Weighted Composite (18.36) 9.60 (0.50) (0.28) 0.45 7.91 (1.23) 1.72 3.85 6.80 (1.41) 2.84HFRI Fund of Funds Composite (20.68) 9.16 (0.44) (0.27) (1.16) 7.85 (1.19) 1.42 2.09 6.61 (1.46) 2.93HFRI Emerging Markets (Total) (36.80) 17.29 (0.62) 0.34 (0.64) 15.03 (1.36) 2.06 7.05 12.84 (1.62) 3.53HFRI Emerging Markets: Asia ex-Japan (33.60) 16.38 0.04 (1.04) 4.36 15.72 (0.79) (0.23) 7.41 13.27 (0.86) 0.51HFRI Emerging Markets: Global (30.51) 14.81 (0.94) 1.15 (0.39) 12.56 (1.49) 3.03 5.32 10.57 (1.79) 4.95HFRI Emerging Markets: Latin America (28.26) 19.73 (0.90) 0.61 (0.89) 14.38 (1.76) 4.08 4.63 12.12 (2.01) 6.04HFRI Emerging Markets: Russia/Eastern Europe (57.75) 28.23 (0.44) (0.03) (9.90) 23.73 (1.39) 2.28 8.07 21.31 (1.51) 3.25Lehman Brothers Government/Credit Aggregate Bond 6.09 8.37 0.67 0.08 5.96 5.33 0.75 2.35 4.98 4.97 0.30 2.17S&P 500 w/ dividends (36.99) 21.01 (0.79) 0.49 (8.36) 15.28 (1.80) 4.12 (2.19) 12.85 (2.03) 6.28
1-Year 3-Year 5-Year
37
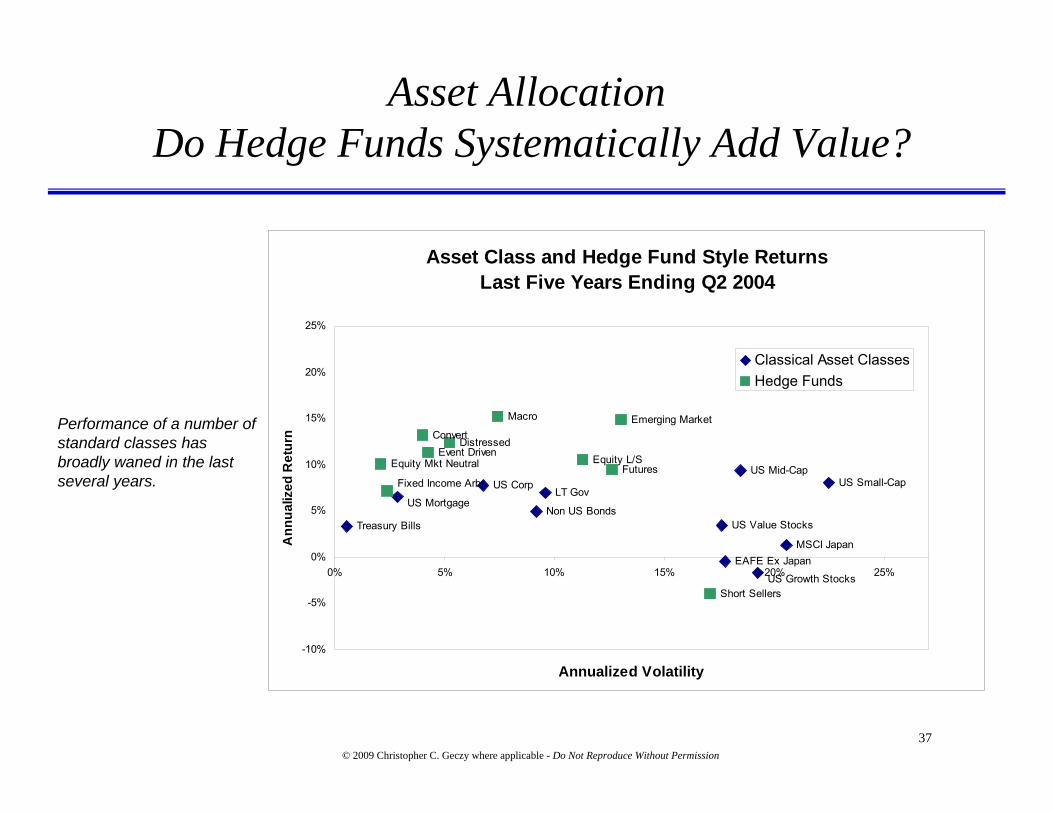
Performance of a number of standard classes has broadly waned in the last several years.
Asset AllocationDo Hedge Funds Systematically Add Value?
Asset Class and Hedge Fund Style ReturnsLast Five Years Ending Q2 2004
Treasury Bills
US MortgageLT Gov
US Corp
US Value Stocks
US Growth Stocks
US Mid-CapUS Small-Cap
EAFE Ex JapanMSCI Japan
Non US Bonds
Equity L/S
Fixed Income Arb
ConvertDistressed
Emerging Market
Equity Mkt NeutralEvent Driven
Macro
Futures
Short Sellers
-10%
-5%
0%
5%
10%
15%
20%
25%
0% 5% 10% 15% 20% 25%
Annualized Volatility
Ann
ualiz
ed R
etur
n
Classical Asset ClassesHedge Funds
© 2009 Christopher C. Geczy where applicable - Do Not Reproduce Without Permission

38
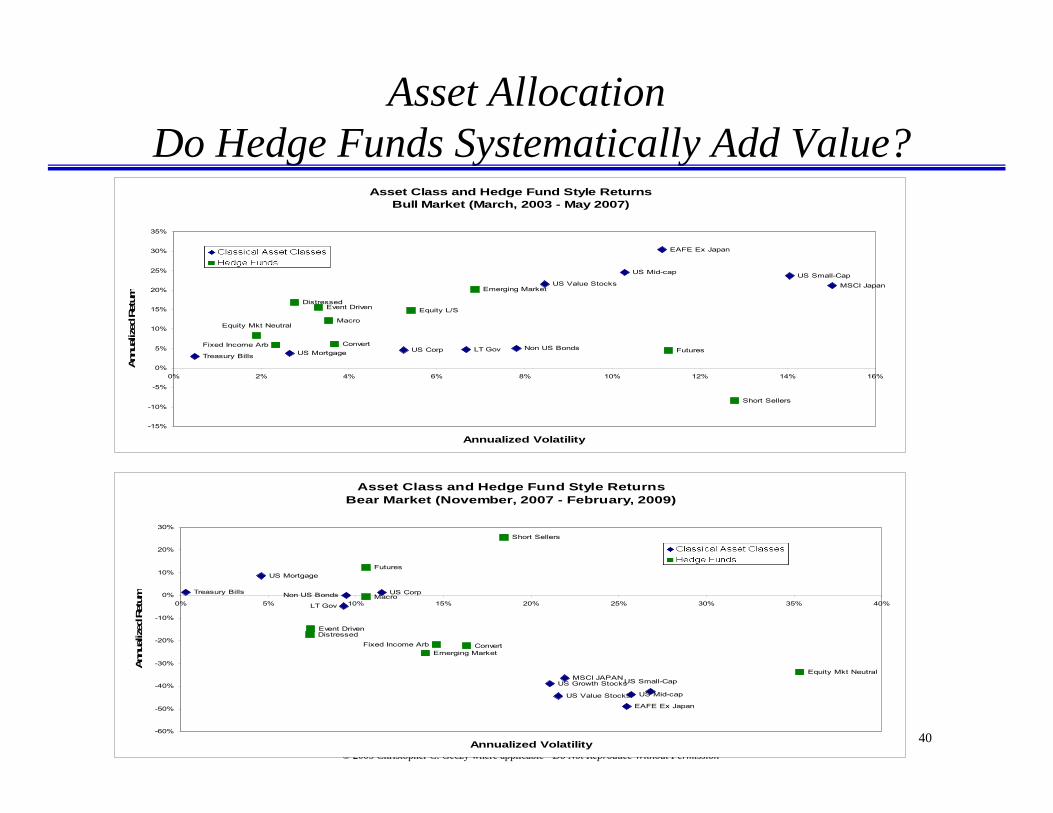
A rising tide (bull markets) raises all boats.
However, few traditional asset classes provide protection against bear markets.
Asset AllocationDo Hedge Funds Systematically Add Value?
© 2009 Christopher C. Geczy where applicable - Do Not Reproduce Without Permission
Asset Class and Hedge Fund Style ReturnsBull Market (January, 1998 - March, 2000)
S&P500
Non US Bonds
MSCI Japan
EAFE Ex Japan
US Small-Cap
US Mid-Cap
US Value Stocks
US Corp
LT GovUS Mortgage
Treasury Bills
Short Sellers
Futures
Macro
Event DrivenEquity Mkt Neutral
Emerging Market
DistressedConvert
Fixed Income ArbEquity L/S
-10%
-5%
0%
5%
10%
15%
20%
25%
30%
0% 5% 10% 15% 20% 25%
Annualized Volatility
Ann
ualiz
ed R
etur
n
Classical Asset ClassesHedge Funds
Asset Class and Hedge Fund Style ReturnsBear Market (August, 2000 - September, 2002)
Treasury Bills
US Mortgage
LT GovUS Corp
US Value Stocks
US Grow th Stocks
US Mid-Cap
US Small-Cap
EAFE Ex Japan MSCI Japan
Non US Bonds
S&P500
Fixed Income ArbConvertDistressed
Emerging Market
Equity Mkt Neutral
Event Driven
MacroFutures
Short Sellers
-35%
-25%
-15%
-5%
5%
15%
25%
0% 5% 10% 15% 20% 25%
Annualized Volatility
Ann
ualiz
ed R
etur
n
Classical Asset Classes
Hedge Funds

39
Asset AllocationDo Hedge Funds Systematically Add Value?
© 2009 Christopher C. Geczy where applicable - Do Not Reproduce Without Permission
Asset Class and Hedge Fund Style Returns Last Five Years Ending Q2 2009
Equity Mkt Neutral
Event Driven
Distressed
Macro
Equity L/S
Emerging Market
Futures
Short Sellers
Treasury Bills
LT Gov
Non US Bonds
MSCI Japan
EAFE Ex Japan
US Mortgage
US Growth StocksUS Value Stocks
US Mid-cap
US Small-Cap
US Corp
Convert
Fixed Income Arb
-6%
-4%
-2%
0%
2%
4%
6%
8%
10%
0% 5% 10% 15% 20% 25%
Annualized Volatility
Ann
ualiz
ed R
etur
n
40
Asset AllocationDo Hedge Funds Systematically Add Value?
© 2009 Christopher C. Geczy where applicable - Do Not Reproduce Without Permission
Asset Class and Hedge Fund Style Returns Bear Market (November, 2007 - February, 2009)
Equity Mkt Neutral
Event DrivenDistressed
Fixed Income Arb
Macro
Emerging Market
Futures
Short Sellers
Treasury Bills
LT Gov
Non US Bonds
MSCI JAPAN
EAFE Ex Japan
US Mortgage
US Growth Stocks
US Value Stocks US Mid-cap
US Small-Cap
US Corp
Convert
-60%
-50%
-40%
-30%
-20%
-10%
0%
10%
20%
30%
0% 5% 10% 15% 20% 25% 30% 35% 40%
Annualized Volatility
Ann
ualiz
ed R
etur
n
Asset Class and Hedge Fund Style Returns Bull Market (March, 2003 - May 2007)
Equity Mkt Neutral
Event DrivenDistressed
Fixed Income Arb
Macro
Equity L/S
Emerging Market
Futures
Short Sellers
Treasury BillsLT Gov Non US Bonds
MSCI Japan
EAFE Ex Japan
US Mortgage
US Value Stocks
US Mid-cap US Small-Cap
US CorpConvert
-15%
-10%
-5%
0%
5%
10%
15%
20%
25%
30%
35%
0% 2% 4% 6% 8% 10% 12% 14% 16%
Annualized Volatility
Ann
ualiz
ed R
etur
n

41
Historical Monthly Correlation to S&P 500 Index5 Year Rolling
1,000
1,500
2,000
2,500
3,000
3,500
4,000
4,500
12-1
994
03-1
995
06-1
995
09-1
995
12-1
995
03-1
996
06-1
996
09-1
996
12-1
996
03-1
997
06-1
997
09-1
997
12-1
997
03-1
998
06-1
998
09-1
998
12-1
998
03-1
999
06-1
999
09-1
999
12-1
999
03-2
000
06-2
000
09-2
000
12-2
000
03-2
001
06-2
001
09-2
001
12-2
001
03-2
002
06-2
002
09-2
002
12-2
002
03-2
003
06-2
003
09-2
003
12-2
003
03-2
004
06-2
004
09-2
004
12-2
004
03-2
005
06-2
005
09-2
005
12-2
005
03-2
006
06-2
006
09-2
006
12-2
006
03-2
007
06-2
007
09-2
007
12-2
007
S&P
500
VA
MI
(1.00)
(0.80)
(0.60)
(0.40)
(0.20)
0.00
0.20
0.40
0.60
0.80
1.00
Cor
rela
tion
to S
&P
500
S&P 500 Equity Hedge Macro Fund Weighted Composite Fund of Funds Composite
42
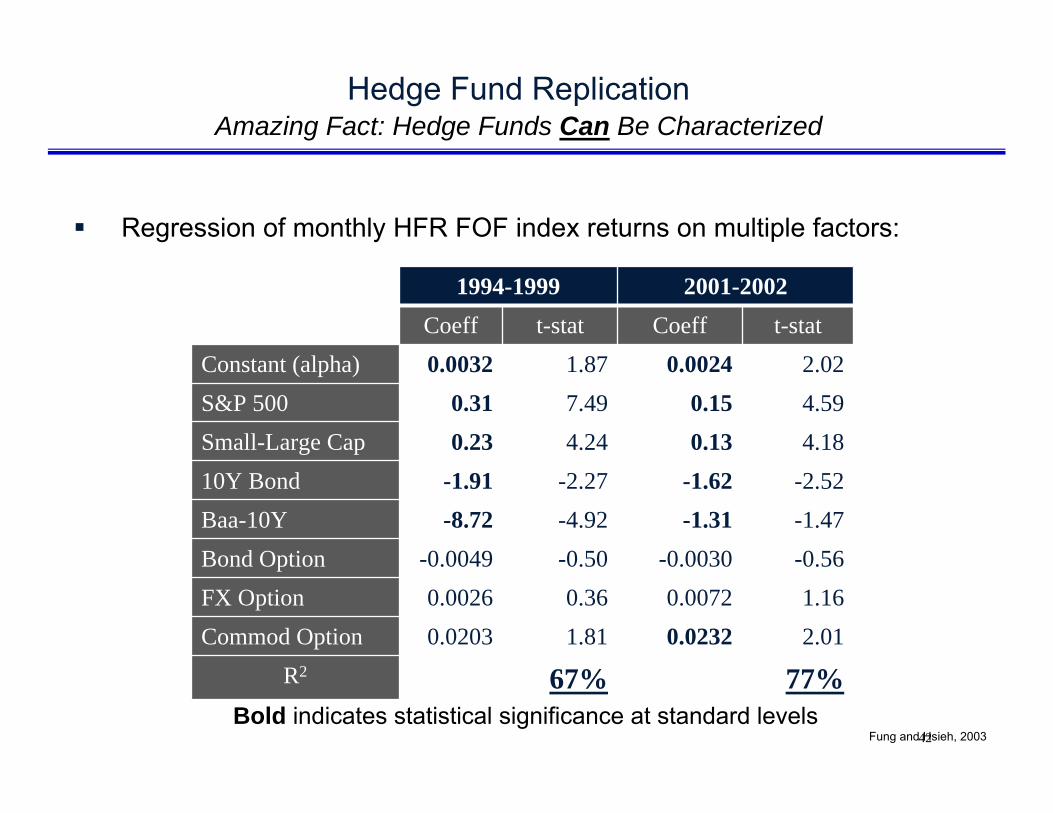
Hedge Fund ReplicationAmazing Fact: Hedge Funds Can Be Characterized
Regression of monthly HFR FOF index returns on multiple factors:
Fung and Hsieh, 2003
1994-1999 2001-2002Coeff t-stat Coeff t-stat
Constant (alpha) 0.0032 1.87 0.0024 2.02S&P 500 0.31 7.49 0.15 4.59Small-Large Cap 0.23 4.24 0.13 4.1810Y Bond -1.91 -2.27 -1.62 -2.52Baa-10Y -8.72 -4.92 -1.31 -1.47Bond Option -0.0049 -0.50 -0.0030 -0.56FX Option 0.0026 0.36 0.0072 1.16Commod Option 0.0203 1.81 0.0232 2.01
R2 67% 77%Bold indicates statistical significance at standard levels

43
Potential Exposures
Source: Geczy (2006)

44
Hedge Fund Styles: Some Style and Risk Models*
*Chan, et al (2005)
Regressor Hedge Funds
Convert Arb
Dedicated Shortseller
Emerging Markets
Equity Market Neutral
Event Driven Distressed
Event-driven Multi-
strategy
Risk ArbFixed
Income Arb
Global Macro
Long Short Equity
Managed Futures
Multi-Strategy
Factor Selection
Count
Sample Size: 118 118 118 118 118 118 118 118 118 118 118 118 118 117R2: 54.5% 45.1% 79.7% 44.1% 25.5% 75.1% 65.0% 66.4% 58.0% 54.3% 34.3% 73.2% 21.4% 16.3%Constant 0.30 0.08 1.9 -0.58 0.98 0.29 0.94 0.75 1.14 0.06 0.31 1.09 0.19 0.58 14
(1.22) (0.22) (4.25) (-0.81) (7.00) (0.84) (4.65) (4.93) (7.34) (0.20) (0.78) (3.35) (0.59) (3.97)SP500 0.23 -0.63 0.44 0.13 0.28 5
(5.81) (-7.11) (3.29) (3.17) (4.29)SP500(Lag 1) 0.06 0.06 -0.05 3
(2.39) (1.82) (-1.80)SP500^2 0.07 -0.10 -0.06 3
(2.49) (-2.03) (-2.08)SP500^2(Lag 1) -0.12 -0.14 -0.30 -0.12 -0.09 -0.10 -0.06 -0.16 -0.09 0.09 10
(-2.12) (-1.60) (-2.44) (-3.70) (-2.09) (-2.68) (-1.89) (-1.76) (-1.74) (2.07)SP500^3 0.21 -0.24 0.44 0.07 0.26 0.21 0.32 0.15 0.15 -0.26 10
(5.92) (-2.49) (2.82) (2.80) (8.22) (3.63) (12.00) (5.57) (2.10) (-3.15)SP500^3(Lag 1) 0.15 -0.15 0.08 0.05 0.19 -0.17 0.08 7
(5.21) (-2.27) (2.31) (2.32) (5.82) (-2.09) (2.36)SP500^3(Lag 2) 0.09 0.13 0.12 0.15 0.14 5
(1.74) (4.34) (4.79) (1.75) (4.39)Banks 0.06 0.10 0.07 0.1 0.24 5
(2.47) (2.94) (2.85) (3.76) (3.43)Banks(Lag 1) 0.08 0.07 0.08 0.07 -0.06 5
(1.85) (2.16) (1.80) (2.19) (-2.14)Banks(Lag 2) 0.09 0.05 0.07 0.05 0.18 0.10 6
(1.71) (1.98) (2.05) (1.78) (2.04) (2.33)USD 0.42 0.13 0.65 0.15 0.11 0.21 0.11 0.68 -0.15 9
(4.86) (2.21) (3.74) (3.00) (2.06) (3.95) (2.97) (4.85) (-2.78)Gold 0.08 0.17 0.05 0.08 -0.05 5
(1.62) (1.50) (2.14) (2.33) (-1.39)Lehman Bond 0.59 0.18 0.13 0.22 0.24 0.98 0.38 0.79 8
(3.77) (1.56) (1.32) (2.16) (3.17) (3.69) (2.82) (3.08)Large Minus Smal -0.19 -0.07 0.34 -0.40 -0.10 -0.11 -0.17 -0.13 -0.36 9
(-4.30) (-2.98) (5.55) (-4.35) (-3.98) (-3.89) (-6.69) (-6.24) (-8.38)Value Minus Grow -0.08 0.23 -0.04 -0.03 -0.08 -0.21 0.08 -0.05 8
(-2.09) (4.59) (-2.29) (-2.10) (-1.71) (-5.76) (1.47) (-2.35)LIBOR -1.09 2.26 -2.02 3
(-1.93) (2.16) (-3.55)Credit Spread 0.20 0.14 0.09 3
(2.26) (1.68) (1.42)Term Spread -0.20 -0.65 0.89 -0.24 -0.20 -0.31 -0.38 7
(-1.99) (-3.26) (2.66) (-3.86) (-2.14) (-4.51) (-2.69)VIX 0.08 0.22 0.07 0.12 4
(2.37) (1.69) (2.80) (2.11)Number of FactorsSelected:
Risk models for monthly CSFB/Tremont hedge-fund index returns, from January 1994 to August 2004.
10 10 8 8 4 13 11 7 4 66 12 7 9
Benchmark and Style Regressions for monthly CSFB/Tremont hedge fund index returns, (January 1994 – August 2004)

45
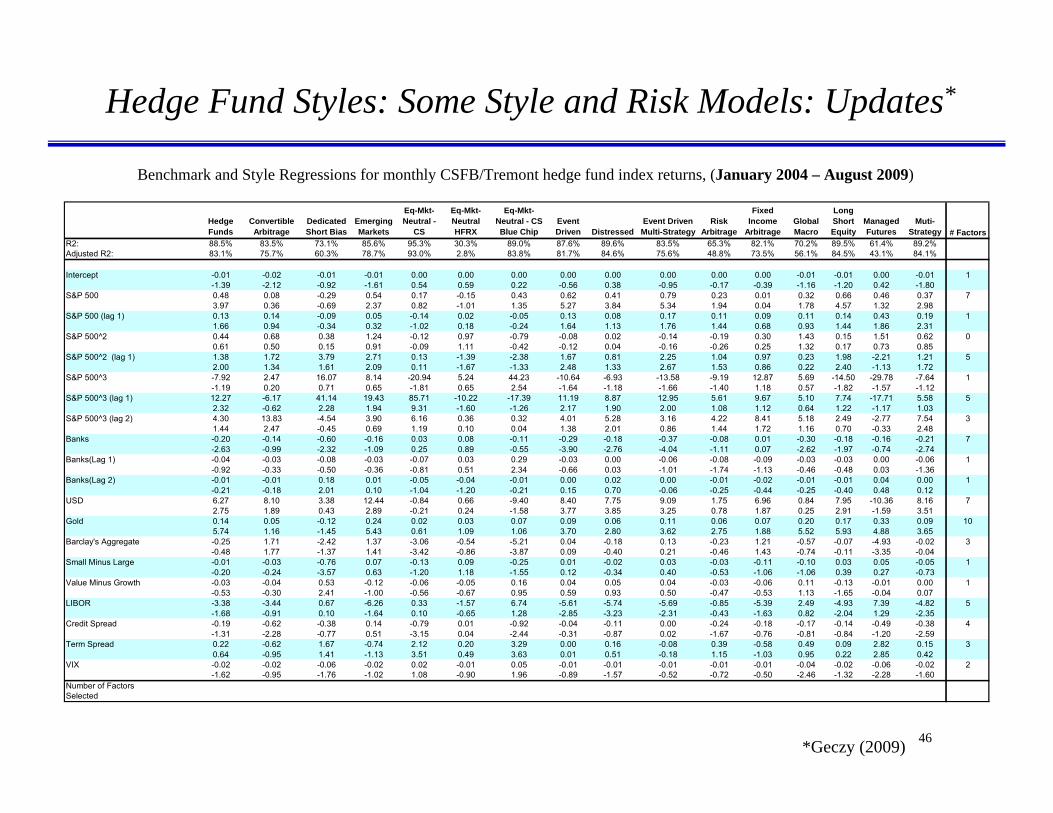
Hedge Fund Styles: Some Style and Risk Models: Updates*
*Geczy (2009)
Hedge Convert Dedicated Event Emerging CST HF HFRX Equity CST Blue Chip Event Fixed Long FactorRegressor Funds Arb Shortseller Driven Distressed Markets Market Neutral Market Neutral Market Neutral Driven Risk Arb Income Global Short Managed Multi- Selection
Multi-strategy Arb Macro Equity Futures Strategy CountSample Size: 128 128 128 128 128 128 128 80 56 128 128 128 128 128 128 125Annualized Return: 10.7% 9.9% -2.2% 11.2% 13.2% 6.9% 10.4% 3.7% 6.5% 10.1% 8.0% 6.8% 14.0% 11.5% 5.9% 9.2%Annualized Volatility: 7.9% 7.3% 17.0% 6.1% 6.7% 15.7% 10.9% 3.9% 13.5% 6.5% 4.2% 6.1% 10.4% 10.1% 11.7% 5.5%
Intercept 0.00 0.00 0.00 0.01 0.01 0.02 0.00 0.00 0.00 0.01 0.00 0.00 0.00 0.00 0.00 0.00 160.44 -1.13 -0.14 2.70 2.90 1.54 0.75 -0.41 1.04 1.77 -1.20 2.18 0.63 -0.28 0.54 0.62
S&P 500 -0.11 -0.65 -0.12 0.15 4-2.30 -5.86 -2.22 2.09
S&P 500 (lag 1) 0
S&P 500^2 1.29 12.90
S&P 500^2 (lag 1) -1.97 -0.74 0.96 3-2.15 -1.95 1.99
S&P 500^3 25.29 22.54 19.15 26.71 11.40 54.80 4.62 2.96 4.71 2.50
S&P 500^3 (lag 1) 13.24 13.87 22.54 3.40
S&P 500^3 (lag 2) 16.11 13.42 16.55 30.55 13.54 53.56 4.71 7.41 3.80 4.10
Banks 0.15 0.07 0.38 0.09 0.09 0.24 0.19 72.48 1.96 2.63 2.24 2.75 2.21 3.51
Banks(Lag 1) 0.08 11.95
USD 1.54 2.25 2.53 32.65 3.07 3.81
Gold 0
Barclay's Aggregate 1.15 0.78 1.03 0.96 43.02 2.19 2.19 3.22
Small Minus Large 0.14 0.09 -0.46 0.14 0.13 0.38 0.15 0.13 0.27 92.61 2.78 -6.08 4.37 3.20 2.99 4.13 4.61 5.78
Value Minus Growth -0.18 0.23 -0.23 -0.37 4-4.18 3.71 -2.18 -9.40
Term Spread -0.59 -0.48 1.63 3-2.38 -2.49 2.13
VIX 0
Number of FactorsSelected 5 9 5 6 4 4 2 4 2 4 5 5 3 5 2 2
Benchmark and Style Regressions for monthly CSFB/Tremont hedge fund index returns, (January 1994 – August 2009)
46
Hedge Fund Styles: Some Style and Risk Models: Updates*
*Geczy (2009)
Benchmark and Style Regressions for monthly CSFB/Tremont hedge fund index returns, (January 2004 – August 2009)
Hedge Funds
Convertible Arbitrage
Dedicated Short Bias
Emerging Markets
Eq-Mkt-Neutral -
CS
Eq-Mkt-Neutral HFRX
Eq-Mkt-Neutral - CS Blue Chip
Event Driven Distressed
Event Driven Multi-Strategy
Risk Arbitrage
Fixed Income
ArbitrageGlobal Macro
Long Short Equity
Managed Futures
Muti-Strategy # Factors
R2: 88.5% 83.5% 73.1% 85.6% 95.3% 30.3% 89.0% 87.6% 89.6% 83.5% 65.3% 82.1% 70.2% 89.5% 61.4% 89.2%Adjusted R2: 83.1% 75.7% 60.3% 78.7% 93.0% 2.8% 83.8% 81.7% 84.6% 75.6% 48.8% 73.5% 56.1% 84.5% 43.1% 84.1%
Intercept -0.01 -0.02 -0.01 -0.01 0.00 0.00 0.00 0.00 0.00 0.00 0.00 0.00 -0.01 -0.01 0.00 -0.01 1-1.39 -2.12 -0.92 -1.61 0.54 0.59 0.22 -0.56 0.38 -0.95 -0.17 -0.39 -1.16 -1.20 0.42 -1.80
S&P 500 0.48 0.08 -0.29 0.54 0.17 -0.15 0.43 0.62 0.41 0.79 0.23 0.01 0.32 0.66 0.46 0.37 73.97 0.36 -0.69 2.37 0.82 -1.01 1.35 5.27 3.84 5.34 1.94 0.04 1.78 4.57 1.32 2.98
S&P 500 (lag 1) 0.13 0.14 -0.09 0.05 -0.14 0.02 -0.05 0.13 0.08 0.17 0.11 0.09 0.11 0.14 0.43 0.19 11.66 0.94 -0.34 0.32 -1.02 0.18 -0.24 1.64 1.13 1.76 1.44 0.68 0.93 1.44 1.86 2.31
S&P 500^2 0.44 0.68 0.38 1.24 -0.12 0.97 -0.79 -0.08 0.02 -0.14 -0.19 0.30 1.43 0.15 1.51 0.62 00.61 0.50 0.15 0.91 -0.09 1.11 -0.42 -0.12 0.04 -0.16 -0.26 0.25 1.32 0.17 0.73 0.85
S&P 500^2 (lag 1) 1.38 1.72 3.79 2.71 0.13 -1.39 -2.38 1.67 0.81 2.25 1.04 0.97 0.23 1.98 -2.21 1.21 52.00 1.34 1.61 2.09 0.11 -1.67 -1.33 2.48 1.33 2.67 1.53 0.86 0.22 2.40 -1.13 1.72
S&P 500^3 -7.92 2.47 16.07 8.14 -20.94 5.24 44.23 -10.64 -6.93 -13.58 -9.19 12.87 5.69 -14.50 -29.78 -7.64 1-1.19 0.20 0.71 0.65 -1.81 0.65 2.54 -1.64 -1.18 -1.66 -1.40 1.18 0.57 -1.82 -1.57 -1.12
S&P 500^3 (lag 1) 12.27 -6.17 41.14 19.43 85.71 -10.22 -17.39 11.19 8.87 12.95 5.61 9.67 5.10 7.74 -17.71 5.58 52.32 -0.62 2.28 1.94 9.31 -1.60 -1.26 2.17 1.90 2.00 1.08 1.12 0.64 1.22 -1.17 1.03
S&P 500^3 (lag 2) 4.30 13.83 -4.54 3.90 6.16 0.36 0.32 4.01 5.28 3.16 4.22 8.41 5.18 2.49 -2.77 7.54 31.44 2.47 -0.45 0.69 1.19 0.10 0.04 1.38 2.01 0.86 1.44 1.72 1.16 0.70 -0.33 2.48
Banks -0.20 -0.14 -0.60 -0.16 0.03 0.08 -0.11 -0.29 -0.18 -0.37 -0.08 0.01 -0.30 -0.18 -0.16 -0.21 7-2.63 -0.99 -2.32 -1.09 0.25 0.89 -0.55 -3.90 -2.76 -4.04 -1.11 0.07 -2.62 -1.97 -0.74 -2.74
Banks(Lag 1) -0.04 -0.03 -0.08 -0.03 -0.07 0.03 0.29 -0.03 0.00 -0.06 -0.08 -0.09 -0.03 -0.03 0.00 -0.06 1-0.92 -0.33 -0.50 -0.36 -0.81 0.51 2.34 -0.66 0.03 -1.01 -1.74 -1.13 -0.46 -0.48 0.03 -1.36
Banks(Lag 2) -0.01 -0.01 0.18 0.01 -0.05 -0.04 -0.01 0.00 0.02 0.00 -0.01 -0.02 -0.01 -0.01 0.04 0.00 1-0.21 -0.18 2.01 0.10 -1.04 -1.20 -0.21 0.15 0.70 -0.06 -0.25 -0.44 -0.25 -0.40 0.48 0.12
USD 6.27 8.10 3.38 12.44 -0.84 0.66 -9.40 8.40 7.75 9.09 1.75 6.96 0.84 7.95 -10.36 8.16 72.75 1.89 0.43 2.89 -0.21 0.24 -1.58 3.77 3.85 3.25 0.78 1.87 0.25 2.91 -1.59 3.51
Gold 0.14 0.05 -0.12 0.24 0.02 0.03 0.07 0.09 0.06 0.11 0.06 0.07 0.20 0.17 0.33 0.09 105.74 1.16 -1.45 5.43 0.61 1.09 1.06 3.70 2.80 3.62 2.75 1.88 5.52 5.93 4.88 3.65
Barclay's Aggregate -0.25 1.71 -2.42 1.37 -3.06 -0.54 -5.21 0.04 -0.18 0.13 -0.23 1.21 -0.57 -0.07 -4.93 -0.02 3-0.48 1.77 -1.37 1.41 -3.42 -0.86 -3.87 0.09 -0.40 0.21 -0.46 1.43 -0.74 -0.11 -3.35 -0.04
Small Minus Large -0.01 -0.03 -0.76 0.07 -0.13 0.09 -0.25 0.01 -0.02 0.03 -0.03 -0.11 -0.10 0.03 0.05 -0.05 1-0.20 -0.24 -3.57 0.63 -1.20 1.18 -1.55 0.12 -0.34 0.40 -0.53 -1.06 -1.06 0.39 0.27 -0.73
Value Minus Growth -0.03 -0.04 0.53 -0.12 -0.06 -0.05 0.16 0.04 0.05 0.04 -0.03 -0.06 0.11 -0.13 -0.01 0.00 1-0.53 -0.30 2.41 -1.00 -0.56 -0.67 0.95 0.59 0.93 0.50 -0.47 -0.53 1.13 -1.65 -0.04 0.07
LIBOR -3.38 -3.44 0.67 -6.26 0.33 -1.57 6.74 -5.61 -5.74 -5.69 -0.85 -5.39 2.49 -4.93 7.39 -4.82 5-1.68 -0.91 0.10 -1.64 0.10 -0.65 1.28 -2.85 -3.23 -2.31 -0.43 -1.63 0.82 -2.04 1.29 -2.35
Credit Spread -0.19 -0.62 -0.38 0.14 -0.79 0.01 -0.92 -0.04 -0.11 0.00 -0.24 -0.18 -0.17 -0.14 -0.49 -0.38 4-1.31 -2.28 -0.77 0.51 -3.15 0.04 -2.44 -0.31 -0.87 0.02 -1.67 -0.76 -0.81 -0.84 -1.20 -2.59
Term Spread 0.22 -0.62 1.67 -0.74 2.12 0.20 3.29 0.00 0.16 -0.08 0.39 -0.58 0.49 0.09 2.82 0.15 30.64 -0.95 1.41 -1.13 3.51 0.49 3.63 0.01 0.51 -0.18 1.15 -1.03 0.95 0.22 2.85 0.42
VIX -0.02 -0.02 -0.06 -0.02 0.02 -0.01 0.05 -0.01 -0.01 -0.01 -0.01 -0.01 -0.04 -0.02 -0.06 -0.02 2-1.62 -0.95 -1.76 -1.02 1.08 -0.90 1.96 -0.89 -1.57 -0.52 -0.72 -0.50 -2.46 -1.32 -2.28 -1.60
Number of FactorsSelected

47
Hedge Fund ReplicationHedge Fund Replication
– Attempt to replication hedge fund returns or return distributions• Target funds of funds, hedge fund aggregate return indexes, or sub-indexes
– Three generally approaches• Factor-based
– Typically based on style or factor analysis related techniques
» Can be shockingly simple (5-factor style analysis) or more sophisticated (Kalman filtering or high-dimensioned variable selection)
• Distribution-based– Attempt to mimic the unconditional or even conditional distributions of hedge fund
returns subject to desired constraints
• Passive strategy-based– Trade underlying strategies passively or track hedge fund holdings (obviously may
not be exclusive with above)
– Position-based tracking (e.g., AlphaClone; www.alphaclone.com)
© 2009 Christopher C. Geczy where applicable - Do Not Reproduce Without Permission

48
Hedge Fund ReplicationHedge Fund Replication• Pros:
– Diversification: Hedge fund replicator returns may correlate with risks or benchmarks not represented in an investor portfolio at a desired level, thereby providing systematic diversification benefits.
– Return Profile and Customization: Replicators may be engineered to try to attain customized return distribution characteristics (e.g., non-negative skewness while having low correlation with U.S. market returns).
– Liquidity: Since replicators may trade liquid underlying securities or contracts, investors might be able to get in or out of the product faster and with fewer restrictions than hedge funds.
– Cost and Lower Minimums: Current replicator products seem to charge annual fees of 100 basis points or less with lower minimums
– Transparency: Some replicators disclose the underlying securities traded, allowing investors to judge inherent liquidity, credit quality and other asset characteristics.
– Benchmarking Facilitated: If replicators offer feasible, cheap passive beta, then they may represent useful benchmarks against which to judge managers who strive to produce alpha.
– Structured Vehicle: Unlike some hedge fund or hedge fund strategies, some replicators’ products may be offered via structures that offer capital protection, leverage and so on.
– “Equitization”: Hedge fund clones may provide short-term, liquid hedge fund exposure as investors go through the process of manager selection, providing an option to those who do not want to keep assets in cash or other forms while searching for managers.
– “Manager Risk” may be Mitigated: (Including “headline risk”) and require less need for manager selection and monitoring.
– Fewer Capacity Problems: May arise
– To date, actual, out of sample performance has proven interesting…© 2009 Christopher C. Geczy where applicable - Do Not Reproduce Without Permission

49
Hedge Fund Replication
Hedge Fund Replication• Cons:
– “Backward Looking”: Factor-based techniques in particular may necessarily be “backward looking” in that they use past data to estimate the desired mimicking weights, and may therefore lag hedge fund managers as they trade risk dynamically.
– May be Suboptimal, ex ante: Even if tracking error is low, the target index may itself not represent an optimal weighting of underlying exposures or may not optimally diversify an investor
– Benchmarks Bias: Some critics have suggested that all hedge fund indexes are by their very natures biased representatives of hedge funds due to selection, survivorship, reporting and other biases.
– May Miss Important Factors or have Unacceptable Tracking Error: Hedge fund clones are only as good as the underlying trades or positions identified to replicate the desired return patterns, which may be incomplete.
– Other Techniques: Some techniques require the tradability of the investor’s portfolio, which itself may contain illiquid assets and therefore misestimate the exposures or correlations
– Tracking may Require Market or Common Beta Exposure
– Complicated Underlying Distributions: Whether and how hedge fund trackers address this common effectremains to be seen.
© 2009 Christopher C. Geczy where applicable - Do Not Reproduce Without Permission
50
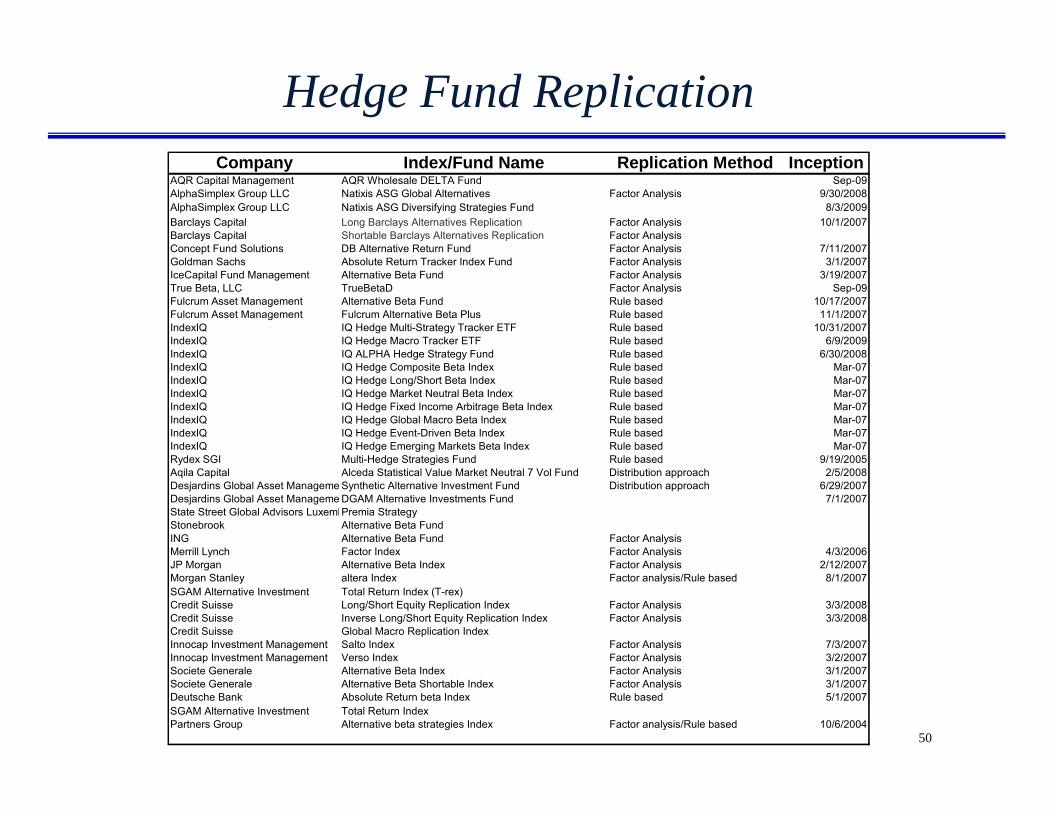
Hedge Fund ReplicationCompany Index/Fund Name Replication Method Inception
AQR Capital Management AQR Wholesale DELTA Fund Sep-09AlphaSimplex Group LLC Natixis ASG Global Alternatives Factor Analysis 9/30/2008AlphaSimplex Group LLC Natixis ASG Diversifying Strategies Fund 8/3/2009Barclays Capital Long Barclays Alternatives Replication Factor Analysis 10/1/2007Barclays Capital Shortable Barclays Alternatives Replication Factor AnalysisConcept Fund Solutions DB Alternative Return Fund Factor Analysis 7/11/2007Goldman Sachs Absolute Return Tracker Index Fund Factor Analysis 3/1/2007IceCapital Fund Management Alternative Beta Fund Factor Analysis 3/19/2007True Beta, LLC TrueBetaD Factor Analysis Sep-09Fulcrum Asset Management Alternative Beta Fund Rule based 10/17/2007Fulcrum Asset Management Fulcrum Alternative Beta Plus Rule based 11/1/2007IndexIQ IQ Hedge Multi-Strategy Tracker ETF Rule based 10/31/2007IndexIQ IQ Hedge Macro Tracker ETF Rule based 6/9/2009IndexIQ IQ ALPHA Hedge Strategy Fund Rule based 6/30/2008IndexIQ IQ Hedge Composite Beta Index Rule based Mar-07IndexIQ IQ Hedge Long/Short Beta Index Rule based Mar-07IndexIQ IQ Hedge Market Neutral Beta Index Rule based Mar-07IndexIQ IQ Hedge Fixed Income Arbitrage Beta Index Rule based Mar-07IndexIQ IQ Hedge Global Macro Beta Index Rule based Mar-07IndexIQ IQ Hedge Event-Driven Beta Index Rule based Mar-07IndexIQ IQ Hedge Emerging Markets Beta Index Rule based Mar-07Rydex SGI Multi-Hedge Strategies Fund Rule based 9/19/2005Aqila Capital Alceda Statistical Value Market Neutral 7 Vol Fund Distribution approach 2/5/2008Desjardins Global Asset Manageme Synthetic Alternative Investment Fund Distribution approach 6/29/2007Desjardins Global Asset Manageme DGAM Alternative Investments Fund 7/1/2007State Street Global Advisors LuxembPremia StrategyStonebrook Alternative Beta FundING Alternative Beta Fund Factor AnalysisMerrill Lynch Factor Index Factor Analysis 4/3/2006JP Morgan Alternative Beta Index Factor Analysis 2/12/2007Morgan Stanley altera Index Factor analysis/Rule based 8/1/2007SGAM Alternative Investment Total Return Index (T-rex)Credit Suisse Long/Short Equity Replication Index Factor Analysis 3/3/2008Credit Suisse Inverse Long/Short Equity Replication Index Factor Analysis 3/3/2008Credit Suisse Global Macro Replication IndexInnocap Investment Management Salto Index Factor Analysis 7/3/2007Innocap Investment Management Verso Index Factor Analysis 3/2/2007Societe Generale Alternative Beta Index Factor Analysis 3/1/2007Societe Generale Alternative Beta Shortable Index Factor Analysis 3/1/2007Deutsche Bank Absolute Return beta Index Rule based 5/1/2007SGAM Alternative Investment Total Return Index Partners Group Alternative beta strategies Index Factor analysis/Rule based 10/6/2004

51
Hedge Fund Replication
June 2008 - August 2009 Beta vs. CST HF Index Alpha vs. CST HF (%) Std Dev (%) Skewness Kurtosis Mean (Annualized)Goldman Sachs Absolute Return Tracker Index Fund 0.47 -2.16 9.12 -0.09 -0.21 -5.76%Merrill Lynch Factor Model* 0.86 6.03 11.51 0.05 -0.63 -5.15%Rydex SGI Multi-Hedge Strategies Fund 0.49 -11.5 12.62 -1.45 2.79 -14.96%Credit Suisse Global Macro Replication Index 0.48 -1.47 7.21 -0.4 1.68 -5.17%Credit Suisse Inverse Global Macro Replication Index -0.52 -0.74 7.71 0.51 1.52 3.45%Credit Suisse Long/Short Equity Replication Index 0.88 1.92 11.09 -0.9 0.70 -5.02%Credit Suisse Inverse Long/Short Equity Replication Index -0.87 -5.59 11.01 0.81 0.41 1.22%
Hedge Fund Tracker Performance Sample
Name Inception Obs Mean St Dev Skewness Kurtosis TracksNatixis ASG Global Alternatives Oct-08 12 0.65 1.60 -1.09 2.92 n/aNatixis ASG Diversifying Strategies Fund Aug-09 2 1.08 2.07 n/aGoldman Sachs Absolute Return Tracker Index Fund Jun-08 16 -0.46 2.55 -0.13 -0.01 GS Absolute Return Beta IndexIQ QAI Apr-09 6 1.05 1.42 0.21 -2.40 IQ Hedge Multi-Strategy IndexIQ MCRO Jun-09 4 1.30 2.18 -1.20 0.86 IQ Hedge Macro IndexIQ Alpha Hedge Strategy Jun-09 4 1.89 2.65 -0.59 -2.65 IQ Alpha Hedge StrategyRydex SGI Multi-Hedge Strategies Fund Oct-05 48 -0.15 2.56 -2.03 6.54 n/aING Alternative Beta Dec-08 10 0.95 2.38 -0.03 -0.95 HFRI Fund Weighted Composite IndexML Factor Model Jan-03 78 0.51 1.83 -0.94 2.24 HFRI Fund Weighted Composite IndexSGAM T-Rex Oct-08 8 0.28 2.38 -0.62 -1.97 Hedge Fund Research IndexCS Global Macro Replication Index Jan-98 141 0.56 1.64 -0.72 1.63 CST Global Macro and Long/ShortCS Inverse Global Macro Replication Index Jan-98 141 -0.31 1.64 0.81 2.04 CST Global Macro and Long/ShortCS Long/Short Equity Replication Index Jan-98 141 0.73 3.22 0.24 2.82 CST Global Macro and Long/ShortCS Inverse Long/Short Equity Replication Index Jan-98 141 -0.44 3.14 0.12 2.28 CST Global Macro and Long/Short
Hedge Fund Tracker Performance

52
Hedge Fund Replication
QAI Holdings(June 15, 2009 - August 3, 2009)
0
10
20
30
40
50
60
70
80
90
100
6/15
/200
96/
16/2
009
6/17
/200
96/
18/2
009
6/19
/200
9 0
6/22
/200
9 0
6/23
/200
9 0
6/25
/200
9 0
6/29
/200
9 0
7/01
/200
9 0
7/02
/200
9
07/
06/2
009
07/
07/2
009
07/
08/2
009
7/9/
2009
7/10
/200
97/
13/2
009
7/15
/200
9
7/16
/200
97/
17/2
009
7/20
/200
97/
21/2
009
7/22
/200
97/
23/2
009
7/28
/200
9
7/29
/200
97/
30/2
009
7/31
/200
98/
3/20
09
Perc
ent
POWERSHARES DB COMMODITY IND
SPDR SERIES TRUST BARCLAYS
POWERSHARES EMERGING MARKETS S
ISHARES JPMORGAN USD EMERGING
PROSHARES ULTRASHORT REAL ES
PROSHARES ULTRASHORT S&P500
SPDR BARCLAYS CAPITAL HIGH
SPDR BARCLAYS CAPITAL 1-3 MO
SPDR LEHMAN INTERNATIONAL TREA
VANGUARD TOTAL BOND MARKET ETF
ISHARES LEHMAN TREASURY INFLAT
PROSHARES ULTRASHORT MSCI EA
ISHARES IBOXX $ HIGH YIELD COR
VANGUARD SHORT-TERM BOND ETF
PROSHARES ULTRASHORT RUSSELL2000ISHARES BARCLAYS SHORT TREAS
POWERSHARES DB G10 CURRENCY
ISHARES BARCLAYS AGGREGATE
VANGUARD EMERGING MARKETS ETF
ISHARES BARCLAYS 1-3 YEAR TR

53
Hedge Fund Replication
Another Example: The Merrill Lynch Factor Model
ML Factor Model Component
August 2009
WeightSeptember
2009 Weight
S&P 500 -11.20% -8.00%
Russell 2000 -1.80% -4.20%
MSCI EAFE 15.30% 11.30%
MSCI Emerging Markets 24.00% 26.70%
US Dollar Index 17.80% 16.90%
BBA Libor USD 1 Month 73.70% 74.20%

54
Hedge Fund Replication
Another Example: The Merrill Lynch Factor Model

55
Hedge Fund Replication
Another Example: The Merrill Lynch Factor Model

56
Year
Return on 60/40
portfolio
Institutional Investor Return
Cash or money market
accounts StocksPrivate equities Hedge funds
Venture capital
Bonds or other fixed
income investments Real estate
Other investments
2008 -20.10% -17.40% 10.00% 62.00% 0.00% 0.00% 0.00% 28.00% 0.00% 0.00%2007 6.08% 17.30% 4.00% 74.00% 0.00% 0.00% 0.00% 22.00% 0.00% 0.00%2006 11.21% 5.20% 2.90% 71.40% 0.00% 0.00% 0.00% 25.70% 0.00% 0.00%2005 3.92% 6.70% 11.00% 62.00% 0.00% 0.00% 0.00% 27.00% 0.00% 0.00%2004 8.26% 16.30% 5.00% 67.00% 0.00% 0.00% 0.00% 28.00% 0.00% 0.00%
Institutional Investor Asset Class AllocationsInstitutional Investor Asset AllocationReturns
Hedge Fund Replication
Allocations of an Anonymous (Traditionally Allocated) Institution

57
Return (Ann.) Std Dev (Ann.) Downside Risk Market Beta Sharpe Ratio Worst Month Worst 12-MonthsHF tracker 5.56 6.91 5.35 0.39 0.37 -6.39 -16.1Institutional Investor 0.83 11.02 8.72 0.71 -0.21 -10.25 -27.4Institutional Investor + 15% reallocation to HF tracker 1.56 10.26 8.13 0.64 -0.14 -9.63 -25.5
Institutional Investor Historical Performance with and without a Hedge Fund Tracker
Hedge Fund Replication
Ex Post Performance of an Anonymous (Traditionally Allocated) InstitutionWith and without a Hedge Fund Tracker Allocation (2003-2009)
15% to Tracker, pro rata

58
Hedge Fund ReplicationImplications of Hedge Fund Replication
– Democratization of hedge funds
– Replication of vanilla risk exposures (simple betas) at potentially higher fees
– An explosion of alternatives and a lower signal to noise ratio
– If beta-oriented hedge fund replicators “add value” or augment the span of the investment opportunity set, then one obvious possibility is simply that vanilla asset allocation as been flawed to date
• Tactical, conditional allocation models?
• Or without hedge funds, simply less diversified?
© 2009 Christopher C. Geczy where applicable - Do Not Reproduce Without Permission
59
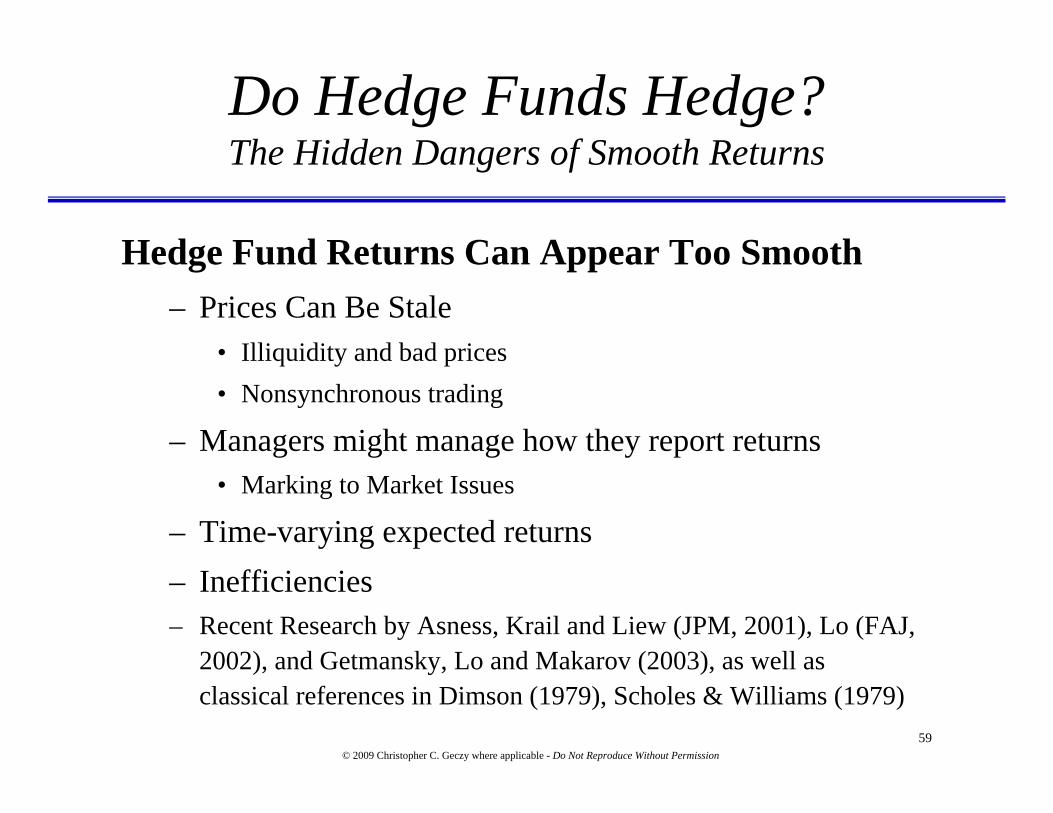
Do Hedge Funds Hedge?The Hidden Dangers of Smooth Returns
Hedge Fund Returns Can Appear Too Smooth– Prices Can Be Stale
• Illiquidity and bad prices• Nonsynchronous trading
– Managers might manage how they report returns• Marking to Market Issues
– Time-varying expected returns– Inefficiencies– Recent Research by Asness, Krail and Liew (JPM, 2001), Lo (FAJ,
2002), and Getmansky, Lo and Makarov (2003), as well as classical references in Dimson (1979), Scholes & Williams (1979)
© 2009 Christopher C. Geczy where applicable - Do Not Reproduce Without Permission

60
S&P 500Liquid SecurityIlliquid Security“Smoothed” Security
MonthT T+1 T+2 T+3
-20% 0% 0% 0%-20% 0% 0% 0%
0% 0% 0% -20%-8% -6% -4% -2%
Problems with Hedge Fund Performance Records
Why “smoothed?” Many hedge funds trade illiquid securities:
• Illiquid securities can bias the type of analysis from the previous page
• And possibly worse…
Illiquid securities will make hedge funds look less correlated to the market and thus bias betas towards zero.
We can adjust for this effect by matching up T+N returns of the smoothed security with market exposures in the past…use “lagged” betas.
© 2009 Christopher C. Geczy where applicable - Do Not Reproduce Without Permission

61
Problems with Illiquid Performance Records
Source: Geczy, O’Conner and Proskine (Wharton, 2009)

62
Problems with Illiquid Performance Records
Source: Geczy, O’Conner and Proskine (Wharton, 2009)
Table Footnotes:

63
SFAS 157 and Mark to Market Rules
SFAS 157 and Valuation Rule Changes– In the U.S., Statement of Financial Accounting Standards 157 governs the principles of fair
valuation and the rules about when marking to market of illiquid assets is appropriate.• Requires all publicly-traded companies in the U.S. to classify their assets based on the certainty with
which fair values can be calculated
• Created a hierarchy of three asset categories: Level 1, Level 2 and Level 3. – Level 1 - the value of these assets are observable and reflect quoted prices for identical assets or liabilities in
active markets that the reporting entity has access to on the measurement date
– Level 2 -the assets are valued through means other than quoted prices for identical assets or liabilities in active markets that are observable by the reporting entity on the measurement date
– Level 3 -the value of these assets is based on the reporting entity’s own assumptions regarding the assumptions market participants would use in valuing the asset or liability.
• SFAS 157 was passed to help investors and regulators understand how accurate a given company's asset estimates truly were. Investors are able to see what percentage of the balance sheet could be open to revaluation or susceptible to sudden write-downs
© 2009 Christopher C. Geczy where applicable - Do Not Reproduce Without Permission

64
SFAS 157 Timeline
• SFAS 157 to take effect for fiscal years beginning November 15, 2007
• However…– January 24, 2008: The National Association of Realtors (NAR) announced that 2007 had the largest drop in existing
home sales in 25 years
– March 16, 2008: Bear Stearns acquired for $2 a share by JPMorgan Chase in a fire sale avoiding bankruptcy
– September 7, 2008: Federal takeover of Fannie Mae and Freddie Mac, which at that point owned or guaranteed about half of the U.S.'s $12 trillion mortgage market
– September 15, 2008: Lehman Brothers filed for bankruptcy protection.
• September 30, 2008: SEC and the FASB issued a joint clarification regarding the implementation of fair value accounting in cases where a market is disorderly or inactive. They explain that forced liquidations are not indicative of fair value, as this is not an "orderly" transaction.
• April 9, 2009: FASB released the official update to FASB 157, which eases the mark-to-market rules when the market is unsteady or inactive
65
Implications for Hedge Funds
• FASB 157 will have significant impact on the respective controls and procedures related to the summary and documentation of the valuation process
• The standard provides more transparency to investors about the types of securities the fund is invested in, as well as the portion of the fund’s performance derived from Level 3 securities.
• Funds will need to designate all securities into the three levels and provide detailed activity of profit and loss and related movement into and out of the Level 3 investments
• Tracking systems may need to be designed to mirror the disclosure requirements of this statement while providing a trail for the funds management and auditors to review
• Management will need to continually monitor the fund’s front- and back-office accounting systems that will be used to track and produce data.
• Management needs to understand the content and format of the financial statement disclosures up front.
• Management will need to understand the nature and content of the services provided by the third party pricing services regarding valuation information
• Will marks be closer to market?

66
SFAS 157 and Valuation Rule Changes– Regression with dummy variables indicating the required adoption of
SFAS 157 (third quarter, 2008)
– An simple, extended market model:
SFAS 157 and Mark to Market Rules
© 2009 Christopher C. Geczy where applicable - Do Not Reproduce Without Permission
,2 157
,1 500 ,2 157 500
,3 500, 1 ,4 157 500, 1
( ) [ ( )]( ) [ ( )]
HF TB HF HF SFAS
HF SP TB HF SFAS SP TB
HF SP t TB HF SFAS SP t TB HF
R R DR R D R RR R D R R
α α
β β
β β ε− −
− = +
+ − + −
+ − + − +
157
50
Where is a hedge fund index is the return on the 1-month treasury bill is an indicator variable for the adoption of SFAS 157 (3rd Quarter, 2008)
HF
TB
SFAS
SP
RRDR 0
500, 1
is the S&P500 total return index and is the S&P500 lagged on monthSP tR −

67
SFAS 157 and Mark to Market Rules
SFAS 157 and Valuation Rule Changes– Regression with dummy variables indicating the required adoption of
SFAS 157 (third quarter, 2008)
© 2009 Christopher C. Geczy where applicable - Do Not Reproduce Without Permission
Hedge Convert Dedicated Event Emerging CST HF HFRX Equity CST Blue Chip Event Fixed Long FactorRegressor Funds Arb Shortseller Driven Distressed Markets Market Neutral Market Neutral Market Neutral Driven Risk Arb Income Global Short Managed Multi- Selection
Multi-strategy Arb Macro Equity Futures Strategy CountSample Size: 188 188 188 188 188 188 188 140 116 188 188 188 188 188 188 188R2: 38.1% 35.1% 60.5% 51.9% 55.3% 49.2% 41.7% 4.7% 69.7% 41.5% 29.1% 49.6% 16.5% 31.3% 6.5% 46.4%Adjusted R2: 35.2% 32.1% 58.7% 49.7% 53.3% 46.9% 39.0% 0.3% 68.3% 38.9% 25.9% 47.3% 12.7% 28.1% 2.3% 43.9%
Intercept 0.01 0.01 0.00 0.01 0.01 0.01 0.01 0.00 0.00 0.01 0.00 0.00 0.01 0.01 0.01 0.01 144.65 3.14 0.83 7.30 7.39 3.96 2.34 2.09 1.75 6.28 5.21 2.90 6.97 2.67 2.29 5.74
Booleans -0.01 0.00 -0.02 -0.01 -0.01 -0.01 -0.02 -0.01 -0.03 -0.01 0.00 -0.01 -0.02 -0.01 -0.01 -0.01 7-2.14 0.21 -2.36 -2.56 -3.03 -1.73 -2.17 -1.66 -4.84 -1.98 -0.95 -1.26 -3.20 -1.17 -1.28 -1.99
S&P 500 0.14 0.06 -0.89 0.15 0.15 0.41 0.03 -0.01 0.03 0.16 0.09 0.01 -0.02 0.26 -0.16 0.11 93.96 1.12 -11.93 5.63 5.40 7.06 0.33 -0.47 0.64 4.94 4.02 0.34 -0.51 4.78 -1.94 3.66
(S&P 500 * Booleans) 0.11 0.38 0.44 0.05 0.05 0.11 0.11 0.00 1.02 0.04 0.06 0.41 0.19 0.09 0.01 0.12 61.62 4.20 3.19 0.97 1.03 1.06 0.80 0.09 10.20 0.73 1.30 6.36 2.60 0.88 0.08 2.15
S&P 500 [Lag 1] 0.02 0.07 -0.02 0.09 0.10 0.04 -0.01 -0.03 0.00 0.09 0.07 0.04 -0.06 0.03 -0.08 0.06 50.57 1.40 -0.31 3.43 3.51 0.62 -0.09 -1.00 0.06 2.77 2.85 1.10 -1.58 0.50 -0.90 2.09
(S&P 500 [Lag 1] * Booleans) 0.09 0.06 -0.08 0.04 0.08 0.03 0.75 -0.03 0.05 0.01 -0.10 0.07 0.02 0.00 0.04 0.10 21.37 0.71 -0.60 0.74 1.50 0.32 5.45 -0.61 0.48 0.25 -2.25 1.13 0.32 0.04 0.27 1.81
,2 157
,1 500 ,2 157 500
,3 500, 1 ,4 157 500, 1
( ) [ ( )]( ) [ ( )]
HF TB HF HF SFAS
HF SP TB HF SFAS SP TB
HF SP t TB HF SFAS SP t TB HF
R R DR R D R RR R D R R
α α
β β
β β ε− −
− = +
+ − + −
+ − + − +

68
Hedge Funds and Market Timing
• Hedge funds (and funds of funds) offer the potential to time market exposure (aka beta)– Ability to sell short– Ability to use leverage– Ability to ‘manage the balance sheet’ or net exposure– Ability to use derivatives
• It is often a selling point, for example, for equity L/S managers who do not fully hedge out market risk
• Can they actually do it?
• And what about horizon?
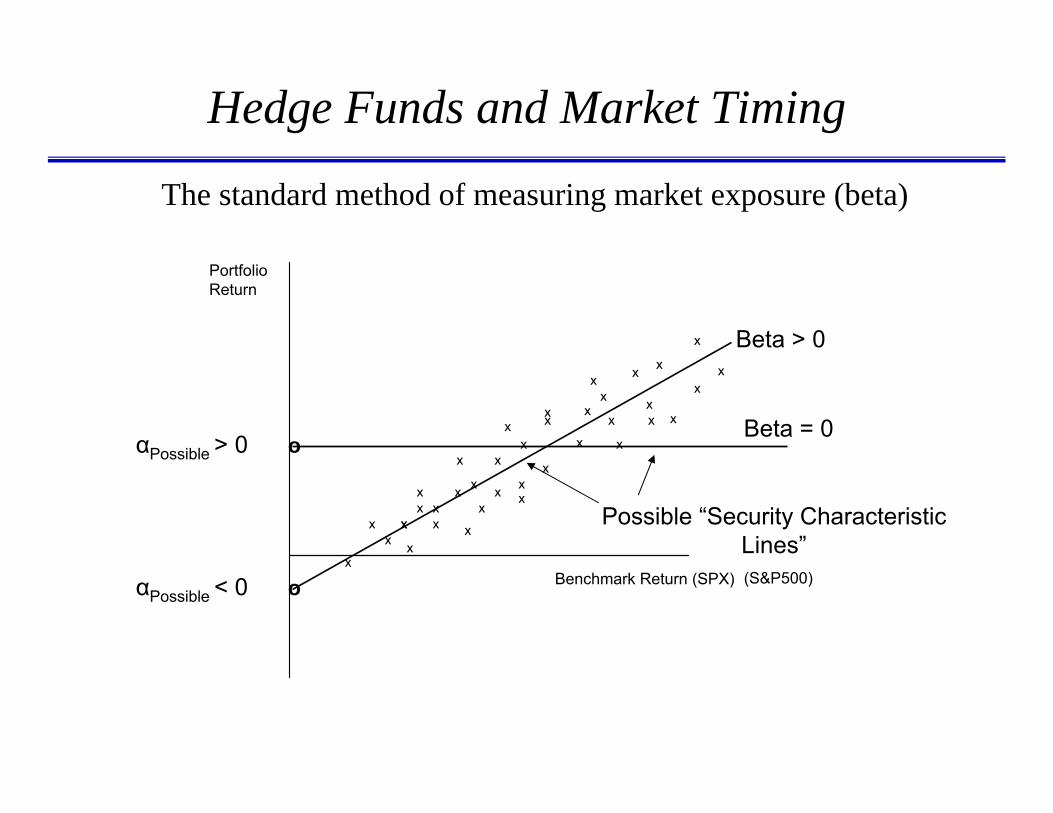
The standard method of measuring market exposure (beta)
Hedge Funds and Market Timing
Excess Return ofEfficient or Managed Portfolio
PortfolioExcessReturn
++
+
++
+
++
+
+
+ +
+
+ +
+
++
+
+
+
++
+
+
+
+
+
+
+
+
+
+ ++
+
++
+
++
+
+
++
+
+
+
Benchmark Return (SPX)
PortfolioReturn
αPossible < 0 o
xx
xxx x
x
xx
x
x
x x x
xx
xx
x
x
xx
x
x xx
x
x
x
xx
x
x
x
x
xx
x
Possible “Security Characteristic Lines”
αPossible > 0 oBeta = 0
Beta > 0
(S&P500)
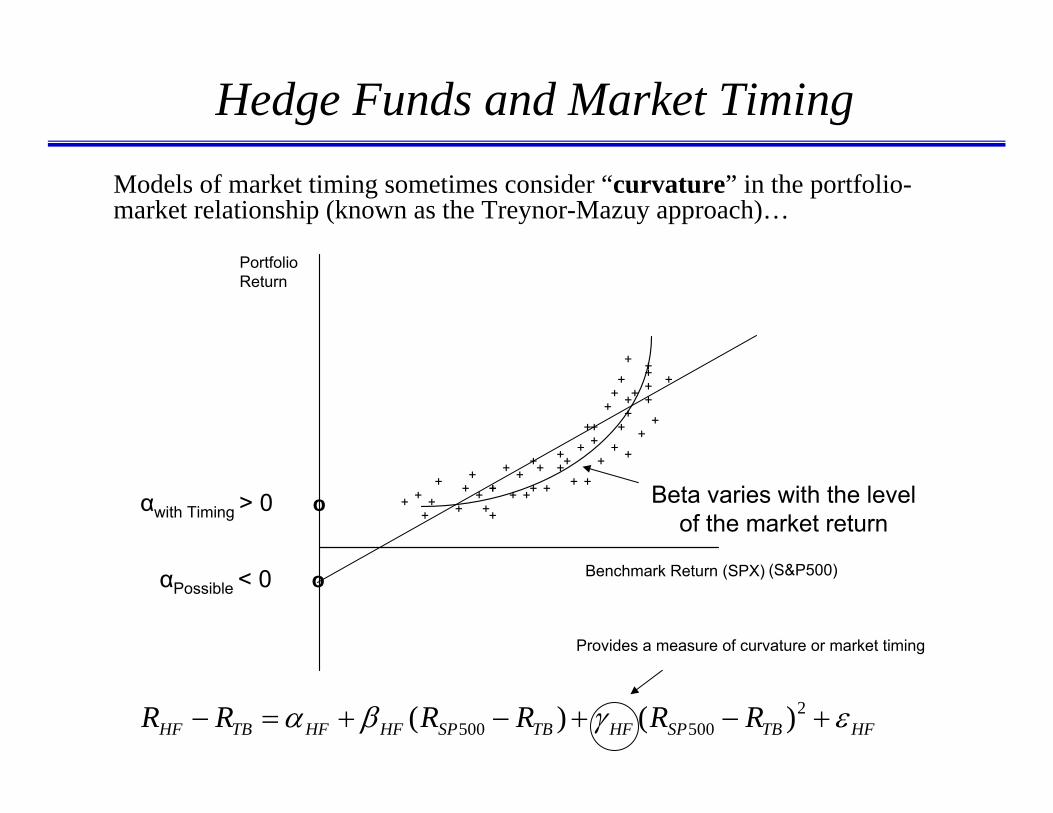
Hedge Funds and Market TimingModels of market timing sometimes consider “curvature” in the portfolio-market relationship (known as the Treynor-Mazuy approach)…
αPossible < 0 o
αwith Timing > 0 o Beta varies with the levelof the market return
Excess Return ofEfficient or Managed Portfolio
PortfolioExcessReturn
++
+
++
+
++
+
+
+ +
+
+ +
+
++
+
+
+
++
+
+
+
+
+
+
+
+
+
+ ++
+
++
+
++
+
+
++
+
+
+
Benchmark Return (SPX)
PortfolioReturn
(S&P500)
2500 500( ) ( )HF TB HF HF SP TB HF SP TB HFR R R R R Rα β γ ε− = + − + − +
Provides a measure of curvature or market timing

71
Hedge Funds and Market Timing

72
Hedge Funds and Market Timing
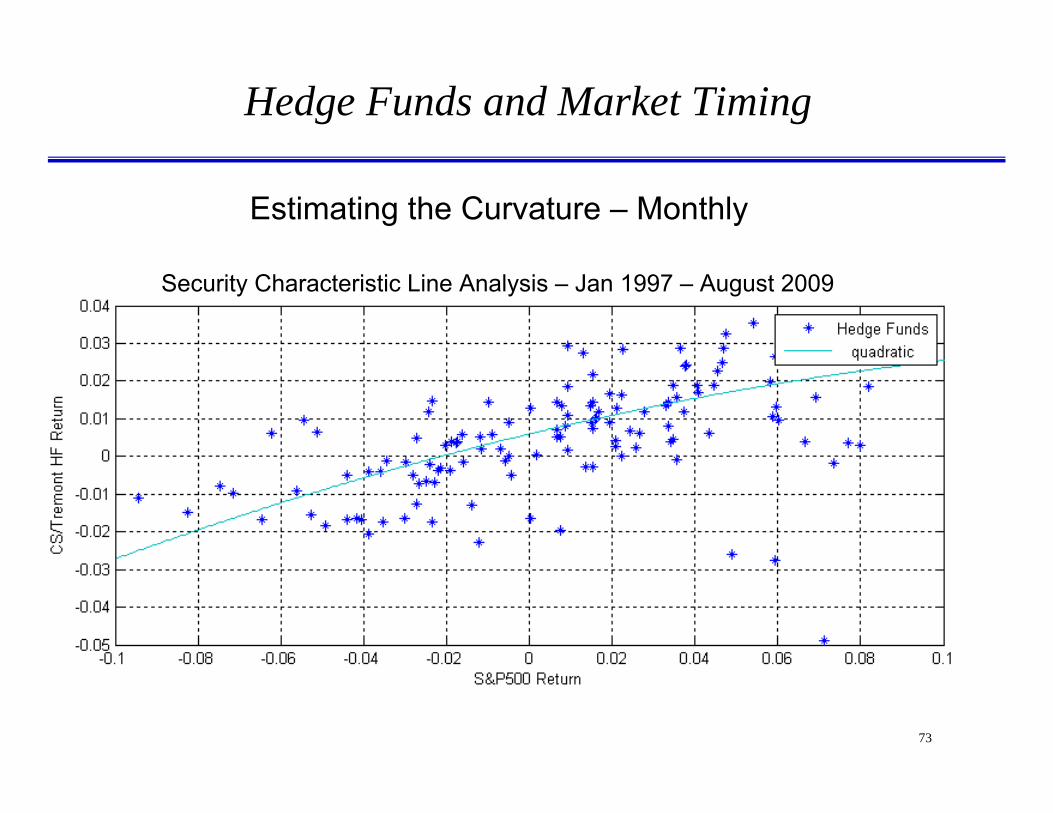
73
Estimating the Curvature – Monthly
Hedge Funds and Market Timing
Security Characteristic Line Analysis – Jan 1997 – August 2009

74
Estimating the Curvature – Quarterly
Hedge Funds and Market Timing
Security Characteristic Line Analysis – Jan 1997 – August 2009

75
Estimating the Curvature – Half-Yearly
Hedge Funds and Market Timing
Security Characteristic Line Analysis – Jan 1997 – August 2009
76
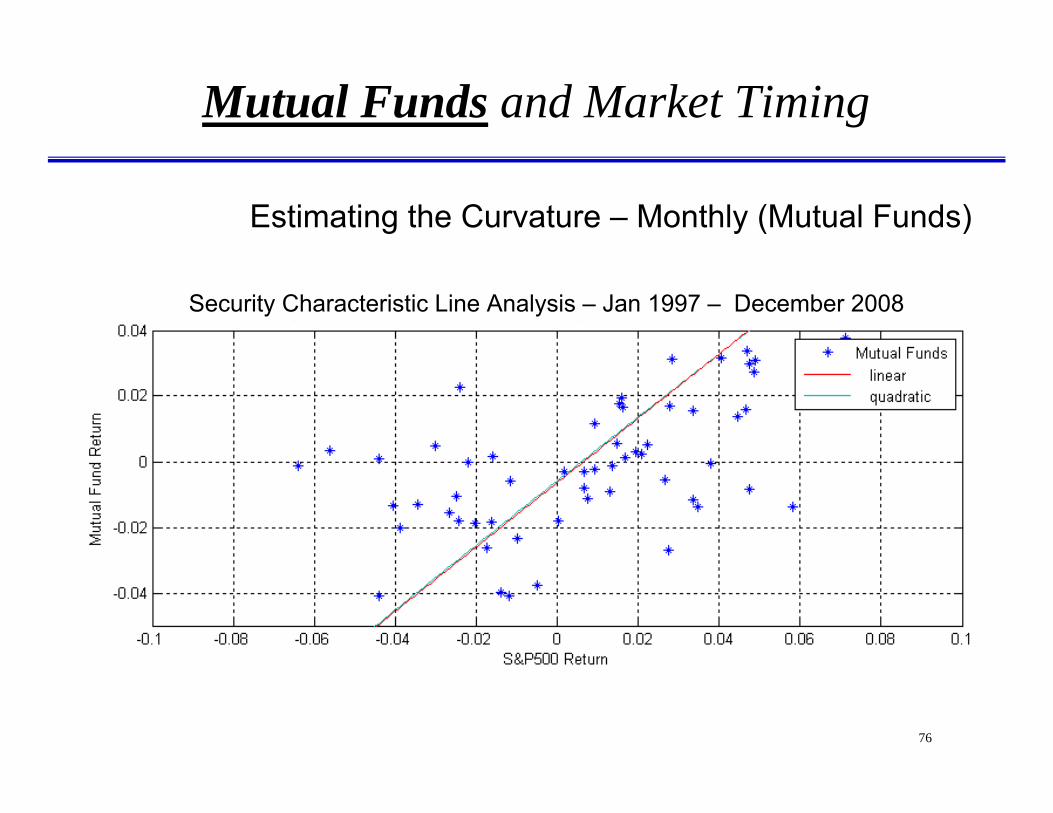
Estimating the Curvature – Monthly (Mutual Funds)
Mutual Funds and Market Timing
Security Characteristic Line Analysis – Jan 1997 – December 2008

77
Estimating the Curvature – Quarterly
Mutual Funds and Market Timing
Security Characteristic Line Analysis – Jan 1997 – December 2008

78
Estimating the Curvature – Half-Yearly
Mutual Funds and Market Timing
Security Characteristic Line Analysis – Jan 1997 – December 2008

79
Estimating the Curvature – Last 24 Months
Hedge Funds and Market Timing
Security Characteristic Line Analysis – Jan 1997 – August 2009

So there exist some hopeful indications…but it still depends!
– Recent potential increases in betas and correlations have been of great concern and failure rates have increased
– Short-term timing looks negative!• If you expect hedge fund managers to be able to turn on a dime, that may
be an unrealistic expectation…– However, over longer horizons, they may have added value in
the past in market extremes by being “conditionally” diversified– Is this market timing?
• Could be “balance sheet management”• Could be “optionality”• In any case, it can have strong implications for hedge fund investing!
– But can we “time”?
Are Hedge Funds Weathering the Storm?

81
• Expect to see…
– More regulation world-wide• Oversight, registration, monitoring• More enforcement of laws on books• More Ponzi schemes and other frauds discovered post-Madoff• Hopefully NOT restrictions on important functions like short-selling• More oversight at the level of prime brokers, counter-parties and risk-aggregators
– Greater democratization and availability of hedge fund-like strategies• Hedge funds for the masses in the form of registered funds, funds of funds and related products including hedge fund replicators
– Industry will continue to contract in number• Still, survey suggest institutions and individuals alike will continue to allocate to hedge funds, although with more caution than in the past• The so-called Endowment Model has lost a bit of luster, but largely due to illiquidity and correlated high-beta bets.
– Some fee compression, but likely only at the fund of fund level• Bifurcation in the industry will still see gargantuan fees at the top end
– Illiquidity mismatches will be realigned…for at least the short run
– Overlap between private equity and hedge fund strategies will continue, with a growing preference for the fully invested hedge fund approach (as opposed to the sale of a call option with embedded leverage)
– Mark to market rules will make a great deal of difference, although SFAS 157 in the U.S. is not yet settled• It already has made a difference judging from anecdotes; statistical analysis may be too early, but initial investigations suggest changes in risk
exposure measurement after implementation date of SFAS 157
Hedge Funds and the Future
© 2009 Christopher C. Geczy where applicable - Do Not Reproduce Without Permission