hedging overlays for global balanced portfolios · overview • in the current environment,...
TRANSCRIPT

Hedging Overlays for Global Balanced PortfoliosBalanced Portfolios
November 2013
1

OverviewOverview
• In the current environment, cross-asset correlations are generally rising and institutions are incentivised to add to risky assetsinstitutions are incentivised to add to risky assets
• In this context, hedging overlays are becoming increasingly important
• We describe various strategies for hedging market and liability risk
• While hedging generally comes at a cost, we describe various ways to reduce the drag, based on statistical analysisg y
• Finally, we perform a simple case study that shows the impact of hedging a
2
portfolio of risky assets

BackgroundBackground
• CrossBorder Capital is a London-based investment manager, founded in 1996
• We have roughly USD 300 million under management in systematic macro and options (volatility) strategiesoptions (volatility) strategies
• In particular, we manage the following strategies
• a global TAA fund that uses an options overlay to shape portfolio returns
• a long duration strategy that protects against a sharp rise in yields
• a long volatility strategy that adapts to the current risk regime
3

Our Skill SetOur Skill Set
• Our areas of expertise are
• macro research, with an emphasis on analysing global liquidity flows
• systematic model development
• options trading
• We take a modular approach, allocating different weights to each sub-strategy
• options trading
pp , g g gydependent on the fund
• This allows us to create customised solutions for clients with a specific risk profile
4

Major Risks to AvoidLiabilities
Assets and Liabilities
Matched and Risks HedgedRisk I
Ass
ets
Duration
Mismatch &
Interest Risk II
Collapse
in value
Rate Shock
Duration Risk Overlay of Risk
Assets
y
5
Long Volatility Overlay
Collapse in Value of Risk AssetsCollapse in Value of Risk Assets
• Equity and credit indices typically go “up the stairs and down the lift”, i.e. returns tend to be negatively skewedreturns tend to be negatively skewed
• Credit-fuelled markets tend to have negative feedback: a large enough drop in risk assets will force liquidations, causing further drops
H i t i i t t t t t b t ki i k bj t• Hence, investors aiming to meet return targets by taking more risk are subject to timing risk
• A -50% initial drop (as in the GFC) requires a +200% gain to break even
6

Liability Risks
• The key input to liability-driven management is the discount rate, which determines the present value of liabilities
• A scheme becomes progressively less funded as the discount rate decreases
• If the discount rate is derived from a “risk free” yield, Central Bank bond buying programmes can push a scheme underwater
• Alternatively, as asset prices rise, the equity risk premium should drop
• Hence, investors adding to risky assets after a rally should not expect much benefit to the NPV of liabilities, under reasonable assumptions
7
benefit to the NPV of liabilities, under reasonable assumptions
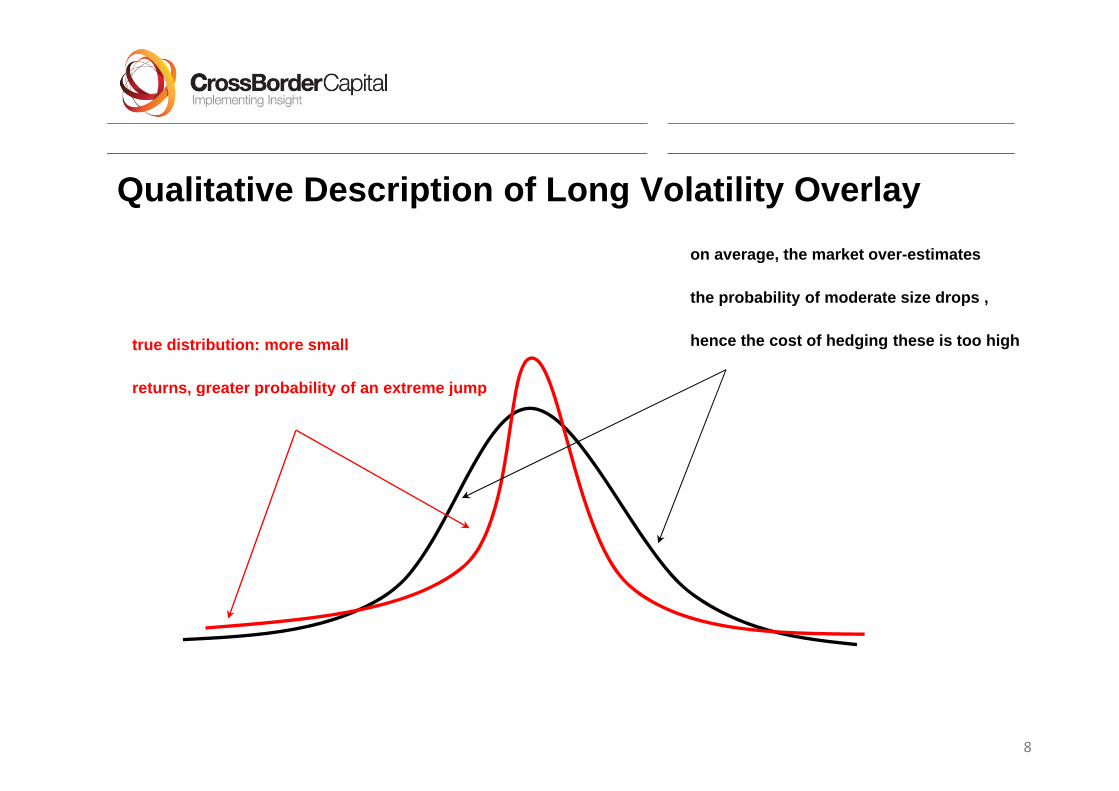
Qualitative Description of Long Volatility Overlayon average, the market over-estimates
the probability of moderate size drops ,
true distribution: more small
returns, greater probability of an extreme jump
p y p
hence the cost of hedging these is too high
, g p y j p
8

Empirical Justification Here, we simply tabulate the average performance of
1 month S&P 500 puts of various deltas, rolling weekly
In a period where the index has returned roughly +50%, all put strategies have a negative return
2005 to 2013: Average Performance of 1 Month Put Options as a % of
However, the 10 delta put was the least expensive as a function of premium paid, with the best return in 2008
Premium Paid (Data Source: Bloomberg)
By contrast, the 25 and 40 delta puts seem the most over-priced
This suggests that institutions are over-paying for hedging “reasonable” scenarios and that we should avoid these options 2008 A P f f 1 M th P t O ti % f P i P id
9
avoid these options 2008: Average Performance of 1 Month Put Options as a % of Premium Paid
Data Source: Bloomberg

Hedging Comes at a Cost There is no getting around the fact
that hedging can be expensive
The graph to the right shows historical performance for a strategy that involves rolling a 1 month at-the-money put every y p yweek
Even during the Q4 2007 – Q3 2013 period, where the S&P return was relatively flat, the put-buying strategy lost nearly -20% gross of costs (un-geared)
Data Source: Bloomberg
costs (un geared)
A reasonable goal is to minimise time decay and other costs while
10
maintaining protection

Sample Risk Regime Indicator Hedging costs can be reduced by
analysing the performance of various strategies in different risk regimesstrategies in different risk regimes
The chart to the right is based on a simple risk indicator
When the trailing Z score of the VIX is below (above) a threshold, the chart is green (red)
In green, “risk on” phases, risky assets tend to perform well whileassets tend to perform well while hedging is a performance drag
In red, “risk off” phases, the reverse is true
Since each phase is persistent over time, we want to select the best hedge given the current risk regime
Data Source: Bloomberg
11

Conditional Performance of Various Sub-Strategies Here, we show the performance of
various extreme event hedging strategies in risk on and risk off periods (i.e. the return is assumed to be 0 if we are not in a given regime)
We can see that each strategy generates We can see that each strategy generates roughly similar performance in risk off phases, such as 2008
However, the short put ratio spread (selling a 25 delta put and over-buying the 10 delta put) has the lowest downward drift in risk on periodsdownward drift in risk on periods
Hence, we would select this sub-strategy over the other 2 in the current
Data Source: Bloomberg
12
over the other 2 in the current environment

Spot VIX vs VIX Futuresp
When volatility is low, it is tempting to hedge using the VIX, e.g. relative to an equity index
The spot VIX holds its value more than an out-of-the-money equity index put
This is especially true if the index rallies before falling sharply
However, the futures roll down is typically so severe that this strategy must be weighed against the time decay in a traditional put-buying strategy
Data Source: Bloomberg
13

Roll Yield Mechanics
buy deferred month
at roll date
sell front month at roll
date
14
Source: Bloomberg

Volatility as a Value InvestmentVolatility as a Value Investment The scatter plot to the right shows
the relationship between volatility and the performance of a long-dated hedging strategy
Every 6 months we roll a 1 year to Every 6 months, we roll a 1 year to maturity fixed delta put on the S&P 500
We then compare the return of the put to the implied volatility it was bought at
We can at least tentatively conclude that it is more attractive to buy the put when volatility is low than when
15
p yit is high
Data Source: Bloomberg

Case StudyCase Study
• A public pension fund decides to increase the expected return of its asset pool by allocating to risky assets (e.g. equity and credit)by allocating to risky assets (e.g. equity and credit)
• The basket has an estimated beta of 0.5 to a benchmark equity index (simple 1 factor model)
• However the fund cannot tolerate a large drawdown in the basket• However, the fund cannot tolerate a large drawdown in the basket
• A sharp drop may lead to under-funding issues, possibly compounded by the y g y ynecessity of switching to a more conservative discount rate
16

Hedging Strategy 1: Options OverlayHedging Strategy 1: Options Overlay One way to construct a hedge is by
explicitly capping the downside, at minimal cost
Recall from slide 12 that selling a put ratio reduces time decay in ‘risk on’ratio reduces time decay in risk on regimes
The hedge is sized to eliminate glosses beyond a -7.5% threshold for a USD 250 million portfolio with a beta of 0.5
Note that the hedge costs nothing up front (i.e. no premium outlay) and provides full protection against an
17
Source: Bloomberg
p p gout-sized down move

Hedging Strategy 1: Combined PositionHedging Strategy 1: Combined Position
The true “cost” is that the hedge actually detracts from performance y pfor moderate downside moves in the index
We are selling 1 SPX 25 delta put and buying 2.5 10 delta puts
Hence e need the res lts on slide Hence, we need the results on slide 9 to persist in the future for the hedge to be efficient
Source: Bloomberg
18
Sou ce oo be g

Hedging Strategy 2: Combined PositionHedging Strategy 2: Combined Position
Another way to construct a hedge is to target a hedge-adjusted risk premium
Suppose our portfolio has a beta of 0.5 to the Eurostoxx 50 index and we0.5 to the Eurostoxx 50 index and we assume a 3% annualised risk premium for the index
We can then spend ½ of the premium on protection, buying 1 year to maturity 10 delta puts
Slide 15 shows that, in a ‘risk on’ phase buying long-dated puts is aphase, buying long-dated puts is a reasonable value proposition
19
Source: Bloomberg

Hedging Strategy 2: Long Volatility ExposureHedging Strategy 2: Long Volatility Exposure
At first glance, Strategy 1 seems much more attractive than 2, as ,losses are only capped around -27.5% below the spot
However, long-dated options tend to have lots of vega (their value is very sensitive to changes in volatility)
Hence, if we enter in a low volatility regime and 1 year vol increases by 15 points, the hedge increases dramatically in value, with no explicit reference to changes in the spot
Source: Bloomberg
20
Sou ce oo be g

CROSSBORDER CAPITAL LTD 2013 ALL RIGHTS RESERVEDCROSSBORDER CAPITAL LTD, 2013. ALL RIGHTS RESERVED REGULATED BY THE FSA
96 BAKER STLONDON W1U 6TJ
TELEPHONE 44 20 7908 2800 FACSIMILE 44 20 7908 2835
E-MAIL: Hari Krishnan [email protected] @ q y
This document researches a fund not authorised or recognised as a collective regulated investment scheme for the purposes of the UK Financial Servicesand Markets Act 2000 and is therefore for private circulation only and is not intended and must not be distributed to private investors. It is for informationpurposes only and does not offer any specific investment advice. Under no circumstances should it be used or considered as an advisory or offer to sell ora solicitation of any offer or advisory to buy any securities.
As a high volatility investment this fund may be subject to sudden falls in value and these could lead to a large loss on realisation which could equal theamount invested. An investor in the fund will not be liable to compensation for any losses. CrossBorder Capital points out that the value of all investmentsand the income derived therefrom can decrease as well as increase (this may be partly due to exchange rate fluctuations in investments that have anexposure to currencies other than the base currency of the fund). In addition that fund may from time to time use options, futures and warrants which arehighly specialised activities and entail greater than ordinary investment risks. Thus a relatively small movement in the price of a security to which theserelate ma res lt in a disproportionatel large percentage mo ement nfa o rable as ell as fa o rable in their price The f nd ma gear itself b otherrelate may result in a disproportionately large percentage movement, unfavourable as well as favourable, in their price. The fund may gear itself by othermeans as well. This report uses historical and simulated pro-forma results which may not be a guide to future performance.
Whilst given in good faith neither we nor any officer, employee, or agent of ours shall be liable for loss or damage, whether direct or indirect, which may besuffered by using or relying on the information, research, opinions, advice or recommendations contained herein or in any prior or subsequent written orverbal presentations. The employees of CrossBorder Capital Limited may have a position or otherwise be interested in funds mentioned in this report.This report may not be reproduced distributed or published by any recipient for any purpose CrossBorder Capital Limited is regulated by the FSA for theThis report may not be reproduced, distributed or published by any recipient for any purpose. CrossBorder Capital Limited is regulated by the FSA for theconduct of investment business in the UK.