height tendency diagnostics using a generalized omega
TRANSCRIPT

JULY 1997 1577R A I S A N E N
q 1997 American Meteorological Society
Height Tendency Diagnostics Using a Generalized Omega Equation, the VorticityEquation, and a Nonlinear Balance Equation
JOUNI RAISANEN
Department of Meteorology, University of Helsinki, Helsinki, Finland
(Manuscript received 13 March 1996, in final form 12 November 1996)
ABSTRACT
Height tendency dynamics are studied with a system consisting of a generalized omega equation, the vorticityequation, and a nonlinear balance equation. By using the first two equations, vorticity tendency is first partitionedinto components associated with vorticity advection, thermal advection, friction, diabatic heating, and an ageos-trophic tendency term. The nonlinear balance equation is then employed to interpret the vorticity tendencycomponents in terms of height tendencies. The height tendencies due to vorticity advection and friction can bedivided into parts associated with the direct forcing and the vertical motions induced by this forcing. This divisionillustrates the efficiency of vertical motions in smoothing out the vertical gradients in the forcing field.
The system is solved over a global domain, but the main emphasis is on an analysis of the ‘‘Presidents’ Daycyclone’’ of February 1979. Although the calculations do not fully capture the observed decrease in the deepeningrate of this cyclone from 19 to 21 February, they suggest a change in its dynamics. On 19 February thermaladvection and diabatic heating due to latent heat release are both found to make a large contribution to intensifythe system, on 21 February only the latter makes a contribution. Vorticity advection by the nondivergent flowfavors the deepening of the low on both 19 and 21 February, but anticyclonic vorticity advection by low-levelconvergent winds is identified as a damping mechanism comparable in importance to surface friction. It is alsofound that the formally passive characteristics of the environment like the stability and vorticity distributionsmodify the calculated height tendencies rather strongly.
1. Introduction
A characteristic of the atmospheric synoptic-scale dy-namics is that vertical motions are more naturallythought as a slave of other processes than as an inde-pendent forcing agent. According to the quasigeostroph-ic (QG) theory (e.g., Holton 1992), the vertical circu-lation is such that it just compensates the tendency ofvorticity advection and thermal advection to remove theatmosphere from geostrophic and hydrostatic balance.One implication of this is that the vorticity equation,when used alone, is a somewhat problematic tool foranalyzing the dynamics of synoptic systems. For ex-ample, if one wishes to use this equation to study therole of vorticity advection in a given case, one can ofcourse directly calculate this term. But the stretchingterm may be equally important, and since vorticity ad-vection affects the vertical circulation, some part of thisterm is likely to present an indirect effect of vorticityadvection. Moreover, since the vertical circulation isaffected by other processes as well (in the QG theory,thermal advection), this part is not readily separable.
Corresponding author address: Jouni Raisanen, Department ofMeteorology, University of Helsinki, P.O. Box 4 (Yliopistonkatu 3),FIN-00014 Helsinki, Finland.E-mail: [email protected]
Similar problems are encountered in using the ther-modynamic equation alone.
Within the QG framework, problems like those dis-cussed above can of course be avoided by using a di-agnostic tool that combines the vorticity and the ther-modynamic equation: the QG height tendency equation(Holton 1992, 159). In many cases, however, the nu-merous approximations in the QG theory itself hamperthe usefulness of this tool; it is not always able to re-produce the actual height tendencies with an acceptableaccuracy. To overcome this problem, Tsou et al. (1987)derived a generalized height tendency equation anddemonstrated that this was far superior to the QG equa-tion in reproducing the observed height tendencies. Inthis equation, however, vertical motions are not as neatlyeliminated as in the QG counterpart. One of the majorforcing terms is vertical stability advection, and, asfound by Tsou et al. and in a few later studies (e.g.,Tsou and Smith 1990; Tan and Curry 1993), this termhas a strong tendency to oppose the other large terms.
In this paper, an alternative method to height tendencydiagnostics is presented. While this method makes fewapproximations to the primitive equations and hence isexpected to be accurate even in cases in which the QGapproximations break down, it also formally eliminatesvertical motions as an independent forcing mechanism.To achieve this elimination, a generalized omega equa-

1578 VOLUME 125M O N T H L Y W E A T H E R R E V I E W
tion is first used. Then the solution of this equation issubstituted to the vorticity equation to obtain a parti-tioning of the vorticity tendency. Finally, a nonlinearbalance equation is used to interpret the calculated vor-ticity tendencies in terms of height tendencies.
After presenting the equation system in more detail(section 2), the database and the numerical methods aredescribed in section 3. The system is solved over aglobal domain, hence a few brief remarks of the plan-etary-scale behavior of the calculated height tendenciesare given in section 4. However, the emphasis in thisstudy is on an analysis of the so-called Presidents’ Day
cyclone over the western North Atlantic on 19–21 Feb-ruary 1979 (section 5). In addition to presenting thecalculated height tendencies, various aspects of theirphysical interpretation are discussed, including, for ex-ample, the ‘‘direct’’ and ‘‘indirect’’ effects of vorticityadvection and friction. A summary followed by somefurther discussion is given in section 6.
2. EquationsThe starting point of the present analysis is the gen-
eralized omega equation in the form used by Raisanen(1995, hereafter R95):
] ]v ] ]z ] ]V2¹ (sv) 1 f (z 1 f ) 2 f v 1 f k· 3 =v1 2 1 2[ ] [ ]]p ]p ]p ]p ]p ]p
] R ] R ] ]z R ]T2 2 2f [V·=(z 1 f )] 1 ¹ (V·=T ) 2 f (k·= 3 F) 2 ¹ Q 1 f 1 ¹ ,5 1 2[ ]]p p ]p C p ]p ]t p ]tp
(1)
| | | | | | | | | |z z z z z}}}}}}}} 2}}}}}} }}}}}}}} 2}}}}2 2}}}}}}}}}}2
F F F F FV T F Q A
where all the symbols have their usual meteorologicalmeaning (e.g., Holton 1992). On the right-hand side(rhs), the first four forcing terms represent the effectsof vorticity advection, thermal advection, friction, anddiabatic heating. The FA term is at extratropical latitudesclosely proportional to the pressure derivative of theageostrophic vorticity tendency (see R95) and will inthe following be referred to as the ageostrophic tendencyterm. Since the left-hand side (lhs) of (1) is linear withrespect to v, the contributions of the five rhs terms canbe calculated separately provided that homogeneousboundary conditions (v 5 0 at the boundaries) are used.By doing this and then using the vorticity equation
]z ]z ]v5 2V·=(z 1 f ) 2 v 1 (z 1 f )
]t ]p ]p
]V1 k· 3 =v 1 k·= 3 F, (2)1 2]p
five components of vorticity tendency are obtained:
]z ]z ]z ]z ]z ]z5 1 1 1 1 ,1 2 1 2 1 2 1 2 1 2]t ]t ]t ]t ]t ]t
V T F Q A
(3)
where the subscripts follow the convention in (1). Thesecomponents are defined as
]z ]z ]vV5 2V·=(z 1 f ) 2 v 1 (z 1 f )V1 2]t ]p ]pV
]V1 k· 3 =v , (4)V1 2]p
]z ]z ]vF5 k·= 3 F 2 v 1 (z 1 f )F1 2]t ]p ]pF
]V1 k· 3 =v , (5)F1 2]p
and
]z ]z ]vX5 2v 1 (z 1 f )X1 2]t ]p ]pX
]V1 k· 3 =v , X 5 T, Q, A. (6)X1 2]p
Thus, the components associated with vorticity advec-tion and friction include both the vorticity tendenciesdirectly created by these processes and an indirect con-tribution from the vertical motions induced by them.The other three terms only contain the latter part.
To interpret the vorticity tendencies in terms of heighttendencies, we differentiate with respect to time the non-linear balance equation (NLBE) among the first used byCharney (1955). The result is, in a form that avoidscaveats associated with spherical geometry,

JULY 1997 1579R A I S A N E N
]z ]c ]c2g¹ 5 =· f = 2 =· = =c·=1 2 1 2[]t ]t ]t
]c ]c2 22 ¹ c= 1 =c= ,1 2]]t ]t
(7)
where the streamfunction c fulfills the relationship
=2c 5 z. (8)
By first converting the calculated vorticity tendencycomponents in (3) into streamfunction tendencies with(8) and then substituting these together with the currentstreamfunction c to (7), five height tendency compo-nents are obtained:
]z ]z ]z ]z ]z ]z5 1 1 1 1 . (9)1 2 1 2 1 2 1 2 1 2]t ]t ]t ]t ]t ]t
V T F Q A
The conversion from (3) to (9) is straightforward apartfrom the fact that (7) only gives the horizontal Laplacianof ]z/]t, not ]z/]t itself. In the present case, in which aglobal calculation domain is used, the five componentsin (9) are most simply determined by assuming that theglobal average is zero for each of them. If the domainwere smaller, lateral boundary conditions would haveto be specified.
In spite of the relative completeness of the system(1)–(9) compared with diagnostic systems based, forexample, on the QG equations, at least two sources ofinherent inaccuracy are worth noting. First, while (1)requires only hydrostatic balance, the lower boundarycondition v 5 0 used in solving it is not adequate inmountainous areas where near-surface vertical motionsmay be significant. To account for this, an extra v com-ponent associated with the lower boundary conditionshould actually be included. As was done by R95, how-ever, this term is excluded in the present study as onetoo difficult to estimate. In the case of the marine cy-clone that is our major focus, this is not expected to bea serious source of error. At any event, boundary con-ditions would be a more serious issue if the QG or theTsou et al. (1987) height tendency equation were usedsince a simple prespecification of ]z/]t at the lower andupper boundaries would be a rather problematic step.
Second, the NLBE is not an exact relationship, eventhough the approximations in it are for most purposesregarded as small (e.g., Haltiner and Williams 1980, 69)and the nonlinear balance has been shown to explain anappreciable part of the total ageostrophic wind in cy-clogenesis events as extreme as the IOP 4 case (Daviset al. 1996). The extent to which the inaccuracy of theNLBE affected the present calculations is discussed insection 5b. Although this impact was not found totallynegligible, it clearly appeared acceptably small. In anycase, it is fair to note that this source of inaccuracy isin a way unnecessary since the use of the NLBE could
have been avoided by portraying the results in terms ofvorticity or streamfunction (rather than height) tenden-cies. However, vorticity tendencies have the disadvan-tage of emphasizing subsynoptic features that may besensitive to numerical errors in the calculations. In ad-dition, although this is partly a matter of personal pref-erence, geopotential height may be regarded as a morenatural indicator of cyclone development than thestreamfunction simply because it is, unlike the stream-function, a locally measurable quantity.
A few other issues related to the system (1)–(9) alsodeserve attention. First, although the use of the gener-alized omega equation has allowed us to build a systemin which the influence of vertical motions is implicitlyaccounted for, it is evident that some of the five forcingterms in this equation are affected by vertical motionsthemselves. An obvious example is diabatic heating. Amajor component of this is latent heat release, which atleast in areas of stable ascent tends to be proportionalto the intensity of the synoptic-scale rising motion. Inaddition, vorticity advection (which also enters the sys-tem directly via the vorticity equation) and thermal ad-vection contain contributions by the horizontal diver-gent circulation, which is related to the field of verticalmotions by the requirement of mass continuation. Al-though scaling arguments typical to those used in textbooks of dynamic meteorology (e.g., Holton 1992) in-dicate that vorticity advection and thermal advection bydivergent wind are of minor importance in most syn-optic-scale systems, it is demonstrated in section 5f ofthis paper that the former of these may actually play arather large role in some circumstances.
Second, although this is more a formal than a phys-ically meaningful partitioning, it is in the case of vor-ticity advection and friction instructive to compute sep-arately the height tendencies associated with the directand the indirect forcing. Examples of such calculationswill be shown in section 5e.
Third, the height tendency response to a given forcingis in the system (1)–(9) not solely determined by theforcing itself. Rather, it is also affected by the severalvariable coefficients in these equations that are asso-ciated with the wind, vorticity, and stability distributionsof the environment. To study this issue, calculationswere also made with a simplified equation system inwhich this variability is largely eliminated (section 5g).
Finally, the goal of formally eliminating the heighttendency forcing by vertical motions could be achievedin some other ways as well. After solving the gener-alized omega equation, one could also proceed, ratherthan by using the vorticity equation and the NLBE, byintegrating the thermodynamic equation vertically likeHirschberg and Fritsch (1991). In this case, the indirectforcing by vertical motions would enter the system viathe adiabatic cooling term in the thermodynamic equa-tion. Likewise, the solution of (1) could be used to par-tition the vertical stability advection term in the Tsouet al. (1987) height tendency equation. While we have

1580 VOLUME 125M O N T H L Y W E A T H E R R E V I E W
selected in this study to proceed via the vorticity equa-tion, we are not claiming that this approach is a prioribetter than these other alternatives.
3. Data and numerical methods
Calculations were made at 6-h intervals for a 2-dayperiod beginning at 0000 UTC 19 February 1979. Thesame dataset generated by ECMWF was used as in R95:initialized FGGE (First GARP Global Experiment) levelIIIb ‘‘final’’ analyses for wind, geopotential, and tem-perature, and model-produced fields of friction and dia-batic heating obtained from 2-h forecasts used in thediabatic normal-mode initialization (Wergen 1988). Thedata were available on a global 1.8758 3 1.8758 lati-tude–longitude grid at 19 isobaric levels (initializedanalyses) or at 16 hybrid levels (friction and diabaticheating) that in the lower troposphere behave like ssurfaces but in the stratosphere closely approximate iso-baric levels (Wergen 1988).
In many phases of the calculations, spherical har-monics were used. A somewhat adverse consequence ofthis numerically practical choice was that, at each iso-baric level down to the lowest (1000 mb), the grid pointsbelow the ground had to be used in the calculations aswell as those above the ground. This creates a problemsince the calculated height tendency at any given pointis not solely determined by the local forcing. The inverseLaplacian in converting ]z/]t to ]c/]t spreads the impactof the local vorticity tendency horizontally to all theother grid points at the same isobaric level, and becauseof the vertical derivatives on the lhs of (1), the vorticitytendencies themselves feel the rhs forcing in all gridpoints not only at the same but also at the other levels.Thus, even above the ground, the solution may be sen-sitive to the artificial below-ground input data. In somecases, this sensitivity was actually quite strong, in par-ticular at the planetary scale (see section 4). To minimizethe problem, vorticity advection, thermal advection, anddiabatic heating were set to zero below the ground. Forfriction, a slightly different scheme was selected: theinterpolation from hybrid levels to isobaric coordinateswas made by assuming a constant surface pressure of1000 mb. While this scheme locates the friction layerin mountainous areas far below the actual surface, itensures that the strongest friction just above the surfaceis not lost and that the thickness of the friction layer isalways approximately correct.
Another point worth noting is that the 6-h time in-terval of the FGGE analyses prohibited the calculationof truly instantaneous values for the ageostrophic ten-dency term (]z/]t)A. Therefore, we only show in section5 (Figs. 6e, 7e, 8e, and 9e) an estimate of the 6-h heightchanges associated with this term. For this estimate, thevorticity and temperature tendencies were replaced with6-h finite differences between two successive analyses.Then, as the system (1), (6), and (7) contains severalvariable coefficients, this system was solved twice: first
with coefficients representative for the beginning of the6-h period and then with coefficients representative forthe end of this period. Finally, the two different heighttendencies obtained in this way were averaged. How-ever, while this kind of a procedure gives the best avail-able estimate of the magnitude of (]z/]t)A, these 6-hestimates are necessarily somewhat out of phase withthe other ‘‘instantaneous’’ terms. Therefore, the contri-bution of this term to the total height tendencies shownin Figs. 6f, 7f, 8f, 9f, and 14a,b was calculated fromthe mean of the height changes computed for the pre-ceding and the following 6 h.
The method used to solve the generalized omegaequation is described by R95. Here v was computed for20 evenly spaced isobaric levels (50,100, . . . , 1000 mb).The partitioned vorticity tendencies were then calcu-lated for the 19 half-levels (75,125, . . . , 975 mb) of thisgrid. These levels were used in all the subsequent cal-culations, and for comparison with the calculated heightchanges, the analyzed height changes were also inter-polated onto them. This seemingly unobvious choice,which was ultimately dictated by a technical detail1 insolving the omega equation, was basically motivated bythe need of good numerical consistency between themethods used in solving the vorticity equation and theomega equation. Badly selected methods were found tocause a disturbing amount of vertical noise in (]z/]t)V
and (]z/]t)F, which are numerically the most problematicof the five components since they contain two generallyopposing parts (see section 5e): the direct contributionsof vorticity advection and friction and the indirect con-tributions from the associated vertical motion. Whilethe details of the methodology are here subordinate tothe topic, it is good to note that the vertical interpola-tions were made, to the extent possible, in the last phaseof the computations. For example, in both the omegaand the vorticity equations, vorticity advection was fullyevaluated at the original FGGE levels before any verticalinterpolation. In all these computations, the horizontalderivatives were estimated with fourth-order central dif-ferences.
The streamfunction tendencies were obtained fromthe vorticity tendencies by inverting the horizontal La-placian with the help of spherical harmonics (e.g., Hol-ton 1992, 452). The expansions were truncated at thetwo-dimensional wavenumber n 5 63. The currentstreamfunction was calculated from the FGGE windanalysis in the same way. Finally, the height tendencycomponents were solved from (7) by first evaluating the
1 In the core of solving (1), a matrix inversion was used in which]2v/]p2 was directly approximated with the traditional three-pointformula on the 20-level grid. To get the pressure derivative of ]z/]tconsistent with this scheme, ]v/]p had to be estimated in the vorticityequation at the half-levels of the 20-level grid from the difference ofv between two adjacent full levels.

JULY 1997 1581R A I S A N E N
FIG. 1. The 48-h (0000 UTC 19 February–0000 UTC 21 February1979) zonal mean changes in the 925-mb isobaric height associatedwith the five terms of Eq. (9) (V, T, F, Q, and A). The total calculated(Tot) and analyzed (Anal) zonal mean height changes are also shown.
rhs in grid space and then inverting the Laplacian withspherical harmonics.
4. Planetary-scale characteristics
To briefly characterize the planetary-scale behaviorof the calculated height tendencies, Fig. 1 shows for the925-mb level the 48-h zonal mean height changes as-sociated with the five terms in (9). The zonal means ofthe calculated total height changes and the analyzedheight changes are also included. The 925-mb level isselected here since it is most heavily used in the rest ofthe paper. However, most of the terms in (9) had arelatively barotropic structure in the zonal mean plane,in particular in the lower and midtroposphere.
The purpose of showing Fig. 1 is not to discuss theplanetary-scale height tendency dynamics in any detail;for this aim the 48-h averaging period is in fact spu-riously short. Rather, this figure serves to illustrate afeature that for any synoptic-scale analysis must be re-garded as a nuisance. Two of the five components, (]z/]t)V and (]z/]t)T, have in the zonal mean plane a ratherlarge magnitude [the former exceeds 500 m (48 h)21
near the North Pole] and a strong tendency to opposeeach other. In the Tropics and the polar regions, thezonal means shown in Fig. 1 are in fact comparable to,or larger than, the transient features of (]z/]t)V and (]z/]t)T in typical synoptic systems. Consequently, eventhough the Presidents’ Day storm was a strong midla-
titude cyclone, it was found useful to simplify the syn-optic interpretation by removing the very longest wavecomponents (two-dimensional wavenumber n # 3) fromall the calculated height tendencies (but not from theanalyzed height changes) shown in section 5. In additionto just discussing the contributions of (]z/]t)V and (]z/]t)T, this long-wave cutoff clearly appeared beneficialin a few other issues, for example in analyzing the directand indirect effects of vorticity advection (section 5e).
The removal of the longest waves is justified by thefact that these waves had, with the exception of thestratosphere, a relatively small amplitude in the ana-lyzed height change field. The global maximum of their48-h contribution at 925 mb was only 60 m. Moreover,although the smallness of this contribution does notstrictly rule out the possibility that some synopticallyrelevant information has been thrown away, the situationis loosely analogous to the (frequent) case in whichcalculations are made in a nonglobal domain. Even inthat case, the planetary-scale tendencies would not beproperly presented. Finally, it is to be emphasized thatthe long-wave cutoff was only made after fully solvingthe system (1)–(9). Therefore, the results shown in sec-tion 5 appropriately include the synoptic-scale (n . 3)height tendencies resulting from the nonlinear interac-tions in which the planetary-scale waves are involved.
Figure 1 also reveals that the total calculated 48-hheight changes were not identical with the analyzedheight changes: zonal mean differences approaching 100m (48 h)21 occur in high latitudes. While the causes ofthe errors are not fully known, it is speculated that thetreatment of the below-ground input data may play somerole, in spite of the countermeasures described in theprevious section. Without these countermeasures, theresults were clearly more unrealistic. For example, whenvorticity advection was not set to zero below the ground,(]z/]t)V was over 150 m (48 h)21 more positive at theNorth Pole, and over 350 m (48 h)21 more positive atthe South Pole.
5. Analysis of the Presidents’ Day cyclone
a. Overview of the synoptic development
The vigorous depression known as the Presidents’Day cyclone developed when an inverted trough situatedat the east coast of the United States on 18 February1979 underwent a period of rapid deepening on thefollowing day. This case of explosive cyclogenesis hasbeen widely studied by using both observational data(e.g., Bosart 1981; Bosart and Lin 1984; Uccellini et al.1984, 1985) and model simulations (Uccellini et al.1987; Whitaker et al. 1988); therefore, no detailed de-scription of the synoptic development is needed here.However, since our calculations extend later in time thanthose in these earlier studies, the track of the surfacelow and the evolution of its minimum sea level pressure
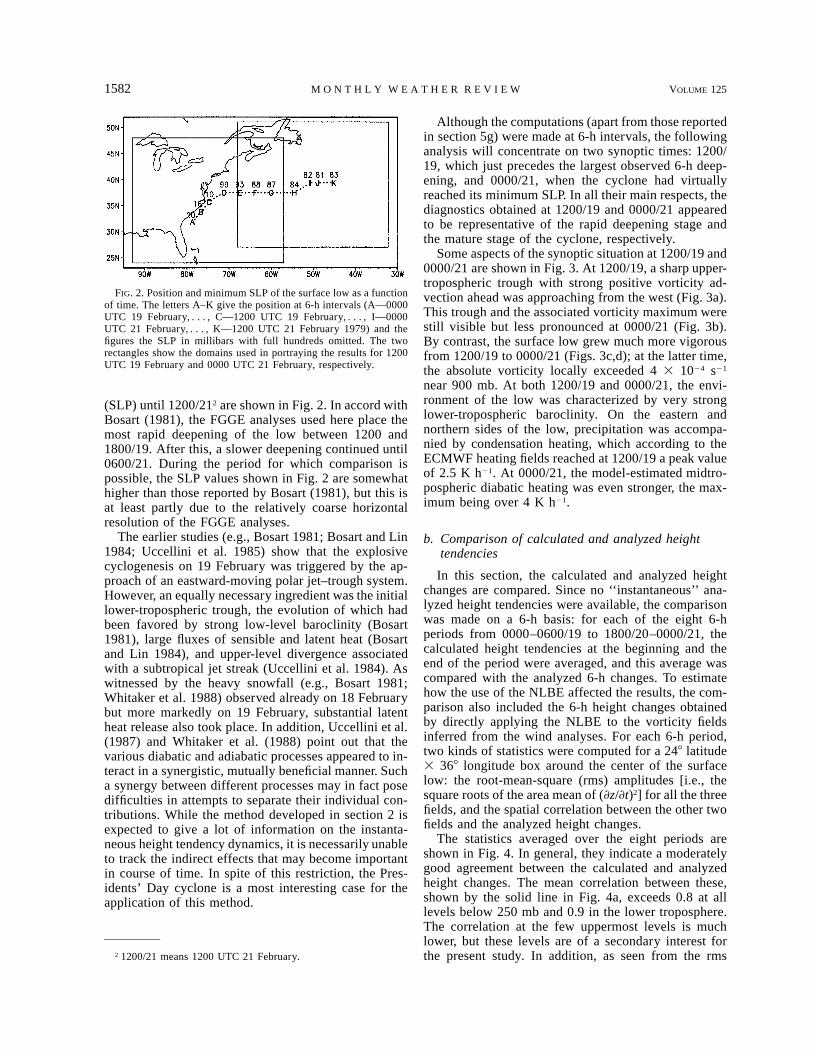
1582 VOLUME 125M O N T H L Y W E A T H E R R E V I E W
FIG. 2. Position and minimum SLP of the surface low as a functionof time. The letters A–K give the position at 6-h intervals (A—0000UTC 19 February, . . . , C—1200 UTC 19 February, . . . , I—0000UTC 21 February, . . . , K—1200 UTC 21 February 1979) and thefigures the SLP in millibars with full hundreds omitted. The tworectangles show the domains used in portraying the results for 1200UTC 19 February and 0000 UTC 21 February, respectively.
(SLP) until 1200/212 are shown in Fig. 2. In accord withBosart (1981), the FGGE analyses used here place themost rapid deepening of the low between 1200 and1800/19. After this, a slower deepening continued until0600/21. During the period for which comparison ispossible, the SLP values shown in Fig. 2 are somewhathigher than those reported by Bosart (1981), but this isat least partly due to the relatively coarse horizontalresolution of the FGGE analyses.
The earlier studies (e.g., Bosart 1981; Bosart and Lin1984; Uccellini et al. 1985) show that the explosivecyclogenesis on 19 February was triggered by the ap-proach of an eastward-moving polar jet–trough system.However, an equally necessary ingredient was the initiallower-tropospheric trough, the evolution of which hadbeen favored by strong low-level baroclinity (Bosart1981), large fluxes of sensible and latent heat (Bosartand Lin 1984), and upper-level divergence associatedwith a subtropical jet streak (Uccellini et al. 1984). Aswitnessed by the heavy snowfall (e.g., Bosart 1981;Whitaker et al. 1988) observed already on 18 Februarybut more markedly on 19 February, substantial latentheat release also took place. In addition, Uccellini et al.(1987) and Whitaker et al. (1988) point out that thevarious diabatic and adiabatic processes appeared to in-teract in a synergistic, mutually beneficial manner. Sucha synergy between different processes may in fact posedifficulties in attempts to separate their individual con-tributions. While the method developed in section 2 isexpected to give a lot of information on the instanta-neous height tendency dynamics, it is necessarily unableto track the indirect effects that may become importantin course of time. In spite of this restriction, the Pres-idents’ Day cyclone is a most interesting case for theapplication of this method.
2 1200/21 means 1200 UTC 21 February.
Although the computations (apart from those reportedin section 5g) were made at 6-h intervals, the followinganalysis will concentrate on two synoptic times: 1200/19, which just precedes the largest observed 6-h deep-ening, and 0000/21, when the cyclone had virtuallyreached its minimum SLP. In all their main respects, thediagnostics obtained at 1200/19 and 0000/21 appearedto be representative of the rapid deepening stage andthe mature stage of the cyclone, respectively.
Some aspects of the synoptic situation at 1200/19 and0000/21 are shown in Fig. 3. At 1200/19, a sharp upper-tropospheric trough with strong positive vorticity ad-vection ahead was approaching from the west (Fig. 3a).This trough and the associated vorticity maximum werestill visible but less pronounced at 0000/21 (Fig. 3b).By contrast, the surface low grew much more vigorousfrom 1200/19 to 0000/21 (Figs. 3c,d); at the latter time,the absolute vorticity locally exceeded 4 3 1024 s21
near 900 mb. At both 1200/19 and 0000/21, the envi-ronment of the low was characterized by very stronglower-tropospheric baroclinity. On the eastern andnorthern sides of the low, precipitation was accompa-nied by condensation heating, which according to theECMWF heating fields reached at 1200/19 a peak valueof 2.5 K h21. At 0000/21, the model-estimated midtro-pospheric diabatic heating was even stronger, the max-imum being over 4 K h21.
b. Comparison of calculated and analyzed heighttendencies
In this section, the calculated and analyzed heightchanges are compared. Since no ‘‘instantaneous’’ ana-lyzed height tendencies were available, the comparisonwas made on a 6-h basis: for each of the eight 6-hperiods from 0000–0600/19 to 1800/20–0000/21, thecalculated height tendencies at the beginning and theend of the period were averaged, and this average wascompared with the analyzed 6-h changes. To estimatehow the use of the NLBE affected the results, the com-parison also included the 6-h height changes obtainedby directly applying the NLBE to the vorticity fieldsinferred from the wind analyses. For each 6-h period,two kinds of statistics were computed for a 248 latitude3 368 longitude box around the center of the surfacelow: the root-mean-square (rms) amplitudes [i.e., thesquare roots of the area mean of (]z/]t)2] for all the threefields, and the spatial correlation between the other twofields and the analyzed height changes.
The statistics averaged over the eight periods areshown in Fig. 4. In general, they indicate a moderatelygood agreement between the calculated and analyzedheight changes. The mean correlation between these,shown by the solid line in Fig. 4a, exceeds 0.8 at alllevels below 250 mb and 0.9 in the lower troposphere.The correlation at the few uppermost levels is muchlower, but these levels are of a secondary interest forthe present study. In addition, as seen from the rms

JULY 1997 1583R A I S A N E N
FIG. 3. Synoptic situation at 1200 UTC 19 February [(a)and (c)], and 0000 UTC 21 February [(b) and (d)]. Panels(a) and (b) depict geopotential height (solid, every 80 m) and absolute vorticity in 1025 s21 (dotted, every 5 3 1025
s21, values in excess 10 3 1025 s21 shaded) at 300 mb. In (c) and (d), sea level pressure (solid, every 5 mb),temperature at 900 mb (dotted, every 38C) and diabatic heating at 700 mb are shown. The light, medium, and darkshading indicate heating rates of 0.5–2, 2–4, and over 4 K h21, respectively.
FIG. 4. (a) Time mean spatial correlation in the vicinity of the cyclone (see text) between theanalyzed and the calculated 6-h height changes (solid) and between the analyzed height changes andthe height changes estimated with the NLBE directly from the wind analyses (dashed). (b) The rmsamplitudes for the analyzed (dotted) and calculated (solid) height changes and for the height changesestimated with the NLBE from the wind analyses (dashed).

1584 VOLUME 125M O N T H L Y W E A T H E R R E V I E W
amplitudes in Fig. 4b, the height changes at this altitudewere relatively small. The rms amplitudes for the cal-culated and analyzed height changes are in fair agree-ment, although some differences are easily detectable.Most notably, the calculated height changes at the low-est level, 975 mb, are too weak by over 25%.
The relative weakness of the calculated low-levelheight changes is consistent with the fact that the NLBEneglects surface friction and therefore does not ‘‘know’’that a steeper pressure gradient is needed to maintain agiven wind speed near the surface than in the free at-mosphere. Thus, low-level vorticity tendencies of theright magnitude should lead to too small inferred heighttendencies. As seen from Fig. 4b, a very similar errorin the low-level rms amplitude was actually found inthe test in which the NLBE was directly applied to thewind analyses. This test also revealed that the NLBEtended to overestimate the magnitude of the analyzedheight changes in the upper troposphere and the low-ermost stratosphere, but this positive bias is more dif-ficult to explain. In any case, the fields obtained in thistest were spatially highly correlated with the analyzedheight changes, in particular in the troposphere: themean correlation exceeded 0.95 at all levels below 300mb and approached 0.98 near 800 mb (see the dashedline in Fig. 4a). As a whole, therefore, the inaccuracyof the NLBE seems for the purposes of the present studyan acceptable source of error.
In sections 5c–g, all the horizontal height tendencyfields are shown at the 925-mb level, which partlyavoids the friction-related inaccuracy of the NLBE nearthe surface but still appeared low enough to give a rep-resentative view of the factors that affected the devel-opment of the low-level cyclone. Figure 5 shows heightchanges at this level during 1200–1800/19 and 1800/20–0000/21, that is, for the 6-h periods following thefirst and preceding the second synoptic time on whichthe rest of our analysis will concentrate. The analyzedheight changes, the height changes obtained by aver-aging the calculated total height tendencies at the be-ginning and the end of the period, and the heightchanges inferred from the wind analyses with the NLBEare all shown. During both periods, the areas of heightdecrease and increase in these three fields are nearlycollocated. Another common feature is the general in-crease in the magnitude of the height changes from1200–1800/19 to 1800/20–0000/21, which is explainedby the movement of the cyclone together with the largerintensity of the surface low during the latter period.
In the details, however, differences do emerge be-tween the three fields. Compared with the analyzedheight changes (Figs. 5a,b), the calculated heightchanges (Figs. 5c,d) have at both times a less concen-trated spatial structure and a smaller maximum mag-nitude. Although several factors may contribute to this,the presence of a similar though less pronounced errorin the height change fields inferred with the NLBE di-rectly from the wind analyses (Figs. 5e,f) is worth not-
ing. The general deficit in magnitude is at least partlydue to friction, but friction alone is unlikely to explainthe looser spatial structure near the center of the low.This might either indicate that the flow near the core ofthe cyclone was actually unbalanced, or simply resultfrom numerical smoothing of small-scale details in thecalculations.
Perhaps the most disappointing conclusion from com-paring Figs. 5c,d with 5a,b is that the calculated heightchanges do not properly capture the marked decreasein the deepening rate of the cyclone from 1200–1800/19to 1800/20–0000/21. During the former period, the cal-culations underestimate the height decrease ahead of thelow more severely than the height increase behind thelow, but during the latter, the height increase is moreseriously underestimated3. The calculated height ten-dency at the center grid point of the low actually appearsto be more strongly negative during 1800/20–0000/21than 1200–1800/19, but this impression may be some-what misleading. Although the height tendency at thecenter of the low is in principle the best measure of thedeepening rate, this measure is not quantitatively veryuseful when one can only determine the position of thelow center with an accuracy of roughly 200 km, in par-ticular as the height tendency gradient near the centerof the low is very large.
Despite the problem just noted, a further analysis ismotivated by the fact that appreciable changes from theperiod of the observed rapid deepening to the maturestage of the cyclone were found in some of the indi-vidual terms in (9). From here on, the calculated heighttendencies will for simplicity be displayed as instan-taneous fields rather than as 6-h averages, apart from(]z/]t)A for which this was not possible. However, theunits meters per 6 hours will still be used.
c. Contributions of individual terms at 1200 UTC 19February
The individual contributions of the five terms in (9)to the 925-mb height tendencies at 1200/19 [or, in thecase of (]z/]t)A, between 1200/19 and 1800/19] areshown in Figs. 6a–e. Figure 6f displays the calculatedtotal height tendency, which is slightly different fromthat shown in Fig. 5c since averaging over two analysistimes is not used. Vorticity advection (Fig. 6a) and ther-mal advection (Fig. 6b) both induce a negative heighttendency on the eastern or northeastern side of the sur-face low and a positive height tendency on the oppositeside. Thus, they are important for the movement of thecyclone. However, the negative height tendency inducedby thermal advection extends well over the low centerand is several times larger than the positive height ten-
3 As noted in section 4, the calculated height change fields shownhere exclude the very longest wave components. Even with thesewaves included, however, the discrepancy was only slightly smaller.

JULY 1997 1585R A I S A N E N
FIG. 5. Height changes at 925 mb from 1200 to 1800 UTC 19 February [(a), (c), and (e)] and from 1800 UTC 20February to 0000 UTC 21 February [(b), (d), and (f)]. Panels (a) and (b) show the analyzed height changes, (c) and(d) the average of the calculated total height tendencies at the beginning and the end of each 6-h period, and (e) and(f) the height changes inferred with the NLBE from the wind analyses. Contour interval is 20 m (6 h)21; negativevalues are shaded. The crosses (3) indicate the estimated position of the surface low at 1500 UTC 19 February and2100 UTC 20 February 1979.
dency behind the low, indicating that this term also playsa substantial role in deepening the low. Vorticity ad-vection also favors the deepening, but much more mod-estly (as shown in section 5f, this is the net result oftwo opposing effects). In addition to thermal advection,a major contributor to the deepening is diabatic heating,which induces an extensive area of negative height ten-dency over and ahead of the surface low (Fig. 6d). Fric-
tion counteracts the deepening by inducing a positiveheight tendency over the low (Fig. 6c), but the mag-nitude of this term is fairly small. The ageostrophictendency term (Fig. 6e) also appears small, even thoughto some extent this may be affected by the unavailabilityof the instantaneous vorticity and temperature tenden-cies. Also note that because of the movement of thecyclone, the field shown in Fig. 6e is somewhat in the

1586 VOLUME 125M O N T H L Y W E A T H E R R E V I E W
FIG. 6. Contributions to height tendencies at 925 mb at 1200 UTC 19 February: (a) vorticity advection, (b)thermal advection, (c) friction, (d) diabatic heating, and (e) the ageostrophic tendency term (1200–1800 UTC19 February 1979). The calculated total height tendency is shown in (f). Contour interval is 10 m (6 h)21 in(a)–(e) and 20 m (6 h)21 in (f); negative values are shaded. The cross (3) indicates the position of the surfacelow.
wrong phase compared with the others. To help the in-terpretation, the cross indicating the center of the surfacelow is in Fig. 6e plotted midway between the positionsat 1200 and 1800/19 rather than at the position at theformer time.
The six fields shown in Fig. 6 are redisplayed in Fig.7 in east–west-oriented vertical cross sections along
37.58N (slightly to the north of the surface low). Aconsiderable amount of altitude dependence is seen inall of these fields. Although the contribution of vorticityadvection (Fig. 7a) has an equivalent barotropic struc-ture, the negative and positive height tendencies aremuch larger at the two sides of the upper trough near300 mb than in the lower troposphere. Thermal advec-

JULY 1997 1587R A I S A N E N
FIG. 7. As Fig. 6 but pressure–longitude cross sections along 37.58N. The cross (3) indicates the longitude ofthe surface low.
tion (Fig. 7b) strongly opposes vorticity advection above350 mb, but it reinforces this to some extent in themidtroposphere. This stratospheric–midtroposphericquadrupole appears somewhat distinct from the cells ofnegative and (weak) positive height tendency in the low-est troposphere, and as judged from the actual fields ofthermal advection, it evidently had its origin in thestrong warm and cold advections at the two sides of theupper trough. Similar to the case analyzed by Hirschbergand Fritsch (1991), the strongest advections took placebetween 200 and 400 mb, the warm advection being at
maximum over the developing surface low. The upper-level thermal advections may have made a contributionto the calculated low-level height tendencies as well,but since areas of strong warm and cold advection alsooccurred in the lower troposphere, the significance ofthis contribution remains unknown.
The positive height tendency induced by friction overthe surface low is at this time discernible below 700mb only (Fig. 7c). The negative height tendency abovethis level is not intuitively expected but is presumablyassociated with the strong and wide anticyclone that

1588 VOLUME 125M O N T H L Y W E A T H E R R E V I E W
surrounded the developing but still relatively weak low.A more marked midtropospheric reversal of sign occursin the contribution of diabatic heating (Fig. 7d); theheight decreases in the lower troposphere are accom-panied by almost equal height increases around 400 mb.Thus, diabatic heating not only acted to deepen the low-level cyclone but also amplified the western parts of theridge that preceded the upper trough (compare Fig. 7dwith Fig. 3a). This is, in fact, one of the synergisticmechanisms discussed by Uccellini et al. (1987). Byshortening the upper wave, diabatic heating indirectlyenhanced the positive vorticity advection aloft, whichin turn favored the development at lower levels. Finally,the ageostrophic tendency term (Fig. 7e) is largest inthe boundary layer; positive values of over 30 m (6 h)21
are found at 975 mb on the eastern side of the surfacelow. As was the case at other synoptic times, this termtended to oppose the sum effect of the other four in thevery lowest troposphere.
d. Contributions of individual terms at 0000 UTC 21February
The five height tendency components and their sumat 0000/21 are shown in Figs. 8 (horizontal fields at 925mb) and 9 (vertical cross sections through the center ofthe surface low at 39.48N). In addition to a number ofsimilarities, some appreciable differences from the re-sults at 1200/19 are evident. At 925 mb, all five com-ponents have now a larger magnitude than 36 h before.The marked asymmetry found in (]z/]t)T at 1200/19 hascompletely vanished (Fig. 8b), while an asymmetry ofthe opposite sense has emerged in (]z/]t)V (Fig. 8a); theheight decrease on the eastern side of the low is nowsignificantly smaller than the height increase to the westof the low. These terms have thus both changed in away that acts to decrease the deepening rate of the low,and this change is reinforced by a marked increase inthe positive height tendency induced by surface friction(Fig. 8c). On the other hand, however, the negativeheight tendency due to diabatic heating has increasedsubstantially to over 110 m (6 h)21 at maximum (Fig.8d). The ageostrophic tendency term (Fig. 8e) is stillthe smallest of the five at this level.
The clear dominance of height decreases over heightincreases in the calculated total height tendency field(Fig. 8f) is somewhat in conflict with the slowness ofthe analyzed deepening rate of the cyclone and obvi-ously calls for care in considering the results just de-scribed. A possible explanation for the discrepancy isthat the largeness of the negative (]z/]t)Q at this time isnot fully realistic. It cannot be ruled out that the model-produced heating fields have been affected, for example,by spinup effects in the 2-h forecasts used to createthem. However, it is equally difficult to rule out that(]z/]t)Q is actually correct and the problems in the cal-culated total height tendency stem from some of theother terms.
The strongest negative and positive height tendenciesinduced by vorticity advection are still found near thetropopause level (Fig. 9a), but a secondary maximumof height increase has developed over the western flankof the surface low in the lower troposphere. The largestheight tendencies due to thermal advection are now con-centrated in the lowest troposphere (Fig. 9b). In partic-ular, the positive height tendency on the rear side of thelow shows a steep vertical gradient below 800 mb, re-flecting the strong near-surface cold advection in thecold frontal zone. The positive friction-induced heighttendency over the surface low extends much higher thanat 1200/19, but values in excess of 10 m (6 h)21 arestill restricted below 600 mb (Fig. 9c). In the crosssection for diabatic heating (Fig. 9d), a vertical dipoleis still visible, although this is less symmetric than at1200/19: the marked increase in the negative height ten-dency in the lower troposphere is not accompanied byan increase in the positive height tendency aloft. Finally,the ageostrophic tendency term is still largest in thelowest troposphere (Fig. 9e).
e. Direct and indirect effects of vorticity advectionand friction
At the end of section 2, several issues were listed thatmight be relevant in discussing the physical interpre-tation of the height tendencies calculated with the pres-ent method. As the first of these issues, the direct andindirect effects of vorticity advection and friction areaddressed. The direct effect denotes here the height ten-dency obtained by substituting to (7) the vorticity ten-dency due to the first rhs term in (4) or (5). The indirecteffect, in turn, refers to the height tendency attributableto the second, third, and fourth rhs terms in (4) or (5)that stem from the vertical motions induced by the directforcing.
Figure 10 shows cross sections of the height ten-dencies induced directly and indirectly by vorticityadvection at 1200/19 (above) and 0000/21 (below).In most of the vertical plane, the direct and the indirecteffect are at both times seen to oppose each other. At0000/21, they have the same sign between 500 and900 mb near the western edge of the cross section,but this is a layer with a relatively small positivedirectly forced height tendency sandwiched betweenlarger positive tendencies above and below. Thus,even in this case, the indirect effect acts to smoothout the vertical gradients in the height tendency dis-tribution. With the exception of the lowest tropo-sphere where the direct and the indirect effect havea comparable magnitude, the former generally dom-inates over the latter.
The substantial negative and positive directly forcedheight tendencies at the two sides of the upper troughare hardly a surprising finding. What may deserve moreattention is the extended area of height increase that thedirect effect at both times yields in the lowest tropo-

JULY 1997 1589R A I S A N E N
FIG. 8. As Fig. 6 but height tendencies at 0000 UTC 21 February [(a), (b), (c), (d), and (f)] or between1800 UTC 20 February and 0000 UTC 21 February 1979 (e).
sphere. As discussed in the following subsection, thiswidespread (and particularly at 0000/21 very large) pos-itive directly forced height tendency results from anti-cyclonic vorticity advection by low-level convergentwinds.
Analogous to Fig. 10, the height tendencies induceddirectly and indirectly by friction at 0000/21 are shownin Fig. 11; 1200/19, when the cyclone was weaker, isexcluded for brevity. The direct effect (Fig. 11a) is large
in the lowest troposphere [over 200 m (6 h)21 near thecenter of the low] but negligible above 800 mb. Theindirect effect (Fig. 11b) strongly opposes the directeffect at the lowest levels, but it changes sign between875 and 825 mb and remains positive over the surfacelow up to 325 mb. Thus, Figs. 11a and 11b, togetherwith their sum in Fig. 9c, provide a nice demonstrationof the concept of Ekman pumping discussed, for in-stance, by Holton (1992, 133–139).

1590 VOLUME 125M O N T H L Y W E A T H E R R E V I E W
FIG. 9. As Fig. 8 but cross sections along 39.48N.
f. Contributions of vorticity and thermal advection bynondivergent and divergent winds
As discussed in section 2, some of the terms formallytreated as forcing in the present diagnostic system arein fact physically connected to the distribution of ver-tical motions. The most unambiguous examples are vor-ticity advection and thermal advection by divergentwind. To study the significance of this issue, the ad-vections by the nondivergent (Vc) and the divergent (Vx)winds were calculated separately. Their individual vor-
ticity tendency contributions were then computed from,for example,
]z ]z5 2V ·=(z 1 f ) 2 vx Vx1 2]t ]p
Vx
]v ]VVx1 (z 1 f ) 1 k· 3 =v , (10)Vx1 2]p ]p
where denotes the vertical motion obtained by forc-vVx

JULY 1997 1591R A I S A N E N
FIG. 10. Height tendencies induced directly [(a) and (c)] and indirectly [(b) and (d)] by vorticity advection. Thecross sections in (a) and (b) are from 37.58N at 1200 UTC 19 February and those in (c) and (d) from 39.48N at 0000UTC 21 February 1979. Contour interval is 20 m (6 h)21; negative values are shaded. The sum of (a) and (b) is shownin Fig. 7a and that of (c) and (d) in Fig. 9a.
FIG. 11. Height tendencies induced (a) directly and (b) indirectly by friction at 39.48N at 0000 UTC 21 February1979. Contour interval is 20 m (6 h)21; negative values are shaded. The sum of (a) and (b) is shown in Fig. 9c.
ing (1) with 2Vx · =(z 1 f), and the correspondingheight tendencies were estimated from (7).
The most interesting finding from this exercise wasthat vorticity advection by Vx induced a widespreadpositive height tendency around the surface low (seeFigs. 12b and 12d). This positive height tendency was
much stronger at 0000/21 than at 1200/19, and it max-imized at both times in the lowest troposphere. Althoughthis height tendency was largest somewhat to the westof the low center, especially at 0000/21, this mechanismin fact appears to be as important a brake for the de-velopment of the low-level cyclone as surface friction

1592 VOLUME 125M O N T H L Y W E A T H E R R E V I E W
FIG. 12. Height tendencies due to vorticity advection by nondivergent [(a) and (c)] and divergent wind [(b) and(d)]. (a) and (b) are cross sections along 37.58N at 1200 UTC 19 February and (c) and (d) cross sections along 39.48Nat 0000 UTC 21 February 1979. Contour interval is 10 m (6 h)21; negative values are shaded. The sum of (a) and (b)is shown in Fig. 7a and that of (c) and (d) in Fig. 9a.
FIG. 13. Divergent wind (vector scale in meters per second) andabsolute vorticity (contours every 5 3 1025 s21) at 950 mb at 0000UTC 21 February 1979.
(compare Figs. 12b and 12d with Figs. 7c and 9c). Thisimportance is a seemingly new finding. Although Hos-kins and Sardeshmukh (1987) showed that vorticity ad-vection by Vx plays a significant role in the planetary
scale, this process appears to have received little atten-tion in earlier synoptic-scale studies.
To investigate the role of vorticity advection by Vx
in more depth, a division to the directly and indirectlyforced height tendencies was made in the manner de-scribed in section 5e. The direct effect was strongest inthe lowest troposphere; above 800 mb it was actuallyvery weak. The explanation for this strong low-leveleffect contains two factors that were already qualita-tively valid at 1200/19 but were more conspicuous at0000/21 (see Fig. 13). First, there was a very steepvorticity gradient between the surrounding anticyclonicareas and the center of the low. Second, in accord withthe presence of an intense maximum of midtroposphericascent just to the northeast of the center of the low, Vx
was generally directed across this gradient toward thecore area of the cyclone. It also had a substantial mag-nitude, approaching 15 m s21 in some areas at 0000/21.Together, these factors yielded a wide area of predom-inantly anticyclonic low-level vorticity advection.
The discussion above is not to imply that vorticityadvection by Vc would have been insignificant. Thiscomponent created by far the dominant part of (]z/]t)V

JULY 1997 1593R A I S A N E N
in the mid- and upper troposphere, and it actually playedan important role in the lowest troposphere as well (seeFigs. 12a and 12c). By inducing an appreciable negativelow-level height tendency over and to the east of thelow, vorticity advection by Vc favored the deepeningof the surface low at both 1200/19 and 0000/21. Sincethe direct effect of vorticity advection by Vc was smallbelow 850 mb, these low-level height decreases musthave been indirectly forced by advection in the mid-and upper troposphere.
In contrast with the case of vorticity advection, ther-mal advection by Vx was found to be of little impor-tance. Apart from slightly enhancing the height increasein the very lowest troposphere at the western side ofthe low at 0000/21, this component was negligible com-pared with thermal advection by Vc.
g. Calculations with a simplified equation system
The system consisting of the generalized omega equa-tion (1), the complete vorticity equation (2), and thetime derivative of the NLBE (7) contains several co-efficients that vary rapidly in space and time. The lhsoperator of (1) is dependent on the three-dimensionaldistributions of hydrostatic stability and absolute vor-ticity and on the vertical wind shear. Similarly, the vor-ticity and wind distributions enter as coefficients in theterms containing v in (2). Finally, by determining thespatial derivatives of the streamfunction, the vorticitydistribution affects the second rhs term of (7). Therefore,the height tendencies calculated with this system are notdetermined by the forcing (given by vorticity advection,thermal advection, friction, diabatic heating, and theageostrophic tendency term) alone but are also affectedby the environment that controls the various nonconstantcoefficients. To demonstrate this, we use in this sub-section a simpler equation system that retains the sameforcing as our full system but by excluding some termsin converting the forcing into height tendencies largelyeliminates the influence of the environmental variations.The generalized omega equation is replaced with
2] v2 2s (p)¹ v 1 f 5 F 1 F 1 F 1 F 1 F ,0 V T F Q A2]p
(11)
where s0(p) denotes the global isobaric average of s.In accord with this change, vertical vorticity advection,the tilting term, and the term z(]v/]p) are removed fromthe vorticity equation:
]z ]v5 2V·=(z 1 f ) 1 f 1 k·= 3 F. (12)
]t ]p
Finally, the NLBE is replaced with the linear balanceequation
]z ]c2g¹ 5 =· f = . (13)1 2]t ]t
Thus, the variability of coefficients is fully eliminatedapart from the slow meridional variation of the Coriolisparameter and the average vertical variation of the hy-drostatic stability.
The total 925-mb height tendencies calculated withthe simplified system are shown in Figs. 14a (1200/19)and 14b (0000/21). The differences from the solutionof the full system (Figs. 6f and 8f) are considerable. Atboth times, the simplified system yields a somewhatlooser couplet of height decrease and height increaseand the maximum height decrease ahead of the low issubstantially smaller. The height increase at the rear sideof the low is less severely affected; it is somewhat largerat 1200/19 and slightly smaller at 0000/21. Consequent-ly, the simplified system captures the rapid deepeningof the low at 1200/19 much less well than the full sys-tem. At 0000/21, the cyclone was only slowly deepeningaccording to the FGGE analyses, so the modest weak-ening implied by the simplified system is not more un-reasonable than the marked deepening implied by thefull system. As far as the overall magnitude and spatialstructure of the height tendencies are considered, how-ever, the solution of the simplified system is even at thistime the less realistic of the two. One might argue thatthis is because this system is internally inconsistent, thatis, the forcing derives from the primitive equations butthe methods used in calculating the response follow theQG approximations (apart from that the variation of theCoriolis parameter is fully included). However, replac-ing the full forcing in this system with the QG coun-terpart (that is, vorticity advection and temperature ad-vection calculated from the geostrophic assumption)yielded equally unrealistic results (Figs. 14c,d).
To analyze the factors that created differences be-tween the full and the simplified solution, a number ofsensitivity experiments were made. These addressed, inturn, the horizontal stability variations in the omegaequation, the differences between the full vorticity equa-tion and (12) (considered together with the correspond-ing lhs terms in the omega equation), and the nonlinearterm in the NLBE. Although the effect of stability vari-ations was not found to be negligible, the majority ofthe differences between the full and the simplified so-lution appeared to be associated with the strong low-level cyclonic vorticity.
To some extent, the impact of the vorticity distribu-tion was simply associated with the nonlinear term inthe NLBE. By including this term, the NLBE approx-imately accounts for the subgeostrophy of cyclonallycurved flow in gradient wind balance and hence yields,for a given field of vorticity tendencies, larger heighttendencies in cyclonic than anticyclonic areas. At 0000/21, both the maximum negative and positive height ten-dencies were increased by roughly 50%.
However, the strong low-level cyclonic vorticity alsoaffected the calculated vorticity tendencies and did thisin a way that favored height decreases at the expenseof height increases. As the net result of two conflicting

1594 VOLUME 125M O N T H L Y W E A T H E R R E V I E W
FIG. 14. Total height tendencies at 925 mb at (a) 1200 UTC 19 February and (b) 0000 UTC 21 February 1979 ascalculated with the simplified system [Eqs. (11)–(13)]. Panels (c) and (d) are as (a) and (b) but the forcing includesonly vorticity and temperature advection evaluated by using the geostrophic assumption. Contour interval is 20 m (6h)21; negative values are shaded. The height tendencies obtained with the full system are shown in Figs. 6f and 8f.
factors, it enhanced the vorticity generation by thestretching mechanism in the area of low-level conver-gence over and to the east of the low center. On onehand, the term z(]v/]p) in (2) was large and positive.On the other hand, calculations with the omega equationindicated that [in accord with the findings of Pauley andNieman (1992) for the QE II cyclone] the cyclonic vor-ticity acted to suppress the ascent especially below 800mb, thereby weakening the convergence itself. The for-mer factor was dominant, but the latter appeared to com-pensate roughly one-half of its influence.
In addition to producing different total height ten-dencies than the full system, the simplified system yield-ed a somewhat different picture of the roles of the in-dividual forcing terms. For a striking example of this,the contributions of thermal advection and diabatic heat-ing in this system are shown in Fig. 15. As found insections 5c,d, there were important changes in theseterms between 1200/19 and 0000/21 in the full system:thermal advection strongly promoted the deepening ofthe surface low at the former time but only acted tomove the cyclone at the latter, and there was a largesimultaneous increase in the negative height tendency
due to diabatic heating. In the simplified system, thechanges from 1200/19 to 0000/21 are qualitatively sim-ilar but substantially less pronounced.
A clear though not unexpected indication of this com-parison between the simplified system (with both thefull and the QG forcing) and the full system is that, inanalyzing intense or rapidly developing cyclones, ap-proximate diagnostic techniques may be quantitativelyquite inadequate. At least in general terms, in addition,the results serve to demonstrate that the height tendencyresponse to a given forcing may be rather sensitive tothe properties of the environment. In regard to the spe-cific implications for the development of the Presidents’Day cyclone, however, one must be careful. For ex-ample, a tempting conclusion one might like to makeis that the strong low-level cyclonic vorticity made theheight tendencies near the center of the surface low morenegative at both 1200/19 and 0000/21 and thus accel-erated the explosive development of the storm and aidedto prolong its subsequent slower deepening. This rea-soning may well be qualitatively correct at least as faras the period of rapid deepening is concerned; the roleof the low-level cyclonic vorticity in accelerating the

JULY 1997 1595R A I S A N E N
FIG. 15. Contributions of thermal advection [(a) and (b)] and diabatic heating [(c) and (d)] to height tendencies at925 mb as calculated with the simplified system. Contour interval is 10 m (6 h)21; negative values are shaded.
rapid development in this particular case was also em-phasized by Bosart and Lin (1984), and further supportto this idea is provided by the more general study ofGyakum et al. (1992). However, the important compli-cation that must be stressed is that the forcing and theenvironment are not rigorously independent from eachother. In particular, if the low-level cyclonic vorticity hadbeen weaker or absent, two important damping mecha-nisms would necessarily have been less efficient. Withno significant low-level vorticity gradients, the strongnegative vorticity advection by Vx could not have existed.Likewise, if there had been no cyclonal low-level cir-culation, friction would not have acted to destroy it.
6. Summary and discussion
Height tendency dynamics were studied with a systemconsisting of three equations. By using a generalizedomega equation and the vorticity equation, five compo-nents of vorticity tendency were first computed. The com-ponents due to vorticity advection and friction includedboth the vorticity tendency directly created by these pro-cesses and the indirect contribution from the vertical mo-tions induced by them, while the other three (attributableto thermal advection, diabatic heating, and an ageostroph-
ic tendency term) only consisted of the indirect contri-bution. The corresponding five height tendency compo-nents were estimated by substituting the vorticity ten-dency components to a nonlinear balance equation.
The system was applied to an analysis of the Presi-dents’ Day cyclone in February 1979, with the mainfocus on two synoptic times, one (1200/19) during theexplosive development and the other (0000/21) duringthe maturity of the cyclone. A large part of the rapiddeepening of the low-level cyclone at 1200/19 wasfound to be attributable to thermal advection and dia-batic heating, which were of roughly equal importance.At 0000/21, thermal advection only appeared to prop-agate the cyclone, but in striking and perhaps surprisingcontrast, a much larger negative height tendency due todiabatic heating was actually found than at 1200/19.
The impact of vorticity advection was twofold: theadvections by the nondivergent (Vc) and the divergentwind (Vx) were found to play very different roles. Theformer made a significant contribution to deepen thesurface low at both 1200/19 and 0000/21, but the latteracted to fill the low. Vorticity advection by Vx was infact found to be as important a damping mechanism forthe low-level cyclone as surface friction, and, as in thecase of friction, the positive height tendency induced

1596 VOLUME 125M O N T H L Y W E A T H E R R E V I E W
by it increased substantially from 1200/19 to 0000/21.The importance of this process is an interesting findingthat seems to have been to some extent overlooked inearlier studies of cyclone dynamics. Obviously, how-ever, this importance is also somewhat disturbing: al-though formally treated as such in the present diagnosticsystem, Vx is not physically independent of v. Thisactually inspires us to suggest a possible modificationto the system (see the last paragraph of this text).
Some important insights were also gained by dividingthe contributions of vorticity advection and friction intoparts associated with the direct forcing and the indirectforcing due to the vertical motions induced. In particular,the efficiency of vertical motions in smoothing out thevertical gradients in the direct forcing was demonstrated.
Finally, it is clear that the present analysis has leftmany issues unresolved. The calculated height tendenciesimplied a somewhat too small deepening rate for thecyclone at 1200/19 and a too large deepening rate at 0000/21. While it is difficult to attribute these problems to anysingle factor, it cannot be ruled out, for example, that themodel-produced diabatic heating at the latter time wasto some extent too strong, resulting in an overestimateof the negative height tendency induced by this term.Likewise, the large differences between the results of thesimplified equation system in section 5g and those of thefull system do raise some questions. The basic impli-cation that cyclone development is not determined by thestrength of the forcing alone but may as much dependon a suitable environment is, although in agreement withearlier research (e.g., Reed 1990; Uccellini 1990; Gyak-um et al. 1992), somewhat disappointing for anyoneyearning for simple explanations. At the same time, thesedifferences serve to remind us that the conclusions oneobtains from height tendency calculations may be sen-sitive to relatively subtle details in the methodology. Inthis context, it is good to recall that the present approachfor eliminating vertical motions as an independent forcingagent is not unique. As noted in section 2, one could alsoproceed, after solving the generalized omega equation,by using the thermodynamic equation approach ofHirschberg and Fritsch (1991) or the Tsou et al. (1987)height tendency equation. Whether these choices wouldlead to significantly different diagnostics is an obviousissue for further study.
Another suggestion for future studies concerns theadvections by the divergent wind. In the present study,these were formally treated as independent forcingmechanisms, neglecting the inherent physical depen-dence of Vx from v via the continuity equation. Had itbeen found that vorticity and temperature advection byVx would both have been unimportant, this neglectwould be of little concern. However, as this was clearlynot the case, the following procedure might be worthconsidering in future studies, even though this wouldcomplicate the calculations. It would be possible to re-formulate the diagnostic system so that the direct ad-vective forcing in the omega and vorticity equations
would only contain the advections by Vc. Vorticity andtemperature advection by Vx would be moved to the lhsof the omega equation and Vx would be solved simul-taneously with v in the way discussed by Krishnamurti(1968). In the vorticity equation, vorticity advection byVx would then be treated as part of the indirect forcing.Since the system would still be linear with respect tothe quantities solved [at least if we neglect in L(v) andin the vorticity equation the dependence of ]V/]p fromVx], a division of ]z/]t into five parts would still beobtained. Now, however, the first two parts would beassociated with vorticity and temperature advection byVc rather than with the advections by the total wind. Inthis way, the important but physically unindependentcontribution of vorticity advection by Vx would be di-vided between other processes.
Acknowledgments. The basic idea of this study orig-inates from a discussion with Melvyn A. Shapiro duringhis visit to Helsinki in September 1993. Other personsspecially acknowledged are Klaus Arpe and Sakari Up-pala for providing the ECMWF data and Eero Holo-painen and the anonymous reviewers for their commentson the manuscript. The author of the study is presentlyfinanced by the Academy of Finland.
REFERENCES
Bosart, L. F., 1981: The Presidents’ Day snowstorm of 18–19 Feb-ruary 1979: A subsynoptic-scale event. Mon. Wea. Rev., 109,1542–1566., and S. C. Lin, 1984: A diagnostic analysis of the Presidents’Day storm of February 1979. Mon. Wea. Rev., 112, 2148–2177.
Charney, J., 1955: The use of the primitive equations of motion innumerical prediction. Tellus, 7, 22–26.
Davis, C. A., E. D. Grell, and M. A. Shapiro, 1996: The balanceddynamical nature of a rapidly intensifying oceanic cyclone. Mon.Wea. Rev., 124, 3–26.
Gyakum, J. R., P. J. Roebber, and T. A. Bullock, 1992: The role ofantecedent surface vorticity development as a conditioning pro-cess in explosive cyclone intensification. Mon. Wea. Rev., 120,1465–1489.
Haltiner, J. G., and R. T. Williams, 1980: Numerical Prediction andDynamic Meteorology. Wiley and Sons, 477 pp.
Hirschberg, P. A., and J. M. Fritsch, 1991: Tropopause undulationsand the development of extratropical cyclones. Part II: Diag-nostic analysis and conceptual model. Mon. Wea. Rev., 119, 518–550.
Holton, J. R., 1992: An Introduction to Dynamic Meteorology. 3d ed.Academic Press, 511 pp.
Hoskins, B. J., and P. D. Sardeshmukh, 1987: Transient eddies andthe seasonal mean rotational flow. J. Atmos. Sci., 44, 328–338.
Khrishnamurti, T. N., 1968: A diagnostic balance model for studiesof weather systems of low and high latitudes, Rossby numberless than 1. Mon. Wea. Rev., 96, 197–207.
Pauley, P. M., and S. J. Nieman, 1992: A comparison of quasigeos-trophic and nonquasigeostrophic vertical motions for a rapidlyintensifying marine extratropical cyclone. Mon. Wea. Rev., 120,1108–1134.
Raisanen, J., 1995: Factors affecting synoptic-scale vertical motions:A statistical study using a generalized omega equation. Mon.Wea. Rev., 123, 2447–2460.
Reed, R. J., 1990: Advances in knowledge and understanding ofextratropical cyclones during the past quarter century: An over-

JULY 1997 1597R A I S A N E N
view. Extratropical Cyclones. The Erik Palmen Memorial Vol-ume, C. Newton and E. O. Holopainen, Eds., Amer. Meteor. Soc.,27–45.
Tan, Y.-C., and J. A. Curry, 1993: A diagnostic study of the evolutionof an intense North American anticyclone during winter 1989.Mon. Wea. Rev., 121, 961–975.
Tsou, C.-H., and P. J. Smith, 1990: The role of synoptic/planetary-scale interactions during the development of a blocking anti-cyclone. Tellus, 42A, 174–193., , and P. M. Pauley, 1987: A comparison of adiabatic anddiabatic forcing in an intense extratropical cyclone system. Mon.Wea. Rev., 115, 763–786.
Uccellini, L. W., 1990: Processes contributing to the rapid devel-opment of extratropical cyclones. Extratropical Cyclones. TheErik Palmen Memorial Volume, C. Newton and E. O. Holopai-nen, Eds., Amer. Meteor. Soc., 81–105., P. J. Kocin, R. A. Petersen, C. H. Wash, and K. F. Brill, 1984:
The Presidents’ Day cyclone of 18–19 February 1979: Synopticoverview and analysis of the subtropical jet streak influencingthe pre-cyclogenetic period. Mon. Wea. Rev., 112, 31–55., D. Keyser, K. F. Brill, and C. H. Wash, 1985: The Presidents’Day cyclone of 18–19 February 1979: Influence of upstreamtrough amplification and associated tropopause folding on rapidcyclogenesis. Mon. Wea. Rev., 113, 962–988., R. A. Petersen, K. F. Brill, P. J. Kocin, and J. Tuccillo, 1987:Synergistic interactions between an upper-level jet streak anddiabatic processes that influence the development of a low-leveljet and a secondary coastal cyclone. Mon. Wea. Rev., 115, 2227–2261.
Wergen, W., 1988: The diabatic ECMWF normal mode initialisationscheme. Beitr. Phys. Atmos., 61, 274–302.
Whitaker, J. S., L. W. Uccellini, and K. F. Brill, 1988: A model-baseddiagnostic study of the rapid development phase of the Presi-dents’ Day cyclone. Mon. Wea. Rev., 116, 2337–2365.