heis and regions: reflecting on the outcomes and ... · - graduates 430,000 ... applications or the...
TRANSCRIPT

1
HEIs and regions: reflecting on the outcomes and recommendations of the OECD project
Emilio Barbera-GuillemRegional Vice Minister of Science and High Education (Comunidad Valenciana, Spain)
The valencian Community in international context
4.806.90810,75%206,7 hab./km²
Population- Total (2006)- % of Spain- P. Density
23.255 km²4,6%
Surface- total- % of Spain
7.150.000324 hab./km²
Population- Total (2006)- P. Density
22.145 km²Surface- totalGPD = 0.12 Trillion US$
GPD = 0.17 Trillion US$
- Graduates 430,000- HEIs students 146,000

2
The valencian Community in international context
4.806.90810,75%206,7 hab./km²
Population- Total (2006)- % of Spain- P. Density
23.255 km²4,6%
Surface- total- % of Spain
4.228.00015 hab./km²
Population- Total (2006)- P. Density
268.680 km²Surface- total
GPD = 0.12 Trillion US$
GPD = 0.10 Trillion US$
- Graduates 430,000- HEIs students 146,000
Trends in valencian college student population
Distribution of students in universities by areas of knowledge 2004
AREA OF KNOWLEDGE TOTAL
Humanities 9.5%Social Sciences 42.5%
Sub-total = 52%Engineering and Technology 32.4%Exact and Natural Sciences 7.6%
Sub-total = 40%
Health Sciences 8.0%
Source: Ministry of Education and Science. Forecast 2004-2005

3
A wise statement of Dr. G. Forteza
“This leukemia will not kill you…”Dr. G. Forteza Bover (oncologist), Valencia 1970
A wise statement of Joseph Donnelly
“I don’t wish to fight you…”Joseph Donnelly (Irish emigrant), Boston 1893

4
The Peer Review Team does report that:
•“There are approximately 146,000 students enrolled in the Valencian HEIs, and of these, 13,000 are in the private sector”.
•“Universities have satisfactory figures for overall research activity”.
Nevertheless, the Peer Review Team considers:
• “It appears that there is currently a dual situation in both the Valencian university system and, in general, the Spanish university system.
• On the one hand…
• On the other hand, there is evidence that the contribution of universities to development, such as continuing education and technology transfer, have not progressed enough.
• It could be said that there has been progress in the generation of knowledge but not in its dissemination”.
5
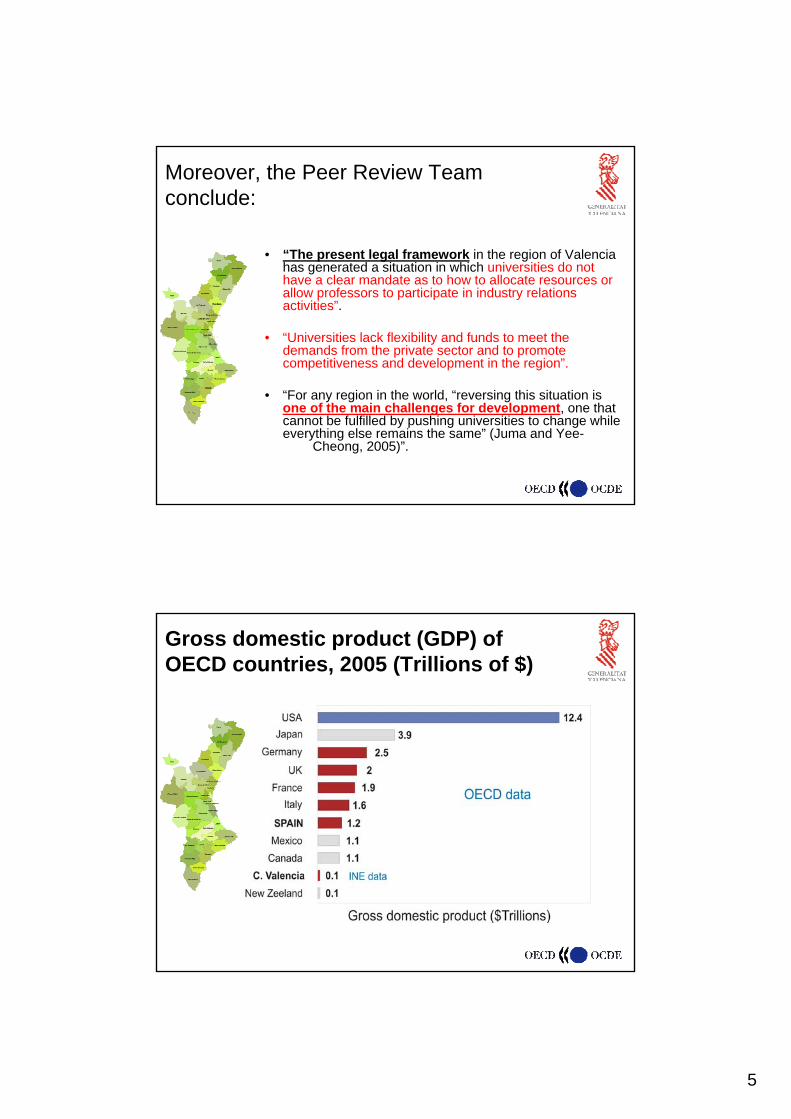
Moreover, the Peer Review Team conclude:
• “The present legal framework in the region of Valencia has generated a situation in which universities do not have a clear mandate as to how to allocate resources or allow professors to participate in industry relations activities”.
• “Universities lack flexibility and funds to meet the demands from the private sector and to promote competitiveness and development in the region”.
• “For any region in the world, “reversing this situation is one of the main challenges for development, one that cannot be fulfilled by pushing universities to change while everything else remains the same” (Juma and Yee-
Cheong, 2005)”.
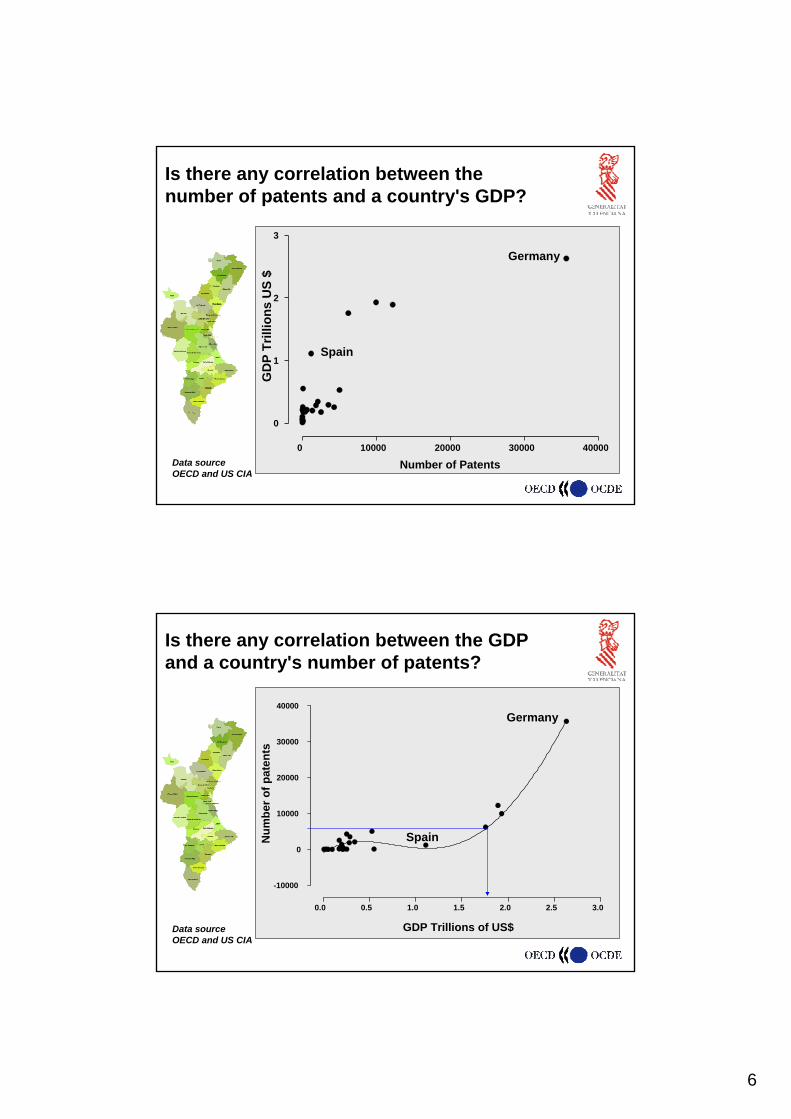
Gross domestic product (GDP) of OECD countries, 2005 (Trillions of $)
6
0 10000 20000 30000 40000
0
1
2
3
Number of Patents
GD
P Tr
illio
ns U
S $
Is there any correlation between the number of patents and a country's GDP?
Data sourceOECD and US CIA
Spain
Germany
0.0 0.5 1.0 1.5 2.0 2.5 3.0
-10000
0
10000
20000
30000
Is there any correlation between the GDP and a country's number of patents?
Spain
Germany
Data sourceOECD and US CIA
40000
GDP Trillions of US$
Num
ber o
f pat
ents

7
US+EU patent production (Awarded in 2004)
10.42%10.95%22.95%42.85%35651.48Germany
3.58%3.76%7.88%14.71%12241.55France
2.91%3.06%6.42%11.99%9974.48United Kingdom
1.82%1.91%4.01%7.49%6231.44Italy
1.48%1.55%3.26%6.08%5062.38Netherlands
1.26%1.33%2.78%5.19%4319.75Switzerland
1.04%1.09%2.28%4.26%3545.66Sweden
0.75%0.78%1.64%3.07%2553.88Finland
0.62%0.65%1.37%2.55%2120.99Belgium
0.55%0.58%1.21%2.26%1882.29Austria
0.41%0.43%0.89%1.67%1389.04Denmark
0.36%0.37%0.79%1.47%1219.53Spain
0.19%0.20%0.42%0.78%652.19Norway
0.12%0.13%0.27%0.51%426.90Ireland
0.12%0.13%0.27%0.49%411.72Russian Federation
Data from OECD, US-CIA and VOIP
Contribution to the regional developmentData reported by the Universities of Comunidad Valenciana
Example of University contribution to regional development in Valencia
51%65%52%79%80%Special education programs
29%33%33%33%100%Startup companies (TBC)
17%0%11%14%14%Patent Licensing
53%52%34%31%45%Technology cooperation & Consulting
63%63%59%61%62%R&D contracts
20042003200220012000Contribution to regional agents
8
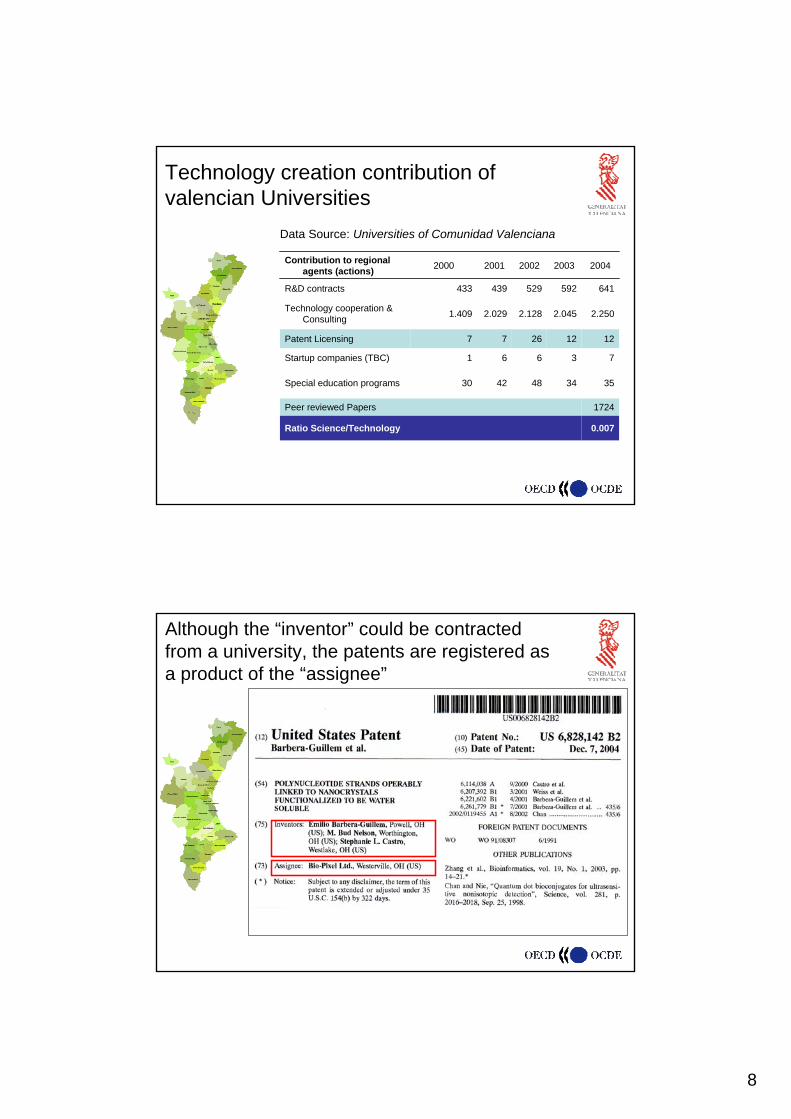
Technology creation contribution of valencian Universities
0.007Ratio Science/Technology
1724Peer reviewed Papers
3534484230Special education programs
73661Startup companies (TBC)
12122677Patent Licensing
2.2502.0452.1282.0291.409Technology cooperation & Consulting
641592529439433R&D contracts
20042003200220012000Contribution to regional agents (actions)
Data Source: Universities of Comunidad Valenciana
Although the “inventor” could be contracted from a university, the patents are registered as a product of the “assignee”
9
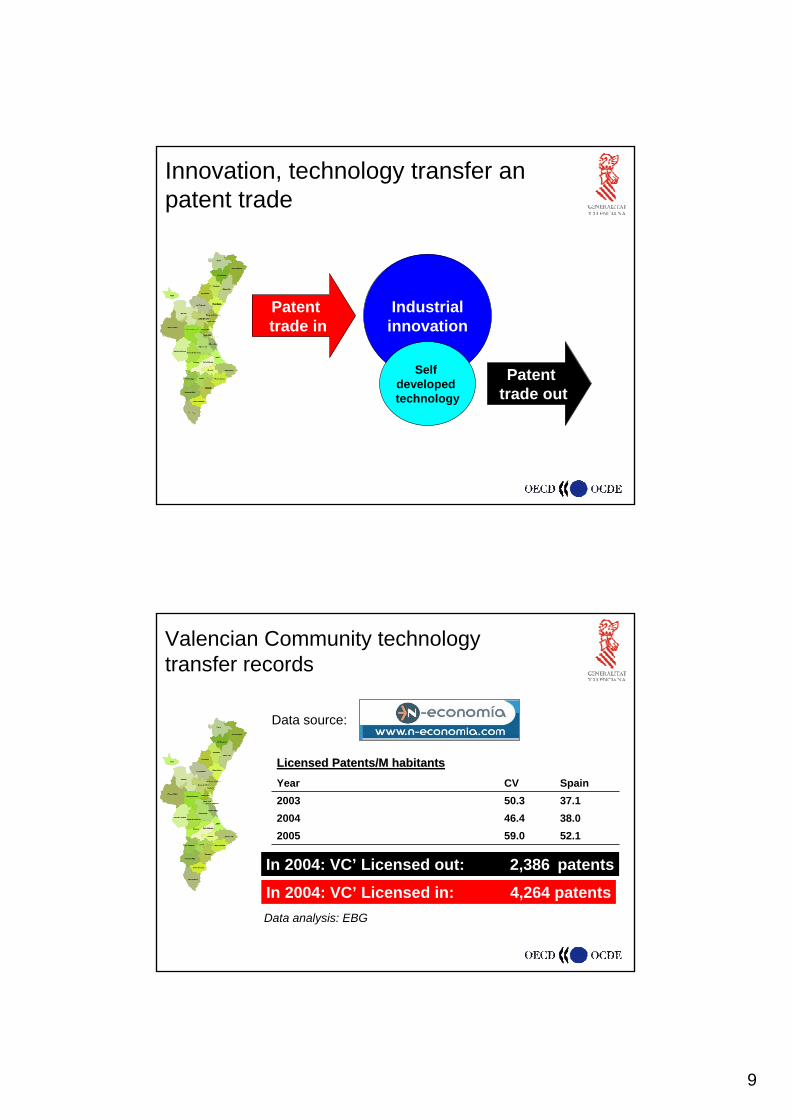
Innovation, technology transfer an patent trade
Industrialinnovation
Self developed technology
Patent trade out
Patent trade in
Valencian Community technology transfer records
Licensed Patents/M habitantsLicensed Patents/M habitants
In 2004: VC’ Licensed in: 4,264 patents
SpainCVYear
52.159.0200538.046.4200437.150.32003
Data source:
In 2004: VC’ Licensed out: 2,386. patents
Data analysis: EBG
10
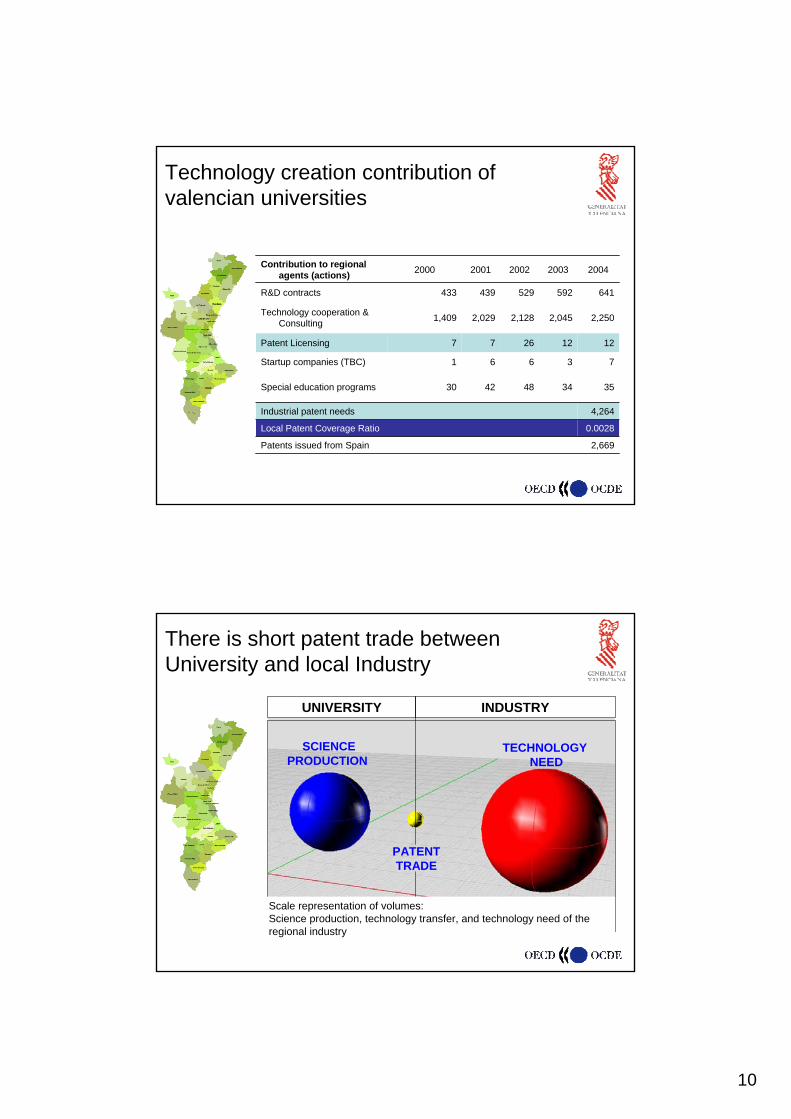
Technology creation contribution of valencian universities
2,669Patents issued from Spain
0.0028Local Patent Coverage Ratio
4,264Industrial patent needs
3534484230Special education programs
73661Startup companies (TBC)
12122677Patent Licensing
2,2502,0452,1282,0291,409Technology cooperation & Consulting
641592529439433R&D contracts
20042003200220012000Contribution to regional agents (actions)
There is short patent trade between University and local Industry
SCIENCEPRODUCTION
PATENTTRADE
TECHNOLOGY NEED
UNIVERSITY INDUSTRY
Scale representation of volumes: Science production, technology transfer, and technology need of the regional industry
11
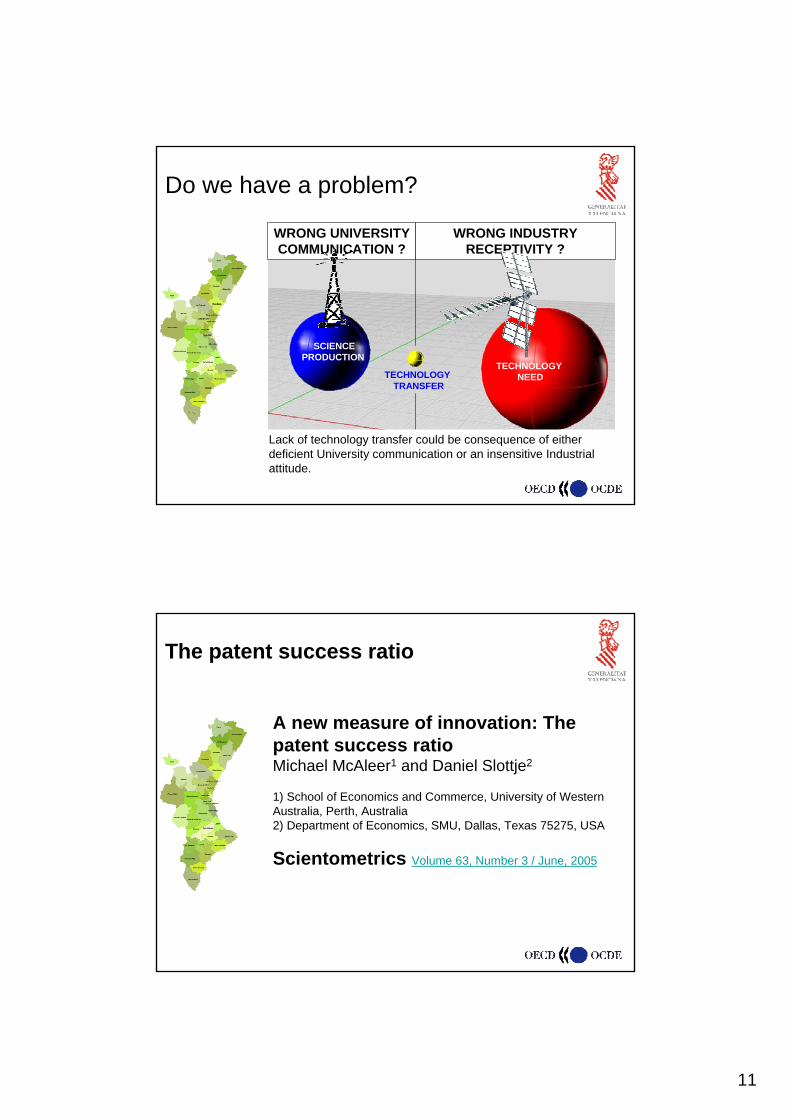
Do we have a problem?
SCIENCEPRODUCTION
TECHNOLOGY TRANSFER
TECHNOLOGY NEED
WRONG UNIVERSITY COMMUNICATION ?
WRONG INDUSTRY RECEPTIVITY ?
Lack of technology transfer could be consequence of either deficient University communication or an insensitive Industrial attitude.
The patent success ratio
A new measure of innovation: The patent success ratioMichael McAleer1 and Daniel Slottje2
1) School of Economics and Commerce, University of Western Australia, Perth, Australia 2) Department of Economics, SMU, Dallas, Texas 75275, USA
Scientometrics Volume 63, Number 3 / June, 2005

12
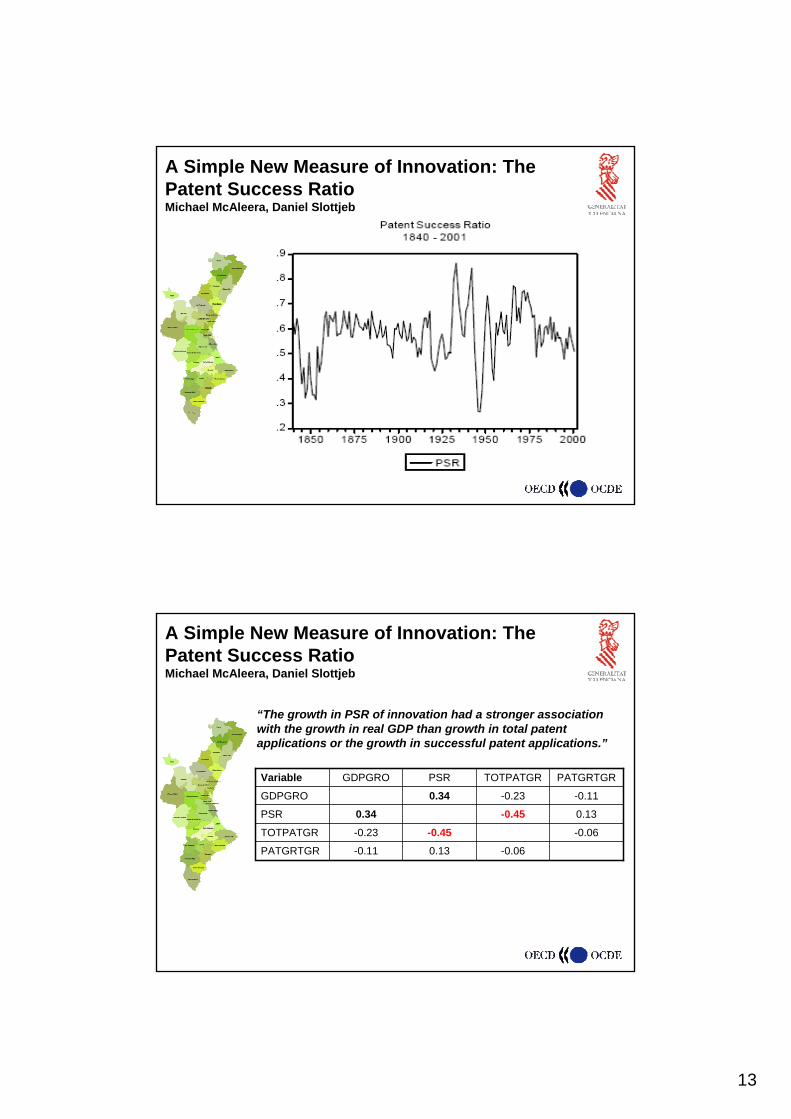
A Simple New Measure of Innovation: The Patent Success RatioMichael McAleera, Daniel Slottjeb
Additional readings on McAleera, Slottjebpaper.
WWII = 20 years of technology delay
13
A Simple New Measure of Innovation: The Patent Success RatioMichael McAleera, Daniel Slottjeb
A Simple New Measure of Innovation: The Patent Success RatioMichael McAleera, Daniel Slottjeb
“The growth in PSR of innovation had a stronger association with the growth in real GDP than growth in total patent applications or the growth in successful patent applications.”
-0.060.13-0.11PATGRTGR
-0.06-0.45-0.23TOTPATGR
0.13-0.450.34PSR
-0.11-0.230.34GDPGRO
PATGRTGRTOTPATGRPSRGDPGROVariable
14
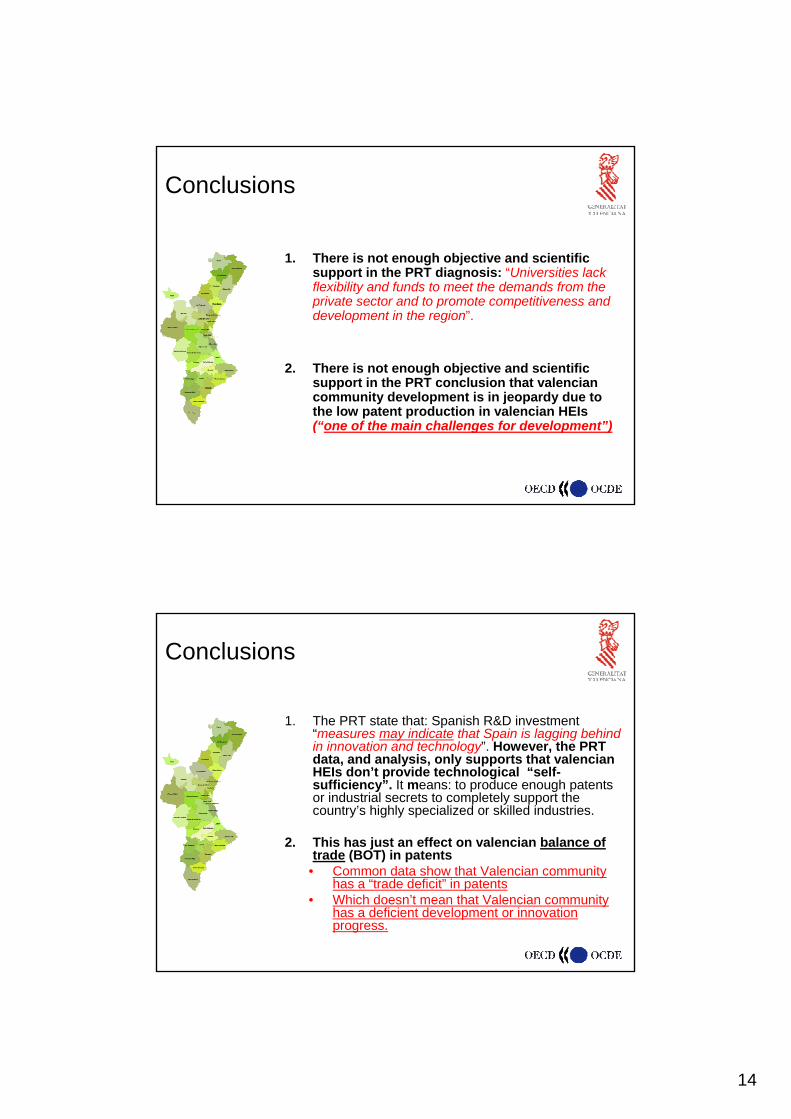
Conclusions
1. There is not enough objective and scientific support in the PRT diagnosis: “Universities lack flexibility and funds to meet the demands from the private sector and to promote competitiveness and development in the region”.
2. There is not enough objective and scientific support in the PRT conclusion that valenciancommunity development is in jeopardy due to the low patent production in valencian HEIs(“one of the main challenges for development”)
Conclusions
1. The PRT state that: Spanish R&D investment “measures may indicate that Spain is lagging behind in innovation and technology”. However, the PRT data, and analysis, only supports that valencianHEIs don’t provide technological “self-sufficiency”. It means: to produce enough patents or industrial secrets to completely support the country’s highly specialized or skilled industries.
2. This has just an effect on valencian balance of trade (BOT) in patents
• Common data show that Valencian community has a “trade deficit” in patents
• Which doesn’t mean that Valencian community has a deficient development or innovation progress.
15
A wise statement of Dr. E. Barbera
“this leukemia will not kill us…”Dr. E. Barbera-Guillem (MD, PhD), Valencia 2007
“I don’t wish to fight you…” but…
Thank You!
City of Valencia, September 19, 2007