hellenic petroleum company presentation hellenic petroleum company presentation dr e. tzellas...
TRANSCRIPT

Hellenic Petroleum Company Presentation
Hellenic Petroleum Company Presentation
Dr E. TzellasChairman and Managing Director
Dr E. TzellasChairman and Managing Director
4th Annual Capital Link Forum Conference
New York
October 30, 2000
4th Annual Capital Link Forum Conference
New York
October 30, 2000

Business Business EnvironmentEnvironment

-3-
Total Primary Energy Demand (PED)Total Primary Energy Demand (PED)Total Primary Energy Demand (PED)Total Primary Energy Demand (PED) Structure of Energy SupplyStructure of Energy SupplyStructure of Energy SupplyStructure of Energy Supply
CAGRCAGR2000-20102000-2010
Source: Source: IEAIEA Source: Source: IEAIEA
4.4%4.4%
4.4%4.4%2.7%2.7%
0.3%0.3%
CAGR (2000-2010) 3.8%
CAGR (2000-2010) 3.8%
00
1010
2020
3030
4040
5050
19901990 19951995 20002000 20052005 20102010
(mto
e)
(mto
e)
OtherOther CoalCoal GasGas OilOil
4%4% 4%4%6%6%
3%3%
7%7%
3%3%6%6%
0%0%
20%20%
40%40%
60%60%
80%80%
100%100%
19951995 20002000 20052005 20102010
CoalCoal OilOil GasGas OtherOther
35%35% 32%32% 39%39% 29%29%
60%60% 58%58% 59%59% 62%62%
Greek Energy MarketGreek Energy Market
Benefit from geographical positionBenefit from geographical position No major natural sources of energy except for ligniteNo major natural sources of energy except for lignite Oil and coal provide 58% and 33% respectively of PEDOil and coal provide 58% and 33% respectively of PED Development of natural gas infrastructure is progressing well and is strongly Development of natural gas infrastructure is progressing well and is strongly
supported by the Government and EUsupported by the Government and EU

-4-
Drivers of GrowthDrivers of Growth
00
55
1010
1515
2020
2525
19901990 19951995 20002000 20052005 20102010
IndustryIndustry Residential/CommercialResidential/Commercial TransportTransport OtherOther
(mto
e(m
toe
))
Oil Consumption by SectorOil Consumption by SectorOil Consumption by SectorOil Consumption by Sector Natural Gas InfrastructureNatural Gas InfrastructureNatural Gas InfrastructureNatural Gas Infrastructure
Key drivers: growth in transportation and residential consumption
Source: IEA
CAGR (2000-2010) 4.4%
CAGR (2000-2010) 4.4%
(EU Average: 1.3%)
(EU Average: 1.3%)

-5-
Regional Environment - Growth PotentialRegional Environment - Growth PotentialRegional Environment - Growth PotentialRegional Environment - Growth Potential
Economic recovery and the need for modernisation of the oil and gas Economic recovery and the need for modernisation of the oil and gas
sectors in the region is expected to provide significant opportunities to sectors in the region is expected to provide significant opportunities to
expand product sales into the neighbouring countriesexpand product sales into the neighbouring countries

Business ActivitiesBusiness Activities

-7-
Refining - Current positionRefining - Current position
50% of the refining capacity in 50% of the refining capacity in
Greece and 57% of the marketGreece and 57% of the market
Competitive advantagesCompetitive advantages::– strategic position strategic position – complexitycomplexity– strong logistics infrastructurestrong logistics infrastructure– unified operationsunified operations
Significant investment on stream at Significant investment on stream at the end of 1999the end of 1999
Production in compliance to Auto Oil Production in compliance to Auto Oil
I specifications I specifications Aspropyrgos
Refinery
Aspropyrgos
Refinery
Thessaloniki
Refinery
Skopje
Refinery
Skopje
Refinery
Crude PipelineCrude Pipeline
Burgas
Alexandroupolis
pipeline
(proposed)
Burgas
Alexandroupolis
pipeline
(proposed)

-8-
Environmental 1166 77 2233
Logistics 1133 33 1166
Capacity and complexity increases 3344 116677 220011
Other 1188 1111 2299
Total 8811 118888 226699
Refining - Going forwardRefining - Going forward
High growth in domestic and export salesHigh growth in domestic and export sales
Substantial capex toSubstantial capex to::
– increase capacity and complexityincrease capacity and complexity
– increase margins and reduce costsincrease margins and reduce costs
– increase light product yieldsincrease light product yields
– produce on produce on Auto Oil II specificationsAuto Oil II specifications
Refining capex Drs bnRefining capex Drs bn Refining capex Drs bnRefining capex Drs bn 2000E - 2001E2000E - 2001E2000E - 2001E2000E - 2001E 2002E - 2004E2002E - 2004E2002E - 2004E2002E - 2004ETotalTotal
2000 - 20042000 - 2004TotalTotal
2000 - 20042000 - 2004

-9-
Marketing - Current PositionMarketing - Current Position
Leading market shareLeading market share
Presence in more than 1600 retail Presence in more than 1600 retail
stationsstations
Well perceived brand namesWell perceived brand names
High quality fuels and lubricantsHigh quality fuels and lubricants
Country-wide coverageCountry-wide coverage
Strong logistics infrastructureStrong logistics infrastructure
Strong position in LPG and industrial Strong position in LPG and industrial
salessales

-10-
Marketing - Going ForwardMarketing - Going Forward
Increase market share through acquisitions Increase market share through acquisitions
Upgrade the retail network Upgrade the retail network
Expand retail network outside GreeceExpand retail network outside Greece
Development of non - fuel retail salesDevelopment of non - fuel retail sales
Development of motorway service station networkDevelopment of motorway service station network
Marketing Capex, Drs bnMarketing Capex, Drs bnMarketing Capex, Drs bnMarketing Capex, Drs bn 2000E - 2001E2000E - 2001E2000E - 2001E2000E - 2001E 2002E - 2004E2002E - 2004E2002E - 2004E2002E - 2004ETotal Total
2000 - 20042000 - 2004Total Total
2000 - 20042000 - 2004
Acquisitions 2255 -- 2255
Organic Growth 11 44 55
Retail Stations Modernisation 66 1100 1166
Logistics – Other 1111 22 2200
Total 4433 2244 6677

-11-
Petrochemicals - Current PositionPetrochemicals - Current Position
Only volume producer in GreeceOnly volume producer in Greece
Leading market positionLeading market position
Integrated with refining operationsIntegrated with refining operations
Strong geographical location Strong geographical location
advantage over importsadvantage over imports
Restructuring programme well Restructuring programme well
underwayunderway
Start up of BOPP film plant (Start up of BOPP film plant (DIAXON)DIAXON)
Thessaloniki industial complexThessaloniki industial complexPVC production unit PVC production unit

-12-
Petrochemicals - Going ForwardPetrochemicals - Going Forward
Development of new, high growth and high margin Development of new, high growth and high margin
productsproducts
Further closure/downsizing of unprofitable unitsFurther closure/downsizing of unprofitable units
Profit improvement programme in petrochemical Profit improvement programme in petrochemical
operations after success in refiningoperations after success in refining
Petrochemicals capex, Drs bnPetrochemicals capex, Drs bnPetrochemicals capex, Drs bnPetrochemicals capex, Drs bn 2000E - 2001E2000E - 2001E2000E - 2001E2000E - 2001E 2002E - 2004E2002E - 2004E2002E - 2004E2002E - 2004ETotalTotal
2000 - 20042000 - 2004TotalTotal
2000 - 20042000 - 2004
Polypropylene Plant 3377 -- 3377
ΒΟΡΡ – film plant 99 55 1144
Upgrade of existing units 11 -- 11
Logistics – other 33 11 44
Total 5500 66 5566

-13-
Exploration and Production - Current PositionExploration and Production - Current Position
Exclusive rights over 54000 KmExclusive rights over 54000 Km2 2 in in
GreeceGreece
Participation in exploration in 4 areas in Participation in exploration in 4 areas in
Western Greece in consortia with Western Greece in consortia with
international companiesinternational companies
Right to receive royalties for any Right to receive royalties for any
production in Greeceproduction in Greece
Natural Gas field in EpanomiNatural Gas field in Epanomi
Participation (30%) with OMV in by-back Participation (30%) with OMV in by-back
service contract in Iranservice contract in Iran
Evaluation of E&P projects in Albania, Evaluation of E&P projects in Albania,
LibyaLibya
Strong commercial relationships with Strong commercial relationships with
producing countriesproducing countries

-14-
Participate in consortia for production sharing agreements internationally
Leverage of Greek acreage portfolio to attract JV partners
E&P in Greece 22 11 33
Epanomi gas field development 66 55 1111
E&P Internationally 3344 1155 4499
Acquisitions – Other 1133 11 1144
Total 5555 2222 7777
E&P capex, Drs bnE&P capex, Drs bnE&P capex, Drs bnE&P capex, Drs bn 2000E - 2001E2000E - 2001E2000E - 2001E2000E - 2001E 2002E - 2004E2002E - 2004E2002E - 2004E2002E - 2004ETotalTotal
2000 - 20042000 - 2004TotalTotal
2000 - 20042000 - 2004
Exploration and Production - Going ForwardExploration and Production - Going Forward

-15-
Asprofos Asprofos Asprofos Asprofos
Largest engineering company in Largest engineering company in
SE EuropeSE Europe
Activities currently focus on Activities currently focus on
projects within the Groupprojects within the Group
Rapildy expanding engineering Rapildy expanding engineering
services to third parties and abroadservices to third parties and abroad

-16-
Natural Gas - Current PositionNatural Gas - Current Position
Main infrastructure already in Main infrastructure already in
place place
High demand growth rates High demand growth rates
Market liberalisation from 2007Market liberalisation from 2007
Substantial EU fundingSubstantial EU funding
35% stake in DEPA35% stake in DEPA
Option to acquire the remainder Option to acquire the remainder
from the Greek Statefrom the Greek State

-17-
Participation in DEPA 6644 -- 6644
Capex 1111 1144 2255
Total 7755 1144 8899
Natural Gas - Going ForwardNatural Gas - Going Forward
Strong expected demand growthStrong expected demand growth
Development of new business based on Development of new business based on Natural Gas feedNatural Gas feed
Introduction of strategic investors/operators Introduction of strategic investors/operators entryentry
Expansion of household consumption Expansion of household consumption
Natural Gas capex, Drs bnNatural Gas capex, Drs bnNatural Gas capex, Drs bnNatural Gas capex, Drs bn 2000E - 2001E2000E - 2001E2000E - 2001E2000E - 2001E 2002E - 2004E2002E - 2004E2002E - 2004E2002E - 2004ETotalTotal
2000 - 20042000 - 2004
TotalTotal
2000 - 20042000 - 2004

Financial HighlightsFinancial Highlights(IAS)(IAS)

-19-
Group Net Income and CapexGroup Net Income and CapexGroup Net Income and CapexGroup Net Income and Capex
18,222,5
66,3
91,9
35,347,8
0
10
20
30
40
50
60
70
80
90
100
Net Income before taxes Capex
Drs Billion
1997 1998 1999
+ 94%+ 94%
+ 88%+ 88%
-20-
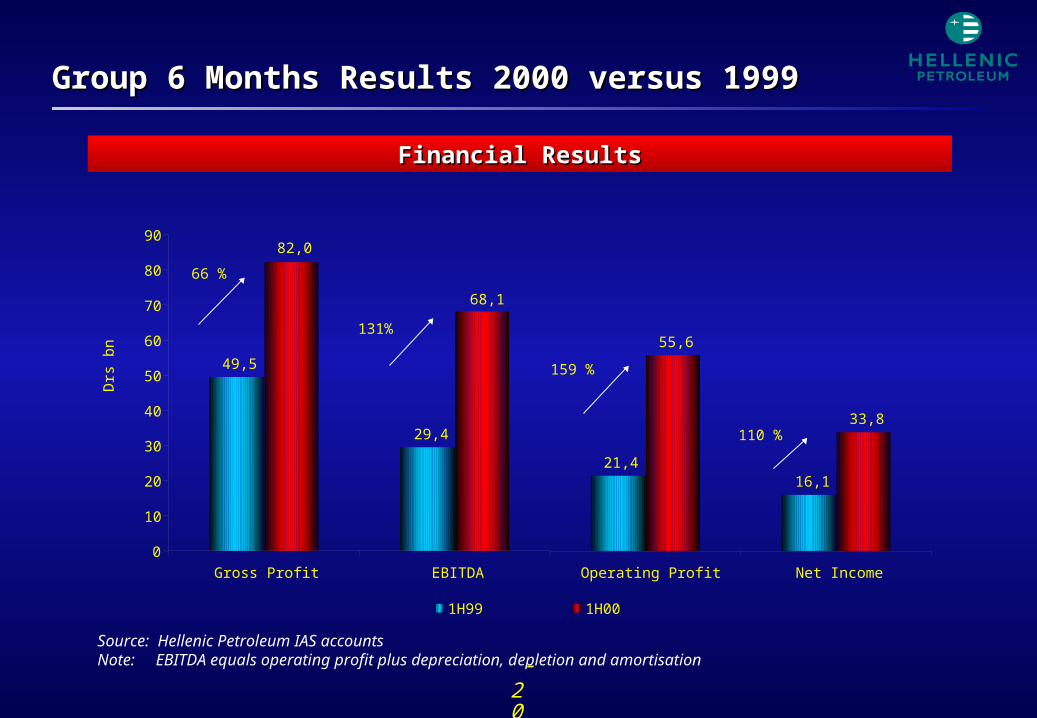
Group 6 Months Results 2000 versus 1999Group 6 Months Results 2000 versus 1999
Financial ResultsFinancial Results
Source: Hellenic Petroleum IAS accountsNote: EBITDA equals operating profit plus depreciation, depletion and amortisation
49,5
29,4
21,416,1
55,6
33,8
68,1
82,0
0
10
20
30
40
50
60
70
80
90
Gross Profit EBITDA Operating Profit Net Income
Drs
bn
1H99 1H00
66 %
131%
159 %
110 %

Strategy OverviewStrategy Overview

-22-
Corporate Competitive AdvantageCorporate Competitive Advantage
StrengthsStrengths Leading market position in GreeceLeading market position in Greece Premium refining marginsPremium refining margins Vertically integrated downstream operationsVertically integrated downstream operations Competitive advantage from logistics, geography and limited import Competitive advantage from logistics, geography and limited import
infrastructureinfrastructure Exposure to gas growth through increase in DEPA stakeExposure to gas growth through increase in DEPA stake Strong financial position to fund expansionStrong financial position to fund expansion
OpportunitiesOpportunities Growing domestic demand for light productsGrowing domestic demand for light products Option to increase stake in DEPAOption to increase stake in DEPA Regional R&M expansion in South Eastern EuropeRegional R&M expansion in South Eastern Europe Increased participation in E&P projectsIncreased participation in E&P projects

-23-
Vision - Strategic Target Vision - Strategic Target
Transform into a fully integrated Transform into a fully integrated energy group energy group
Significantly increase revenues Significantly increase revenues and profitability over the next and profitability over the next five yearsfive years

-24-
Corporate StrategyCorporate Strategy
Performance improvementPerformance improvement
— Reorganise operational structure in order to cut costs and improve Reorganise operational structure in order to cut costs and improve productivityproductivity
— Maximise refining efficiency and profitability Maximise refining efficiency and profitability
— Increase retail market share and improve retail margins Increase retail market share and improve retail margins
Operational/Geographical expansionOperational/Geographical expansion
— Increase production of lighter products Increase production of lighter products
— Increase exposure to natural gas Increase exposure to natural gas
— Continue restructuring petrochemicals (move to high value Continue restructuring petrochemicals (move to high value products)products)
— Expand downstream activities in the Balkans Expand downstream activities in the Balkans
— Develop upstream business Develop upstream business

-25-
19981998 2000E2000E 2002E2002E TotalTotalDrs BnDrs Bn -1999 -1999 -2001E -2001E -2004Ε -2004Ε 2000-20042000-2004
RefiningRefining 86,186,1 81,081,0 187,9187,9 268,9268,9
MarketingMarketing 25,425,4 43,143,1 23,523,5 66,666,6
ChemicalsChemicals 36,636,6 49,749,7 5,45,4 55,155,1
E&PE&P 0,30,3 53,653,6 21,221,2 74,874,8
IT-OthersIT-Others -- 4.44.4 2.12.1 6.56.5
AsprofosAsprofos 3,83,8 0,20,2 0,50,5 0,70,7
ParticipationsParticipations 29,029,0 88,588,5 15,015,0 103,5103,5
TotalTotal 180,2180,2 320,5320,5 255,6255,6 576,1576,1
Capex distribution 2000-2004Capex distribution 2000-2004
1,2%1,2%46,7%46,7%
13,0%13,0%
11,6%11,6%MarketingMarketing
17,9%17,9%ParticipationParticipationss
IT-othersIT-others
9,6%9,6%ChemicalsChemicals
Ε&PΕ&P
RefiningRefining
Major investments:Major investments:
– Thessaloniki Refinery upgradeThessaloniki Refinery upgrade– BOPP Film/Polypropylene new plantsBOPP Film/Polypropylene new plants– Retail upgradeRetail upgrade– E&P projectsE&P projects
– DEPA stakeDEPA stake
Capital Expenditure ProgrammeCapital Expenditure Programme