helping nursing homes “at risk” for quality problems: a statewide evaluation
TRANSCRIPT

FEATURE ARTICLE
Helping Nursing Homes ‘‘At Risk’’for Quality Problems: A StatewideEvaluation
Marilyn J. Rantz, PhD, RN, FAANDebra Cheshire, PhD
Marcia Flesner, RN, PhDGregory F. Petroski, PhD
Lanis Hicks, PhDGreg Alexander, PhD, RN
Myra A. Aud, PhD, RNCarol Siem, MSN, RN, BC, GNP
Katy Nguyen, MSN, RNClara Boland, PhD, RN
Sharon Thomas, BSN, RN
The Quality Improvement Program for Mis-
souri (QIPMO), a state school of nursing pro-
ject to improve quality of care and resident
outcomes in nursing homes, has a special fo-
cus to help nursing homes identified as ‘‘at
risk’’ for quality concerns. In fiscal year 2006,
92 of 492 Medicaid-certified facilities were
identified as ‘‘at risk’’ using quality indicators
(QIs) derived from Minimum Data Set (MDS)
data. Sixty of the 92 facilities accepted offered
on-site clinical consultations by gerontologi-
cal expert nurses with graduate nursing edu-
cation. Content of consultations include
quality improvement, MDS, care planning,
evidence-based practice, and effective team-
work. The 60 ‘‘at-risk’’ facilities improved
scores 4%–41% for 5 QIs: pressure ulcers
(overall and high risk), weight loss, bedfast
residents, and falls; other facilities in the state
did not. Estimated cost savings (based on
prior cost research) for 444 residents who
avoided developing these clinical problems
in participating ‘‘at-risk’’ facilities was more
than $1.5 million for fiscal year 2006. These
are similar to estimated savings of $1.6 mil-
lion for fiscal year 2005 when 439 residents
in ‘‘at-risk’’ facilities avoided clinical prob-
lems. Estimated savings exceed the total
program cost by more than $1 million
annually. QI improvements demonstrate the
clinical effectiveness of on-site clinical con-
sultation by gerontological expert nurses
with graduate nursing education. (Geriatr
Nurs 2009;30:238-249)
238
Nearly everyone has some life experiencesor opinions based on media about nursinghomes and the need for quality improve-
ment. States and federal agencies spend enor-mous amounts of time regulating and surveyingnursing homes, but quality problems persist.1,2
In the past decade, federal initiatives have em-phasized quality improvement,3 and researchershave tested a variety of ways to engage nursinghome staff to embrace methods of quality im-provement and best clinical practices.4-8 How-ever, finding ways that are clinically effective,but not cost-prohibitive, to assist nursing homesmost at risk for quality concerns eludes moststates.
This is a program report of the findings of 2consecutive annual evaluations of the Quality Im-provement Program of Missouri (QIPMO). Thisprogram is sponsored by the Department ofHealth and Senior Services (DHSS) in an effortto help facilities in the state develop quality-improvement programs and improve the qualityof care to Missouri nursing home residents.
Program Overview
DHSS staff envisioned QIPMO to be separatefrom the regulatory process and partnered inthe 1990s with the University of Missouri, SinclairSchool of Nursing (SSON) to design a clinicalconsultation program based on quality improve-ment principles and driven by data from the Min-imum Data Set (MDS) and its derived quality
Geriatric Nursing, Volume 30, Number 4

indicators (QIs). Initial goals of the program wereto help nursing facilities develop quality improve-ment programs, improve quality of care, andimprove reliability of MDS data.
The MDS is a federal assessment instrumentcompleted for each nursing home resident uponadmission, quarterly, and upon significantchanges in condition. Data from the instrumentare collected by each state and nationally. Fromthe assessment data, potential indicators of qual-ity problems (QIs) or quality measures (QMs) arederived. The methods of calculation of QIs andQMs have been studied and evaluated since theMDS was implemented in nursing homes nation-wide in 1990.9-12 A national evaluation concludedthat there was strong evidence that many of theQIs ‘‘do capture meaningful aspects of nursing fa-cility performance.’’11 There have also been twoGeneral Accounting Office reports raising ques-tions about accuracy of reported MDS data, sub-sequent QI accuracy, and state procedures toensure accuracy.13,14 Regardless of controversy,a version of these indicators has been posted onthe federal Nursing Home Compare Web site since2002 to inform consumers about quality of care ofnursing homes to help them make informed deci-sions (www.medicare.gov/NHCompare/Home).
Underlying principles and consultation meth-ods used in QIPMO are research-based. Theywere tested in a randomized clinical trial of a qual-ity improvement intervention in nursing homes.5
Findings of this trial revealed that resident out-comes can be improved with the help of a geron-tological expert nurse with graduate nursingeducation, on-site clinical consultation, qualityimprovement tools to improve care deliveryprocesses, and measurable MDS QI feedback re-ports showing individual facilities how they aredoing as compared with others in the state. Otherstudies have found the same positive impacts onnursing home resident outcomes by advancedpractice nurses.15,16
The program officially began in 1999 (after theearlier-noted clinical trial), is funded annually bya ‘‘provider bed tax,’’ and evaluated each year forits continued clinical impact on resident out-comes using MDS QIs.7 Currently, there are 4 ex-pert gerontological nurses (most with graduatenursing degrees) working in QIPMO; all are clin-ical track faculty of the SSON. The program isvoluntary. Facilities request and schedule the ser-vices of QIPMO by calling the staff project coor-dinator at the SSON, who triages the request
Geriatric Nursing, Volume 30, Number 4
and sends it via e-mail to the appropriate QIPMOnurse. The nurse contacts the facility by phone todiscuss concerns and schedules a consultationsite visit. Demand for the service has grown as fa-cility staff receive assistance from the QIPMOnurse that they perceive as valuable. Word ofmouth has been the program’s best advertising,although when the program began, it was adver-tised throughout the state in nursing home asso-ciation newsletters and DHSS communicationsto nursing homes. Throughout the years, almostall facilities in the state have participated in 1 ormore of the services of QIPMO. Consistently,the facility staff’s annual evaluations of the ser-vices of the expert nurses are very positive, andresident QI outcome evaluations have revealedimprovements in facilities using the services.7,17
In 2005, a special focus was initiated to offerQIPMO services to facilities that might be most‘‘at risk’’ for quality concerns. With declining staterevenue and program funding, this special focuswas an effort to prioritize scarce resources andoffer services to those who might most benefit.
Results of the fiscal year 2006 evaluation ofQIPMO are presented and discussed. The evalua-tion compared facilities in the state that used on-site consultation services with those who did not.Additionally, the evaluation included comparisonof those facilities identified most ‘‘at risk’’ forquality concerns with others in the state. Resultsof this targeted approach offering QIPMO nurseconsultation site visits and working with facili-ties are presented. Similarities with fiscal year2005 evaluation results are also discussed.
Design and Methods
Expert Nurse Clinical Consultation
QIPMO services are multifaceted and includethe tested methods5,7 of on-site clinical consulta-tion, other communication, and education withnursing facility staff focused on improving qualityof care, care planning, and use of the MDS, usingfederal and state comparative QI and QM reportsfor each nursing home, disseminating and helpingfacilities use evidence-based practice, and help-ing facilities develop effective teams to improvecare delivery. QIPMO nurses are experts in geron-tological nursing; most have graduate degrees ingerontological nursing (one is PhD-prepared innursing). All are clinical track faculty of the
239
SSON and often mentor clinical experiences forboth graduate and RN to BSN nursing studentswho are interested in gerontology and particu-larly interested in the APN role of the QIPMOnurse helping nursing homes improve quality ofcare. All have experience working in nursinghomes with older adults and were oriented care-fully to the role of clinical consultation to long-term care facilities.5,7 The nurses live in differentgeographic regions of the state to minimize driv-ing time and expense while maximizing consulta-tion time to facilities.
Site visits are typically 2–3 hours in length. Al-though often scheduled for a shorter time, facilitystaff usually want more time because topics tendto snowball. In most cases, the content of the visitis planned or discussed on the phone or at a priorsite visit. The most frequently requested educa-tional content is to explain and help interpret fed-eral or state quality indicator/quality measure(QI/QM) reports and explain how to use them.The QIPMO nurses use examples solicited fromfacility staff as case studies and provide sugges-tions about nursing interventions, care planning,and documentation.
The following is an example of a site visit. Adirector of nursing (DON) of a 120-bed facilityin central Missouri calls the QIPMO project coor-dinator asking for help. She has heard from hernursing home association that there is growingconcern about pressure ulcers and facilities cananticipate close scrutiny in upcoming state sur-veys. The project coordinator triages the requestto the central Missouri QIPMO nurse who callsthe DON to get more details about the facility’scurrent prevention and treatment practices forpressure ulcers and to schedule a time to meetwith staff. They agree on a time and date; theQIPMO nurse suggests the DON have a smallteam of staff (perhaps another RN or an LPN,the MDS coordinator, and a nursing assistant)available for a brief meeting to discuss currentpractices and begin examining how they are do-ing in this area. When the QIPMO nurse arrives,she asks the MDS coordinator to print the facili-ty’s latest QI/QM report from the MDS transmis-sion homepage. This report displays both theirlow-risk and high-risk pressure ulcer rates, howthey compare with others in their state, and a ros-ter of the residents in their facility listed on the re-port as having a pressure ulcer. Team membersexamine the report with the QIPMO nurse, checkthe roster for accuracy, and can use this report as
240
a baseline for measuring the effect of changesthey may make in their care routines. The QIPMOnurse then leads the team in a discussion of theprevention and treatment currently in place intheir facility. Staff members admit they are notdoing skin risk assessments consistently, andthey find their current risk tool cumbersome.The QIPMO nurse offers suggestions for evi-dence-based assessment tools and practiceguidelines for prevention. Staff agree to workon revising their facility policies and ask theQIPMO nurse to come back to do training fortheir nursing staff about pressure ulcer preven-tion and meet with their team again next month.
Special training for the MDS coordinator andcare plan team is often requested by facilities be-cause MDS data are used for reimbursement, QMreports for consumers, and by federal and stateregulators. The QIPMO nurse helps the careplan team understand the complete Resident As-sessment Instrument (RAI) process and apply itinto practice. Common topics for education re-quested by facility staff include infection control,wound care, tube feeding, dementia and behav-ioral issues, documentation, medication manage-ment, nutrition, and safety for the elderly. In alleducation, effective teamwork and communica-tion is emphasized.
E-mail, phone, and fax connect QIPMO nursesto most facilities in the state. Facilities directlycontact the QIPMO nurse in their region for infor-mation about clinical practice and specifics aboutthe MDS/RAI process. Over the years, nursinghome staff members have come to rely on theirQIPMO nurse for accurate evidence-based guid-ance. Routine e-mails from QIPMO to nearly allfacilities in the state keeps people up-to-date onthe latest issues and changes on the horizon.The team maintains a Web site of free download-able training materials and helpful links at www.
nursinghomehelp.org.Support groups for MDS coordinators are facil-
itated by QIPMO nurses throughout the statemonthly or quarterly, depending on interest. Sup-port groups encourage networking among MDScoordinators. Facilities volunteer to host the 2-hour meeting. A QIPMO nurse presents specificdetails about care planning and assessment usingthe MDS and answers many questions about cod-ing, transmission, and reports available from fed-eral and state sources. All facilities in each regionare invited to the support group meetings andmany participate.
Geriatric Nursing, Volume 30, Number 4

Identifying Facilities at Risk
To locate facilities ‘‘who might most benefit’’from the QIPMO services, state agency staff dis-cussed options with our interdisciplinary re-search team.16 Our team is responsible for therequired program evaluations and has extensivehistory of MDS data analysis,5,6,7,17 the requiredfederal Data Use Agreement (DUA) to workwith MDS data, and Internal Review Board ap-proval. We decided to use facility QI scores calcu-lated from MDS data. On the basis of priorresearch findings,9,18 12 QIs found to be most sen-sitive to quality-of-care practices of nursing homestaff were used in this analysis: falls, depression,depression without treatment, use of 9 or moremedications, bladder or bowel incontinence, uri-nary tract infection, weight loss, dehydration,bedfast residents, decline in late-loss activitiesof daily living (ADLs), daily physical restraints,and stage 1–4 pressure ulcers.
The 12 QIs were applied in selection criteria us-ing MDS data from quarters 1 and 2 of 2006, thequarters before the beginning of the DHSS annualcooperative agreement (July 1 through June 30).Facilities were required to be at or abovethe 80th percentile on the restraint or pressureulcer QI and also on 1 or more of the other care-sensitive QIs. Selecting above the 80th percentilelocates likely quality-of-care problems becauseQIs are problem-based scores, so higher scoresindicate greater likelihood of problems. Requir-ing either high use of restraints or high numbersof pressure ulcers allowed us to target facilitieswith conditions that were of importance to stateagency staff. Using this approach, 88 facilities inthe state were identified ‘‘at risk’’ for quality ofcare problems. Four other facilities identified bythe Centers for Medicare and Medicaid Servicesas ‘‘special focus facilities’’ based on survey his-tory were added to the list, for a total of 92 facil-ities. Although attempts to offer services weremade by QIPMO nurses to all 92 facilities, notall accepted on-site clinical consultation.
Evaluation Design
Because QIPMO is a full-coverage programavailable to all facilities in the state, a statewideanalysis of all facilities is performed annually us-ing the principles of public program evaluation.19
To discern the isolated impact of providing on-site clinical consultation to facilities that use
Geriatric Nursing, Volume 30, Number 4
this service, particularly those identified ‘‘atrisk’’ for quality concerns, a group comparisonwas used:
1. At-risk facilities accepting 1 or more site visitsin the contract period (n 5 60)
2. At-risk facilities that refused the offer of sitevisits during the contract period (n 5 32)
3. Non-at-risk facilities accepting 1 or more sitevisits (n 5 129)
4. Non-at-risk facilities with no site visits (n 5 271)
Demographic information about the 4 groups issummarized in Table 1.
As can be seen in Table 1, the groups are simi-lar in bed size, ownership (government operated,not-for-profit, and for-profit), and rural versus ur-ban or metro locations. Resident characteristicsin the facilities are similar as measured by casemix index20 and cognitive performance scale.21
These results indicate no group differencesamong facility characteristics and resident popu-lation. Although group numbers varied, demo-graphics were stable when compared with the2005 evaluation.
Measurement of Improvement
Four quarters of MDS data were analyzed toevaluate the results of QIPMO services. The quar-ters coincided with the quarters of the DHSScooperative agreement for services that beganJuly 1, 2006, through June 30, 2007. Descriptivegraphs and tables of each QI were used to com-pare progress of each group with baseline (Quar-ter 3, 2006), as were comparisons of actual andrelative changes in QI scores and the number ofresidents affected by the changes in scores foreach QI.
Using the numbers of residents who avoidedeach of the clinical problems represented by theQIs, cost-estimate analyses were performed forthe ‘‘at-risk’’ facilities accepting 1 or more sitevisits. Costs for the treatment of the clinical prob-lems represented by the QIs were estimated onthe basis of primary research studies that mea-sured the actual costs of treatment of those con-ditions in long-term care settings.
The analysis for this program evaluation is de-scriptive and involves only the calculation ofsummary statistics. Significance testing is notused because the groups are nonrandom and be-cause the data set consists of essentially all facil-ities in the state of Missouri at that time. Thus, we
241

Table
1.
Gro
up
Dem
ogra
phic
sFis
calYe
ar
20
06
Facilit
yC
hara
cte
risti
cs
Resid
en
tC
hara
cte
risti
cs
Gro
up
No
.o
f
Facil
itie
s
Avera
ge
Lic
en
sed
Bed
sO
wn
ers
hip
Urb
an
Metr
oR
ura
l
Avera
ge
Case
Mix
Avera
ge
CP
S
No
.o
f
Resid
en
ts*
Go
vN
PFP
At
risk,1+
sit
evis
its
60
108
6%
17%
77%
40%
38%
22%
0.8
2.8
3640
At
risk,re
fused
sit
evis
it32
119
15%
13%
72%
25%
66%
9%
0.8
2.8
2453
No
tat
risk,
1+
sit
evis
its
129
109
7%
27%
66%
40%
46%
14%
0.8
2.6
8237
No
tat
risk,
no
sit
evis
its
271
106
6%
22%
72%
37%
52%
11%
0.8
2.6
16,4
25
To
tal
492
110
7%
22%
71%
38%
49%
13%
0.8
2.7
30,7
55
CP
S5
cogn
itiv
eperfo
rm
an
ce
scale
;F
P5
for
profit;
Gov
5govern
men
t;N
P5
non
profit.
*N
um
ber
of
resid
en
tsat
baseli
ne
inth
equ
ali
tyin
dic
ato
rs
calc
ula
tion
s.
242
have a census rather than a ‘‘sample,’’ making sig-nificance testing inappropriate.22 Trends in QIscores were required to have clinically significantimprovements that were comparatively differentfrom other groups. The clinicians in the researchteam determined ‘‘clinically significant’’ trendsbased on the size of relative improvement inscores in 1 group versus others and numbers ofresidents included in calculations of each QI. Us-ing this approach, small fluctuations in QI scoresare ignored because it is unlikely they arerelevant.9
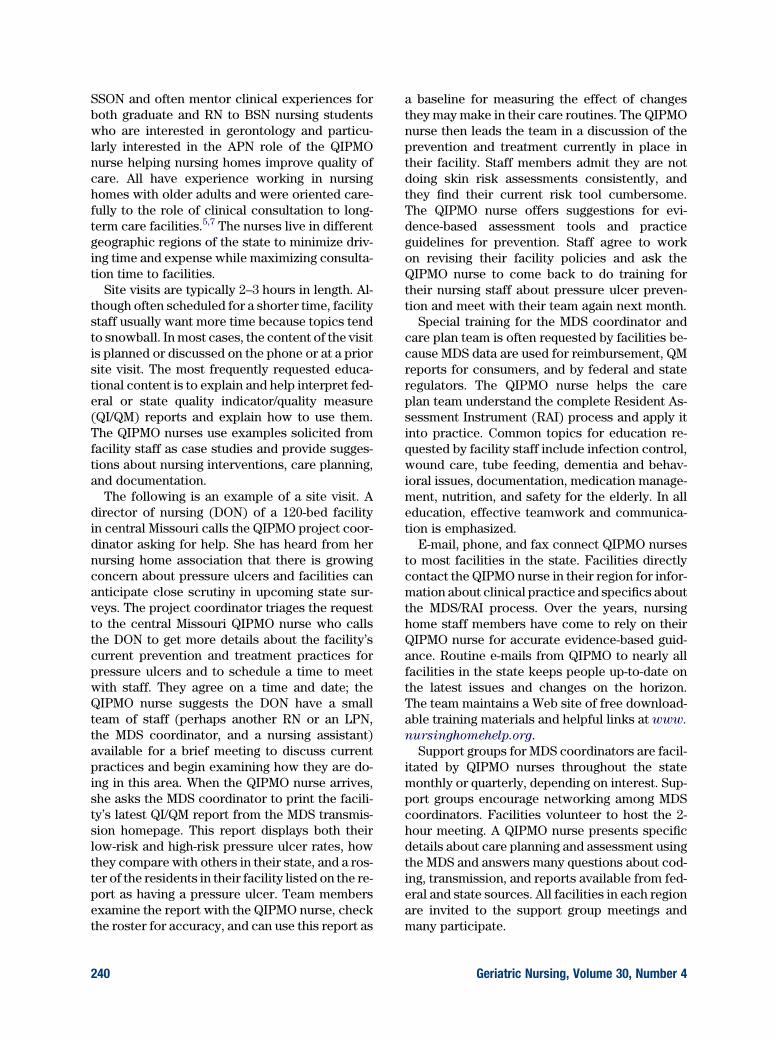
To measure the dose of QIPMO services, theutilization of services across groups is counted.Table 2 summarizes numbers of clinical consulta-tion site visits and other nonsite contacts (e-mail,phone consultation, support group meetings,conference calls, etc.) made by QIPMO nurses.Because this is a voluntary state program, ser-vices are offered, but facilities choose to acceptconsultation site visits or other nonsite contacts.The program is advertised in state communica-tions, association news letters, press releases,and by word of mouth. The numbers of site visitsand other contacts with facilities are similar tothe prior year; this is not surprising, becausethe QIPMO staff and percent of effort in the pro-gram are the same both years.
Results
Twelve MDS QIs, those most sensitive toquality-of-care practices9,18 as reported earlier,were used in this analysis. Because pressure ul-cers, ADLs, and incontinence are risk adjusted,18 QIs are calculated and analyzed to describemore fully the clinical impact of QIPMO services.
Improvement Trends in QIs
Improvement trends (4%–41% relative improve-ment) were measured in 5 QIs in the ‘‘at-risk’’group that accepted 1 or more site visits but notin other groups (see Table 3), indicating theQIPMO services had a positive impact on thisgroup. Five other QIs revealed improvements inthe ‘‘at-risk’’ group that accepted site visits andsome improvements in other groups as well(mixed results). Restraints improved 21% in theat-risk group with site visits and 24% in the not-at-risk group without site visits; this is an unex-plained finding for the not-at-risk group withoutsite visits. There has been statewide educational
Geriatric Nursing, Volume 30, Number 4
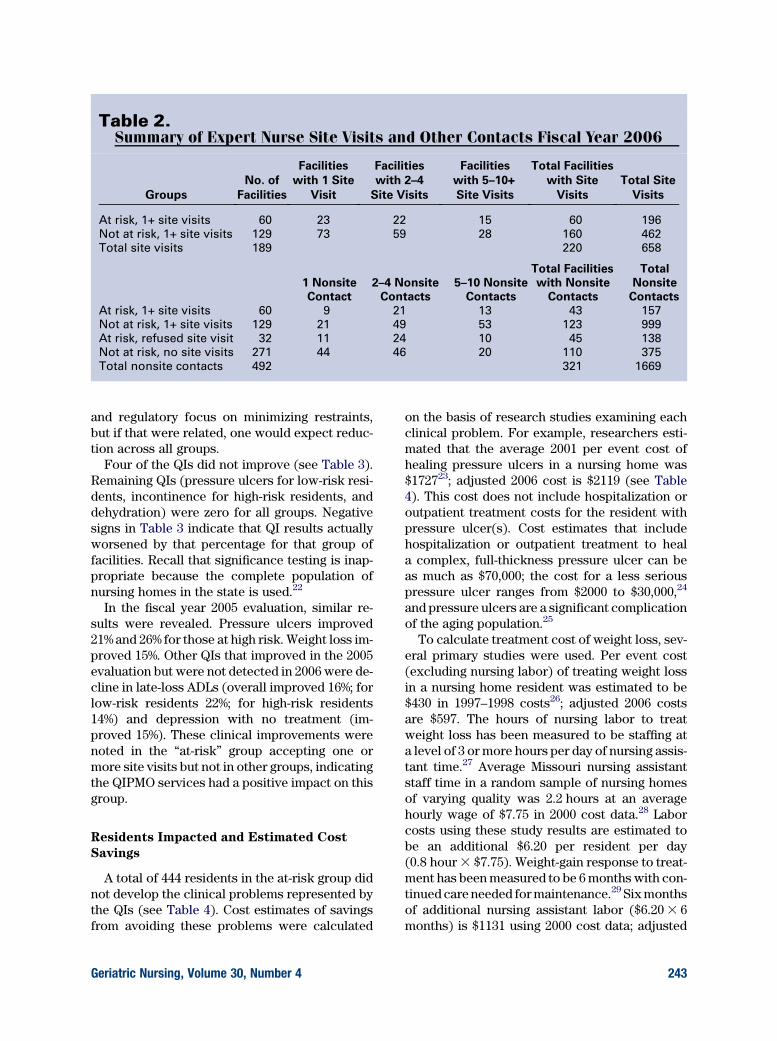
Table 2.Summary of Expert Nurse Site Visits and Other Contacts Fiscal Year 2006
Groups
No. of
Facilities
Facilities
with 1 Site
Visit
Facilities
with 2–4
Site Visits
Facilities
with 5–10+
Site Visits
Total Facilities
with Site
Visits
Total Site
Visits
At risk, 1+ site visits 60 23 22 15 60 196
Not at risk, 1+ site visits 129 73 59 28 160 462
Total site visits 189 220 658
1 Nonsite
Contact
2–4 Nonsite
Contacts
5–10 Nonsite
Contacts
Total Facilities
with Nonsite
Contacts
Total
Nonsite
Contacts
At risk, 1+ site visits 60 9 21 13 43 157
Not at risk, 1+ site visits 129 21 49 53 123 999
At risk, refused site visit 32 11 24 10 45 138
Not at risk, no site visits 271 44 46 20 110 375
Total nonsite contacts 492 321 1669
and regulatory focus on minimizing restraints,but if that were related, one would expect reduc-tion across all groups.
Four of the QIs did not improve (see Table 3).Remaining QIs (pressure ulcers for low-risk resi-dents, incontinence for high-risk residents, anddehydration) were zero for all groups. Negativesigns in Table 3 indicate that QI results actuallyworsened by that percentage for that group offacilities. Recall that significance testing is inap-propriate because the complete population ofnursing homes in the state is used.22
In the fiscal year 2005 evaluation, similar re-sults were revealed. Pressure ulcers improved21% and 26% for those at high risk. Weight loss im-proved 15%. Other QIs that improved in the 2005evaluation but were not detected in 2006 were de-cline in late-loss ADLs (overall improved 16%; forlow-risk residents 22%; for high-risk residents14%) and depression with no treatment (im-proved 15%). These clinical improvements werenoted in the ‘‘at-risk’’ group accepting one ormore site visits but not in other groups, indicatingthe QIPMO services had a positive impact on thisgroup.
Residents Impacted and Estimated Cost
Savings
A total of 444 residents in the at-risk group didnot develop the clinical problems represented bythe QIs (see Table 4). Cost estimates of savingsfrom avoiding these problems were calculated
Geriatric Nursing, Volume 30, Number 4
on the basis of research studies examining eachclinical problem. For example, researchers esti-mated that the average 2001 per event cost ofhealing pressure ulcers in a nursing home was$172723; adjusted 2006 cost is $2119 (see Table4). This cost does not include hospitalization oroutpatient treatment costs for the resident withpressure ulcer(s). Cost estimates that includehospitalization or outpatient treatment to heala complex, full-thickness pressure ulcer can beas much as $70,000; the cost for a less seriouspressure ulcer ranges from $2000 to $30,000,24
and pressure ulcers are a significant complicationof the aging population.25
To calculate treatment cost of weight loss, sev-eral primary studies were used. Per event cost(excluding nursing labor) of treating weight lossin a nursing home resident was estimated to be$430 in 1997–1998 costs26; adjusted 2006 costsare $597. The hours of nursing labor to treatweight loss has been measured to be staffing ata level of 3 or more hours per day of nursing assis-tant time.27 Average Missouri nursing assistantstaff time in a random sample of nursing homesof varying quality was 2.2 hours at an averagehourly wage of $7.75 in 2000 cost data.28 Laborcosts using these study results are estimated tobe an additional $6.20 per resident per day(0.8 hour 3 $7.75). Weight-gain response to treat-ment has been measured to be 6 months with con-tinued care needed for maintenance.29 Six monthsof additional nursing assistant labor ($6.20 3 6months) is $1131 using 2000 cost data; adjusted
243

Table 3.Percentage Improvements in Quality Indicators (QIs) for ‘‘At-Risk’’ Groupswith 1 or More Site Visits Compared with Other Groups, Fiscal Year 2006
QI
At Risk,
1+ Site Visits
(n 5 60)
Not at Risk,
1+ Site Visits
(n 5 129)
At Risk,
Refused Site
Visit (n 5 32)
Not at Risk,
No Site Visits
(n 5 271)
Improved in ‘‘at-risk’’ group only
Pressure ulcers—overall 22% �12% �3% �22%
Pressure ulcers for high-risk resident 12% �14% �11% �20%
Weight loss 4% �29% �4% �16%
Bedfast residents 41% �26% �35% �9%
Falls 4% �10% �19% �1%
Improved in ‘‘at-risk’’ group and some other groups (mixed results)
Incontinence—overall 3.5% 0 4.8% �1.4%
Incontinence—low-risk residents 3.3% 3.5% 7.9% �2.3%
Urinary tract infection 2.5% �4.5% 8.9% 0.5%
Depression 5.4% 0 4.5% 3.1%
Physical restraints 20.7% �0.8% �5.7% 24.4%
Did not improve in ‘‘at-risk’’ group
Decline in late-loss ADLs—overall �10.4% �8.2% �20.2% 1.7%
Decline in late-loss ADLs—low-risk
residents
�6.9% �3.5% �14.1% 1.0%
Decline in late-loss ADLs—high-risk
residents
0 33.3% 13.8% 11.1%
Depression with no treatment �1.1% 9.7% 12.2% 2.6%
Nine or more medications �0.5% �0.5% �0.9% �3.2%
ADLs 5 activities of daily living.
Remaining QIs (pressure ulcers for low-risk residents, incontinence for high-risk residents, and dehydration) were 0 for all
groups and are not presented in the table.
Significance testing is not used because the groups are nonrandom and because the data set consists of essentially all
facilities in the state of Missouri at the time. Thus, we have a census rather than a ‘‘sample,’’ making significance testing
inappropriate.
2006 costs are $1453. Total per episode 2006 costof treating a resident with weight loss is estimatedto be $2050 ($597 treatment + $1453 labor).
Governmental cost of care for older adultswho experience a decline in ADLs in a 1993community-based study was found to be in ex-cess of $10,000 per person in 2 years30; adjusted2006 cost is $16,584; 1-year cost estimate is$8292. If one considers additional staff time andsupply costs for nursing home residents with de-clining ADLs, this estimate is likely conservative.Cost estimates for treatment of bedfast residentsand those with restraints are estimated to be$4146 or 50% of the decline in ADL treatmentcost. Cost estimates for restraints and bedfastresidents are based on the cost associated withADL decline because both restraints and time inbed are known to result in ADL decline.31,32
The Centers for Disease control estimate that20%–30% of falls have moderate to severe injuries
244
with associated costs of $19,440.33 Eighteen resi-dents avoided falls in the at-risk facilities; conser-vatively, 4 of these falls were likely to result ininjury, with a total estimated cost of $77,760.
Average costs of $3554 per nursing home resi-dent per year for incontinence management usingbriefs, bed pads, and barrier creams were mea-sured in an incontinence management study.34
This study was a secondary data analysis ofdata collected in summer 1994 for a nationalanalysis of costs of pressure ulcer prevention35;adjusted 2006 cost is $5618.
Per event cost of urinary tract infection ina nursing home was estimated to be $691 in200123; adjusted 2006 cost is $848. This costdoes not include any hospitalization or outpatienttreatment costs for residents with urinary tractinfection(s).
Both average inpatient and outpatient costswere $1766 higher annually for individuals with
Geriatric Nursing, Volume 30, Number 4

Table 4.Improvements and Estimated Cost Savings in ‘‘At-Risk’’ Groups with 1 or MoreSite Visits, Fiscal Year 2006
QI
No. Residents Who
Did Not Develop
the QI Problem
Estimated per
Resident Cost
of Treatment
Cost Savings by
Not Developing
the Problem*
Pressure ulcers 69 $2119 $146,211
Pressure ulcers for high-risk residents 37 $2119 $78,403
Weight loss 15 $2050 $30,750
Bedfast residents 33 $4146† $136,818
Falls 18‡ $19,440 $77,760
Incontinence 60 $5618 $337,080
Incontinence for low-risk residents 38 $5618 $213,484
Urinary tract infection 11 $848 $9328
Depression 87 $2792 $242,904
Physical restraints 67 $4146† $277,782
Total residents impacted and costs savings 444 $1,550,520
QI 5 quality indicator.
*Costs do not include outpatient or hospitalization costs for managing residents with these conditions or complications
of them (note that falls, restraints, and depression are proxies from community-based studies that are further explained
in text). Costs are from primary studies and are adjusted to 2006 using the medical consumer price index.†Based on 50% of cost estimate of activity of daily living decline in 2006 of $8292.
‡Twenty to thirty percent of falls have moderate to severe injuries with associated costs of $19,440.
33Conservatively,
4 of these 18 falls were likely to involve injury, and therefore cost was multiplied by 4 to estimate costs savings.
self-reported depressive syndromes in a 1994 rep-resentative national sample36; adjusted 2006 costis $2792. Given the impact of depression acrossthe life span, it is likely these estimates are rele-vant and likely conservative estimates for nursinghome residents.
Summary of Estimated Cost Savings for
‘‘At-Risk’’ Facilities Who Participated
Total estimated cost savings by avoiding thedevelopment of key clinical problems for manyresidents living in ‘‘at-risk’’ nursing homes thatparticipated in site visits (n 5 60) is more than$1.5 million for the annual 2006/2007 period.This estimated savings exceeds the total programcost by more than $1 million.
These estimated cost savings are similar tothose for fiscal year 2005, $1.6 million, when 439residents living in ‘‘at-risk’’ nursing homes thatparticipated in site visits (n 5 45) avoided clini-cal problems associated with the QIs. In 2005,there were improvements of 21% for pressureulcers, 26% pressure ulcers for high-risk resi-dents, 16% decline in late loss ADLs, 22% ADLsfor low-risk residents, 14% ADLs in high-risk
Geriatric Nursing, Volume 30, Number 4
residents, 10% incontinence, 14% incontinencefor low-risk residents, 32% urinary tract infection,15% weight loss, and 15% depression with notreatment. Again, the 2005 estimated savingsexceeded the total program cost by more than$1 million.
Statewide Improvements and Estimated
Cost Savings
Statewide improvements in QI scores for fiscalyear 2006 were analyzed, and the numbers of res-idents who avoided the development of the clini-cal problems defined by the QIs were calculated.Using the same cost-estimate analysis methodsas were used in the ‘‘at-risk’’ facilities analysis, as-sociated estimated costs of the care for treatingthe clinical problem were calculated. Table 5 dis-plays the statewide improvements in QIs, thenumbers of residents affected, and the estimatedcost savings.
Although all the improvements in Table 5 can-not be interpreted as solely attributable to the ef-forts of QIPMO staff, the effect of the QIPMO’spromoting quality improvement efforts, doingstatewide education about resident assessment
245

Table 5.Residents Affected by Statewide Improvements in Quality Indicators (QIs)and Estimated Cost Savings by Not Developing the Clinical ProblemsMeasured by QIs, Fiscal Year 2006
QI
No. Residents Who
Did Not Develop
the Problem
Estimated per
Resident Cost
of Treatment
Cost Savings
by Not Developing
the Problem
Depression 400 $2792 $1,116,800
Depression without treatment 154 $2792 $429,968
Incontinence for low-risk residents 24 $5618 $134,832
Decline in ADLs for high-risk residents 110 $8292 $912,120
Daily physical restraints 123 $4146* $509,958
Totals 811 $3,103,678
ADLs, activities of daily living.
*Based on 50% of cost estimate of ADL decline in 2006 of $8292.
and clinical care, completing 658 site visits in 220facilities, and making 1669 other contacts to 321facilities in the state (as summarized in Table2), would likely have contributed to these im-provements to some degree.
In summary, based on fiscal year 2006 state-wide QI improvements, there were 811 residentswho avoided development of these expensive, de-bilitating problems in nursing homes, at an esti-mated savings to the nursing homes withimprovements of more than $3.1 million in carecosts. Efforts to help facilities with quality im-provement appears not only to be helpful to nurs-ing home residents who receive better care whenthey need it, but also to the industry to improvecare and reduce costs associated with commoncare problems.
Discussion
In the statewide fiscal year 2006 nursing homeevaluation, 5 indicators improved in the ‘‘at-risk’’group that accepted 1 or more QIPMO site visitsand not in other groups, indicating the QIPMOservices had a positive impact on this group.These 5 QIs had improvement trends of 4% to41% in important clinical problems of pressure ul-cers, pressure ulcers for high-risk residents,weight loss, bedfast residents, and falls. Fiveother indicators also improved 2.5% to 20.7%and included important clinical problems of in-continence, incontinence for low-risk residents,
246
urinary tract infections, depression, and use ofphysical restraints. These are clinically signifi-cant improvements that affected the lives ofmany residents in these facilities. More than 400residents in participating ‘‘at-risk’’ facilitiesavoided these debilitating clinical problems, andthus facilities and the health care system ingeneral avoided the costs of treating thoseproblems—estimated at more than $1.5 millionfor the annual 2006 QIPMO contract period. Sim-ilarly, in 2005 more than 400 residents in ‘‘at-risk’’facilities did not develop the problems repre-sented by the QIs at an estimated cost savingsof $1.6 million. Estimated savings far exceededQIPMO program costs.
The clinical effectiveness of the QIPMO pro-gram has been evaluated previously, with similarresults.7 For example, in a recent evaluation ofthe impact of bedside technology on nursinghome quality of care, facilities with technologythat worked with QIPMO nurses had larger im-provements in quality as measured by QIs thanthose in other states who did not have access tothe service or matched control facilities in Mis-souri that did not use QIPMO.17
Similar to general effectiveness of advancedpractice nurses caring for elders in nursinghomes15,37-39 or community,40 the clinical impacton improving quality of care by expert geronto-logical nurses consulting in ‘‘at-risk’’ nursinghomes can be large, as demonstrated in theseevaluation results from 2006 and 2005. The expertgerontological nurse role should be embraced by
Geriatric Nursing, Volume 30, Number 4

state agencies, nursing home providers, and con-sumers as an ongoing strategy to continuouslyimprove the quality of nursing home care. Itmust be pointed out that the expert nurses inthe QIPMO roles have graduate education innursing, and we believe this preparation posi-tions them to be successful in the expert geronto-logical nurse consultation role in nursing homes.On the basis of repeated evaluations of QIPMOand other advance practice nursing evaluationsin long-term care that were cited earlier, it ap-pears that the complexity of the clinical problemsin nursing homes, particularly those ‘‘at-risk’’ forquality problems, requires an expert who hasgraduate level nursing education.
Theoretical underpinnings of QIPMO are con-tinuous quality improvement, learning to improvecare delivery processes, and learning to useteams for quality improvement. In the conten-tious environment of government regulation, itis sometimes difficult to help facility staff graspthat taking time to figure out root causes of prob-lems and plan care process improvements to fixroot causes is worth their time. The consultationrole of QIPMO nurses is effective in overcomingthis resistance and with follow-up visits or con-tacts by e-mail or telephone; facility staff cangather momentum and truly address care issues.
To measure progress in improvement, facilitiesare taught how to measure care delivery pro-cesses so they can do follow-up measures tomark improvements. This is highly recommendedby other researchers in long term care.8,41 QIPMOnurses demonstrate how to use MDS QI feedbackreports. Federal reports are available to each fa-cility in the country that display QI scores inboth tables and graphs. Facility staff memberslearn to interpret their scores, identify care pro-cesses to improve, make changes in the pro-cesses, and gauge improvements by observingfuture QI scores or other markers.
Dissemination of evidence-based practice in-formation is a critical function of the QIPMO ser-vice. Many facilities are isolated or have limitedresources for continuing education. Ongoingcommunication with facilities is essential to con-nect them with up-to-date information. Most ofthe facilities in the state now participate ine-mail communication with QIPMO nurses andreceive regular links to best practice and thelatest care-related information.
This evaluation has several limitations. Al-though every effort was made to contact and en-
Geriatric Nursing, Volume 30, Number 4
courage all facilities identified as ‘‘at risk,’’ onlythose who agreed to participate received ser-vices. This is a self-selected portion of the ‘‘at-risk’’ group. Likewise, for the remaining portionof facilities in the state, they self-selected andchose to use QIPMO services. There may be otherexplanations for group differences due to self-selection. Another limitation is that ‘‘at-risk’’ facil-ities had larger margins for improvement of QIscores. We attempted to control for this by usingrelative improvements as the standard for clini-cally significant improvement in QI scores. An-other limitation is that facilities determined the‘‘dose’’ of QIPMO services by the number of sitevisits or other contacts they were willing to re-ceive or sought. Additionally, this evaluationwas not a randomized clinical trial of the QIPMOservice; future research in this area should con-sider a more rigorous design.
An insight from this evaluation is the paucity ofcost studies in nursing homes. It was extremelychallenging to locate well-conducted studiesthat carefully calculated the costs of care deliveryand treatment of common problems of elderlynursing home residents. Updated and continuedcost analyses are needed.
Although no assisted living facilities wereincluded in this evaluation, we think QIPMOservices would likely be clinically effective andcost-effective for assisted living settings. Chal-lenges of consulting in assisted living includea lack of standardized assessment data such asMDS that can provide indicators of quality acrossfacilities and a paucity of registered nurse or ad-vance practice nurse involvement in assessment,care planning, and care.42,43 However, clinicalconditions that are experienced by nursinghome residents are also prevalent in assisted liv-ing,44 and it is very likely that staff could benefitfrom best practice information and discussionswith expert gerontological nurses such as thosein the QIPMO program.
On the basis of the success of this evaluationand others that have measured the effective-ness of QIPMO, we highly recommend thatother states pursue partnerships with schoolsof nursing. Replicating the program is alsohighly recommended. It is a good statewide in-vestment of provider ‘‘bed tax’’ or other stateagency funds with measurable clinical improve-ments for nursing home residents, particularlythose living in facilities most at risk for qualityproblems.
247

References
1. General Accounting Office. Nursing homes: Despite
increased oversight, challenges remain in ensuring high-
quality care and resident safety (Report GAO-06-117).
Washington, DC: Author; 2005.
2. Institute of Medicine. Committee on Improving Quality in
Long-Term Care. Improving the quality of long-term care.
Washington, DC: National Academy Press; 2001.
3. General Accounting Office. Nursing homes: federal
actions needed to improve targeting and evaluation of
assistance by quality improvement organizations (Report
GAO-07-373). Washington, DC: Author; 2007.
4. Kane RL, Arling G, Mueller C, et al. A quality-based
payment strategy for nursing home care in Minnesota.
Gerontologist 2007;47:108-15.
5. Rantz MJ, Popejoy L, Petroski GF, et al. Randomized
clinical trial of a quality improvement intervention in
nursing homes. Gerontologist 2001;41:525-38.
6. Rantz MJ, Grando V, Conn VS, et al. Getting the basics
right: critical processes of care delivery in nursing homes
that achieve good resident outcomes. J Gerontol Nurs
2003;29:15-25.
7. Rantz MJ, Vogelsmeier A, Manion P, et al. A statewide
strategy to improve quality of care in nursing facilities.
Gerontologist 2003;43:248-58.
8. Schnelle JF. Continuous quality improvement in nursing
homes: Public relations or a reality? J Am Med Dir Assoc
2007;8(3 Suppl):S2-5.
9. Karon S, Sainfort F, Zimmerman DR. Stability of nursing
home quality indicators over time. Med Care 1999;37:
570-9.
10. Karon SL, Zimmerman DR. Using indicators to structure
quality improvement initiatives in long-term care. Qual
Manage Health Care 1996;4:54-66.
11. Morris JN, Murphy KM, Mor V, et al. Validation of long-
term and post-acute care quality indicators (CMS
Contract No: 500-95-0062/ T.O. #4). 2003. Available at
www.cms.hhs.gov/NursingHomeQualityInits/
35_NHQIArchives.asp. Cited January 15, 2008.
12. Zimmerman DR, Karon SL, Arling G, et al. Development
and testing of nursing home quality indicators. Health
Care Financing Rev 1995;16:107-27.
13. General Accounting Office. Nursing homes: Federal
efforts to monitor resident assessment data should
complement state activities (Report GAO-02-279).
Washington, DC: Author; 2002.
14. General Accounting Office. Nursing homes: Public
reporting of quality indicators has merit, but national
implementation is premature (Report GAO-03-187).
Washington, DC: Author; 2002.
15. Ryden MB, Snyder M, Gross CR, et al. Value-added
outcomes: The use of the advanced practice nurse in
long-term care. Gerontologist 2000;40:654-62.
16. Rantz M, Mehr D, Hicks L, et al. Entrepreneurial program
of research and service to improve nursing home care.
Western J Nurs 2006;28:918-34.
17. Rantz MJ, Scott-Cawiezell J, Alexander G, et al.
Evaluation of the Use of Bedside Technology to Improve
Quality of Care in Nursing Facilities, Final Report for the
Centers for Medicare & Medicaid Services, Baltimore,
MD (RTI Project Number 0207964.010). 2006. Available at
248
www.cms.hhs.gov/reports/downloads/Rantz.pdf. Cited
July 2007.
18. Rantz MJ, Hicks L, Petroski GF, et al. Stability and
sensitivity of nursing home quality indicators. J Gerontol
Med Sci 2004;59A:79-82.
19. Rossi PH, Freeman HE. Evaluation: a systematic
approach. Newbury Park, CA: Sage Publications; 1989.
20. Fries BE, Schneider DP, Foley WJ, et al. Refining a case-
mix measure for nursing homes: Resource utilization
groups (RUG-III). Med Care 1994;32:668-85.
21. Morris JN, Fries BE, Mehr DR, et al. MDS cognitive
performance scale. J Gerontol 1994;49:M174-82.
22. Larsen RJ. Statistics for the allied health sciences.
Columbus, OH: Charles E.Merrill; 1975.
23. Dorr DA, Horn SD, Smout RJ. Cost analysis of nursing
home registered nurse staffing times. J Am Geriatr Soc
2005;53:840-5.
24. Gallagher S. Outcomes in clinical practice: pressure ulcer
prevalence and incidence studies. Ostomy Wound
Manage 1997;43:28-32. 34-5, 38.
25. Amlung SR, Miller WL, Bosley LM. The 1999 National
Pressure Ulcer Prevalence Survey: a benchmarking
approach. Adv Skin Wound Care 2001;14:297-301.
26. Alessi CA, Ouslander JG, Maldague S, et al. Incidence and
costs of acute medical conditions in long-stay
incontinent nursing home residents. J Am Med Dir Assoc
2002;3:229-42.
27. Dyke MJ. Nursing staffing and resident outcomes in
nursing homes: weight loss and dehydration. J Nurs Care
Qual 2007;22:59-65.
28. Rantz MJ, Hicks L, Grando VT, et al. Nursing home quality,
cost, staffing, and staff-mix. Gerontologist 2004;44:24-38.
29. Levinson Y, Dwolatsky T, Epstein A, et al. Is it possible to
increase weight and maintain protein status of
debilitated elderly residents of nursing homes?
J Gerontol Med Sci 2005;60A:878-81.
30. Fried TR, Bradley EH, Williams CS, et al. Functional
disability and health care expenditures for older persons.
Arch Int Med 2001;161:2602-7.
31. Brown CJ, Friedkin RJ, Inouye SK. Prevalence and
outcomes of low mobility in hospitalized older patients.
J Am Geriatr Soc 2004;52:1263-70.
32. Castle NG, Mor V. Physical restraints in nursing homes:
a review of the literature since the Nursing Home Reform
Act of 1987. Med Care Res Rev 1998;55:171-6. 139-70;
discussion.
33. Centers for Disease Control. (2007). Costs of falls among
older adults. National Center for Injury Prevention and
Control, Division of Unintentional Injury Prevention.
Available at www.cdc.gov/ncipc/factsheets/fallcost.htm.
Cited October 4, 2007.
34. Frantz RA, Xakellis GC, Harvey PC, et al. Incontinence
management in long-term care. J Gerontol Nurs 2003;29:
46-53.
35. Xakellis GC, Frantz RA, Lewis A, et al. The cost-
effectiveness of an intensive pressure ulcer prevention
protocol in long term care. Adv Wound Care 1998;11:22-9.
36. Druss BG. Rosenheck RA Patterns of health care costs
associated with depression and substance abuse in
a national sample. Psychiatr Serv 1999;50:214-8.
37. Kane RL, Garrard J, Skay CL, et al. Effects of a geriatric
nurse practitioner on process and outcome of nursing
home care. Am J Public Health 1989;79:1271-7.
Geriatric Nursing, Volume 30, Number 4

38. Krichbaum K, Pearson V, Savik K, et al. Improving
residents outcomes with GAPN organization level
interventions. Western J Nurs Res 2005;27:322-37.
39. Popejoy LL, Rantz MJ, Conn V, et al. Improving quality of
care in nursing facilities: The gerontological clinical
nurse specialist as research nurse consultant. J Gerontol
Nurs 2000;26:6-13.
40. Naylor MD, Brooten D, Campbell R, et al. Comprehensive
discharge planning and home follow-up of hospitalized
elders: a randomized clinical trial. JAMA 1999;281:613-20.
41. Simmons SF, Schnelle JF. Continuous quality
improvement pilot study: impact on nutritional care
quality. JAMA 2006;7:480-5.
42. Mason DJ. Assisting living: where are the RNs? Am J Nurs
2003;103:7.
43. Mitty EL. Assisted living and the role of nursing. Am J
Nurs 2003;103:32-43.
44. National Center for Assisted Living. Facts and trends: the
assisted living sourcebook. Washington, DC: Author; 2001.
MARILYN J. RANTZ, PhD, RN, FAAN, is a professor at the
Sinclair School of Nursing and Family and Community
Medicine, School of Medicine, University Hospital Professor
of Nursing, University of Missouri, Columbia, MO. DEBRA
CHESHIRE, PhD, is a section administrator, Section for
Long Term Care, Division of Senior Services and Regula-
tion, Department of Health and Senior Services, Jefferson
City, MO. MARCIA FLESNER, RN, PhD, is a research nurse,
Sinclair School of Nursing, University of Missouri, Colum-
bia, MO. GREGORY F. PETROSKI, PhD, is a statistician,
School of Medicine, University of Missouri, Columbia, MO.
LANIS HICKS, PhD, is a professor in Health Management
and Informatics, School of Medicine, University of Missouri,
Columbia, MO. GREG ALEXANDER, PhD, RN, is an assis-
tant professor, Sinclair School of Nursing, University of
Missouri, Columbia, MO. MYRA A. AUD, PhD, RN, is an
associate professor, Sinclair School of Nursing, University
of Missouri, Columbia, MO. CAROL SIEM, MSN, RN, BC,
GNP, is an instructor of clinical nursing, Sinclair School of
Nursing, University of Missouri, Columbia, MO, and
Geriatric Nursing, Volume 30, Number 4
a QIPMO educator. KATY NGUYEN, MSN, RN, is an in-
structor of clinical nursing, Sinclair School of Nursing,
University of Missouri, Columbia, MO, and a QIPMO edu-
cator. CLARA BOLAND, PhD, RN, is an instructor of clinical
nursing, Sinclair School of Nursing, University of Missouri,
Columbia, MO, and a QIPMO educator. SHARON THOMAS,
BSN, RN, is an instructor of clinical nursing, Sinclair
School of Nursing, University of Missouri, Columbia, MO,
and a QIPMO educator.
ACKNOWLEDGMENTS
We acknowledge the contributions of other University of Mis-
souri—Columbia MDS and Nursing Home Quality Research
Team: Rose Porter, RN, PhD, dean; Deidre D. Wipke-Tevis,
PhD, RNC, CVN, associate professor; Jill Scott-Cawiezell,
RN, PhD, associate professor; Jane Bostick, RN, PhD, clini-
cal associate professor, Donna Minner, Amy Vogelsmeier,
Margie Diekemper, quality improvement nurses, Sinclair
School of Nursing; Jessica Mueller, data support staff; and
Debra Oliver, PhD, assistant professor; consultants to our
team: Dr. David Zimmerman, Director Health Systems Re-
search and Analysis, University of Wisconsin—Madison;
Meridean Maas, PhD, RN, FAAN, professor, University of
Iowa. The members of the MU MDS and Nursing Home Qual-
ity Research Team gratefully acknowledge the ongoing sup-
port of the Missouri Department of Health and Senior
Services staff, particularly David Durbin, JD, who sparked
this approach to reach out to nursing homes most at risk
for quality problems; the Missouri Healthcare Association;
and the Missouri Association of Homes and Services for
the Aged. They are truly committed to helping homes em-
brace quality improvement. Evaluation activities were par-
tially supported by a Cooperative Agreement with MODHSS
AOC07380005. Opinions are those of the authors and do not
necessarily represent MODHSS.
0197-4572/09/$ - see front matter
� 2009 Mosby, Inc. All rights reserved.
doi: 10.1016/j.gerinurse.2008.09.003
249