helsinki testbed: a new open facility to test · pdf file · 2007-05-101 helsinki...
TRANSCRIPT
1
HELSINKI TESTBED: A NEW OPEN FACILITY TO TEST INSTRUMENTATION TECHNOLOGY FOR ATMOSPHERIC MEASUREMENTS
J. Poutiainen1, E. Saltikoff2, W. F. Dabberdt3, J. Koistinen1, H. Turtiainen2
1 Finnish Meteorological Institute, Helsinki, Finland
2 Vaisala Inc., Helsinki, Finland 3 Vaisala Inc., Boulder, Colorado, USA
Tel. +358-9-1929 4140, Fax +358-9-1921 5703, [email protected]
ABSTRACT The Finnish Meteorological Institute and Vaisala meteorological measurements company have established a mesoscale observational network in coastal high-latitude environment. The network platform is called Helsinki Testbed, and its main domain covers roughly 150 km x 150 km area in southern Finland. The scope of this project is to provide input and experience for mesoscale weather research, forecast and dispersion model development and verification, information systems integration, end-user product development and data distribution for public and research community. A testbed can be defined as a working relationship in a quasi-operational framework among measurement specialists, forecasters, researchers, private-sector, and government agencies aimed at solving operational and practical regional problems with a strong connection to the end-users. Testbeds accelerate the translation of research and development findings into better operations, services, and decision-making. The Helsinki Testbed is open to researchers around the world to test measurement and modeling systems.
In southern Finland, reasonably good observation networks have long time existed for synoptic scale and road weather observations, as well as for special purposes like aviation. For the Helsinki Testbed measurement campaigns, these have been supplemented with numerous new sites. A dense network of over 60 stations (44 with measurements at two heights) has been equipped with Vaisala WXT510 multi-parameter weather transmitters. The number of radio soundings, ceilometers, precipitation weighing gauges, wind profiler and radio acoustic sounding system observations has been increased. Also satellite, C-band weather radar and total lightning data will be extracted from routine and research measurements. Details of the network design, instrumentation and data policy are available at http://testbed.fmi.fi/.
2
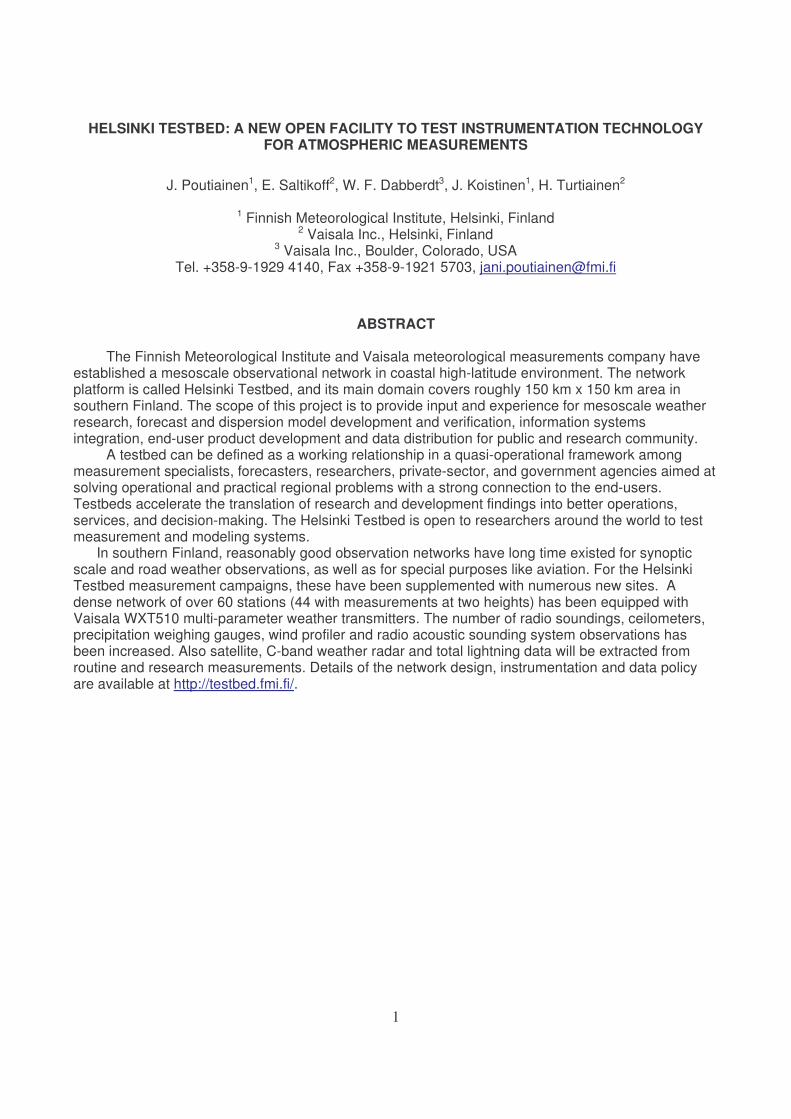
1. Description of Helsinki Testbed The Finnish Meteorological Institute (FMI) and Vaisala meteorological measurements company have established a mesoscale observational network in coastal high-latitude environment in southern Finland. Figure 1 shows the location of the testbed domain with the distribution of various observation sites. The broad scope of this project is to provide input and experience for mesoscale weather research, forecast and dispersion model development and verification, information systems integration, end-user product development and data distribution for public and research community.
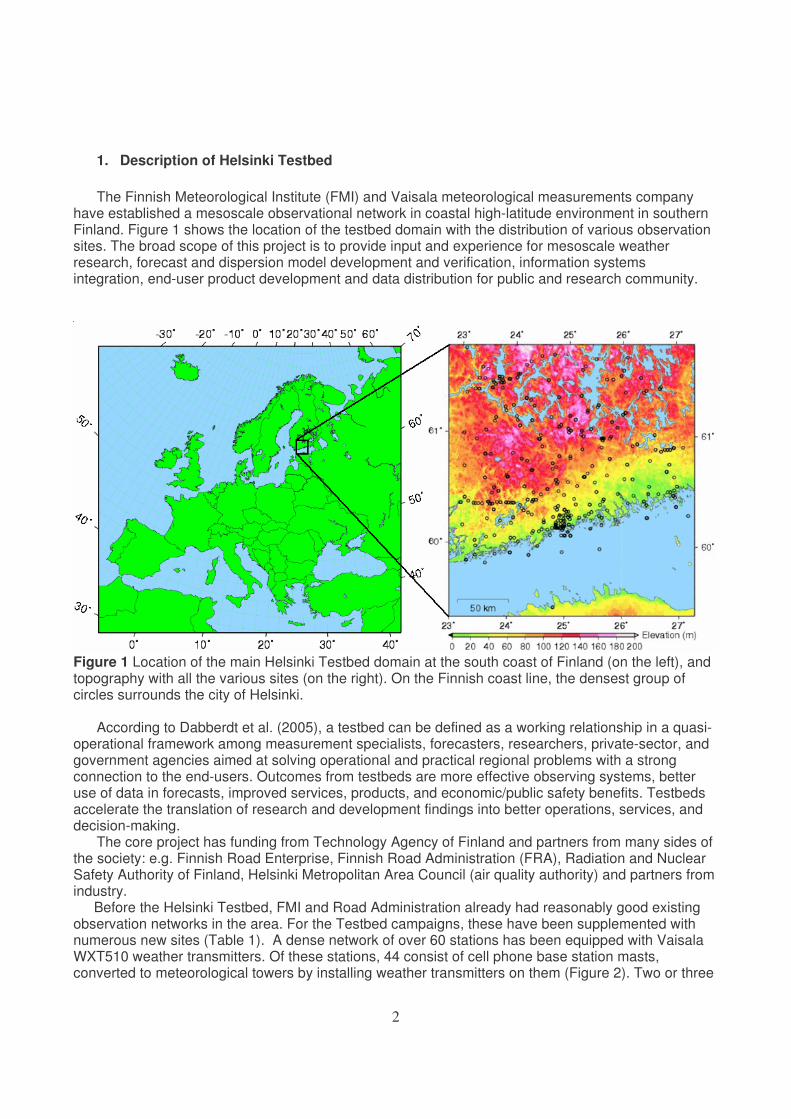
Figure 1 Location of the main Helsinki Testbed domain at the south coast of Finland (on the left), and topography with all the various sites (on the right). On the Finnish coast line, the densest group of circles surrounds the city of Helsinki. According to Dabberdt et al. (2005), a testbed can be defined as a working relationship in a quasi-operational framework among measurement specialists, forecasters, researchers, private-sector, and government agencies aimed at solving operational and practical regional problems with a strong connection to the end-users. Outcomes from testbeds are more effective observing systems, better use of data in forecasts, improved services, products, and economic/public safety benefits. Testbeds accelerate the translation of research and development findings into better operations, services, and decision-making. The core project has funding from Technology Agency of Finland and partners from many sides of the society: e.g. Finnish Road Enterprise, Finnish Road Administration (FRA), Radiation and Nuclear Safety Authority of Finland, Helsinki Metropolitan Area Council (air quality authority) and partners from industry. Before the Helsinki Testbed, FMI and Road Administration already had reasonably good existing observation networks in the area. For the Testbed campaigns, these have been supplemented with numerous new sites (Table 1). A dense network of over 60 stations has been equipped with Vaisala WXT510 weather transmitters. Of these stations, 44 consist of cell phone base station masts, converted to meteorological towers by installing weather transmitters on them (Figure 2). Two or three
3
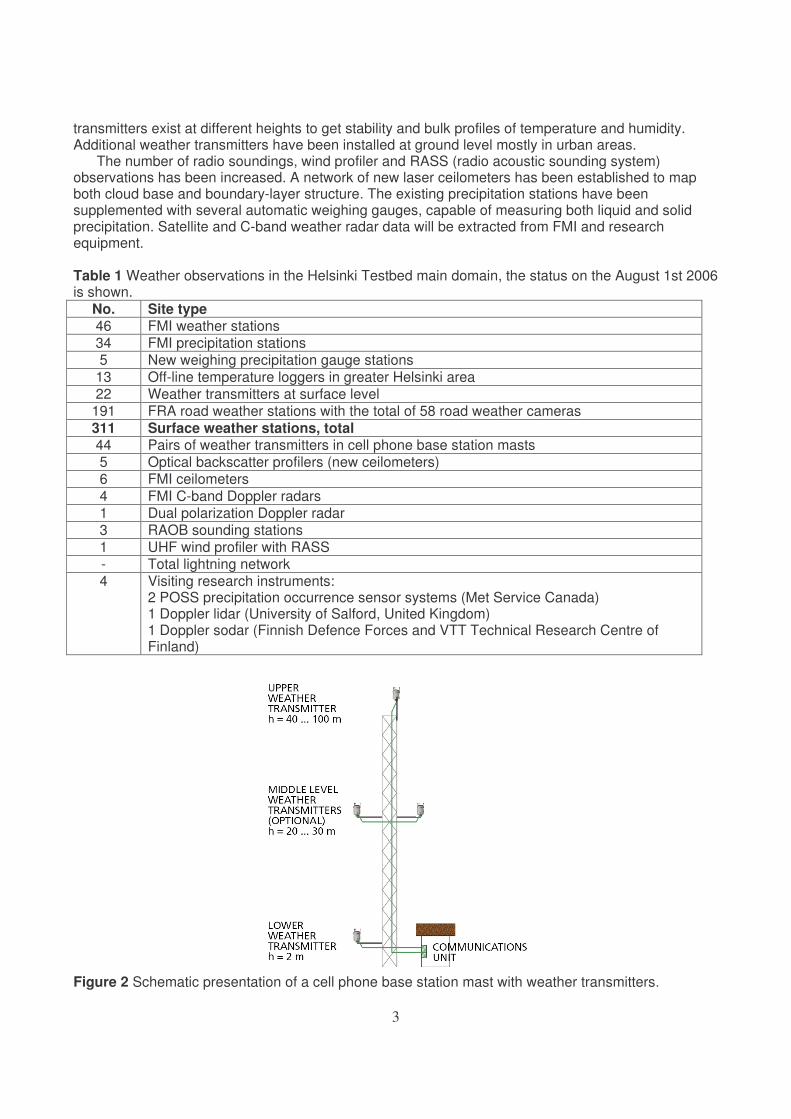
transmitters exist at different heights to get stability and bulk profiles of temperature and humidity. Additional weather transmitters have been installed at ground level mostly in urban areas. The number of radio soundings, wind profiler and RASS (radio acoustic sounding system) observations has been increased. A network of new laser ceilometers has been established to map both cloud base and boundary-layer structure. The existing precipitation stations have been supplemented with several automatic weighing gauges, capable of measuring both liquid and solid precipitation. Satellite and C-band weather radar data will be extracted from FMI and research equipment. Table 1 Weather observations in the Helsinki Testbed main domain, the status on the August 1st 2006 is shown.
No. Site type 46 FMI weather stations 34 FMI precipitation stations 5 New weighing precipitation gauge stations
13 Off-line temperature loggers in greater Helsinki area 22 Weather transmitters at surface level 191 FRA road weather stations with the total of 58 road weather cameras 311 Surface weather stations, total 44 Pairs of weather transmitters in cell phone base station masts 5 Optical backscatter profilers (new ceilometers) 6 FMI ceilometers 4 FMI C-band Doppler radars 1 Dual polarization Doppler radar 3 RAOB sounding stations 1 UHF wind profiler with RASS - Total lightning network 4 Visiting research instruments:
2 POSS precipitation occurrence sensor systems (Met Service Canada) 1 Doppler lidar (University of Salford, United Kingdom) 1 Doppler sodar (Finnish Defence Forces and VTT Technical Research Centre of Finland)
Figure 2 Schematic presentation of a cell phone base station mast with weather transmitters.
4
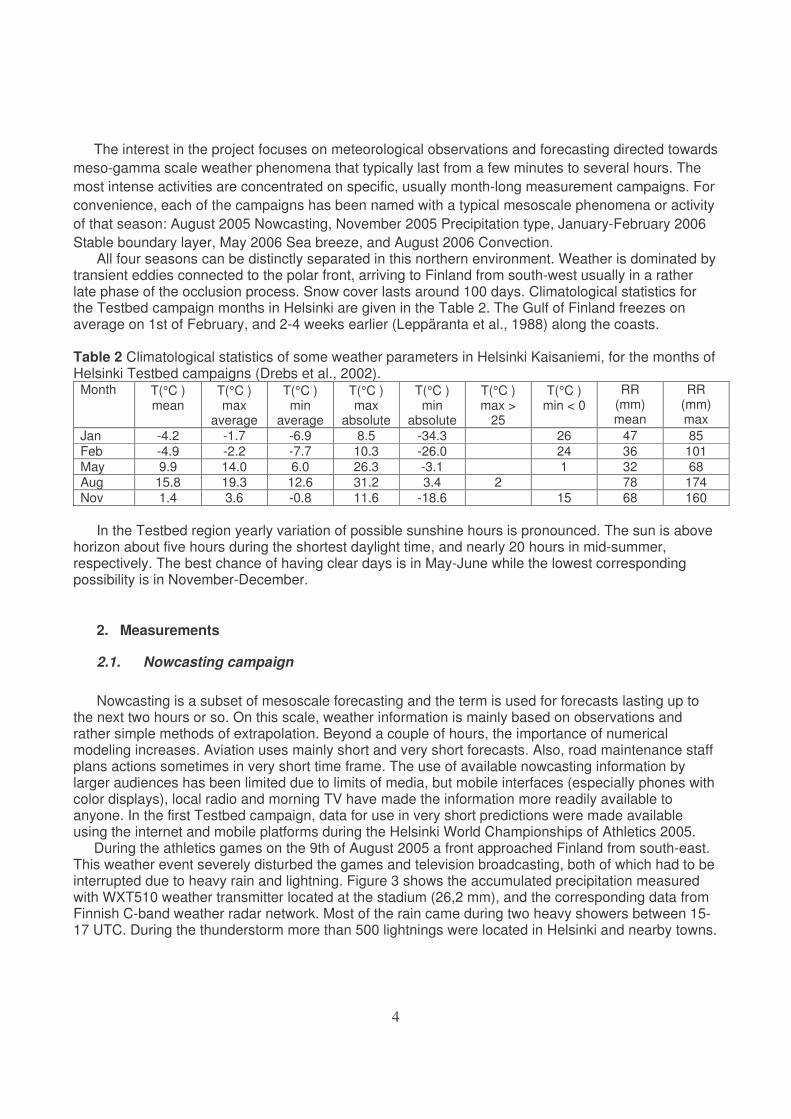
The interest in the project focuses on meteorological observations and forecasting directed towards meso-gamma scale weather phenomena that typically last from a few minutes to several hours. The most intense activities are concentrated on specific, usually month-long measurement campaigns. For convenience, each of the campaigns has been named with a typical mesoscale phenomena or activity of that season: August 2005 Nowcasting, November 2005 Precipitation type, January-February 2006 Stable boundary layer, May 2006 Sea breeze, and August 2006 Convection. All four seasons can be distinctly separated in this northern environment. Weather is dominated by transient eddies connected to the polar front, arriving to Finland from south-west usually in a rather late phase of the occlusion process. Snow cover lasts around 100 days. Climatological statistics for the Testbed campaign months in Helsinki are given in the Table 2. The Gulf of Finland freezes on average on 1st of February, and 2-4 weeks earlier (Leppäranta et al., 1988) along the coasts. Table 2 Climatological statistics of some weather parameters in Helsinki Kaisaniemi, for the months of Helsinki Testbed campaigns (Drebs et al., 2002). Month T(°C )
mean T(°C ) max
average
T(°C ) min
average
T(°C ) max
absolute
T(°C ) min
absolute
T(°C ) max >
25
T(°C ) min < 0
RR (mm) mean
RR (mm) max
Jan -4.2 -1.7 -6.9 8.5 -34.3 26 47 85 Feb -4.9 -2.2 -7.7 10.3 -26.0 24 36 101 May 9.9 14.0 6.0 26.3 -3.1 1 32 68 Aug 15.8 19.3 12.6 31.2 3.4 2 78 174 Nov 1.4 3.6 -0.8 11.6 -18.6 15 68 160
In the Testbed region yearly variation of possible sunshine hours is pronounced. The sun is above horizon about five hours during the shortest daylight time, and nearly 20 hours in mid-summer, respectively. The best chance of having clear days is in May-June while the lowest corresponding possibility is in November-December.
2. Measurements
2.1. Nowcasting campaign
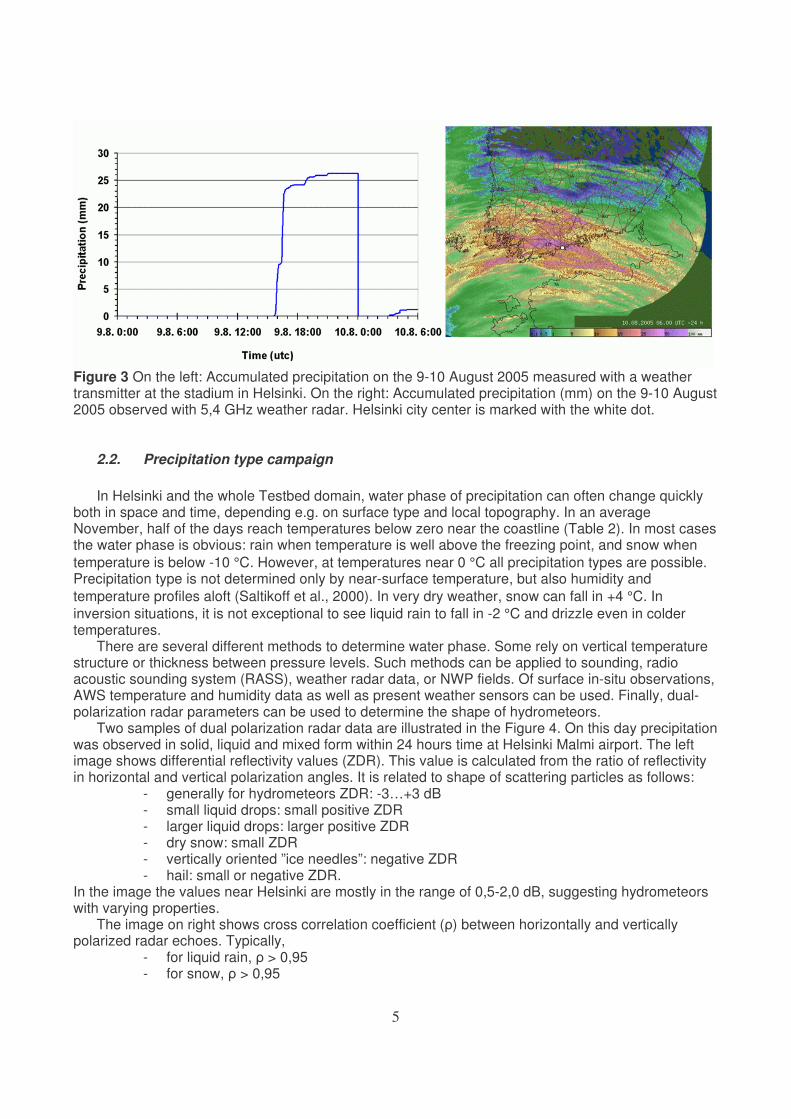
Nowcasting is a subset of mesoscale forecasting and the term is used for forecasts lasting up to the next two hours or so. On this scale, weather information is mainly based on observations and rather simple methods of extrapolation. Beyond a couple of hours, the importance of numerical modeling increases. Aviation uses mainly short and very short forecasts. Also, road maintenance staff plans actions sometimes in very short time frame. The use of available nowcasting information by larger audiences has been limited due to limits of media, but mobile interfaces (especially phones with color displays), local radio and morning TV have made the information more readily available to anyone. In the first Testbed campaign, data for use in very short predictions were made available using the internet and mobile platforms during the Helsinki World Championships of Athletics 2005. During the athletics games on the 9th of August 2005 a front approached Finland from south-east. This weather event severely disturbed the games and television broadcasting, both of which had to be interrupted due to heavy rain and lightning. Figure 3 shows the accumulated precipitation measured with WXT510 weather transmitter located at the stadium (26,2 mm), and the corresponding data from Finnish C-band weather radar network. Most of the rain came during two heavy showers between 15-17 UTC. During the thunderstorm more than 500 lightnings were located in Helsinki and nearby towns.
5
Figure 3 On the left: Accumulated precipitation on the 9-10 August 2005 measured with a weather transmitter at the stadium in Helsinki. On the right: Accumulated precipitation (mm) on the 9-10 August 2005 observed with 5,4 GHz weather radar. Helsinki city center is marked with the white dot.
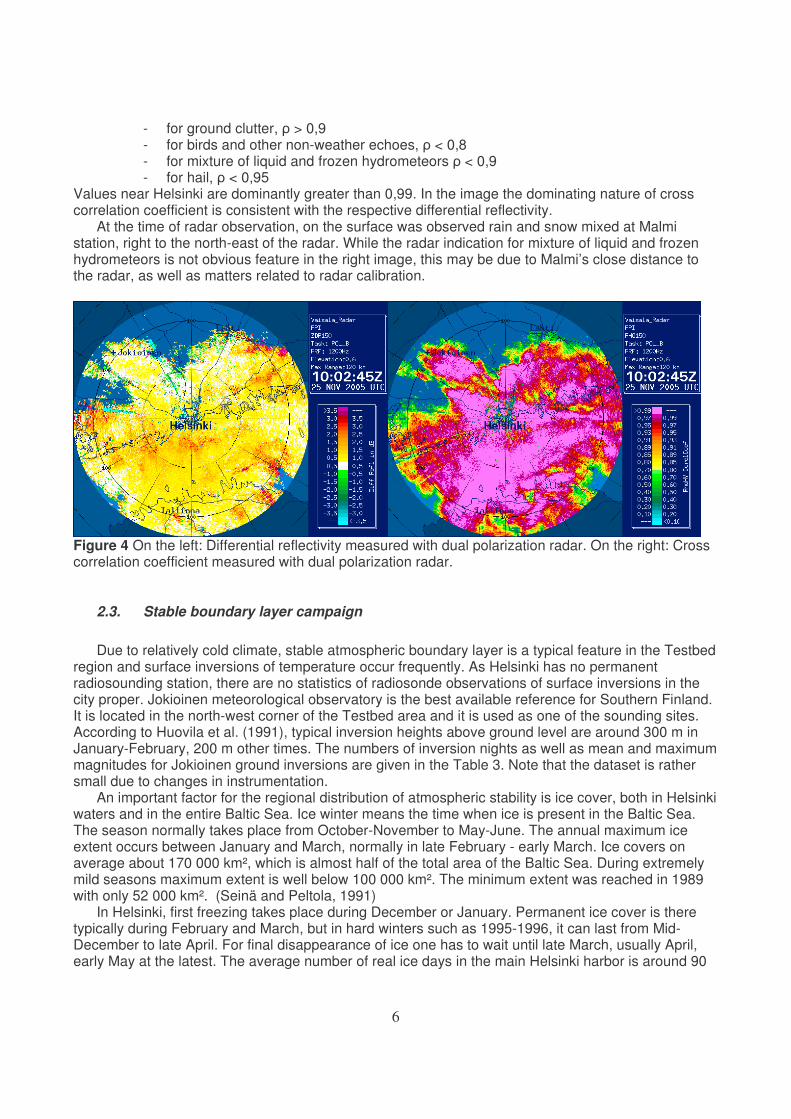
2.2. Precipitation type campaign In Helsinki and the whole Testbed domain, water phase of precipitation can often change quickly both in space and time, depending e.g. on surface type and local topography. In an average November, half of the days reach temperatures below zero near the coastline (Table 2). In most cases the water phase is obvious: rain when temperature is well above the freezing point, and snow when temperature is below -10 °C. However, at temperatures near 0 °C all precipitation types are possible. Precipitation type is not determined only by near-surface temperature, but also humidity and temperature profiles aloft (Saltikoff et al., 2000). In very dry weather, snow can fall in +4 °C. In inversion situations, it is not exceptional to see liquid rain to fall in -2 °C and drizzle even in colder temperatures. There are several different methods to determine water phase. Some rely on vertical temperature structure or thickness between pressure levels. Such methods can be applied to sounding, radio acoustic sounding system (RASS), weather radar data, or NWP fields. Of surface in-situ observations, AWS temperature and humidity data as well as present weather sensors can be used. Finally, dual-polarization radar parameters can be used to determine the shape of hydrometeors. Two samples of dual polarization radar data are illustrated in the Figure 4. On this day precipitation was observed in solid, liquid and mixed form within 24 hours time at Helsinki Malmi airport. The left image shows differential reflectivity values (ZDR). This value is calculated from the ratio of reflectivity in horizontal and vertical polarization angles. It is related to shape of scattering particles as follows:
- generally for hydrometeors ZDR: -3…+3 dB - small liquid drops: small positive ZDR - larger liquid drops: larger positive ZDR - dry snow: small ZDR - vertically oriented ”ice needles”: negative ZDR - hail: small or negative ZDR.
In the image the values near Helsinki are mostly in the range of 0,5-2,0 dB, suggesting hydrometeors with varying properties.
The image on right shows cross correlation coefficient (�) between horizontally and vertically polarized radar echoes. Typically,
- for liquid rain, � > 0,95 - for snow, � > 0,95
6
- for ground clutter, � > 0,9 - for birds and other non-weather echoes, � < 0,8 - for mixture of liquid and frozen hydrometeors � < 0,9 - for hail, � < 0,95
Values near Helsinki are dominantly greater than 0,99. In the image the dominating nature of cross correlation coefficient is consistent with the respective differential reflectivity. At the time of radar observation, on the surface was observed rain and snow mixed at Malmi station, right to the north-east of the radar. While the radar indication for mixture of liquid and frozen hydrometeors is not obvious feature in the right image, this may be due to Malmi’s close distance to the radar, as well as matters related to radar calibration.
Figure 4 On the left: Differential reflectivity measured with dual polarization radar. On the right: Cross correlation coefficient measured with dual polarization radar.
2.3. Stable boundary layer campaign Due to relatively cold climate, stable atmospheric boundary layer is a typical feature in the Testbed region and surface inversions of temperature occur frequently. As Helsinki has no permanent radiosounding station, there are no statistics of radiosonde observations of surface inversions in the city proper. Jokioinen meteorological observatory is the best available reference for Southern Finland. It is located in the north-west corner of the Testbed area and it is used as one of the sounding sites. According to Huovila et al. (1991), typical inversion heights above ground level are around 300 m in January-February, 200 m other times. The numbers of inversion nights as well as mean and maximum magnitudes for Jokioinen ground inversions are given in the Table 3. Note that the dataset is rather small due to changes in instrumentation. An important factor for the regional distribution of atmospheric stability is ice cover, both in Helsinki waters and in the entire Baltic Sea. Ice winter means the time when ice is present in the Baltic Sea. The season normally takes place from October-November to May-June. The annual maximum ice extent occurs between January and March, normally in late February - early March. Ice covers on average about 170 000 km², which is almost half of the total area of the Baltic Sea. During extremely mild seasons maximum extent is well below 100 000 km². The minimum extent was reached in 1989 with only 52 000 km². (Seinä and Peltola, 1991) In Helsinki, first freezing takes place during December or January. Permanent ice cover is there typically during February and March, but in hard winters such as 1995-1996, it can last from Mid-December to late April. For final disappearance of ice one has to wait until late March, usually April, early May at the latest. The average number of real ice days in the main Helsinki harbor is around 90
7
days; for the Harmaja island archipelago (4 km from mainland) it is 60 days; and for open sea (22 km from mainland) it is 30 days. (Seinä et al., 2001 and Vainio, 2005) Table 3 Inversion statistics of Jokioinen 1982-1988 at 00 UTC for the months of the Helsinki Testbed campaigns (Huovila et al., 1991). The magnitudes of inversions are expressed as difference of screen temperature (2 m) and temperature at the top of inversion. Number of
inversion nights (min, mean, max)
Mean height (m) Mean size (°C) Max size (°C)
Jan 4, 11, 22 290 7.4 20.1 Feb 3, 12, 20 303 6.9 19.5 May 13, 19, 26 196 4.8 11.4 Aug 14, 19, 29 193 3.4 10.2 Nov 3, 7 ,12 187 2.9 8.5
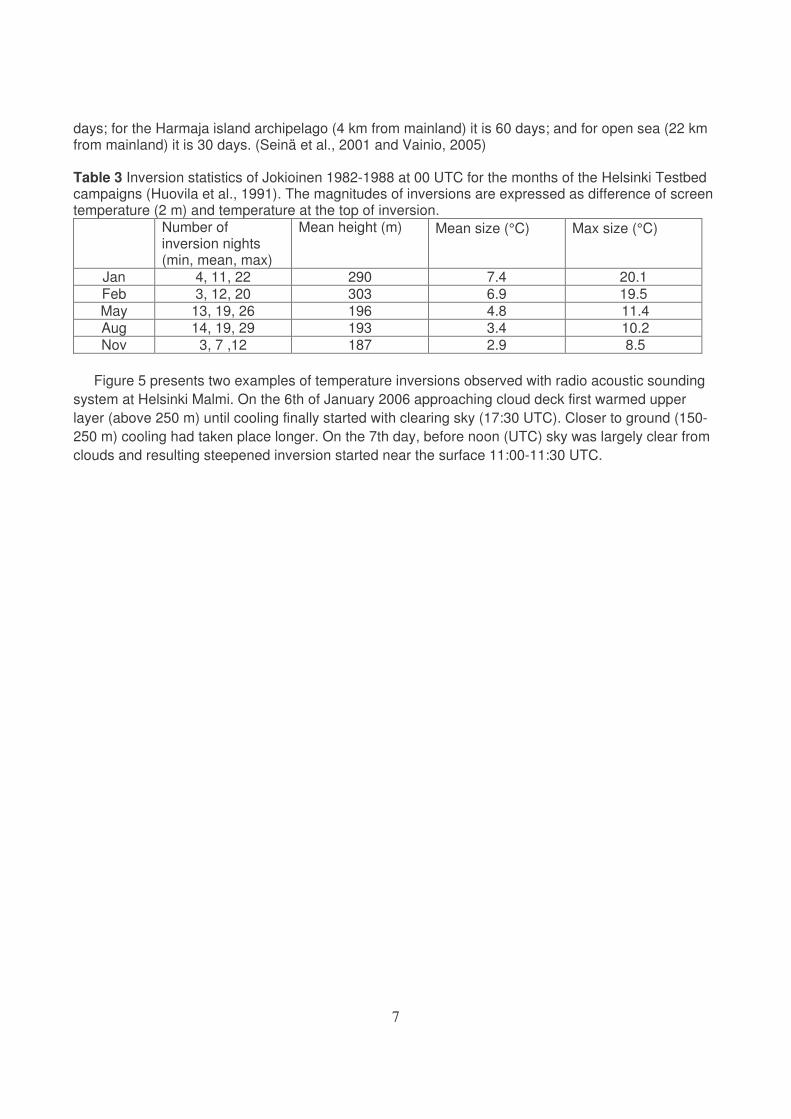
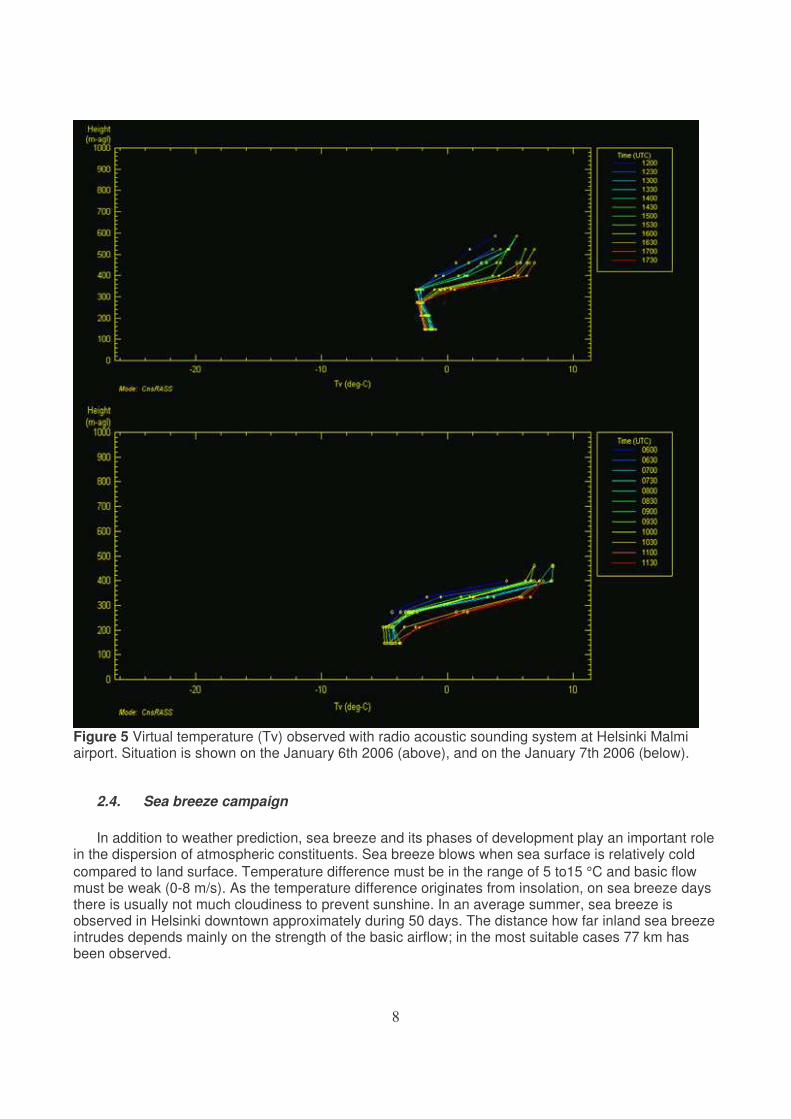
Figure 5 presents two examples of temperature inversions observed with radio acoustic sounding system at Helsinki Malmi. On the 6th of January 2006 approaching cloud deck first warmed upper layer (above 250 m) until cooling finally started with clearing sky (17:30 UTC). Closer to ground (150-250 m) cooling had taken place longer. On the 7th day, before noon (UTC) sky was largely clear from clouds and resulting steepened inversion started near the surface 11:00-11:30 UTC.
8
Figure 5 Virtual temperature (Tv) observed with radio acoustic sounding system at Helsinki Malmi airport. Situation is shown on the January 6th 2006 (above), and on the January 7th 2006 (below).
2.4. Sea breeze campaign In addition to weather prediction, sea breeze and its phases of development play an important role in the dispersion of atmospheric constituents. Sea breeze blows when sea surface is relatively cold compared to land surface. Temperature difference must be in the range of 5 to15 °C and basic flow must be weak (0-8 m/s). As the temperature difference originates from insolation, on sea breeze days there is usually not much cloudiness to prevent sunshine. In an average summer, sea breeze is observed in Helsinki downtown approximately during 50 days. The distance how far inland sea breeze intrudes depends mainly on the strength of the basic airflow; in the most suitable cases 77 km has been observed.
9
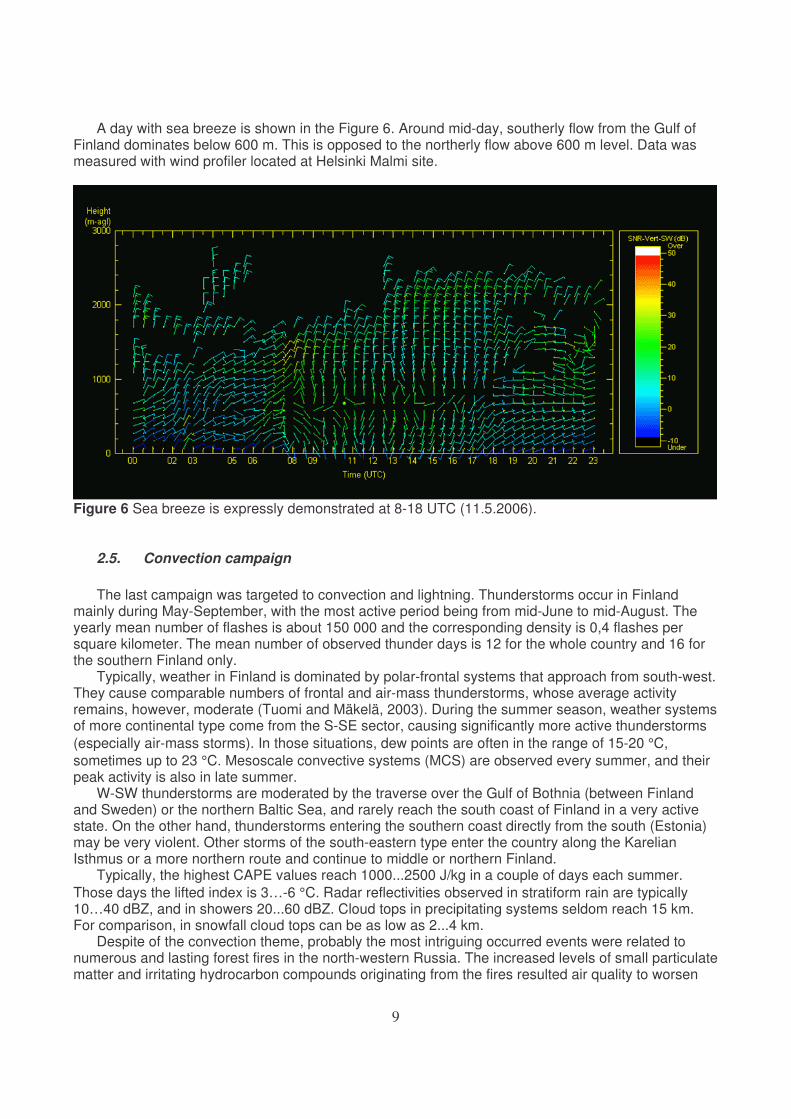
A day with sea breeze is shown in the Figure 6. Around mid-day, southerly flow from the Gulf of Finland dominates below 600 m. This is opposed to the northerly flow above 600 m level. Data was measured with wind profiler located at Helsinki Malmi site.
Figure 6 Sea breeze is expressly demonstrated at 8-18 UTC (11.5.2006).
2.5. Convection campaign The last campaign was targeted to convection and lightning. Thunderstorms occur in Finland mainly during May-September, with the most active period being from mid-June to mid-August. The yearly mean number of flashes is about 150 000 and the corresponding density is 0,4 flashes per square kilometer. The mean number of observed thunder days is 12 for the whole country and 16 for the southern Finland only. Typically, weather in Finland is dominated by polar-frontal systems that approach from south-west. They cause comparable numbers of frontal and air-mass thunderstorms, whose average activity remains, however, moderate (Tuomi and Mäkelä, 2003). During the summer season, weather systems of more continental type come from the S-SE sector, causing significantly more active thunderstorms (especially air-mass storms). In those situations, dew points are often in the range of 15-20 °C, sometimes up to 23 °C. Mesoscale convective systems (MCS) are observed every summer, and their peak activity is also in late summer. W-SW thunderstorms are moderated by the traverse over the Gulf of Bothnia (between Finland and Sweden) or the northern Baltic Sea, and rarely reach the south coast of Finland in a very active state. On the other hand, thunderstorms entering the southern coast directly from the south (Estonia) may be very violent. Other storms of the south-eastern type enter the country along the Karelian Isthmus or a more northern route and continue to middle or northern Finland. Typically, the highest CAPE values reach 1000...2500 J/kg in a couple of days each summer. Those days the lifted index is 3…-6 °C. Radar reflectivities observed in stratiform rain are typically 10…40 dBZ, and in showers 20...60 dBZ. Cloud tops in precipitating systems seldom reach 15 km. For comparison, in snowfall cloud tops can be as low as 2...4 km. Despite of the convection theme, probably the most intriguing occurred events were related to numerous and lasting forest fires in the north-western Russia. The increased levels of small particulate matter and irritating hydrocarbon compounds originating from the fires resulted air quality to worsen
10
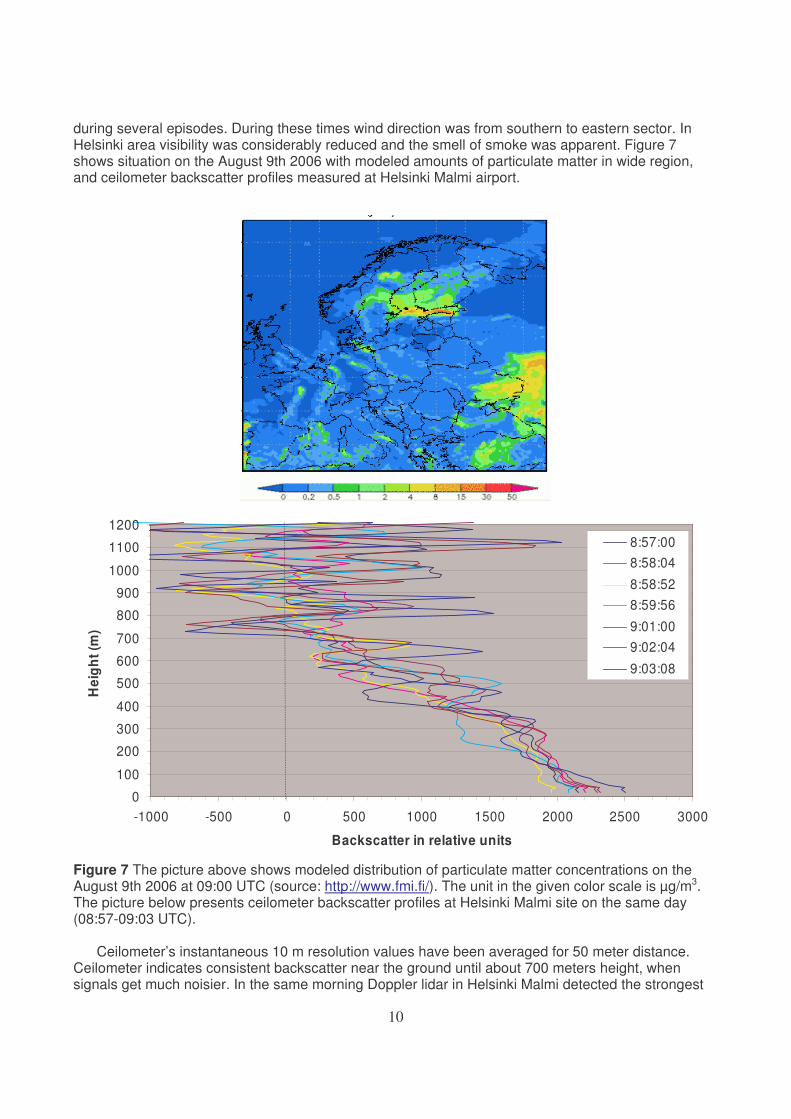
during several episodes. During these times wind direction was from southern to eastern sector. In Helsinki area visibility was considerably reduced and the smell of smoke was apparent. Figure 7 shows situation on the August 9th 2006 with modeled amounts of particulate matter in wide region, and ceilometer backscatter profiles measured at Helsinki Malmi airport.
0
100
200
300
400
500
600
700
800
900
1000
1100
1200
-1000 -500 0 500 1000 1500 2000 2500 3000
Backscatter in relative units
Hei
ght (
m)
8:57:008:58:04
8:58:528:59:56
9:01:009:02:04
9:03:08
Figure 7 The picture above shows modeled distribution of particulate matter concentrations on the August 9th 2006 at 09:00 UTC (source: http://www.fmi.fi/). The unit in the given color scale is µg/m3. The picture below presents ceilometer backscatter profiles at Helsinki Malmi site on the same day (08:57-09:03 UTC). Ceilometer’s instantaneous 10 m resolution values have been averaged for 50 meter distance. Ceilometer indicates consistent backscatter near the ground until about 700 meters height, when signals get much noisier. In the same morning Doppler lidar in Helsinki Malmi detected the strongest

11
atmospheric backscatter layer below 300 meters extending occasionally to over 600 meters. For another comparison, during the time interval of 08:57 – 09:03 UTC ceilometer backscatter from cloud bases at about 2800 m height caused roughly 40 times stronger echoes. Close to the end of the initial measurement campaign, Finland’s EU presidency brought the sixth ASEM (Asia-Europe meeting) summit to Helsinki 10-11.9.2006. The weather data provided by the Testbed project was requested to be available for ASEM related safety and warning services. Therefore the length of the formal Testbed measurement campaign was extended to last until 15.9.2006.
3. Practical goals and information and communication technology (ICT) design
In observation production and information integration, joining different measurement systems touches upon many technical as well as data content issues. One of the goals in Helsinki Testbed is the demonstration of technology integration of meteorological instruments, observation systems, and ICT-technologies with end-user interfaces. It is anticipated that meteorological information systems are likely to further develop towards automated information processes. These include dynamic process logic thus enabling more efficient resource utilization. Both fully automated and human intervened processes will interact with other processes, examples being adaptive sampling strategies responsive to current and predicted weather patters, as well as advanced control engineering methods in data quality control and respective network maintenance processes.
Fast developing and changing technologies are likely to lead to a mixture of solutions, including e.g. sensor, data transmission and processing technologies. Integration of meteorological measurement systems to other information technologies can not be avoided. However, from a combined meteorological and ICT-technological perspective, available standardization does not always keep up with the pace of technological progress.
Goals of a testbed include pursuing solutions for large-scale infrastructures and efficient measurement network maintenance. On the course of history, many separate networks and other data sources have come to existence, and in many cases data producers represent different organizations and different countries. In search of both meteorologically and economically feasible solutions in continuously evolving requirement space, data contents from different sources have to be combined. Modularity and well defined open data interfaces are crucial from product development and network management viewpoints.
Testbed provides tools to tune operational system cost levels so that data quality issues can be treated in a credible way for the varying foci of meteorological measurements. For example, cost-quality optimized requirements of global, climatologically representative data are likely to be different from respective requirements of data input for operational mesoscale nowcasting.
During the Helsinki Testbed campaigns free real-time and past data were provided on the web (http://testbed.fmi.fi/) along with non-profit mobile products. Offered mobile data products were WAP observation maps with color graphics and a weather software client for new mobile operating systems. In the Helsinki Testbed, freely distributable XML schema named FMML (Finnish Meteorological Markup Language) was defined in meteorological data exchange for heterogeneous data sources. The schema is accessible at http://xml.fmi.fi/fmml/.
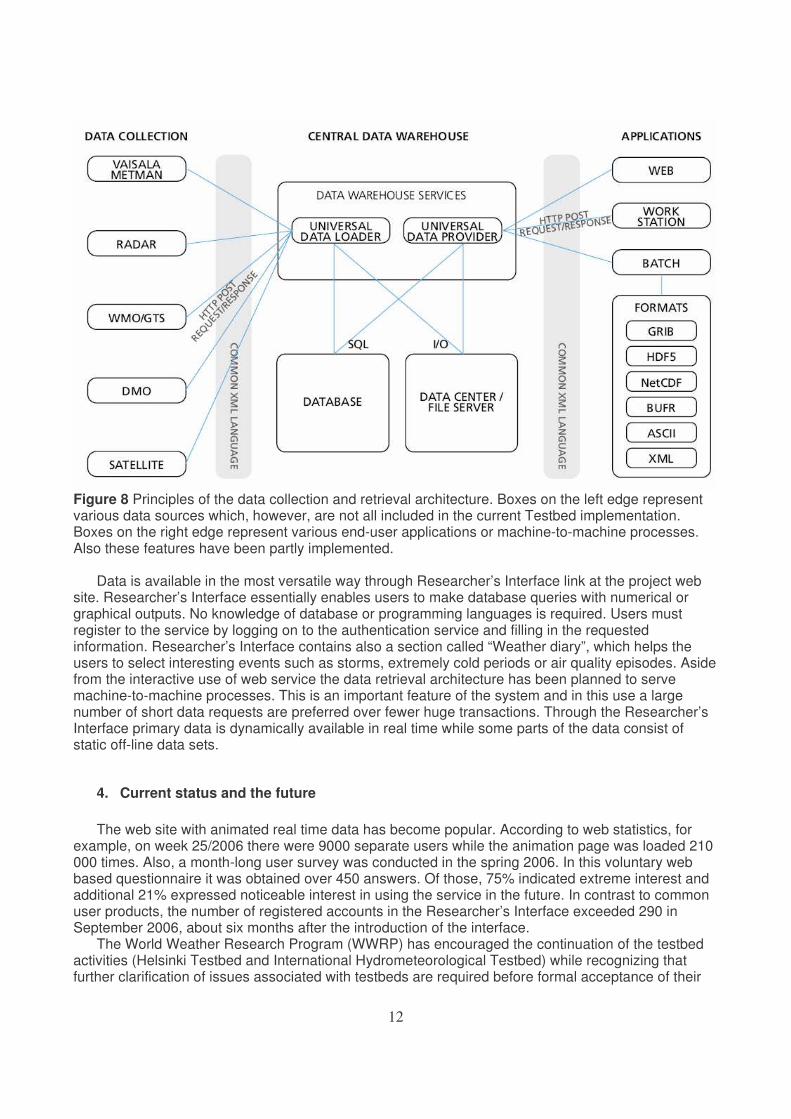
Data from weather stations are collected via GPRS or ASDL connection, checked with quality flags and put into the database. Both database insertions and retrievals are done using the FMML specification. In the current approach, open protocols, multi-tier and service oriented architecture (SOA) together with generic data interface set the basis for future expansion and integration of systems (Figure 8).
12
Figure 8 Principles of the data collection and retrieval architecture. Boxes on the left edge represent various data sources which, however, are not all included in the current Testbed implementation. Boxes on the right edge represent various end-user applications or machine-to-machine processes. Also these features have been partly implemented.
Data is available in the most versatile way through Researcher’s Interface link at the project web
site. Researcher’s Interface essentially enables users to make database queries with numerical or graphical outputs. No knowledge of database or programming languages is required. Users must register to the service by logging on to the authentication service and filling in the requested information. Researcher’s Interface contains also a section called “Weather diary”, which helps the users to select interesting events such as storms, extremely cold periods or air quality episodes. Aside from the interactive use of web service the data retrieval architecture has been planned to serve machine-to-machine processes. This is an important feature of the system and in this use a large number of short data requests are preferred over fewer huge transactions. Through the Researcher’s Interface primary data is dynamically available in real time while some parts of the data consist of static off-line data sets.
4. Current status and the future The web site with animated real time data has become popular. According to web statistics, for
example, on week 25/2006 there were 9000 separate users while the animation page was loaded 210 000 times. Also, a month-long user survey was conducted in the spring 2006. In this voluntary web based questionnaire it was obtained over 450 answers. Of those, 75% indicated extreme interest and additional 21% expressed noticeable interest in using the service in the future. In contrast to common user products, the number of registered accounts in the Researcher’s Interface exceeded 290 in September 2006, about six months after the introduction of the interface.
The World Weather Research Program (WWRP) has encouraged the continuation of the testbed activities (Helsinki Testbed and International Hydrometeorological Testbed) while recognizing that further clarification of issues associated with testbeds are required before formal acceptance of their
13
role in WWRP could be adopted (WMO, 2005). These include mechanisms for overall scientific management, reporting arrangements to WWRP, legal and intellectual property issues and definition.
The original Helsinki Testbed project ends in September 2007, whereas the observations were first planned only until August 2006. There were several reasons for having a limited set of publicly available data. Project goals included technology demonstration in meteorological information production, which had to be realized with publicly available weather products. Certain campaign months were chosen in order to capture typical mesoscale weather phenomena of all the seasons. Started as a research project, there were not allocated resources for continuous supervision and maintenance of the measurements. Also, conflicting interests were first encountered with commercial weather service providers.
On the course of the project public web services gained noticeable popularity so that it was later chosen to extend the service availability at least until the end of 2006. Further, in the future the network is expected to be operated as pseudo-operational platform. The Helsinki Testbed is open to researchers around the world to test measurement and modeling systems. For anyone interested, research oriented data will be accessible on the project web site for the foreseeable future through the Researcher’s Interface.
References Dabberdt, W. F., T. W. Schlatter and F. H. Carr with E. W. J. Friday, D. Jorgensen, S. Koch, M.
Pirone, M. Ralph, J. Sun, P. Welsh, J. Wilson and X. Zou, 2005: Multifunctional Mesoscale Observing Networks. Bull. Amer. Meteor. Soc., 86(7).
Drebs, A., A. Nordlund, P. Karlsson, J. Helminen and P. Rissanen, 2002: Climatological statistics
of Finland 1971-2000. Finnish Meteorological Institute, Helsinki, Finland. Huovila, S., M.-L. Luukkanen and A. Tuominen, 1991: Some features of ground inversions in Finland.
Finnish Meteorological Institute, Helsinki, Finland. ISBN 951-697-353-1. Leppäranta M., E. Palosuo, H. Grönvall, S. Kalliosaari, A. Seinä and J. Peltola, 1988: Phases of
the ice season in the Baltic Sea (North of latitude 57º N), Finnish Institute of Marine Research, No. 254.
Saltikoff, E., H. Hohti and J. Koistinen, 2000: Operational experience of adjustment of Z-R
according to water phase. Phys. Chem. Earth (B), 25, 1017-1021. Seinä, A. and J. Peltola, 1991: Jäätalvenkestoaika ja kiintojään paksuustilastoja Suomen merialueilla /
Duration of the ice season and statistics of fast ice thickness along the Finnish Coast 1961-1990, Finnish Marine Research N:o 258.
Seinä, A., H. Grönvall, S. Kalliosaari and J. Vainio, 2001: Ice seasons 1996-2000 in Finnish sea areas.
- Meri - Report Series of the Finnish Institute of Marine Research (43):3-98. Tuomi, T. J. and A. Mäkelä, 2003: Synoptic classification of thunderstorms in Finland. Geophysica,
39(1-2), 3-30. Vainio, J., 2005: Personal communication. WMO, 2005: Draft report of the eight session of the science steering committee for WWRP. China
Meteorological Administration, Kunming, Yunnan, China, 26-30 October 2005.