heparan sulfate proteoglycans as drivers of neural progenitors … · tailed unpaired student’s...
TRANSCRIPT
fnmol-11-00134 April 23, 2018 Time: 16:52 # 1
ORIGINAL RESEARCHpublished: 24 April 2018
doi: 10.3389/fnmol.2018.00134
Edited by:Detlev Boison,
Legacy Health, United States
Reviewed by:Daniele Bottai,
Università degli Studi di Milano, ItalyMunjal M. Acharya,
University of California, Irvine,United States
*Correspondence:Larisa M. Haupt
Received: 05 January 2018Accepted: 03 April 2018Published: 24 April 2018
Citation:Okolicsanyi RK, Oikari LE, Yu C,
Griffiths LR and Haupt LM (2018)Heparan Sulfate Proteoglycans as
Drivers of Neural Progenitors DerivedFrom Human Mesenchymal Stem
Cells. Front. Mol. Neurosci. 11:134.doi: 10.3389/fnmol.2018.00134
Heparan Sulfate Proteoglycans asDrivers of Neural ProgenitorsDerived From Human MesenchymalStem CellsRachel K. Okolicsanyi, Lotta E. Oikari, Chieh Yu, Lyn R. Griffiths and Larisa M. Haupt*
Genomics Research Centre, Institute of Health and Biomedical Innovation, School of Biomedical Sciences, QueenslandUniversity of Technology, Brisbane, QLD, Australia
Background: Due to their relative ease of isolation and their high ex vivo andin vitro expansive potential, human mesenchymal stem cells (hMSCs) are an attractivecandidate for therapeutic applications in the treatment of brain injury and neurologicaldiseases. Heparan sulfate proteoglycans (HSPGs) are a family of ubiquitous proteinsinvolved in a number of vital cellular processes including proliferation and stem celllineage differentiation.
Methods: Following the determination that hMSCs maintain neural potential throughoutextended in vitro expansion, we examined the role of HSPGs in mediating the neuralpotential of hMSCs. hMSCs cultured in basal conditions (undifferentiated monolayercultures) were found to co-express neural markers and HSPGs throughout expansionwith modulation of the in vitro niche through the addition of exogenous HS influencingcellular HSPG and neural marker expression.
Results: Conversion of hMSCs into hMSC Induced Neurospheres (hMSC IN) identifieddistinctly localized HSPG staining within the spheres along with altered gene expressionof HSPG core protein and biosynthetic enzymes when compared to undifferentiatedhMSCs.
Conclusion: Comparison of markers of pluripotency, neural self-renewal and neurallineage specification between hMSC IN, hMSC and human neural stem cell (hNSCH9) cultures suggest that in vitro generated hMSC IN may represent an intermediaryneurogenic cell type, similar to a common neural progenitor cell. In addition, this datademonstrates HSPGs and their biosynthesis machinery, are associated with hMSC INformation. The identification of specific HSPGs driving hMSC lineage-specification willlikely provide new markers to allow better use of hMSCs in therapeutic applications andimprove our understanding of human neurogenesis.
Keywords: heparan sulfate proteoglycans, mesenchymal stem cell induced neurospheres, neural potential,glypican, syndecan, neural stem cell
Frontiers in Molecular Neuroscience | www.frontiersin.org 1 April 2018 | Volume 11 | Article 134
fnmol-11-00134 April 23, 2018 Time: 16:52 # 2
Okolicsanyi et al. HSPGs and hMSC Neural Lineage Specification
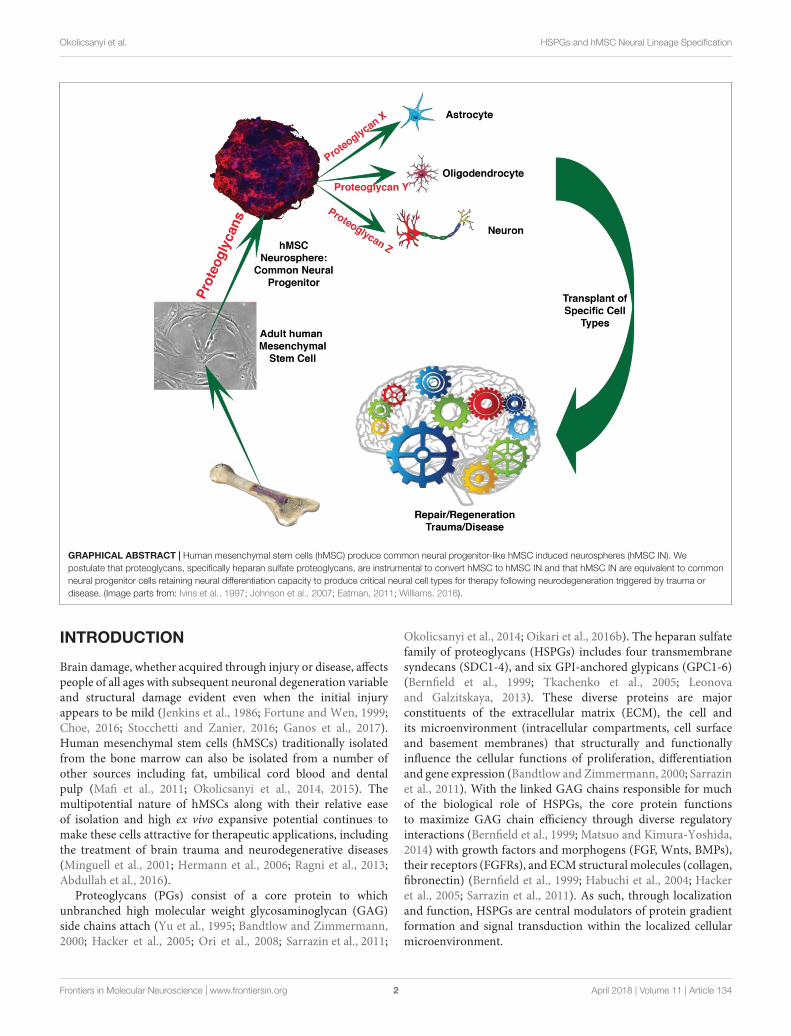
GRAPHICAL ABSTRACT | Human mesenchymal stem cells (hMSC) produce common neural progenitor-like hMSC induced neurospheres (hMSC IN). Wepostulate that proteoglycans, specifically heparan sulfate proteoglycans, are instrumental to convert hMSC to hMSC IN and that hMSC IN are equivalent to commonneural progenitor cells retaining neural differentiation capacity to produce critical neural cell types for therapy following neurodegeneration triggered by trauma ordisease. (Image parts from: Ivins et al., 1997; Johnson et al., 2007; Eatman, 2011; Williams, 2016).
INTRODUCTION
Brain damage, whether acquired through injury or disease, affectspeople of all ages with subsequent neuronal degeneration variableand structural damage evident even when the initial injuryappears to be mild (Jenkins et al., 1986; Fortune and Wen, 1999;Choe, 2016; Stocchetti and Zanier, 2016; Ganos et al., 2017).Human mesenchymal stem cells (hMSCs) traditionally isolatedfrom the bone marrow can also be isolated from a number ofother sources including fat, umbilical cord blood and dentalpulp (Mafi et al., 2011; Okolicsanyi et al., 2014, 2015). Themultipotential nature of hMSCs along with their relative easeof isolation and high ex vivo expansive potential continues tomake these cells attractive for therapeutic applications, includingthe treatment of brain trauma and neurodegenerative diseases(Minguell et al., 2001; Hermann et al., 2006; Ragni et al., 2013;Abdullah et al., 2016).
Proteoglycans (PGs) consist of a core protein to whichunbranched high molecular weight glycosaminoglycan (GAG)side chains attach (Yu et al., 1995; Bandtlow and Zimmermann,2000; Hacker et al., 2005; Ori et al., 2008; Sarrazin et al., 2011;
Okolicsanyi et al., 2014; Oikari et al., 2016b). The heparan sulfatefamily of proteoglycans (HSPGs) includes four transmembranesyndecans (SDC1-4), and six GPI-anchored glypicans (GPC1-6)(Bernfield et al., 1999; Tkachenko et al., 2005; Leonovaand Galzitskaya, 2013). These diverse proteins are majorconstituents of the extracellular matrix (ECM), the cell andits microenvironment (intracellular compartments, cell surfaceand basement membranes) that structurally and functionallyinfluence the cellular functions of proliferation, differentiationand gene expression (Bandtlow and Zimmermann, 2000; Sarrazinet al., 2011). With the linked GAG chains responsible for muchof the biological role of HSPGs, the core protein functionsto maximize GAG chain efficiency through diverse regulatoryinteractions (Bernfield et al., 1999; Matsuo and Kimura-Yoshida,2014) with growth factors and morphogens (FGF, Wnts, BMPs),their receptors (FGFRs), and ECM structural molecules (collagen,fibronectin) (Bernfield et al., 1999; Habuchi et al., 2004; Hackeret al., 2005; Sarrazin et al., 2011). As such, through localizationand function, HSPGs are central modulators of protein gradientformation and signal transduction within the localized cellularmicroenvironment.
Frontiers in Molecular Neuroscience | www.frontiersin.org 2 April 2018 | Volume 11 | Article 134

fnmol-11-00134 April 23, 2018 Time: 16:52 # 3
Okolicsanyi et al. HSPGs and hMSC Neural Lineage Specification
Neural development is a complex process comprised ofsuccessive phases of cell migration and differentiation associatedwith regulatory signaling events (Wilson and Edlund, 2001;Choi et al., 2006). SDCs influence cell adhesion, proliferationand differentiation (Hanahan and Weinberg, 2000; Wolf andFriedl, 2006; Okolicsanyi et al., 2014), with GPC proteins widelyexpressed throughout the central nervous system (CNS) duringdevelopment demonstrated to stimulate and inhibit signalingactivity (David, 1993; Lander et al., 1996; Fransson, 2003). HSPGactivity identified during neural development (Yamaguchi, 2001)and neural lineage specification (Pickford et al., 2011) appears tobe dependent on temporal developmental expression along withinteractions with appropriate signaling pathways through coreproteins and HS chain-specific sulfation (Yamaguchi, 2001).
Heparan sulfate dependent interactions of the BMP, Wnt andFGF signaling pathways have been suggested to regulate neuralspecification (Bally-Cuif and Hammerschmidt, 2003; Choi et al.,2006). In particular, the HS ligand FGF2 has a central role duringproliferation and differentiation of murine neural stem cells inthe developing cerebral cortex (Powell et al., 1991; Giordanoet al., 1992; Yamaguchi, 2001; Wiese et al., 2004), confirming theimportance of HSPGs in defining neural cell progenies (Qianet al., 1997; Yamaguchi, 2001).
Together with their extensive capacity for self-renewal,highly malleable mesenchymal stem cells (MSCs) give riseto diverse differentiated progenies, including neural lineages,and have important regenerative therapeutic potential fornumerous applications including the treatment of brain traumaand neurological disorders (Galindo et al., 2011). Althoughexpression of neural markers in MSCs in their undifferentiatedstate is now well documented in human and murine models(Bossolasco et al., 2005; Hermann et al., 2006; Alexanian,2010; Fricke et al., 2014; Okolicsanyi et al., 2014, 2015; Liet al., 2015; Marinowic et al., 2015), in order to fully exploittheir neurological regenerative potential, the identification ofkey genes regulating these processes is needed. We havepreviously examined commercially available hMSC donorpopulations for their expansive potential and identified keygrowth phases along with the maintenance of stemnessand multipotentiality during extended expansion in vitro(Okolicsanyi et al., 2015). Here we examined the potential roleof HSPGs in mediating hMSC neural specification during hMSCinduced neurosphere formation, a preliminary stage of hMSCneural differentiation.
MATERIALS AND METHODS
Cell CultureHuman mesenchymal stem cell (hMSC, n = 3) populations(Okolicsanyi et al., 2015) and human neural stem cells (hNSCH9) (Oikari et al., 2016b) were cultured under basal conditionsas previously described. These cells were obtained throughinformed consent (see manufacturer’s supporting documentation(USWV-10276) with no additional ethical approval needed forthis study and have been used previously (Okolicsanyi et al.,2015).
In Vitro Niche ModificationHeparin is a short, highly sulfated protein analog of heparansulfate (HS) with a several-fold higher degree of polymerizationand more extensive modification than HS (Sugahara andKitagawa, 2002) routinely used in cell culture and in vitro modelsas a HS substitute. Sodium chlorate competitively inhibits theformation of the high-energy sulfate donor in cellular sulfationreactions (Rapraeger et al., 1991), inhibiting further sulfation ofthe GAG chains. Treatment of cultures with 50 mM chloratehas been shown to inhibit overall O-sulfation of HS by ∼ 70%with N-sulfation remaining unchanged (Safaiyan et al., 1999),with lower concentrations of sodium chlorate (5–20 mM) shownto selectively reduce the 6-O-sulfation and a concentration of50 mM to reduce 2-O- and 6-O-sulfation (Safaiyan et al., 1999).Modulation of the in vitro niche was performed by the additionof exogenous heparin or sodium chlorate to cells plated in 24-wellplates (Corning, Australia) in varying concentrations: heparin(Sigma Aldrich, Australia) (0, 1, 5, 10, 25, and 50 µg/mL); sodiumchlorate (Sigma Aldrich) (0, 1, 5, 50, 100, and 500 mM). Inthe dose response experiment, cells were monitored for 5 dayswith samples collected at day 1 (D1), day 3 (D3) and day 5(D5) for RNA and protein isolation along with quantitation ofcell number and viability (Supplementary Figure S1). In allsubsequent experiments a concentration of 10 µg/mL heparin or50 mM sodium chlorate was used, with cells grown in triplicate(n = 9) and maintained for 3 days followed by RNA extractionand Q-PCR analysis.
hMSC Induced Neurosphere (hMSC IN)FormationhMSC IN were developed in basal hMSC cultures at growthphase A (P+5) as described previously (Okolicsanyi et al., 2015).Briefly, 3–5 × 10⁶ hMSCs were plated to low attachment culturedishes following dissociation of the monolayer. Cells were platedin knockout DMEM/F12 supplemented with 20 ng/mL each ofEGF and FGF and 10 µg/mL heparin. hMSC IN were observedafter a few hours. Media and growth factors were replaced after3 days following removal and filtering (40 µm filter; GreinerBio-One, Germany) to retain cells. Growth factors were furthersupplemented at D5 and hMSC IN harvested for subsequentanalysis after 7 days.
RNA Isolation, Reverse Transcription andQ-PCRRNA was isolated from hMSC and hNSC cultures as previouslydescribed (Okolicsanyi et al., 2015; Oikari et al., 2016b). Specificprimer sequences for all genes investigated are summarized inSupplementary Table S1. Q-PCR cycling and reaction conditionshave been described previously (Okolicsanyi et al., 2015; Oikariet al., 2016b). All Q-PCR experiments on undifferentiated cellswere performed in quadruplicate on biological triplicates. Q-PCRon hMSC IN and hNSC H9 were conducted in quadruplicate.Variation between hMSCs, hMSC IN and hNSC H9 were assessedusing a two-tailed unpaired Student’s T-test assuming unequalvariance. Statistical significance was set to α = 0.05. Mean geneexpression (2−11Ct) is presented with standard error of the
Frontiers in Molecular Neuroscience | www.frontiersin.org 3 April 2018 | Volume 11 | Article 134

fnmol-11-00134 April 23, 2018 Time: 16:52 # 4
Okolicsanyi et al. HSPGs and hMSC Neural Lineage Specification
mean (SEM). Differences in hMSC gene expression betweendose (heparin) and control were also assessed using a two-tailed unpaired Student’s T-test. Significance was set at α = 0.05.All gene Q-PCR expression was normalized to the endogenouscontrol 18S, determined as the appropriated endogenous controlfor hMSC cultures as previously described (Haupt et al., 2009;Okolicsanyi et al., 2015; Oikari et al., 2016a,b).
Immunocytochemistry of hMSCs andConfocal Microscopy of hMSC INImmunocytochemistry of hMSC cultures was performed aspreviously described (Okolicsanyi et al., 2015). For confocalmicroscopy, hMSC IN were plated in 8-chamber slides (NuncLab-Tek II CC2) and allowed to attach for 20 min. Half of themedia was then carefully replaced with 4% PFA (final 2% PFA)and hMSC IN fixed for 20 min before the medium/PFA mixwas replaced with 500 µL 4% PFA. hMSC IN were fixed for afurther 30 min at RT (static), before being carefully washed with1X PBS and stored at 4◦C in 1X PBS until staining. Blockingwas conducted in 5% NDS, 0.3% Triton X-100 in 1X PBS for1 h. Primary antibodies were diluted in blocking solution andcultures incubated overnight at 4◦C followed by three 5 minwashes in blocking solution containing 0.03% Triton-X-100and the slides re-blocked for 30 min followed by 1-h staticincubation at RT with secondary antibody solution. Secondaryantibodies and concentrations have been described previously(Okolicsanyi et al., 2015). Slides then underwent post-fixation(4% PFA, 20 min) and glycine-quenching (100 mM Glycine/PBS,20 min) prior to mounting with Fluoroshield anti-fade mountingmedium containing DAPI (Abcam). hMSC IN were imaged usinga Leica SP5 confocal system with Z-stacks created from slicestaken at 0.8 µm intervals and maximum intensity projectionsgenerated at post-processing. 3D reconstructions were createdusing Volocity v6.3 (Perkin-Elmer). All washing and blockingsteps were conducted with gentle rocking unless otherwise stated.
RESULTS
HSPG Gene Expression Correlates WithMarkers of Self-Renewal and NeuralLineagesGene expression of SDC and GPC core proteins were examinedunder basal culture conditions at previously identified growthphases (A-C) with the plateau growth phase (Phase D)(Okolicsanyi et al., 2015) not included in this study. Geneexpression of SDC1-3 increased throughout expansion (PhaseA-C) with these SDC genes displaying a relative twofold increasein gene expression by Phase C (Supplementary Figure S2A).In contrast, gene expression of SDC4 remained low throughoutexpansion with levels detected at Phase C at approximately 50%of the levels of SDC1 observed at Phase A (SupplementaryFigure S2A).
GPC1 demonstrated a twofold increase in expression byPhase C when compared to Phase A cells (SupplementaryFigure S2B). Expression of GPC2 and GPC3 was detected at
intermediate (Phase B) and late (Phase C) phases of growth,however, expression levels of these genes were observed to beless than 10% of GPC1 levels at corresponding growth phases(Supplementary Figure S2B). GPC2 and GPC3 demonstrated a1–2 fold increase in gene expression by growth Phase C. GPC4and GPC6 exhibited low levels of gene expression throughoutexpansion, with a moderate increase observed in Phase Bcultures. The gene expression level of GPC4 was observed to be60% lower than the level of GPC1 in the early phase of growth(Phase A) with GPC5 not expressed.
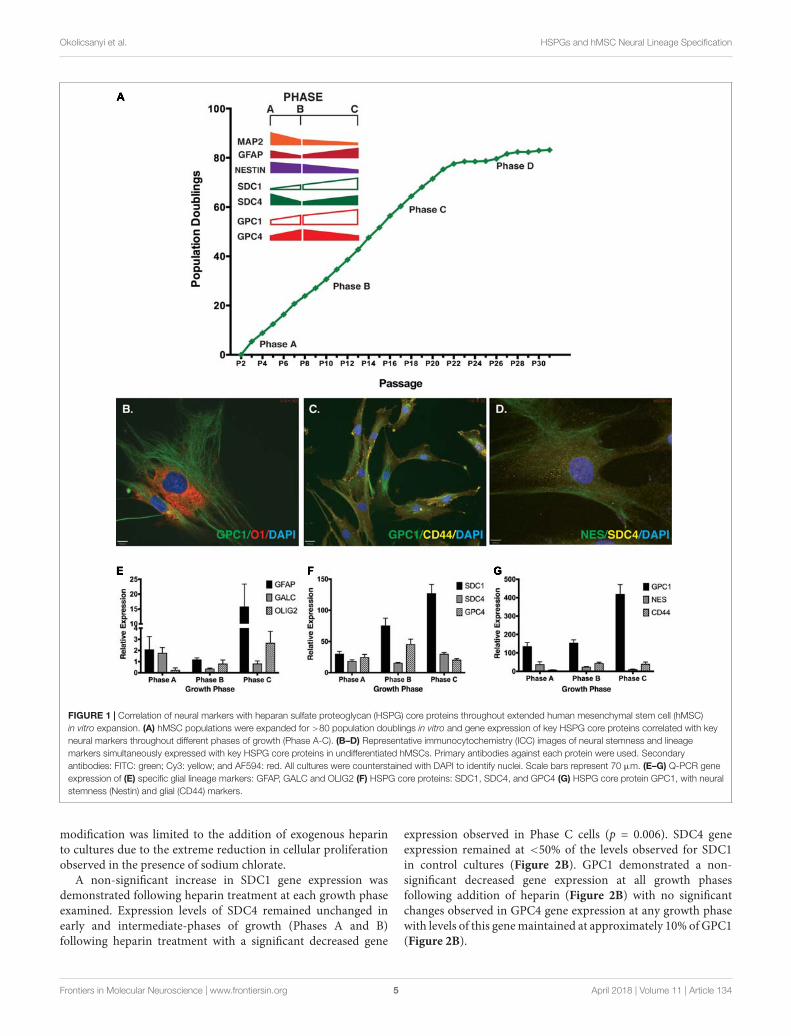
Neural stem cell self-renewal and neural lineage markersexamined in basal culture conditions included: Nestin andSOX2 (self-renewal), MAP2 (neuronal lineage), GFAP (astrocytelineage) and GalC (oligodendrocyte lineage). Throughoutexpansion several neural markers displayed similar geneexpression patterns to those observed for the HSPG coreproteins (Figure 1A). Strong positive staining was observedfor markers co-localized in undifferentiated cultures by ICC(Figures 1B–D) including: GPC1 and O1 (oligodendrocyte;Figure 1B); GPC1 and CD44 (MSC marker; Figure 1C), Nestinand SDC4 (Figure 1D). Gene expression was validated by Q-PCR(Figures 1E–G). Similarities between gene expression patternswere seen between SDC4, and glial markers GFAP and GalCwith all three proteins demonstrating the lowest expressionlevel in Phase B cultures with less than 50% of the expressionthan observed at Phase C (Figures 1E–G). SDC1, GPC1 andOlig2 (glial, oligodendrocyte) were all observed to increasegene expression throughout expansion with GPC4 and CD44demonstrating the highest level of gene expression at PhaseB (Figures 1E–G). Glial lineage markers GalC, Olig2, GFAP(Figure 1E) and the neuronal marker, TUBB3 (Okolicsanyi et al.,2015) were detected at each phase of growth (Phases A–C).Neural self-renewal markers (Nestin) and the astrocyte lineage[GFAP, CD44; (Liu et al., 2004; Naruse et al., 2013; Sosunovet al., 2014; Oikari et al., 2016a)] were expressed at similar levelsto SDC4 across all growth phases. In contrast, while expressionof GalC and Olig2 (oligodendrocyte; Figure 1E) were observedthroughout expansion, the level of Olig2 gene expression was lessthan 10% of the level observed for SDC4, indicative of terminallydifferentiated glial lineages.
Previous ICC staining of self-renewal and neural lineagemarkers identified homogeneous staining of SOX2 and GFAPin hMSC cultures. Nestin and the late neuronal marker MAP2displayed reduced heterogeneous localization (<2% positiveMAP2 staining (Okolicsanyi et al., 2015)) at all growth phases.
Proliferative and Gene ExpressionResponse to Niche ModificationTreatment of cultures with 10 µg/mL of heparin increased cellnumber (25%) when compared with control cultures betweenday 3 (D3) and day 5 (D5) of treatment (n = 9). Treatment ofcultures with 50 mM sodium chlorate resulted in a reduction incell number (23%) when compared to control cultures betweenday 1 (D1) and D3. By D5 the overall cell number was reducedby 63% in the chlorate treated cultures when compared tocontrol cultures (Figure 2A). For this study, further in vitro niche
Frontiers in Molecular Neuroscience | www.frontiersin.org 4 April 2018 | Volume 11 | Article 134
fnmol-11-00134 April 23, 2018 Time: 16:52 # 5
Okolicsanyi et al. HSPGs and hMSC Neural Lineage Specification
FIGURE 1 | Correlation of neural markers with heparan sulfate proteoglycan (HSPG) core proteins throughout extended human mesenchymal stem cell (hMSC)in vitro expansion. (A) hMSC populations were expanded for >80 population doublings in vitro and gene expression of key HSPG core proteins correlated with keyneural markers throughout different phases of growth (Phase A-C). (B–D) Representative immunocytochemistry (ICC) images of neural stemness and lineagemarkers simultaneously expressed with key HSPG core proteins in undifferentiated hMSCs. Primary antibodies against each protein were used. Secondaryantibodies: FITC: green; Cy3: yellow; and AF594: red. All cultures were counterstained with DAPI to identify nuclei. Scale bars represent 70 µm. (E–G) Q-PCR geneexpression of (E) specific glial lineage markers: GFAP, GALC and OLIG2 (F) HSPG core proteins: SDC1, SDC4, and GPC4 (G) HSPG core protein GPC1, with neuralstemness (Nestin) and glial (CD44) markers.
modification was limited to the addition of exogenous heparinto cultures due to the extreme reduction in cellular proliferationobserved in the presence of sodium chlorate.
A non-significant increase in SDC1 gene expression wasdemonstrated following heparin treatment at each growth phaseexamined. Expression levels of SDC4 remained unchanged inearly and intermediate-phases of growth (Phases A and B)following heparin treatment with a significant decreased gene
expression observed in Phase C cells (p = 0.006). SDC4 geneexpression remained at <50% of the levels observed for SDC1in control cultures (Figure 2B). GPC1 demonstrated a non-significant decreased gene expression at all growth phasesfollowing addition of heparin (Figure 2B) with no significantchanges observed in GPC4 gene expression at any growth phasewith levels of this gene maintained at approximately 10% of GPC1(Figure 2B).
Frontiers in Molecular Neuroscience | www.frontiersin.org 5 April 2018 | Volume 11 | Article 134

fnmol-11-00134 April 23, 2018 Time: 16:52 # 6
Okolicsanyi et al. HSPGs and hMSC Neural Lineage Specification
FIGURE 2 | Human mesenchymal stem cell (hMSC) and heparan sulfate proteoglycan (HSPG) response to niche modification. (A) Dose response curve showingproliferation of undifferentiated hMSCs following addition of exogenous heparin (10 µg/mL) resulting in a 25% increase in cell number over control between day 3 andday 5. Treatment with exogenous sodium chlorate (50 mM) resulted in a 23% decrease in proliferation below control by day 3 and a 63% decrease in cell numberbelow control by day 5. Control culture, solid black line; heparin treated culture, dashed line, sodium chlorate treated culture, dash-dot line. (B) Heparan sulfateproteoglycan (HSPG) core protein (SDC1, SDC4, GPC1, GPC4) response to niche modification at each growth phase. Following niche modification (10 µg/mLheparin) a significant decrease in SDC4 expression was observed at Phase C. All other changes were non-significant. Immunocytochemistry (ICC) staining revealedno obvious visual differences between control and heparin treated cultures matching corresponding Q-PCR data. Representative ICC images from heparin treatedcultures at growth Phase C. (C) Neural response to niche modification. Following heparin treatment, pluripotency and stemness markers demonstrate significantlydecreased expression (Nestin, Phase A; Oct3/4, Phase B) at early growth phases and increased expression at Phase C with the increase for ENO2 moderatelysignificant. Glial markers (GFAP, S100B) demonstrated no significant differences in expression following heparin treatment except at Phase B where a significantdecrease in GFAP expression was observed. The late neuronal marker MAP2 and the glial marker S100B were detected at levels 10–50% of other neural markersexamined with a significant decrease in gene expression observed for MAP2 at growth Phase B. Primary antibodies detected individual proteins with secondaryantibodies FITC (green) and Cy3 (yellow). Nuclei were counterstained with DAPI. Scale bars represent 70 µm. ∗p < 0.05, ∗∗p < 0.005, ∗∗∗p < 0.0001.
Frontiers in Molecular Neuroscience | www.frontiersin.org 6 April 2018 | Volume 11 | Article 134
fnmol-11-00134 April 23, 2018 Time: 16:52 # 7
Okolicsanyi et al. HSPGs and hMSC Neural Lineage Specification
ICC staining supported Q-PCR gene expression results withclear positive staining at all growth phases under basal andproliferative (heparin) culture conditions. Staining revealedheterogeneous localization of SDC1, with varying levels of signalintensity observed (Figure 2B). Under all culture conditions,strong staining of all cells was observed for both GPC1 and GPC4(Figure 2B) with GPC1 demonstrating distinct localization anda filamentous expression pattern while GPC4 produced morehomogenous and diffuse localization.
In response to heparin treatment, Nestin (self-renewal)demonstrated significantly reduced gene expression at growthphase A (p = 0.047) and non-significant increases in expressionat growth phase B and C. The astrocyte lineage marker, GFAP(p = 0.006; Figure 2C) and the neuronal lineage marker, MAP2(p = 0.04; Figure 2C), also demonstrated significantly reducedexpression following heparin treatment at growth phase B. ICCexamination of these cultures highlighted the heterogeneity ofthe expression of these markers within the cultures with GFAPstaining observed in >90% of cells within the cultures. In contrast<50% of the cultures stained positive for Nestin, and <20% forMAP2 (Figure 2C) under control (Okolicsanyi et al., 2015) andproliferative conditions.
Q-PCR of neural lineage markers revealed reduced geneexpression of the pluripotency marker OCT3/4 followingaddition of heparin at early (non-significant) and intermediategrowth phases (Phase B: p = 5.4 × 10⁻⁷; Figure 2C)with a non-significant increase observed at Phase C. Thispattern was duplicated for the neuronal marker enolase 2(ENO2), with increased expression at Phase C highly significant(p = 0.0003; Figure 2C). The neuronal marker MAP2,demonstrated reduced expression following addition of heparinat Phase A (non-significant) and B (p = 0.04) and a non-significant increase at Phase C (Figure 2C) with no significantchanges in gene expression of the astrocyte marker S100B.Expression of the oligodendrocyte lineage markers, GalC andOlig2, demonstrated non-significant reductions in expressionat Phase A, and non-significant increases in expression atPhase B. Olig2 expression was further increased followingaddition of heparin to the cultures, however, these changeswere not significant (Supplementary Figure S3A). Examinationof additional neuronal lineage markers revealed a significantlyreduced level of gene expression of Neural Cadherin (NCAD) atPhase C (p = 4.1× 10⁻⁷) and TUBB3 in Phase A (p = 3.7× 10⁻⁵)and Phase B (p = 0.002) cultures (Supplementary Figure S3B).
hMSC Induced Neurosphere (hMSC IN)FormationDuring hMSC IN formation, at all growth phases, clusteringof cells was observed within an hour and sphere formationbecame apparent after only a few hours in induction media.By 24 h the presence of large numbers of hMSC IN of varyingsizes was observed in Phase A and B cultures where largehealthy hMSC IN formed in all populations. In Phase C cultures,cells predominantly clustered rather than formed spheres withsmaller (>50%) and less uniform in shape hMSC IN observed(Figure 3A). The diameter of the hMSC IN varied with the
maximum diameters > 400 µm observed in Phase A cultures;a maximum diameter of approximately 300 µm in Phase Bcultures; and a maximum sphere diameter of approximately200 µm with the majority of cell clusters observed to be nomore than 100 µm in diameter in Phase C cultures. Fewer hMSCIN were formed in Phase B cultures when compared to PhaseA cultures (∼70–80%). In addition to their reduced ability toform hMSC IN and the smaller sphere diameter observed, mediachanges at D3 post-induction resulted in the Phase C hMSC INdisintegrating into smaller cell clusters. This process had no effecton the integrity of the hMSC IN generated in Phase A and Bcultures.
To examine the effect of inhibition of further sulfation ofthe GAG chains, heparin in the induction media was replacedwith 50 mM sodium chlorate, resulting in small and irregularshaped spheres when compared to those formed in the presenceof heparin. These spheres were not deemed sufficiently stable andviable and as such were deemed unsuitable for use in furtherin vitro modification experiments. With hMSC IN formed inhMSC Phase A-C cultures, the remainder of this study focusseson a closer examination of the hMSC IN generated in Phase A(P+5) cultures utilizing their increased size and relative ease ofsphere production.
hMSC Induced Neurospheres RequireHS for FormationFDA/PI staining of the Phase A hMSC IN confirmed that thePhase A hMSC IN were comprised of a core of live cells with somedead cells distributed throughout the sphere (Figure 3B) and arelative intensity ratio of 3:1 (live to dead cells). HS epitope 10E4staining identifying the N-sulfated glucosamine residues revealedthe presence of high levels of HS in hMSC IN (Figure 3C).
PG Biosynthesis Machinery: Initiationand ModificationQ-PCR analysis of PG biosynthesis machinery components(HSPG initiation and modification enzymes), along with HSGAG chain polymerization and sulfation enzymes were thenexamined in hMSC IN, undifferentiated hMSCs and embryonicstem cell-derived human neural stem cell H9 (hNSC H9) cultures,an established human neural culture model for comparison(Oikari et al., 2016b).
Significantly reduced gene expression of the GAG initiationenzymes EXT1 and EXT2 was observed in hMSC IN whencompared with undifferentiated hMSC cultures (EXT1:p = 0.00097; EXT2: p = 0.02). Extremely high levels of theseenzymes were detected in undifferentiated hMSC cultures whencompared to hNSC H9 cultures (EXT1: p = 9.8 × 10⁻¹⁰; EXT2:p = 0.0098) and levels detected in hMSC IN also exceeded thosedetected in hMSC H9 for both enzymes (EXT1: p = 0.0006;EXT2: p = 0.004; Figure 4A).
C5-epimerase was detected at a significantly higher level inboth undifferentiated hMSCs (p = 7.2 × 10⁻⁶) and hMSC IN(p = 0.04) when compared to the hNSC H9 cultures (Figure 4A).The increase in C5-epimerase expression in hMSC IN cultures
Frontiers in Molecular Neuroscience | www.frontiersin.org 7 April 2018 | Volume 11 | Article 134

fnmol-11-00134 April 23, 2018 Time: 16:52 # 8
Okolicsanyi et al. HSPGs and hMSC Neural Lineage Specification
FIGURE 3 | Human mesenchymal stem cell (hMSC) induced neurospheres. (A) Formation of hMSC-induced neurospheres (hMSC IN) at each growth phase.Spheres generated at Phase A were larger and more uniform in shape than those generated at Phase B or C. Small, uneven cell clusters rather than spheres wereobserved at Phase C. Scale bars represent 70 µm. (B) Phase A hMSC IN were examined using FDA/PI stain to determine the live/dead cell ratio. Relative signalintensity demonstrated hMSC IN were predominantly composed of live cells with confocal imaging confirming live cells were distributed throughout the sphere andwere not restricted to the sphere surface. Scale bar represents 70 µm. (C) Phase A spheres stained using pan-heparan sulfate (10E4) primary antibody detecting HSchains, irrespective of the core protein to which they are attached. Secondary antibody used was AF594. Nuclei were counterstained with DAPI. Staining clearlyreveals high levels of both heparan sulfate in Phase A spheres. Scale bar represents 12 µm.
did not reach significance when compared to undifferentiatedhMSCs.
We observed significantly reduced expression of theubiquitous N-sulfation enzyme, NDST1, in hMSC IN(p = 2.3× 10⁻⁶) and in hNSC H9 (p = 3.2× 10⁻⁶) cultures whencompared to undifferentiated hMSC cultures (Figure 4B). Levelsof NDST2 were observed to be significantly reduced in hNSC H9cultures when compared to undifferentiated hMSCs (p = 0.003)while the neural specific NDST4 demonstrated significantlyincreased gene expression in hMSC IN when compared to hNSCH9 cultures (p = 0.03; Figure 4B). No gene expression of NDST4was detected in undifferentiated hMSCs. HS6ST3 (sulfation atthe 6-O position of the HS GAG chains) gene expression was alsosignificantly increased in hMSC IN when compared to hNSC H9cultures (p = 0.02; Figure 4C). No other significant differenceswere observed between cultures for the HS O-sulfation enzymes.Interestingly, these changes are similar to those seen when wepreviously compared hNSC H9 cultures to normal human neuralprogenitor (nhNPC; Oikari et al., 2016a) cells. This data suggeststhe processes converting hMSCs to hMSC IN are not dissimilar
in HS requirements to the commitment of human neural stemcells to more lineage restricted neural progenitor cells.
hMSC Induced Neurospheres ArePositive for Neural Progenitor Markersand HSPG Core ProteinsGene expression and localisation of HSPG core proteins, SDC1,SDC4, GPC1 and GPC4 along with NSC self-renewal markers,Nestin and SOX2, and neural lineage specific markers, MAP2,TUBB3, S100B and GFAP were then examined in Phase A hMSCINs.
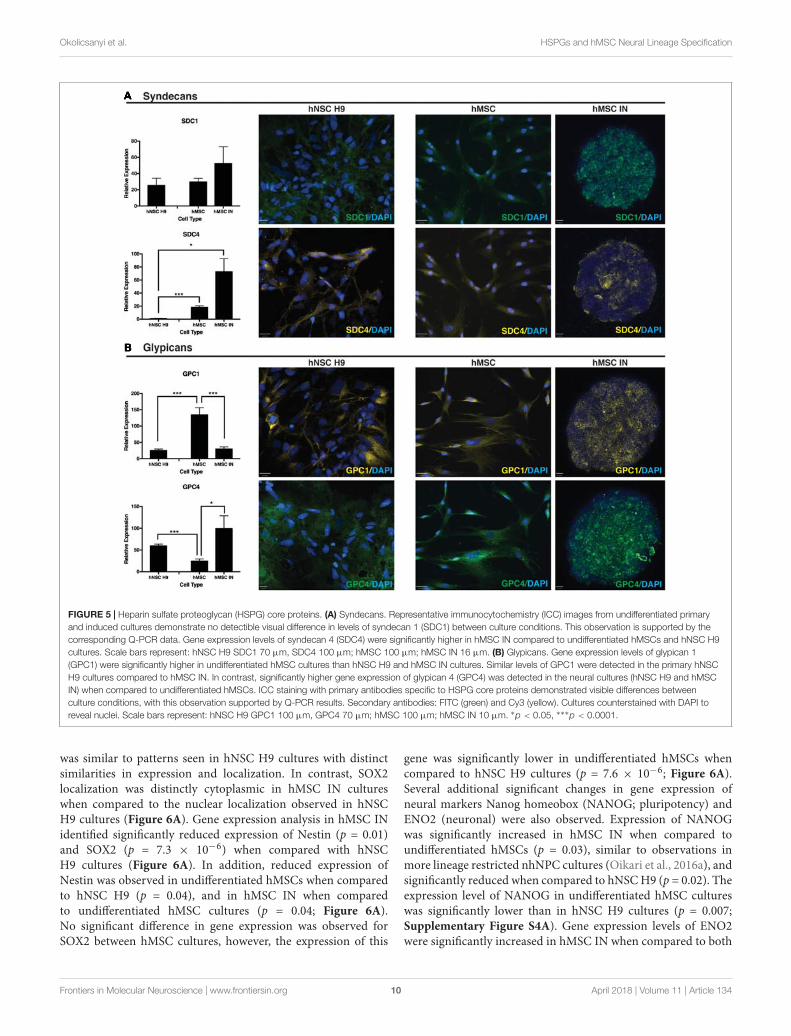
SDC1 gene expression remained unchanged when comparedto undifferentiated and hNSC H9 cultures. SDC4 significantlyincreased in both undifferentiated hMSCs and hMSC IN whencompared to hNSC H9 cultures (hMSC: p = 1.4 × 10⁻⁸; hMSCIN: p = 0.007; Figure 5A). Significantly reduced GPC1 wasobserved in hMSC IN (∼20%; p = 2.1 × 10⁻⁵) and hNSC H9(p = 7.9 × 10⁻⁶) cultures when compared to undifferentiatedhMSCs. Gene expression of GPC4 significantly increased in both
Frontiers in Molecular Neuroscience | www.frontiersin.org 8 April 2018 | Volume 11 | Article 134

fnmol-11-00134 April 23, 2018 Time: 16:52 # 9
Okolicsanyi et al. HSPGs and hMSC Neural Lineage Specification
FIGURE 4 | Gene expression changes for proteoglycan initiation and modification enzymes between induced and undifferentiated primary cultures. (A) Exostosins(EXT1/EXT2) are responsible for the polymerization of the growing glycosaminoglycan (GAG) chain and were significantly reduced in both human neural stem cells(hNSC H9) and human mesenchymal stem cell (hMSC) induced neurospheres (hMSC IN) when compared to undifferentiated hMSCs. In contrast, gene expression ofC5-epimerase, responsible for epimerization of the GAG chain decreased in hNSC H9 cultures and increased in hMSC IN compared to hMSCs. (B)N-deacetylase/N-sulfotransferase (NDST) enzymes. Significantly reduced NDST1 gene expression was observed in hNSC H9 and hMSC IN compared toundifferentiated hMSCs; NDST2 demonstrated reduced expression in hNSC H9 cells. Interestingly, the neural specific NDST4 was significantly increased in hMSC INwhen compared to hNSC H9s and was not detected in undifferentiated hMSC cultures. (C) Heparin sulfate specific O-sulfation enzymes showed little significantdifference between the cell types with the only significant increase observed between hNSC H9s and hMSC IN for HS6ST3. Chondroitin sulfate specific O-sulfationenzymes displayed significantly reduced expression in hMSC IN compared to hNSC H9 and undifferentiated hMSC cultures. Significantly higher heparanase (HPSE)gene expression was detected in undifferentiated hMSCs compared to hNSC H9 cultures and non-significantly increased compared to hMSC IN. ∗p < 0.05,∗∗p < 0.005, ∗∗∗p < 0.0001.
hMSC IN (p = 0.03) and hNSC H9 (p = 9.1× 10⁻⁶) cultures whencompared to undifferentiated hMSCs (Figure 5B).
Positive ICC staining all HSPG core proteins examined(SDC1, SDC4, GPC1, GPC4) was observed in hNSC H9 andhMSC cultures. hNSC H9 staining revealed homogeneous,cytoplasmic staining with some distinct differences observed inundifferentiated hMSC and hMSC IN. Undifferentiated hMSCcultures revealed predominantly cytoplasmic staining for theseproteins with GPC1 displaying distinct filamentous expressionwith expression of SDC1, SDC4 and GPC4 more diffuse. In
hMSC IN cultures, SDC1, GPC1 and GPC4 demonstrated asimilar staining pattern, with positively stained puncta detectedacross the majority of the cells within the sphere. In contrast,SDC4 demonstrated largely heterogeneous and more discretestaining with cells positive for this HSPG localized along theexternal edge and the inner core of the sphere (Figure 5).
ICC staining of self-renewal markers Nestin and SOX2revealed positive staining for both markers (Figure 6A)with Nestin demonstrating a uniform localization pattern(Okolicsanyi et al., 2015). The positive staining for this marker
Frontiers in Molecular Neuroscience | www.frontiersin.org 9 April 2018 | Volume 11 | Article 134
fnmol-11-00134 April 23, 2018 Time: 16:52 # 10
Okolicsanyi et al. HSPGs and hMSC Neural Lineage Specification
FIGURE 5 | Heparin sulfate proteoglycan (HSPG) core proteins. (A) Syndecans. Representative immunocytochemistry (ICC) images from undifferentiated primaryand induced cultures demonstrate no detectible visual difference in levels of syndecan 1 (SDC1) between culture conditions. This observation is supported by thecorresponding Q-PCR data. Gene expression levels of syndecan 4 (SDC4) were significantly higher in hMSC IN compared to undifferentiated hMSCs and hNSC H9cultures. Scale bars represent: hNSC H9 SDC1 70 µm, SDC4 100 µm; hMSC 100 µm; hMSC IN 16 µm. (B) Glypicans. Gene expression levels of glypican 1(GPC1) were significantly higher in undifferentiated hMSC cultures than hNSC H9 and hMSC IN cultures. Similar levels of GPC1 were detected in the primary hNSCH9 cultures compared to hMSC IN. In contrast, significantly higher gene expression of glypican 4 (GPC4) was detected in the neural cultures (hNSC H9 and hMSCIN) when compared to undifferentiated hMSCs. ICC staining with primary antibodies specific to HSPG core proteins demonstrated visible differences betweenculture conditions, with this observation supported by Q-PCR results. Secondary antibodies: FITC (green) and Cy3 (yellow). Cultures counterstained with DAPI toreveal nuclei. Scale bars represent: hNSC H9 GPC1 100 µm, GPC4 70 µm; hMSC 100 µm; hMSC IN 10 µm. ∗p < 0.05, ∗∗∗p < 0.0001.
was similar to patterns seen in hNSC H9 cultures with distinctsimilarities in expression and localization. In contrast, SOX2localization was distinctly cytoplasmic in hMSC IN cultureswhen compared to the nuclear localization observed in hNSCH9 cultures (Figure 6A). Gene expression analysis in hMSC INidentified significantly reduced expression of Nestin (p = 0.01)and SOX2 (p = 7.3 × 10⁻⁶) when compared with hNSCH9 cultures (Figure 6A). In addition, reduced expression ofNestin was observed in undifferentiated hMSCs when comparedto hNSC H9 (p = 0.04), and in hMSC IN when comparedto undifferentiated hMSC cultures (p = 0.04; Figure 6A).No significant difference in gene expression was observed forSOX2 between hMSC cultures, however, the expression of this
gene was significantly lower in undifferentiated hMSCs whencompared to hNSC H9 cultures (p = 7.6 × 10⁻⁶; Figure 6A).Several additional significant changes in gene expression ofneural markers Nanog homeobox (NANOG; pluripotency) andENO2 (neuronal) were also observed. Expression of NANOGwas significantly increased in hMSC IN when compared toundifferentiated hMSCs (p = 0.03), similar to observations inmore lineage restricted nhNPC cultures (Oikari et al., 2016a), andsignificantly reduced when compared to hNSC H9 (p = 0.02). Theexpression level of NANOG in undifferentiated hMSC cultureswas significantly lower than in hNSC H9 cultures (p = 0.007;Supplementary Figure S4A). Gene expression levels of ENO2were significantly increased in hMSC IN when compared to both
Frontiers in Molecular Neuroscience | www.frontiersin.org 10 April 2018 | Volume 11 | Article 134

fnmol-11-00134 April 23, 2018 Time: 16:52 # 11
Okolicsanyi et al. HSPGs and hMSC Neural Lineage Specification
undifferentiated hMSCs (p = 0.02) and hNSC H9 (p = 0.02)(Supplementary Figure S4B). The early neuronal marker TUBB3was significantly reduced in hMSC IN when compared toboth undifferentiated hMSC (p = 5.1 × 10⁻¹³) and hNSCH9 (p = 1.1 × 10⁻⁹) cultures. However, in undifferentiatedhMSCs TUBB3 expression was significantly higher than in hNSCH9 cultures (p = 2.3 × 10⁻¹¹; Figure 6B). In addition, ICCanalysis revealed distinct TUBB3 staining in hMSC IN, withapproximately 50% cells staining positive throughout the sphere(Figure 6B). The late neuronal marker, MAP2, was also examinedusing both ICC and Q-PCR. While gene expression levels weresignificantly reduced in both hMSCs (p = 3.7 × 10⁻⁷) andhMSC IN (p = 5.7 × 10⁻⁶) when compared to hNSC H9, strongstaining of this marker in pattern and intensity similar to thestaining for Nestin was observed within the hMSC IN (Figure 6B)when compared with <2% of the hNSCH9 cells staining positive(Okolicsanyi et al., 2015).
S100B demonstrated heterogeneous diffuse and punctatestaining within hMSC IN (Figure 6B) with significantly reducedexpression in both hNSC H9 (p = 9.2 × 10⁻⁶) and hMSC IN(p = 1.2 × 10⁻⁶) when compared to undifferentiated hMSCcultures (Figure 6B). In addition, levels of S100B detected inhMSC IN were significantly reduced when compared to hNSCH9 cultures (p = 0.02; Figure 6B). An additional glial marker,GALC, was detected at significantly lower levels in hNSC H9 thanboth hMSC (p = 0.007) and hMSC IN (p = 0.0002). Levels ofGALC were also significantly lower in hMSCs than in hMSC IN(p = 0.0004). Levels of CD44 were significantly lower in hNSC H9cultures than both hMSC (4.93 × 10e5) and hMSC IN (p = 0.01)cultures (Supplementary Figure S4C).
In addition to the gene expression changes observed forHSPGs, stemness and neural lineage markers, there wasa significant reduction in mesenchymal marker expressionincluding: Smooth muscle actin 2 (ACTA2; p = 1.2401 × 10⁻⁸),Alkaline Phosphatase (AP: p = 2 × 10⁻⁹), Adipose-Q (ADIPO-Q; p = 1.4× 10⁻⁵), Collagen 1A1 (COL1A1; p = 1.2× 10⁻⁹) andPeroxisome proliferator-activated receptor gamma 1 (PPARG1;p = 0.02) when compared to undifferentiated hMSC cultures(Supplementary Figure S5). This data further supports theincreased neural potential of hMSC IN and subsequent reducedmesenchymal lineage potential following sphere formation andexposure to neuronal lineage culture conditions.
DISCUSSION
The inherent heterogeneity of stem cell cultures likely providesthe key to their efficacy in therapeutic applications. MSCshave the potential to repair developmental and bone defects,along with neurodegenerative injuries and disorders. Here, weinvestigated HSPGs for their role in neural lineage differentiationof hMSCs with these cells previously identified to express anumber of markers of neural stemness and the neural lineages(neuronal, astrocyte, oligodendrocyte) throughout in vitroexpansion (Okolicsanyi et al., 2015). hMSCs were shown to utilizeHSPGs in vitro in basal culture conditions with an increase incell number following addition of heparin to the culture media.
In addition, the expression of neural markers was shown to beresponsive to these changes in the in vitro niche with alteredexpression and localization following modifications mediated byHSPGs correlating to or complementing our observed changes inHSPG expression. Although the observed changes in expressionwere not uniform across growth phases, this data suggests thatparticular marker combinations could be used to direct lineagespecification potentially enabling the production of increased,lineage-specific neural MSC-derived cultures.
To examine the early stages of neural commitment, wegenerated and examined hMSC IN cultures. Sphere formationefficiency varied between populations and growth phases,however, consistent low levels of expression were observed forneural lineage markers (astrocyte, neuronal, oligodendrocyte).Similarities in expression patterns between HSPG core proteinsand neural markers in undifferentiated hMSCs indicatethe involvement of these proteins in the maintenance ofneural lineage potential in MSCs. Interestingly, the combinedexpression and localization of HSPGs with several neuralself-renewal markers (Nestin, SOX2) along with the maintainedexpression and localization profile during sphere formation ofan intermediary neurogenic cell type, suggest the use of hMSCcultures to generate hMSC IN could have a considerable impacton their use in therapeutic applications. The key involvementof HSPGs during neural specification of these cells and theidentification of HSPGs in hMSC IN formation correlate withthe reported roles of HSPGs during neural development.
The lack of significant changes in the common initiationand polymerization enzymes during neural specification suggestsa requirement for GAG chains in the conversion fromundifferentiated hMSCs to neural lineages. In addition, wewould not expect to see complete loss of the polymerizationenzymes (EXTs) as both EXTs are required to form a complexfor significant polymerization of the GAG chains (McCormicket al., 2000). However, it is likely that each cell type requiresvarying levels and efficiency of EXT activity in response to localcellular cues. Evidence presented here supports this, with theratio of EXT1:EXT2 maintained between all culture conditions(higher EXT1 compared to EXT2). In addition, levels of EXT2were reduced in nhNPCs when compared to hNSC H9s (Oikariet al., 2016a) demonstrating a similarity between the more lineagerestricted cell types (hMSC IN and nhNPCs).
A family of four N-deacetylase/N-sulfotransferases, theNDSTs, perform N-sulfation, critical for the production of HSGAG chains. Levels of the ubiquitous N-sulfation enzymes weredecreased in hMSC IN when compared with undifferentiatedhMSCs with NDST1 demonstrating a significant decreasein expression suggesting that neural specification entailsaltered N-deacetylase/N-sulfotransferase activity. Interestingly,significantly increased levels of NDST4 in hMSC IN suggest anincrease in neural specific HSPGs with NDST4 predominantlyfound in vivo in the adult brain (Aikawa et al., 2001; Grobeet al., 2002). NDST1 and NDST2 remained at detectable levelsin hMSC IN, supporting expression of NDST1 and NDST2during induction of neural cells (Forsberg et al., 2012). Theelevated levels of the NDSTs observed in hMSC IN correlatewith the elevated level of C5-epimerase, with epimerization of
Frontiers in Molecular Neuroscience | www.frontiersin.org 11 April 2018 | Volume 11 | Article 134

fnmol-11-00134 April 23, 2018 Time: 16:52 # 12
Okolicsanyi et al. HSPGs and hMSC Neural Lineage Specification
FIGURE 6 | Neural self-renewal and lineage markers. (A) Self-renewal markers. Significantly reduced gene expression of neural stem cell self-renewal markersNestin and SOX2 were detected in undifferentiated human mesenchymal stem cell (hMSC) and hMSC induced neurospheres (hMSC IN) when compared to humanneural stem cell (hNSC H9) cultures. Staining in hMSC IN reveals visibly detectible expression of both these markers in hMSC IN cultures. Scale bars represent:hNSC H9 130 µm, hMSC IN 6 µm. (B) Neural Lineage Markers. Significantly higher gene expression levels of the early neuronal marker, βIII-tubulin (TUBB3), and theastrocyte marker (S100B) were detected in undifferentiated hMSC cultures compared to hNSC H9 and hMSC IN. Levels of both these genes were detected atsignificantly lower levels in hMSC IN than in the primary hNSC H9s. Levels of the late neuronal marker, MAP2, were significantly lower in both primary hMSC andinduced hMSC IN cultures than in hNSC H9 cultures. Cultures were stained with specific primary antibodies for each marker of interest. Secondary antibodies: FITC(green) and Cy3 (yellow). Nuclei counterstained with DAPI (blue). Scale bars represent: hNSC H9 TUBB3 100 µm, MAP2 130 µm, S100B 70 µm; hMSC IN TUBB3and MAP2 8 µm, S100B 6 µm. ∗p < 0.05, ∗∗p < 0.005, ∗∗∗p < 0.0001.
Frontiers in Molecular Neuroscience | www.frontiersin.org 12 April 2018 | Volume 11 | Article 134
fnmol-11-00134 April 23, 2018 Time: 16:52 # 13
Okolicsanyi et al. HSPGs and hMSC Neural Lineage Specification
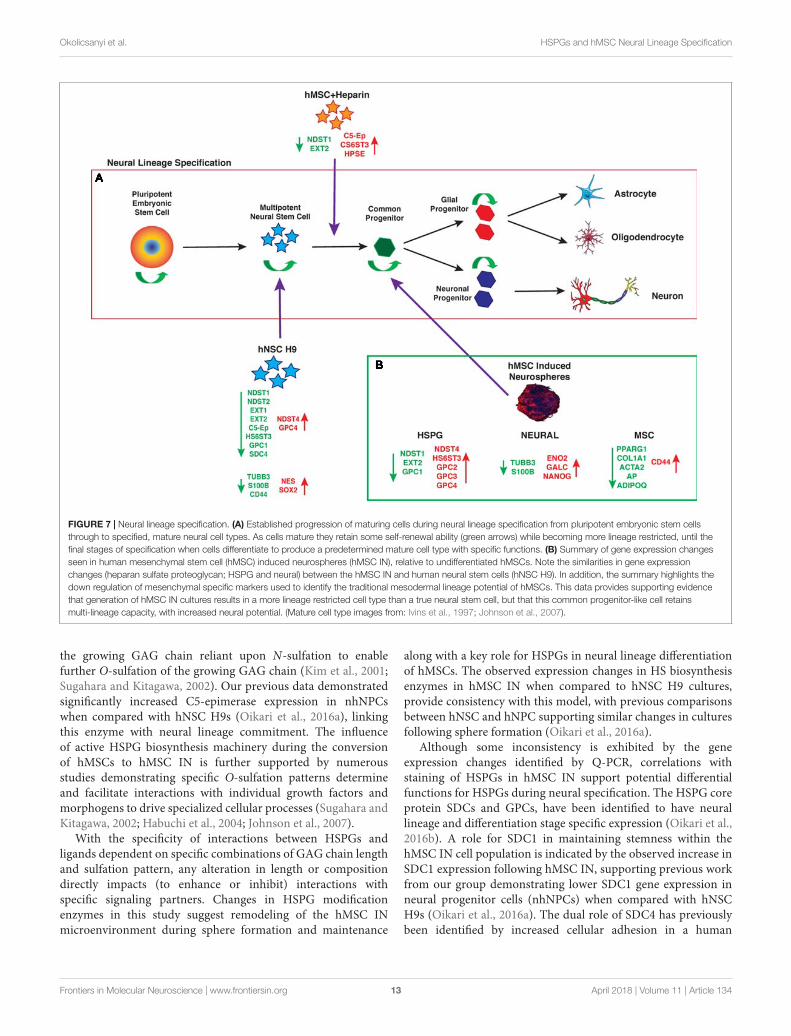
FIGURE 7 | Neural lineage specification. (A) Established progression of maturing cells during neural lineage specification from pluripotent embryonic stem cellsthrough to specified, mature neural cell types. As cells mature they retain some self-renewal ability (green arrows) while becoming more lineage restricted, until thefinal stages of specification when cells differentiate to produce a predetermined mature cell type with specific functions. (B) Summary of gene expression changesseen in human mesenchymal stem cell (hMSC) induced neurospheres (hMSC IN), relative to undifferentiated hMSCs. Note the similarities in gene expressionchanges (heparan sulfate proteoglycan; HSPG and neural) between the hMSC IN and human neural stem cells (hNSC H9). In addition, the summary highlights thedown regulation of mesenchymal specific markers used to identify the traditional mesodermal lineage potential of hMSCs. This data provides supporting evidencethat generation of hMSC IN cultures results in a more lineage restricted cell type than a true neural stem cell, but that this common progenitor-like cell retainsmulti-lineage capacity, with increased neural potential. (Mature cell type images from: Ivins et al., 1997; Johnson et al., 2007).
the growing GAG chain reliant upon N-sulfation to enablefurther O-sulfation of the growing GAG chain (Kim et al., 2001;Sugahara and Kitagawa, 2002). Our previous data demonstratedsignificantly increased C5-epimerase expression in nhNPCswhen compared with hNSC H9s (Oikari et al., 2016a), linkingthis enzyme with neural lineage commitment. The influenceof active HSPG biosynthesis machinery during the conversionof hMSCs to hMSC IN is further supported by numerousstudies demonstrating specific O-sulfation patterns determineand facilitate interactions with individual growth factors andmorphogens to drive specialized cellular processes (Sugahara andKitagawa, 2002; Habuchi et al., 2004; Johnson et al., 2007).
With the specificity of interactions between HSPGs andligands dependent on specific combinations of GAG chain lengthand sulfation pattern, any alteration in length or compositiondirectly impacts (to enhance or inhibit) interactions withspecific signaling partners. Changes in HSPG modificationenzymes in this study suggest remodeling of the hMSC INmicroenvironment during sphere formation and maintenance
along with a key role for HSPGs in neural lineage differentiationof hMSCs. The observed expression changes in HS biosynthesisenzymes in hMSC IN when compared to hNSC H9 cultures,provide consistency with this model, with previous comparisonsbetween hNSC and hNPC supporting similar changes in culturesfollowing sphere formation (Oikari et al., 2016a).
Although some inconsistency is exhibited by the geneexpression changes identified by Q-PCR, correlations withstaining of HSPGs in hMSC IN support potential differentialfunctions for HSPGs during neural specification. The HSPG coreprotein SDCs and GPCs, have been identified to have neurallineage and differentiation stage specific expression (Oikari et al.,2016b). A role for SDC1 in maintaining stemness within thehMSC IN cell population is indicated by the observed increase inSDC1 expression following hMSC IN, supporting previous workfrom our group demonstrating lower SDC1 gene expression inneural progenitor cells (nhNPCs) when compared with hNSCH9s (Oikari et al., 2016a). The dual role of SDC4 has previouslybeen identified by increased cellular adhesion in a human
Frontiers in Molecular Neuroscience | www.frontiersin.org 13 April 2018 | Volume 11 | Article 134

fnmol-11-00134 April 23, 2018 Time: 16:52 # 14
Okolicsanyi et al. HSPGs and hMSC Neural Lineage Specification
breast cancer model (Lendorf et al., 2011) and increased cellularcommunication and signaling (Dwyer and Esko, 2016) throughdecreased motility in the neural microenvironment. As cellsprogress toward a terminally differentiated state, characterizedby a lack of motility, our previous data show increased levelsof SDC4 in nhNPCs when compared with hNSC H9s (Oikariet al., 2016a) supporting this role for SDC4 in neural lineagespecification. In this study, significantly elevated SDC4 levels inundifferentiated hMSCs and hMSC IN compared to hNSC H9cultures further reflect the more lineage-restricted capacity ofhMSC IN than parental hMSC or hNSC H9s cultures (Oikariet al., 2016a).
The gene expression and localization of GPC1 implicate akey role for this HSPG in neuronal lineage specification, butalso reinforce clear differences between hMSC IN and the neuralprogenitor cultures (Oikari et al., 2016a). In addition, in themore lineage-restricted nhNPCs significantly decreased levelsof GPC4 may indicate a role for this HSPG in maintainingstemness in these cells (Oikari et al., 2016a). Interestingly,the significantly increased GPC4 observed in hMSC IN whencompared to the basal monolayer hMSC cultures, may indicatedde-differentiation or an increase in stemness of hMSC IN,providing further evidence that these cultures represent anintermediary neurogenic cell type.
CONCLUSION
The data presented here support hMSC IN derived fromhuman bone marrow MSCs generate a more lineage-restrictedcommon neural progenitor-like population to undifferentiatedhMSC and hNSC H9 cultures. The observed changes in neuralstemness and lineage specific markers are not conclusive ofterminal lineage specification and functionality, however, theirmaintained expression indicate hMSC IN retain these keyfunctional attributes in a similar fashion to true neural progenitorcells (Figure 7). HSPG regulation of hMSCs neural lineagespecification may occur through direct interaction or throughthe sequestration or presentation of appropriate growth factors,both mediated by the cellular microenvironment and key HSPGs.This needs to be further investigated along with a more detailedanalysis of the structural contribution of the cultures i.e., spheresvs. monolayer during neural specification in vitro and in vivo.hMSCs may provide an abundant source of cells that can bemanipulated via HSPGs and maintained in vitro for neural repairand regeneration and have potential in therapeutic applicationsfollowing neurological trauma or disease such as Dementias.
AUTHOR CONTRIBUTIONS
RO conceived and designed the study, collected/assembled thedata, performed data analysis and interpretation, and draftedand finalized the manuscript. LO collected/assembled data,performed data analysis and interpretation, and contributed tothe writing of the manuscript. CY collected/assembled the dataand contributed to the writing of the manuscript. LG provided
financial support and contributed to the editing and finalizationof the manuscript. LH conceived of the study and experimentaldesign, provided financial support and provision of materials,and contributed to data analysis and interpretation, writing,editing, and finalization of the manuscript.
FUNDING
This study was supported by an Australian Postgraduate Awardstipend (RO) and the Estate of the late Clem Jones, AO (LH andLG). The funders had no role in study design, data collection andanalysis, decision to publish, or preparation of the manuscript.
ACKNOWLEDGMENTS
The authors wish to thank Dr. Giorgia Del Favero (University ofVienna, Austria) for her advice on and assistance in improvingconfocal microscopy protocols for increased resolution andclarity within hMSC IN.
SUPPLEMENTARY MATERIAL
The Supplementary Material for this article can be found onlineat: https://www.frontiersin.org/articles/10.3389/fnmol.2018.00134/full#supplementary-material
FIGURE S1 | Human mesenchymal stem cell (hMSC) dose response. Average cellnumbers of hMSCs following treatment with 0, 1, 5, 10, 25, and 50 µg/mL ofheparin over 1 (D1), 3 (D3) or 5 days (D5). Average cell numbers of hMSCsfollowing treatment with 0, 1, 5, 50, 100 and 500 mM sodium chlorate over D1,D3, or D5. Cell numbers are averages collected from three hMSC populations withexperiments conducted in triplicate (n = 9). Data is presented ± SEM. 10 µg/mLwas selected as the optimal concentration of heparin for further experiments,while 50 mM sodium chlorate was selected for further investigation.
FIGURE S2 | Gene expression of heparan sulfate proteoglycan (HSPG) coreproteins at each distinct growth phase (Phase A-C). (A) Syndecans (SDC).SDC1-3 expression increases throughout in vitro expansion. SDC1 is consistentlydetected at levels approximately 30–50% of SDC3. SDC2 levels are consistentlydetected at approximately 50% of SDC3. In contrast to SDC1-3, SDC4 levels aremaintained throughout in vitro expansion with levels observed approximately 50%of SDC1 at growth phase A. (B) Glypicans (GPC). Gene expression of GPC1increased throughout in vitro expansion with the greatest increase in expressionobserved between Phase B and Phase C of growth. GPC4 and GPC6 were alsodetected consistently throughout in vitro expansion with levels of both thesegenes remaining below 50% of GPC1 at Phase A. GPC2 and GPC3 weredetected at levels approximately 1–5% of GPC1 Phase A levels, however, neitherof these genes were detected at growth phase A.
FIGURE S3 | Neural response to niche modification. (A) Glial markers. GalCexpression generally decreased after treatment with heparin, except at Phase Bwhere a non-significant increase in expression was observed. Heparin treatmentgenerally resulted in non-significantly increased gene expression of Olig2, exceptat Phase A where a non-significant decrease was observed. (B) The additionalneuronal markers examined showed an overall decreased gene expressionfollowing treatment of cultures with heparin, with the exception of NCAD at PhaseA where a non-significant increase in expression was observed. Significantlydecreased gene expression of NCAD was observed at Phase C and Phase A andB for TUBB3. ∗p < 0.05, ∗∗p < 0.005, ∗∗∗p < 0.0001.
FIGURE S4 | Additional Neural Self-renewal and Neural lineage markers. (A)Pluripotency marker, NANOG. Levels of NANOG detected in primary hMSCs was
Frontiers in Molecular Neuroscience | www.frontiersin.org 14 April 2018 | Volume 11 | Article 134
fnmol-11-00134 April 23, 2018 Time: 16:52 # 15
Okolicsanyi et al. HSPGs and hMSC Neural Lineage Specification
significantly lower than in both hMSC IN and hNSC H9 cultures. Gene expressionlevels of NANOG were also significantly lower in hMSC IN than in hNSC H9cultures. (B) Neuronal markers. Levels of ENO2 were significantly lower in bothprimary cultures, hNSC H9 and hMSC compared to hMSC IN. Levels of NEFMwere significantly higher in undifferentiated hMSCs compared to hNSC H9. Therewere no significant differences in NEFM expression between hMSC IN andhMSCs. (C) Glial markers. GALC was detected at significantly lower levels inhNSC H9 than both hMSC and hMSC IN. Levels of GALC were also significantlylower in hMSCs than in hMSC IN. Levels of CD44 were significantly lower in hNSC
H9 cultures than both hMSC and hMSC IN cultures. ∗p < 0.05, ∗∗p < 0.005,∗∗∗p < 0.0001.
FIGURE S5 | Mesenchymal lineage markers. Levels of mesenchymal lineagemarkers Smooth muscle actin 2(ACTA2), Alkaline Phosphatase (AP), Adipose –Q(ADIPOQ), Collagen 1A1 (COL1A1), Peroxisome proliferator-activated receptorgamma 1 (PPARG1) were significantly lower in hMSC IN than in undifferentiatedhMSC cultures. ∗p < 0.05, ∗∗p < 0.005, ∗∗∗p < 0.0001.
TABLE S1 | Primer sequences used for Q-PCR analysis.
REFERENCESAbdullah, R. H., Yaseen, N. Y., Salih, S. M., Al-Juboory, A. A., Hassan, A.,
and Al-Shammari, A. M. (2016). Induction of mice adult bonemarrow mesenchymal stem cells into functional motor neuron-likecells. J. Chem. Neuroanat. 77, 129–142. doi: 10.1016/j.jchemneu.2016.07.003
Aikawa, J., Grobe, K., Tsujimoto, M., and Esko, J. D. (2001). Multiple isozymesof heparan sulfate/heparin GlcNAc N-deacetylase/GlcN N-sulfotransferase.Structure and activity of the fourth member, NDST4. J. Biol. Chem. 276,5876–5882. doi: 10.1074/jbc.M009606200
Alexanian, A. R. (2010). An efficient method for generation of neural-like cellsfrom adult human bone marrow-derived mesenchymal stem cells. Regen. Med.5, 891–900. doi: 10.2217/rme.10.67
Bally-Cuif, L., and Hammerschmidt, M. (2003). Induction and patterning ofneuronal development, and its connection to cell cycle control. Curr. Opin.Neurobiol. 13, 16–25. doi: 10.1016/S0959-4388(03)00015-1
Bandtlow, C. E., and Zimmermann, D. R. (2000). Proteoglycans in the developingbrain: new conceptual insights for old proteins. Physiol. Rev. 80, 1267–1290.doi: 10.1152/physrev.2000.80.4.1267
Bernfield, M., Götte, M., Park, P. W., Reizes, O., Fitzgerald, M. L., Lincecum, J.,et al. (1999). Functions of cell surface heparan sulfate proteoglycans. Annu. Rev.Biochem. 68, 729–777. doi: 10.1146/annurev.biochem.68.1.729
Bossolasco, P., Cova, L., Calzarossa, C., Rimoldi, S. G., Borsotti, C., Deliliers, G. L.,et al. (2005). Neuro-glial differentiation of human bone marrow stem cellsin vitro. Exp. Neurol. 193, 312–325. doi: 10.1016/j.expneurol.2004.12.013
Choe, M. C. (2016). The pathophysiology of concussion. Curr. Pain Headache Rep.20:42. doi: 10.1007/s11916-016-0573-9
Choi, C. B., Cho, Y. K., Prakash, K. V., Jee, B. K., Han, C. W., Paik, Y. K.,et al. (2006). Analysis of neuron-like differentiation of human bone marrowmesenchymal stem cells. Biochem. Biophys. Res. Commun. 350, 138–146. doi:10.1016/j.bbrc.2006.09.010
David, G. (1993). Integral membrane heparan sulfate proteoglycans. FASEB J. 7,1023–1030. doi: 10.1096/fasebj.7.11.8370471
Dwyer, C. A., and Esko, J. D. (2016). Glycan susceptibility factors in autismspectrum disorders. Mol. Aspects Med. 51, 104–114. doi: 10.1016/j.mam.2016.07.001
Eatman, S. (2011). Get Swabbed. Save a Life. The Mayor’s Health Line Blog.Available at: http://mayorshealthline.wordpress.com/2011/10/19/get-swabbed-save-a-life/ [accessed May, 2014].
Forsberg, M., Holmborn, K., Kundu, S., Dagälv, A., Kjellén, L., and Forsberg-Nilsson, K. (2012). Undersulfation of heparan sulfate restricts differentiationpotential of mouse embryonic stem cells. J. Biol. Chem. 287, 10853–10862.doi: 10.1074/jbc.M111.337030
Fortune, N., and Wen, X. (1999). The Definition, Incidence and Prevalence ofAcquired Brain Injury in Australia. Canberra: Australian Institute of Health andWelfare.
Fransson, L. A. (2003). Glypicans. Int. J. Biochem. Cell Biol. 35, 125–129.doi: 10.1016/S1357-2725(02)00095-X
Fricke, S., Pfefferkorn, C., Wolf, D., Riemschneider, S., Kohlschmidt, J.,Hilger, N., et al. (2014). Characterization of the murine myeloid precursorcell line MuMac-E8. PLoS One 9:e113743. doi: 10.1371/journal.pone.0113743
Galindo, L. T., Filippo, T. R., Semedo, P., Ariza, C. B., Moreira, C. M., Camara,N. O., et al. (2011). Mesenchymal stem cell therapy modulates the inflammatoryresponse in experimental traumatic brain injury. Neurol. Res. Int. 2011:564089.doi: 10.1155/2011/564089
Ganos, C., Edwards, M. J., and Bhatia, K. P. (2017). Posttraumatic functionalmovement disorders. Handb. Clin. Neurol. 139, 499–507. doi: 10.1016/B978-0-12-801772-2.00041-2
Giordano, S., Sherman, L., Lyman, W., and Morrison, R. (1992). Multiplemolecular weight forms of basic fibroblast growth factor are developmentallyregulated in the central nervous system. Dev. Biol. 152, 293–303. doi: 10.1016/0012-1606(92)90136-5
Grobe, K., Ledin, J., Ringvall, M., Holmborn, K., Forsberg, E., Esko, J. D.,et al. (2002). Heparan sulfate and development: differential roles ofthe N-acetylglucosamine N-deacetylase/N-sulfotransferase isozymes. Biochim.Biophys. Acta 1573, 209–215. doi: 10.1016/S0304-4165(02)00386-0
Habuchi, H., Habuchi, O., and Kimata, K. (2004). Sulfation pattern inglycosaminoglycan: does it have a code? Glycoconj. J. 21, 47–52. doi: 10.1023/B:GLYC.0000043747.87325.5e
Hacker, U., Nybakken, K., and Perrimon, N. (2005). Heparan sulphateproteoglycans: the sweet side of development. Nat. Rev. Mol. Cell Biol. 6,530–541. doi: 10.1038/nrm1681
Hanahan, D., and Weinberg, R. A. (2000). The hallmarks of cancer. Cell 100, 57–70.doi: 10.1016/S0092-8674(00)81683-9
Haupt, L. M., Murali, S., Mun, F. K., Teplyuk, N., Mei, L. F., Stein, G. S., et al. (2009).The heparan sulfate proteoglycan (HSPG) glypican-3 mediates commitmentof MC3T3-E1 cells toward osteogenesis. J. Cell. Physiol. 220, 780–791.doi: 10.1002/jcp.21825
Hermann, A., Maisel, M., and Storch, A. (2006). Epigenetic conversion of humanadult bone mesodermal stromal cells into neuroectodermal cell types forreplacement therapy of neurodegenerative disorders. Expert Opin. Biol. Ther.6, 653–670. doi: 10.1517/14712598.6.7.653
Ivins, J. K., Litwack, E. D., Kumbasar, A., Stipp, C. S., and Lander, A. D.(1997). Cerebroglycan, a developmentally regulated cell-surface heparan sulfateproteoglycan, is expressed on developing axons and growth cones. Dev. Biol.184, 320–332. doi: 10.1006/dbio.1997.8532
Jenkins, A., Teasdale, G., Hadley, M. D., Macpherson, P., and Rowan, J. O. (1986).Brain lesions detected by magnetic resonance imaging in mild and severe headinjuries. Lancet Neurol. 2, 445–446. doi: 10.1016/S0140-6736(86)92145-8
Johnson, C. E., Crawford, B. E., Stavridis, M., Ten Dam, G, Wat, A. L., Rushton, G.,et al. (2007). Essential alterations of heparan sulfate during the differentiationof embryonic stem cells to Sox1-enhanced green fluorescent protein-expressingneural progenitor cells. Stem Cells 25, 1913–1923. doi: 10.1634/stemcells.2006-0445
Kim, B. T., Kitagawa, H., Tamura, J., Saito, T., Kusche-Gullberg, M., Lindahl, U.,et al. (2001). Human tumor suppressor EXT gene family membersEXTL1 and EXTL3 encode alpha 1,4- N-acetylglucosaminyltransferasesthat likely are involved in heparan sulfate/ heparin biosynthesis.Proc. Natl. Acad. Sci. U.S.A. 98, 7176–7181. doi: 10.1073/pnas.131188498
Lander, A. D., Stipp, C. S., and Ivins, J. K. (1996). The glypican family of heparansulfate proteoglycans: major cell-surface proteoglycans of the developingnervous system. Perspect. Dev. Neurobiol. 3, 347–358.
Lendorf, M. E., Manon-Jensen, T., Kronqvist, P., Multhaupt, H. A., andCouchman, J. R. (2011). Syndecan-1 and syndecan-4 are independent indicatorsin breast carcinoma. J. Histochem. Cytochem. 59, 615–629. doi: 10.1369/0022155411405057
Leonova, E. I., and Galzitskaya, O. V. (2013). Structure and functions of syndecansin vertebrates. Biochemistry 78, 1071–1085. doi: 10.1134/S0006297913100015
Li, H., Dai, Y., Shu, J., Yu, R., Guo, Y., and Chen, J. (2015). Spheroidcultures promote the stemness of corneal stromal cells. Tissue Cell 47, 39–48.doi: 10.1016/j.tice.2014.10.008
Frontiers in Molecular Neuroscience | www.frontiersin.org 15 April 2018 | Volume 11 | Article 134
fnmol-11-00134 April 23, 2018 Time: 16:52 # 16
Okolicsanyi et al. HSPGs and hMSC Neural Lineage Specification
Liu, Y., Han, S. S., Wu, Y., Tuohy, T. M., Xue, H., Cai, J., et al. (2004). CD44expression identifies astrocyte-restricted precursor cells. Dev. Biol. 276, 31–46.doi: 10.1016/j.ydbio.2004.08.018
Marinowic, D. R., Domingues, M. F., Machado, D. C., and DaCosta, J. C.(2015). The expression of pluripotency genes and neuronal markers afterneurodifferentiation in fibroblasts co-cultured with human umbilical cordblood mononuclear cells. In Vitro Cell. Dev. Biol. Anim. 51, 26–35. doi: 10.1007/s11626-014-9804-8
Matsuo, I., and Kimura-Yoshida, C. (2014). Extracellular distribution of diffusiblegrowth factors controlled by heparan sulfate proteoglycans during mammalianembryogenesis. Philos. Trans. R. Soc. Lond. B Biol. Sci. 369:20130545.doi: 10.1098/rstb.2013.0545
McCormick, C., Duncan, G., Goutsos, K. T., and Tufaro, F. (2000). The putativetumor suppressors EXT1 and EXT2 form a stable complex that accumulates inthe Golgi apparatus and catalyzes the synthesis of heparan sulfate. Proc. Natl.Acad. Sci. U.S.A. 97, 668–673. doi: 10.1073/pnas.97.2.668
Minguell, J. J., Erices, A., and Conget, P. (2001). Mesenchymal stem cells. Exp. Biol.Med. 226, 507–520. doi: 10.1177/153537020122600603
Naruse, M., Shibasaki, K., Yokoyama, S., Kurachi, M., and Ishizaki, Y. (2013).Dynamic changes of CD44 expression from progenitors to subpopulationsof astrocytes and neurons in developing cerebellum. PLoS One 8:e53109.doi: 10.1371/journal.pone.0053109
Oikari, L. E., Okolicsanyi, R. K., Griffiths, L. R., and Haupt, L. M. (2016a). Datadefining markers of human neural stem cell lineage potential. Data Brief 7,206–215. doi: 10.1016/j.dib.2016.02.030
Oikari, L. E., Okolicsanyi, R. K., Qin, A., Yu, C., Griffiths, L. R., and Haupt, L. M.(2016b). Cell surface heparan sulfate proteoglycans as novel markers of humanneural stem cell fate determination. Stem Cell Res. 16, 92–104. doi: 10.1016/j.scr.2015.12.011
Okolicsanyi, R. K., Camilleri, E. T., Oikari, L. E., Yu, C., Cool, S. M., vanWijnen, A. J., et al. (2015). Human mesenchymal stem cells retain multilineagedifferentiation capacity including neural marker expression after extended InVitro expansion. PLoS One 10:e0137255. doi: 10.1371/journal.pone.0137255
Okolicsanyi, R. K., Griffiths, L. R., and Haupt, L. M. (2014). Mesenchymal stemcells, neural lineage potential, heparan sulphate proteoglycans and the matrix.Dev. Biol. 388, 1–10. doi: 10.1016/j.ydbio.2014.01.024
Ori, A., Wilkinson, M. C., and Fernig, D. G. (2008). The heparanome andregulation of cell function: structures, functions and challenges. Front. Biosci.13:4309–4338. doi: 10.2741/3007
Mafi, P., Hindocha, S., Mafi, S., Griffin, M., and Khan, W. S. (2011). Adultmesenchymal stem cells and cell surface characterization - a systematicreview of the literature. Open Orthop. J. 5(Suppl. 2), 253–260. doi: 10.2174/1874325001105010253
Pickford, C. E., Holley, R. J., Rushton, G., Stavridis, M. P., Ward, C. M., andMerry, C. L. (2011). Specific glycosaminoglycans modulate neural specificationof mouse embryonic stem cells. Stem Cells 29, 629–640. doi: 10.1002/stem.610
Powell, P. P., Finklestein, S. P., Dionne, C. A., Jaye, M., and Klagsbrun, M. (1991).Temporal, differential and regional expression of mRNA for basic fibroblastgrowth factor in the developing and adult rat brain. Brain Res. Mol. Brain Res.11, 71–77. doi: 10.1016/0169-328X(91)90023-Q
Qian, X., Davis, A. A., Goderie, S. K., and Temple, S. (1997). FGF2 concentrationregulates the generation of neurons and glia from multipotent cortical stemcells. Neuron 18, 81–93. doi: 10.1016/S0896-6273(01)80048-9
Ragni, E., Viganò, M., Parazzi, V., Montemurro, T., Montelatici, E., Lavazza, C.,et al. (2013). Adipogenic potential in human mesenchymal stem cells strictlydepends on adult or foetal tissue harvest. Int. J. Biochem. Cell Biol. 45,2456–2466. doi: 10.1016/j.biocel.2013.07.024
Rapraeger, A. C., Krufka, A., and Olwin, B. B. (1991). Requirement of heparansulfate for bFGF-mediated fibroblast growth and myoblast differentiation.Science 252, 1705–1708. doi: 10.1126/science.1646484
Safaiyan, F., Kolset, S. O., Prydz, K., Gottfridsson, E., Lindahl, U., andSalmivirta, M. (1999). Selective effects of sodium chlorate treatment on thesulfation of heparan sulfate. J. Biol. Chem. 274, 36267–36273. doi: 10.1074/jbc.274.51.36267
Sarrazin, S., Lamanna, W. C., and Esko, J. D. (2011). Heparan sulfate proteoglycans.Cold Spring Harb. Perspect. Biol. 3:a004952. doi: 10.1101/cshperspect.a004952
Sosunov, A. A., Wu, X., Tsankova, N. M., Guilfoyle, E., McKhann, G. M. II, andGoldman, J. E. (2014). Phenotypic heterogeneity and plasticity of isocorticaland hippocampal astrocytes in the human brain. J. Neurosci. 34, 2285–2298.doi: 10.1523/JNEUROSCI.4037-13.2014
Stocchetti, N., and Zanier, E. R. (2016). Chronic impact of traumatic brain injuryon outcome and quality of life: a narrative review. Crit. Care 20:148. doi:10.1186/s13054-016-1318-1
Sugahara, K., and Kitagawa, H. (2002). Heparin and heparan sulfate biosynthesis.IUBMB Life 54, 163–175. doi: 10.1080/15216540214928
Tkachenko, E., Rhodes, J. M., and Simons, M. (2005). Syndecans: new kids onthe signaling block. Circ. Res. 96, 488–500. doi: 10.1161/01.RES.0000159708.71142.c8
Wiese, C., Rolletschek, A., Kania, G., Blyszczuk, P., Tarasov, K. V., Tarasova, Y.,et al. (2004). Nestin expression–a property of multi-lineage progenitor cells?Cell. Mol. Life Sci. 61, 2510–2522. doi: 10.1007/s00018-004-4144-6
Williams, G. (2016). 7 Truths you Should Know About Brain Training. Available at:http://www.digipeek.com/7-truths-you-should-know-about-brain-training/
Wilson, S. I., and Edlund, T. (2001). Neural induction: toward a unifyingmechanism. Nat. Neurosci. 4(Suppl.), 1161–1168. doi: 10.1038/nn747
Wolf, K., and Friedl, P. (2006). Molecular mechanisms of cancer cell invasion andplasticity. Br. J. Dermatol. 154(Suppl. 1), 11–15. doi: 10.1111/j.1365-2133.2006.07231.x
Yamaguchi, Y. (2001). Heparan sulfate proteoglycans in the nervous system: theirdiverse roles in neurogenesis, axon guidance, and synaptogenesis. Semin. CellDev. Biol. 12, 99–106. doi: 10.1006/scdb.2000.0238
Yu, M., Sato, H., Seiki, M., and Thompson, E. W. (1995). Complexregulation of membrane-type matrix metalloproteinase expression and matrixmetalloproteinase-2 activation by concanavalin A in MDA-MB-231 humanbreast cancer cells. Cancer Res. 55, 3272–3277.
Conflict of Interest Statement: The authors declare that the research wasconducted in the absence of any commercial or financial relationships that couldbe construed as a potential conflict of interest.
Copyright © 2018 Okolicsanyi, Oikari, Yu, Griffiths and Haupt. This is an open-access article distributed under the terms of the Creative Commons AttributionLicense (CC BY). The use, distribution or reproduction in other forums is permitted,provided the original author(s) and the copyright owner are credited and that theoriginal publication in this journal is cited, in accordance with accepted academicpractice. No use, distribution or reproduction is permitted which does not complywith these terms.
Frontiers in Molecular Neuroscience | www.frontiersin.org 16 April 2018 | Volume 11 | Article 134