hephaestus: data reuse for accelerating scientific...
TRANSCRIPT
Hephaestus: Data Reuse forAccelerating Scientific Discovery
Jennie DugganNorthwestern EECS
Michael L. BrodieMIT CSAIL
ABSTRACTData-intensive science, wherein domain experts use big dataanalytics in the course of their research, is becoming increas-ingly common in the physical and social sciences. Moreover,data reuse is becoming the new normal, owing to the opendata movement [15] and arrival of big science experimentssuch as the Large Hadron Collider. Here a small group of re-searchers, often using exotic equipment, produce a datasetthat is shared by thousands. Unfortunately, weak and spu-rious correlations are also on the rise in research [5, 27]. Forexample, Google Flu Trends published their algorithms in2008 [19] for use in public health, and in the interveningtime its accuracy has plummeted. In the 2011-2012 flu sea-son, this system produced estimates more than 50% higherthan the number of cases reported by the U.S. Center forDisease Control [32].
This work first examines common pitfalls associated withdata-intensive science and how they contribute to irrepro-ducible results. We then propose a system for conductingvirtual experiments over existing data. It simulates random-ized controlled trials by reframing the principles of empir-ical research. These virtual experiments underpin a largerplatform we call Hephaestus. This framework accumulatesvirtual experiments in a visualization to help scientists iden-tify consistencies and anomalies in an area of research. Wethen highlight a set of research challenges associated withthis platform. We argue that by using this approach, data-intensive science may come to achieve accuracy on par withits causality-driven predecessors.
1. INTRODUCTIONData reuse is becoming increasingly prevalent in science.
The reasons for this are numerous. First, many science fund-ing agencies are instituting open science mandates [17, 41],and this promises to create a new flood of data sourced frompublished research. In addition, many large-scale science en-deavors are now designed to collect data first for use in anynumber of studies later. For example, the Large Hadron Col-lider makes its measurements available to more than 8,000scientists, although relatively few people operate the particle
This article is published under a Creative Commons Attribution Li-cense(http://creativecommons.org/licenses/by/3.0/), which permits distri-bution and reproduction in any medium as well as allowing derivativeworks, provided that you attribute the original work to the author(s) andCIDR 2015.7th Biennial Conference on Innovative Data Systems Research (CIDR ’15)January 4-7, 2015, Asilomar, California, USA.
accelerator [10]. This pattern is echoed in the Large Synop-tic Survey Telescope [52], the Square Kilometer Array [9],NASA’s MODIS satellite imagery [38], and many others.
There are many challenges and opportunities associatedwith making use of this growing body of data. This datareuse calls for new techniques because it changes how scien-tists conduct their research. Traditionally researchers beginwith a hypothesis followed by an experiment designed toprove or disprove it. These trials are conducted in carefullycontrolled lab settings. In each experiment, the researchersmanipulate perhaps one or a few variables to establish cause-and-effect relationships. It is unclear how these rigorous,time-tested methods will evolve for scientific discovery overexisting data.
To explore these questions, we interviewed scientists tolearn about how they conduct data-intensive research now.Their experiences span a variety of empirical disciplines, in-cluding evolutionary biology, genomics, clinical trials, andphotonics. Our interviews revealed a widespread need to re-frame the principles of empirical research for eScience. Thesediscussions also brought to light numerous pitfalls in data-centric analysis; we discuss some of these hazards in thecontext of machine learning below.
Machine learning alone is not enough Researcherspresently use statistics and machine learning to discover in-teresting correlations from their experimental results. Therehas been considerable excitement about this developmentwith many heralding it as the “end of theory-driven sci-ence” [3, 24]. Recent evidence, however, suggests that onequarter of research is statistically false [28], and others es-timate a much higher rate [5, 27]. Although some of theseerrors may be attributed to shoddy research procedures orbuggy code, the prevailing wisdom is that such failures areowing to both the limits to and the misapplication of statis-tics over massive datasets [12, 22, 45].
A plethora of examples illustrate this issue. Google FluTrends, in conjunction with the United States CDC, pub-lished statistical models in Nature for use in predicting sea-sonal illness rates [19]. Their approach used search enginequeries to predict the rate of people seeking treatment forinfluenza-like illnesses. This technique was pitched as anearly detection method for flu pandemics. As time progressed,it became clear that Google Flu Trends was vulnerable tooverfitting; its error rates skyrocketed in subsequent years [35].In particular, as the tool became more well-known, usersqueried it at a higher rate, confounding its results.
In unrelated research, epidemiologists published observa-tional studies demonstrating a positive correlation between
post-menopausal women taking hormone replacement ther-apy (HRT) and a reduction in heart disease [21]. This resultpuzzled many experts in the field, because there is no intu-itive link between the two. Despite this skepticism, the find-ing was used to promote HRT to this demographic. Later,the link was repeatedly refuted with randomized controlledtrials, reversing this policy recommendation [31]. This errorwas attributed to the initial study’s use of subjects from asingle socioeconomic group, an unrelated variable that wasnot controlled for in the study’s design.
Earthquake modeling has also demonstrated some high-profile failures in its predictions. In 2006, seismologists pre-dicted that an area in the Indian Ocean was at low risk.In September of the following year, an 8.5 magnitude eventstruck at exactly that location, discrediting this analysis. [49].To this day, researchers struggle with this issue, but theirsuccess has been stymied by an inability to measure theunderlying causes of the quakes. Scientists can measure anevent only when it is occurring.
Machine learning and statistics have shown immense usein tackling real-world problems, such as pattern recogni-tion for manufacturing defects and expert recommender sys-tems. The needs of science—in hypothesis creation and test-ing—are fundamentally different from the aims of machinelearning. Whereas the latter looks for actionable patterns indata, it does not speak to the root causes of an outcome.In contrast, the scientific method uses carefully designed ex-periments to test for cause-and-effect relationships. Machinelearning also differs from the statistics used in science be-cause its transformations and results rarely use error barsdenoting the quality of their predictions. In empirical sci-ence, results always come with error bounds.
What changes with data reuse? We submit that asscience data becomes plentiful, it will dramatically alter howresearch is conducted. The eScientist’s principle artifact orwork product will be the experiment that she will design,develop, incrementally test, validate, and publish directly ontop of massive data sets. For this, one will need a languageand data management platform.
Eliminating the current data acquisition bottleneck freeseScientists to focus on their primary contributions, namelyaccurately modeling data that represents phenomena. Morespecifically, how a researcher formulates a problem, andwhether that conception holds up to observations collectedfrom many sources, will become more important than whocollected the data. Hence, enabling eScientists to directlyexpress, manipulate, and test collections of hypotheses isneeded. In this context, models are analogous to rulesetsthat express causal relationships. Indeed, it will be crucial toautomatically identify the conditions under which the dataagrees with the model and when the two diverge.
As data accumulates from many disparate sources, it willbecome too large for researchers to download and query ontheir own. Also, it is unlikely that the data they want toanalyze will be all located on a single host. Hence, eScientistswill need a means of creating queries and orchestrating theirexecution to test hypotheses. This new challenge is at theintersection of data management and statistics.
In addition, open science data will make it possible to sub-ject discoveries to continuous verification. As new data ar-rives, especially from studies that build upon the prior work,people further test their findings. Over time, this will enableresearchers to distinguish short-term correlations from long-
term cause-and-effect relationships.It is likely that these properties of data reuse will incen-
tivize ease of use and transparency in its application. Whenit is clear how the research associated with a publicationwas conducted, weak and spurious correlations will be morereadily identifiable. Ideally, this will increase the accuracyof follow-on work. Right now, most efforts in this area focuson workflow management [16], but we argue that this ap-proach attempts to make programmers of scientists. Thereare many tools for processing raw measurements into dataproducts [8, 25]. In this work we focus on the analysis ofdata that has already been cleaned and labeled.
Man-Machine Symbiosis It is our position that datascience tools should augment the capabilities of human re-searchers rather than supplant them. Computers alone lackthe deep domain knowledge needed to semantically breakdown the space of possible hypotheses into tractable sub-problems, and it is not clear that a solution to this issue ison the horizon. On the other hand, humans are only capa-ble of reasoning about models of limited complexity, withfewer than ten concepts in short-term memory [37]. To real-ize the complementary strengths of empirical research anddata-intensive science, we embrace man-machine symbiosisin the tradition of Licklider [33]. Rather than mining thedata, it is our goal to help scientists search for cause-and-effect relationships.
Our approach focuses on human-guided exploratory anal-ysis rather than deferring to automated scientific discoveryas in [47, 48]. A recent survey of open problems in data min-ing concluded that human verification of machine-discoveredrelationships will be needed for the foreseeable future [12].Hence, it is important to carefully consider the structure ofthis partnership.
Virtualizing the Scientific Method Randomized con-trolled trials are the gold standard for proving causality inmany domains of science. The central building block of ourvision is the virtual experiment (VE), a hypothetical lan-guage with which scientists would design, develop, test, ex-ecute, and publish data-intensive research. VEs are part ofa larger platform that we call Hephaestus1, a meta-systemthat enables users to create and execute experiments overlocal and remote big science data. We call it a meta-systembecause it sits on top of existing science databases that ex-ecute complex analytics locally. Using correlations that areverified by experts, Hephaestus will assemble probabilisticcausal graphs, as defined in Section 3.2.
VEs will empower researchers to focus on experimental de-sign, abstracting away the underlying plumbing, e.g., wherethe data comes from and how the query will run. This exper-imental design taps in to any number of data sources, whichmay be stored locally or remotely. Working at this level willenable researchers to focus on exploring the space of possibletheories working hand-in-hand with the meta-system.
VEs will also enable scientists to report their research pro-tocols in a standardized fashion. Hence, when one publishesusing grant money tied to an open data mandate, she maysend her results to an open science repository with VEs forreproducing her experiments. More importantly, these VEswill let others understand and expand on these results thuscontributing to the fundamental objective of open data —ac-celerating scientific discovery. The U.S. National Institutes
1Named after the toolmaker of the gods of Olympus whobuilt automatons of metal to work for him.
of Health has created two initiatives for this goal [39, 40].Naturally, Hephaestus will aid the reproducibility efforts
of scientists by enabling them to compose and share hy-potheses. Also, if their new experiments build on prior find-ings, the scientist can verify that their assumptions are cor-rect. The data management community is clearly in a posi-tion to help solve this challenge.
This study extends the rich and challenging research areaof computational platforms for data-intensive analysis [42,30, 50]. Our focus, however, is on data reuse for eScience andon reframing concepts from empirical research, whereas theirapproaches are more closely aligned with machine learningand knowledge discovery. This proposal is distinct from anelectronic lab notebook (ELN) [46]. It is designed for probingmassive hypothesis spaces rather than improving data pro-cessing workflows and maintaining provenance for specificdata.
This rest of this paper is organized as follows. In Section 2we briefly summarize the principles of empirical researchand how we formulate the challenge of data reuse. Section 3outlines our vision for the Hephaestus meta-system. In Sec-tion 4, we delve into the open challenges associated with thiswork and conclude.
2. BACKGROUNDIt is our goal to lay the foundation for extending concepts
from empirical science to data reuse so that researchers candirectly and declaratively design experiments over massive,open datasets. In this section, we briefly touch on the some ofthe terms and methods most relevant to this study. We thendiscuss how Hephaestus fits into the context of the currentpractices in scientific research.
2.1 Principles of Experimental DesignScientists search for causal relationships. They do so by
making predictions that are readily falsifiable, or capable ofbeing disproven. These relationships describe when an in-tervention, or measurable action, creates an effect, the out-come that is under prediction. [44] Whereas machine learn-ing seeks out correlations with strong predictive power, sci-entists pursue ones with strong explanatory power, a subtlebut important distinction. For a relationship to be causal, itmust also have validity, such that it generalizes to previouslyuntested circumstances covered in the initial theory.
Statistical hypothesis testing is a long-standing conven-tion in empirical research, especially in the social sciences.Economics is one such discipline. When analyzing a large,dynamic system like a country’s economy, the scientist’s onlyoption is to obtain data collected previously without specificcontrols. Conducting experiments by applying an interven-tion in a controlled setting is not possible for them. Hence,they use well-developed statistical tests to evaluate their the-ories. VEs will confirm or deny hypotheses using the sametechniques for data reuse. This will make it possible to scal-ably test many hypotheses, because the system will be ableto rapidly rule out many of them automatically. Therefore,after the scientist has designed their experiment, they con-sider only those correlations that pass the test, rather thanmanually wading through a barrage of superfluous ones.
Researchers use statistical hypothesis testing to determinewhether a result is statistically significant or unlikely to haveoccurred by chance alone. Starting with a hypothesis, theexperiment designer selects a null hypothesis that defines
the anticipated experiment outcome if the intervention hasno effect. For example, in clinical trials for new drugs thenull hypothesis is usually quantified using a placebo group.They then propose an alternative hypothesis, or result if thetheory under test is correct. The clinical trial would use thedata from patients given an experimental drug to test thealternative hypothesis.
Once these two competing hypotheses are established, thescientist decides how to compare them, frequently with a p-value, although other metrics are also used. The p-value isused to reject the null hypothesis by calculating the proba-bility that the outcome observed in the presence of the inter-vention would have happened by chance alone. This figureneeds to be below a threshold for the theory to be judgedsuccessful, and most disciplines use a threshold of 0.05. Atest with a p-value of 0.05 implies that the null hypothesishas a 5% chance of being true. This threshold, and how to se-lect it, has been the subject of intense debate in recent years.Hence, a statistical hypothesis testing framework needs tobe sensitive to evolving standards for testing a causal link.
Causal relationships improve upon the null hypothesis.Correctly designed controls are an important staple of nearlyall empirical studies. In practice, we found that most data-intensive science uses one of three types of controls. A sam-pled null hypothesis measures the experiment’s conditions inthe absence of an intervention, as in the clinical trial exam-ple above. A synthetic control is a constant or probabilitydensity function supplied by the user. For example, whenresearchers at the Large Hadron Collider were searching forthe Higgs Boson, they used p-values for hypothesis testing.Because they were trying to determine whether or not theparticle exists, they had no way of measuring the absence ofa discovery. Hence, they used a probability density functionto describe background noise for their control. Sometimescontrols are formulated as tests of independence, where thenull hypothesis presumes that no relationship exists betweentwo or more variables. . A researcher asking whether thereis a statistically significant link between gender and heartdisease might use this type of control.
Naturally, Hephaestus will need to support all three ofthese approaches to control design. Clearly, picking the rightone for a given theory is not simple, and domain expertisewill be critical for this part of the VE design.
Pitfalls There are several challenges that arise when re-searchers use statistical hypothesis testing, and here we lista couple of prominent ones. Test designers need to be vigi-lant about confounders or extraneous interventions that arecovariant with the target effect. It has been reported thatfrom 1998 to 2007 the diagnosis rate of autism was stronglycorrelated with sales of organic food [36]. Although thesetwo variables are correlated, and this might pass a statisticalhypothesis test, organic produce is a confounder for this dis-order. There are some techniques for detecting the existenceconfounders at small scale [44], but they cannot determinethe variable is responsible for a spurious correlation.
Another issue that comes up with statistical hypothesistesting is lurking variables. These variables have an effect onthe experiment outcome, but are not included in the analy-sis. Simpson’s Paradox is one instance of this pitfall. Here,a trend that is present in data that is binned into groupsdisappears or is reversed when the data is aggregated. Weillustrate this issue with an example from a study of kidneystone treatments [11]. The authors compare the efficacy of
two treatment options, A and B. They first consider two pa-tient populations, one having small kidney stones, and theother having large ones. For the small group, A is effectivefor 93% (81/87) of patients, and B works for 87% (234/270)of them. The second population had a success rate of 73%(192/263) for A and 69% (55/80) for B. It would appearfrom these results that Treatment A is the clear winner. Onthe other hand, if we combine the groups, A cures patientsat a rate of 78% (273/350) and B helps 83% (289/350) ofthe time. Here, Treatment B appears to be the best choice.As we will see in Section 3.1, it would be easy to make aVE for either scenario, and human intervention is needed toselect the right course of action. Both of these issues posegreater challenges over massive datasets, where the numberof variables and complexity of the interactions rises.
2.2 Data Reuse GoalsIn addition the principles of empiricism, there are several
other factors that shape the needs of scientists in the con-text of data reuse. Every discipline has agreed-upon stan-dards for how they test hypotheses statistically. In addition,their inquiries may take the form of incremental steps orbig picture inquiries. Their interactions with the data arevery different when researchers are analyzing anomalies asopposed to confirming existing theories.
Community Standards Practically every scientific dis-cipline has community standards that dictate how its practi-tioners apply statistical hypothesis testing to their discover-ies. Each community has preferred methods for constructingcontrols, comparing them against the alternative hypothe-sis, and thresholds of significance. These practices are usedin peer review to confirm or reject a new discovery.
For a VE platform to aid in testing of new theories, itneeds access to libraries that capture these best practices.Naturally, these libraries need to be extensible to follow thenorms of a community and support new techniques as theyarise. Presently, we are seeing this evolution happen in thelife sciences, where researchers are starting to adopt bayesianhypothesis testing in lieu of frequentist approaches [28].
Discovery Approaches To identify the high-level toolsneeded for data reuse, we draw from Kuhn’s study of the his-tory of scientific discovery [29]. In it, he argued that researchhappens in two flavors: normal science and occasional peri-ods of revolutionary science. Normal science works withina paradigm, building on a set of accepted discoveries thatprovide a coherent “model of the world” for follow-on work.This research is incremental and discoveries of this kind areusually predictable by practitioners of a field. Take for ex-ample Boyle’s Law, which codifies the relationship betweengas pressure and volume. In Kuhn’s taxonomy it is consid-ered normal science because it built on established theoriesof thermodynamics. Although this law is still in use today,Boyle needed this paradigm to exist before he knew the rightquestions to ask. The majority of science uses this “puzzlesolving” approach to discovery, and we designed VEs to sup-port these questions.
Over time, normal science may accumulate data that ex-poses the limitations of a paradigm. If these anomalies areconsistent—implying that certain parts of the paradigm areincorrect or incomplete—then this opens the door for rivalframeworks. Kuhn terms these shifts “revolutionary science”because they challenge long-held and seemingly obvious as-sumptions. When Copernicus theorized that the earth re-
volves around the sun and not the other way around, thiswas a new paradigm. Initially, his theory did not work us-ing existing tools for calculating planetary motion and newmethods were needed to make accurate predictions aboutthe location of celestial bodies at a given time. To this end,we also need to create tools so that scientists can evaluatehow individual contributions, such as a single publication,fit into the larger context of their field. We propose proba-bilistic causal graphs in Section 3.2 to help scientists probethe strengths and limitations of the paradigms within whichthey work.
In summary, we design the two main components of Hep-haestus to address the ways that scientists conduct theirwork. VEs will be useful for theory-driven normal sciencethat investigates discoveries in the context of a largerparadigm. Here, the scientist proposes a relationship forstudy that confirms an existing system of rules and stan-dards. On the other hand, probabilistic causal graphs willhelp scientists examine the broader implications of theirwork by assembling collections of discoveries so that re-searchers can relate them back to the underlying assump-tions of their experimental design. This data-driven strategywill help scientists look for results in the data that consis-tently contradict the state of the art.
3. HEPHAESTUSWe now take a look at our proposed eScience open data
platform, Hephaestus. It consists of two parts: virtual ex-periments and probabilistic causal graphs. The former isdesigned for exploring relationships pertaining to a smallnumber of variables. VEs will do so by executing statis-tical hypothesis testing over existing data. This analysisis well-suited for identifying causal links to a specific phe-nomenon. On the other hand, probabilistic causal graphs willtarget scientists looking at their research at a high level.These graphs maintain a large number of relationship de-rived from VEs so that researchers can explore paths ofproposed causality identifying consistencies and anomaliesin a body of work. This approach will help scientists eval-uate their work holistically and is amenable to comparingcompeting scientific paradigms.
3.1 Virtual ExperimentsThe scientific method enables experimenters to produce
empirical data for a specific experiment. As we saw in theprevious section, designing an experiment is not a trivialundertaking, and doing it correctly is crucial for meaningfulresults. Recall that VEs are designed to simulate randomizedcontrolled trials. Below, we outline the requirements of thesetrials, and how they might in principle translate to VEs.Randomized controlled trials call for:
• Controls: Trials contain a test condition and a con-trol to verify that the target effect only occurs whenthe intervention is applied. If VEs are conducted overthe results from published studies, in many circum-stances they will reuse existing controls. Sometimes,however, the control needs to be either estimated witha model or calculated from other sources, as discussedin Section 2.1.
• Blocking: Lab experiments also include blocking,where samples are divided into disjoint sets to evalu-ate the hypothesis separately over naturally occurring
sources of variance. In the parlance of experimentaldesign, blocking is often expressed as “controlling forx, y, and z”. VEs will take in blocking parameters de-scribing how the data will be partitioned for evalua-tion. Blocking also dictates how samples are selectedfor reuse, by specifying traits that need representation.Getting an experiment’s blocking correct is crucial foravoiding lurking variables.
• Randomization: Researchers assign subjects togroups (control or test) without explicit selection. Whena VE reuses data, samples have either already receivedthe intervention or did not. The new trial defers to therandomization applied in the initial experiments. Insome VEs, such as chemistry experiments, randomiza-tion is not necessary.
• Repeatability: Empirical trials replicate their find-ings, collecting enough samples to identify naturalsources of variation and to have high statistical power.VEs may have minimums on the sample sizes neededto complete their calculations, such as being a repre-sentative proportion of a known population.
Running Example We now introduce a running exam-ple in a strawman query language to motivate this work.This example works within a single relational-style engine,but it is easy to envision extending it to any number of datamodels and storage engines.
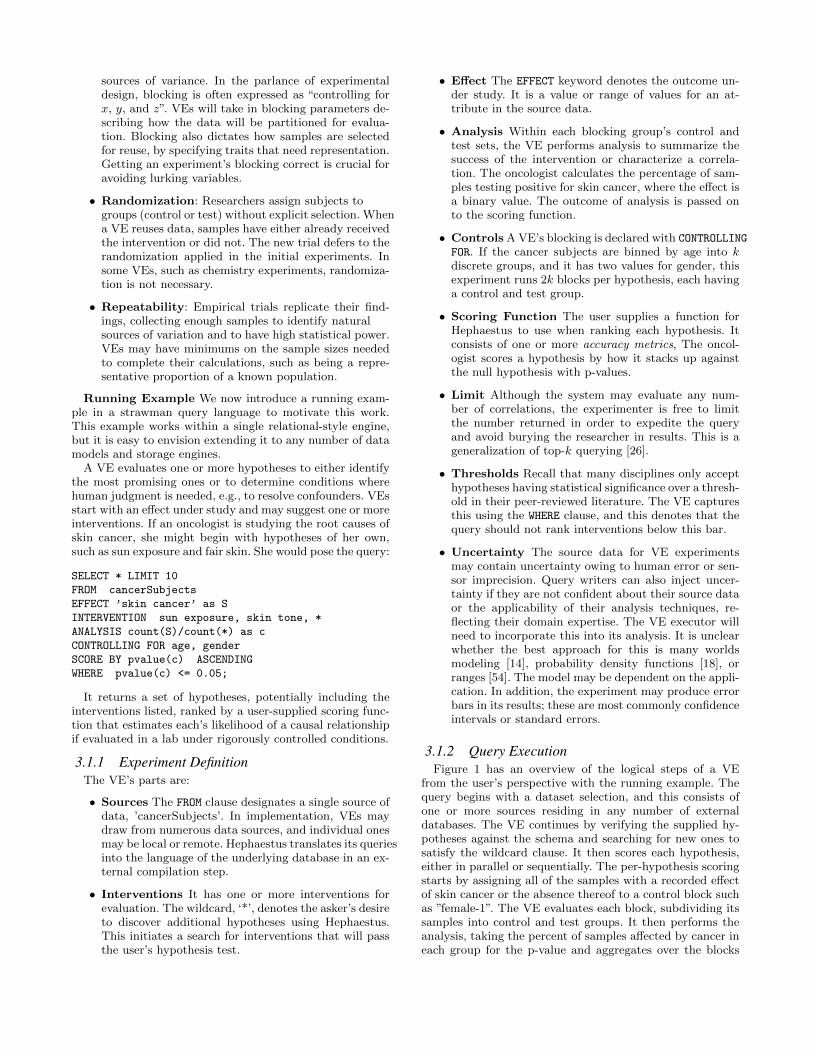
A VE evaluates one or more hypotheses to either identifythe most promising ones or to determine conditions wherehuman judgment is needed, e.g., to resolve confounders. VEsstart with an effect under study and may suggest one or moreinterventions. If an oncologist is studying the root causes ofskin cancer, she might begin with hypotheses of her own,such as sun exposure and fair skin. She would pose the query:
SELECT * LIMIT 10
FROM cancerSubjects
EFFECT ’skin cancer’ as S
INTERVENTION sun exposure, skin tone, *
ANALYSIS count(S)/count(*) as c
CONTROLLING FOR age, gender
SCORE BY pvalue(c) ASCENDING
WHERE pvalue(c) <= 0.05;
It returns a set of hypotheses, potentially including theinterventions listed, ranked by a user-supplied scoring func-tion that estimates each’s likelihood of a causal relationshipif evaluated in a lab under rigorously controlled conditions.
3.1.1 Experiment DefinitionThe VE’s parts are:
• Sources The FROM clause designates a single source ofdata, ’cancerSubjects’. In implementation, VEs maydraw from numerous data sources, and individual onesmay be local or remote. Hephaestus translates its queriesinto the language of the underlying database in an ex-ternal compilation step.
• Interventions It has one or more interventions forevaluation. The wildcard, ‘*’, denotes the asker’s desireto discover additional hypotheses using Hephaestus.This initiates a search for interventions that will passthe user’s hypothesis test.
• Effect The EFFECT keyword denotes the outcome un-der study. It is a value or range of values for an at-tribute in the source data.
• Analysis Within each blocking group’s control andtest sets, the VE performs analysis to summarize thesuccess of the intervention or characterize a correla-tion. The oncologist calculates the percentage of sam-ples testing positive for skin cancer, where the effect isa binary value. The outcome of analysis is passed onto the scoring function.
• Controls A VE’s blocking is declared with CONTROLLING
FOR. If the cancer subjects are binned by age into kdiscrete groups, and it has two values for gender, thisexperiment runs 2k blocks per hypothesis, each havinga control and test group.
• Scoring Function The user supplies a function forHephaestus to use when ranking each hypothesis. Itconsists of one or more accuracy metrics, The oncol-ogist scores a hypothesis by how it stacks up againstthe null hypothesis with p-values.
• Limit Although the system may evaluate any num-ber of correlations, the experimenter is free to limitthe number returned in order to expedite the queryand avoid burying the researcher in results. This is ageneralization of top-k querying [26].
• Thresholds Recall that many disciplines only accepthypotheses having statistical significance over a thresh-old in their peer-reviewed literature. The VE capturesthis using the WHERE clause, and this denotes that thequery should not rank interventions below this bar.
• Uncertainty The source data for VE experimentsmay contain uncertainty owing to human error or sen-sor imprecision. Query writers can also inject uncer-tainty if they are not confident about their source dataor the applicability of their analysis techniques, re-flecting their domain expertise. The VE executor willneed to incorporate this into its analysis. It is unclearwhether the best approach for this is many worldsmodeling [14], probability density functions [18], orranges [54]. The model may be dependent on the appli-cation. In addition, the experiment may produce errorbars in its results; these are most commonly confidenceintervals or standard errors.
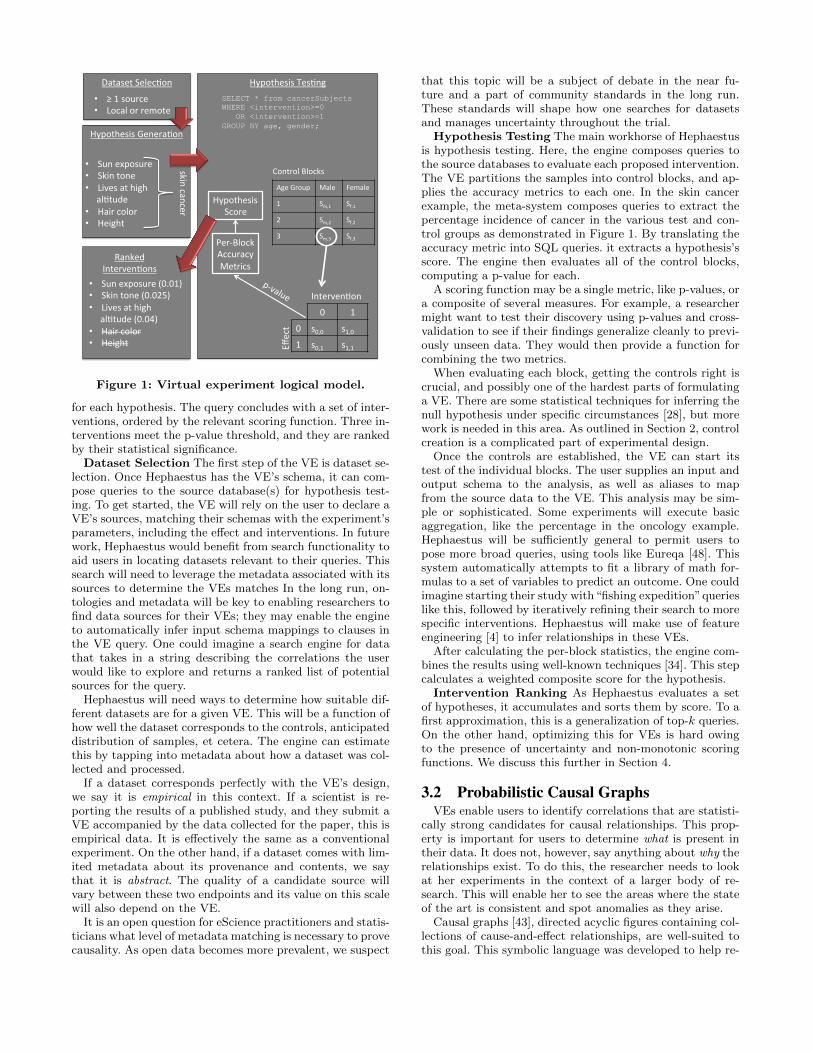
3.1.2 Query ExecutionFigure 1 has an overview of the logical steps of a VE
from the user’s perspective with the running example. Thequery begins with a dataset selection, and this consists ofone or more sources residing in any number of externaldatabases. The VE continues by verifying the supplied hy-potheses against the schema and searching for new ones tosatisfy the wildcard clause. It then scores each hypothesis,either in parallel or sequentially. The per-hypothesis scoringstarts by assigning all of the samples with a recorded effectof skin cancer or the absence thereof to a control block suchas ”female-1”. The VE evaluates each block, subdividing itssamples into control and test groups. It then performs theanalysis, taking the percent of samples affected by cancer ineach group for the p-value and aggregates over the blocks
Age$Group$ Male$ Female$
1$ Sm,1$
Sf,1$
2$ Sm,2$
Sf,2$
3$ Sm,3$
Sf,3$
Hypothesis$Tes<ng$
Control$Blocks$
SELECT * from cancerSubjects WHERE <intervention>=0 OR <intervention>=1 GROUP BY age, gender;
Interven<on$
0$ 1$
Effect$ 0$ s
0,0$s1,0$
1$ s0,1$
s1,1$
PerHBlock$$
Accuracy$
Metrics$
Hypothesis$
Score$
Ranked$
Interven<ons$
• Sun$exposure$(0.01)$
• Skin$tone$(0.025)$
• Lives$at$high$$
$$$$$al<tude$(0.04)$
• Hair$color$
• Height$
Hypothesis$Genera<on$
• Sun$exposure$
• Skin$tone$
• Lives$at$high$$
$$$$$al<tude$
• Hair$color$
• Height$
skin$cancer$
Dataset$Selec<on$
• ≥$1$source$
• Local$or$remote$
Figure 1: Virtual experiment logical model.
for each hypothesis. The query concludes with a set of inter-ventions, ordered by the relevant scoring function. Three in-terventions meet the p-value threshold, and they are rankedby their statistical significance.
Dataset Selection The first step of the VE is dataset se-lection. Once Hephaestus has the VE’s schema, it can com-pose queries to the source database(s) for hypothesis test-ing. To get started, the VE will rely on the user to declare aVE’s sources, matching their schemas with the experiment’sparameters, including the effect and interventions. In futurework, Hephaestus would benefit from search functionality toaid users in locating datasets relevant to their queries. Thissearch will need to leverage the metadata associated with itssources to determine the VEs matches In the long run, on-tologies and metadata will be key to enabling researchers tofind data sources for their VEs; they may enable the engineto automatically infer input schema mappings to clauses inthe VE query. One could imagine a search engine for datathat takes in a string describing the correlations the userwould like to explore and returns a ranked list of potentialsources for the query.
Hephaestus will need ways to determine how suitable dif-ferent datasets are for a given VE. This will be a function ofhow well the dataset corresponds to the controls, anticipateddistribution of samples, et cetera. The engine can estimatethis by tapping into metadata about how a dataset was col-lected and processed.
If a dataset corresponds perfectly with the VE’s design,we say it is empirical in this context. If a scientist is re-porting the results of a published study, and they submit aVE accompanied by the data collected for the paper, this isempirical data. It is effectively the same as a conventionalexperiment. On the other hand, if a dataset comes with lim-ited metadata about its provenance and contents, we saythat it is abstract. The quality of a candidate source willvary between these two endpoints and its value on this scalewill also depend on the VE.
It is an open question for eScience practitioners and statis-ticians what level of metadata matching is necessary to provecausality. As open data becomes more prevalent, we suspect
that this topic will be a subject of debate in the near fu-ture and a part of community standards in the long run.These standards will shape how one searches for datasetsand manages uncertainty throughout the trial.
Hypothesis Testing The main workhorse of Hephaestusis hypothesis testing. Here, the engine composes queries tothe source databases to evaluate each proposed intervention.The VE partitions the samples into control blocks, and ap-plies the accuracy metrics to each one. In the skin cancerexample, the meta-system composes queries to extract thepercentage incidence of cancer in the various test and con-trol groups as demonstrated in Figure 1. By translating theaccuracy metric into SQL queries. it extracts a hypothesis’sscore. The engine then evaluates all of the control blocks,computing a p-value for each.
A scoring function may be a single metric, like p-values, ora composite of several measures. For example, a researchermight want to test their discovery using p-values and cross-validation to see if their findings generalize cleanly to previ-ously unseen data. They would then provide a function forcombining the two metrics.
When evaluating each block, getting the controls right iscrucial, and possibly one of the hardest parts of formulatinga VE. There are some statistical techniques for inferring thenull hypothesis under specific circumstances [28], but morework is needed in this area. As outlined in Section 2, controlcreation is a complicated part of experimental design.
Once the controls are established, the VE can start itstest of the individual blocks. The user supplies an input andoutput schema to the analysis, as well as aliases to mapfrom the source data to the VE. This analysis may be sim-ple or sophisticated. Some experiments will execute basicaggregation, like the percentage in the oncology example.Hephaestus will be sufficiently general to permit users topose more broad queries, using tools like Eureqa [48]. Thissystem automatically attempts to fit a library of math for-mulas to a set of variables to predict an outcome. One couldimagine starting their study with“fishing expedition”querieslike this, followed by iteratively refining their search to morespecific interventions. Hephaestus will make use of featureengineering [4] to infer relationships in these VEs.
After calculating the per-block statistics, the engine com-bines the results using well-known techniques [34]. This stepcalculates a weighted composite score for the hypothesis.
Intervention Ranking As Hephaestus evaluates a setof hypotheses, it accumulates and sorts them by score. To afirst approximation, this is a generalization of top-k queries.On the other hand, optimizing this for VEs is hard owingto the presence of uncertainty and non-monotonic scoringfunctions. We discuss this further in Section 4.
3.2 Probabilistic Causal GraphsVEs enable users to identify correlations that are statisti-
cally strong candidates for causal relationships. This prop-erty is important for users to determine what is present intheir data. It does not, however, say anything about why therelationships exist. To do this, the researcher needs to lookat her experiments in the context of a larger body of re-search. This will enable her to see the areas where the stateof the art is consistent and spot anomalies as they arise.
Causal graphs [43], directed acyclic figures containing col-lections of cause-and-effect relationships, are well-suited tothis goal. This symbolic language was developed to help re-
f
e c
a
0.02
0.03
0.01
1
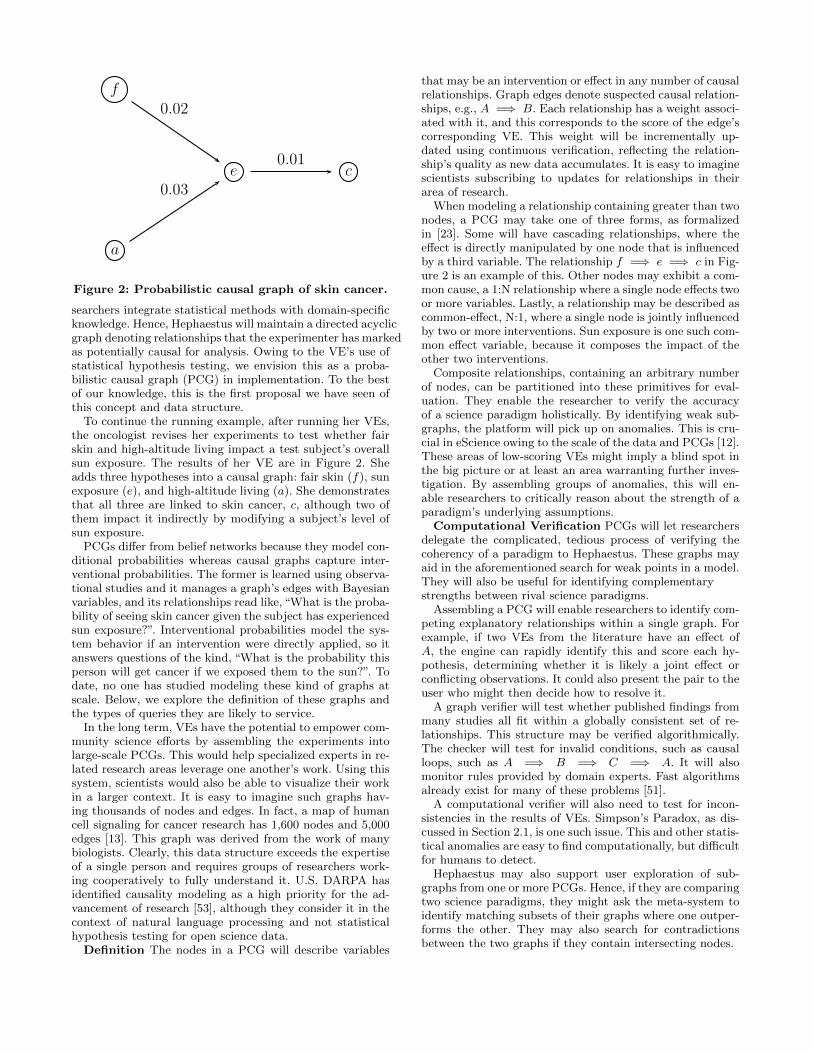
Figure 2: Probabilistic causal graph of skin cancer.
searchers integrate statistical methods with domain-specificknowledge. Hence, Hephaestus will maintain a directed acyclicgraph denoting relationships that the experimenter has markedas potentially causal for analysis. Owing to the VE’s use ofstatistical hypothesis testing, we envision this as a proba-bilistic causal graph (PCG) in implementation. To the bestof our knowledge, this is the first proposal we have seen ofthis concept and data structure.
To continue the running example, after running her VEs,the oncologist revises her experiments to test whether fairskin and high-altitude living impact a test subject’s overallsun exposure. The results of her VE are in Figure 2. Sheadds three hypotheses into a causal graph: fair skin (f), sunexposure (e), and high-altitude living (a). She demonstratesthat all three are linked to skin cancer, c, although two ofthem impact it indirectly by modifying a subject’s level ofsun exposure.
PCGs differ from belief networks because they model con-ditional probabilities whereas causal graphs capture inter-ventional probabilities. The former is learned using observa-tional studies and it manages a graph’s edges with Bayesianvariables, and its relationships read like, “What is the proba-bility of seeing skin cancer given the subject has experiencedsun exposure?”. Interventional probabilities model the sys-tem behavior if an intervention were directly applied, so itanswers questions of the kind, “What is the probability thisperson will get cancer if we exposed them to the sun?”. Todate, no one has studied modeling these kind of graphs atscale. Below, we explore the definition of these graphs andthe types of queries they are likely to service.
In the long term, VEs have the potential to empower com-munity science efforts by assembling the experiments intolarge-scale PCGs. This would help specialized experts in re-lated research areas leverage one another’s work. Using thissystem, scientists would also be able to visualize their workin a larger context. It is easy to imagine such graphs hav-ing thousands of nodes and edges. In fact, a map of humancell signaling for cancer research has 1,600 nodes and 5,000edges [13]. This graph was derived from the work of manybiologists. Clearly, this data structure exceeds the expertiseof a single person and requires groups of researchers work-ing cooperatively to fully understand it. U.S. DARPA hasidentified causality modeling as a high priority for the ad-vancement of research [53], although they consider it in thecontext of natural language processing and not statisticalhypothesis testing for open science data.
Definition The nodes in a PCG will describe variables
that may be an intervention or effect in any number of causalrelationships. Graph edges denote suspected causal relation-ships, e.g., A =⇒ B. Each relationship has a weight associ-ated with it, and this corresponds to the score of the edge’scorresponding VE. This weight will be incrementally up-dated using continuous verification, reflecting the relation-ship’s quality as new data accumulates. It is easy to imaginescientists subscribing to updates for relationships in theirarea of research.
When modeling a relationship containing greater than twonodes, a PCG may take one of three forms, as formalizedin [23]. Some will have cascading relationships, where theeffect is directly manipulated by one node that is influencedby a third variable. The relationship f =⇒ e =⇒ c in Fig-ure 2 is an example of this. Other nodes may exhibit a com-mon cause, a 1:N relationship where a single node effects twoor more variables. Lastly, a relationship may be described ascommon-effect, N:1, where a single node is jointly influencedby two or more interventions. Sun exposure is one such com-mon effect variable, because it composes the impact of theother two interventions.
Composite relationships, containing an arbitrary numberof nodes, can be partitioned into these primitives for eval-uation. They enable the researcher to verify the accuracyof a science paradigm holistically. By identifying weak sub-graphs, the platform will pick up on anomalies. This is cru-cial in eScience owing to the scale of the data and PCGs [12].These areas of low-scoring VEs might imply a blind spot inthe big picture or at least an area warranting further inves-tigation. By assembling groups of anomalies, this will en-able researchers to critically reason about the strength of aparadigm’s underlying assumptions.
Computational Verification PCGs will let researchersdelegate the complicated, tedious process of verifying thecoherency of a paradigm to Hephaestus. These graphs mayaid in the aforementioned search for weak points in a model.They will also be useful for identifying complementarystrengths between rival science paradigms.
Assembling a PCG will enable researchers to identify com-peting explanatory relationships within a single graph. Forexample, if two VEs from the literature have an effect ofA, the engine can rapidly identify this and score each hy-pothesis, determining whether it is likely a joint effect orconflicting observations. It could also present the pair to theuser who might then decide how to resolve it.
A graph verifier will test whether published findings frommany studies all fit within a globally consistent set of re-lationships. This structure may be verified algorithmically.The checker will test for invalid conditions, such as causalloops, such as A =⇒ B =⇒ C =⇒ A. It will alsomonitor rules provided by domain experts. Fast algorithmsalready exist for many of these problems [51].
A computational verifier will also need to test for incon-sistencies in the results of VEs. Simpson’s Paradox, as dis-cussed in Section 2.1, is one such issue. This and other statis-tical anomalies are easy to find computationally, but difficultfor humans to detect.
Hephaestus may also support user exploration of sub-graphs from one or more PCGs. Hence, if they are comparingtwo science paradigms, they might ask the meta-system toidentify matching subsets of their graphs where one outper-forms the other. They may also search for contradictionsbetween the two graphs if they contain intersecting nodes.
This verification will also extend to continuous verifica-tion of VEs. As more data becomes available, Hephaestuswill recompute the weights of its edges by applying the VEsto the new sources. This may promote some relationshipsover others in the case of competing VE-backed theories. Italso has the possibility of breaking some of the graph rela-tionships, and this may create ripples of change throughoutthe structure. Hence, the platform will need techniques toefficiently test the integrity of a graph incrementally, ratherthan recompute the whole set.
Exploratory Analysis PCGs will enable man-machinesymbiosis by helping researchers explore a hypothesis space.They will do so by visualizing proposed relationships, by ad-justing their model parameters, and by interactively probingthe graph.
A graph will render proposed relationships from new VEsover the findings that are already accepted. This will be es-pecially useful for VEs containing the wildcard. The newones might appear as dotted lines on top of the existingnodes and edges so that the scientist can assess how theywould fit into the larger picture. The user could the querythe proposed edges to see any impact they might have onthe consistency of the graph. They could optionally acceptthe ones they deemed most interesting to their personal col-lection of theories.
The user may also dynamically adjust parts of their VEdesign, seeing how it effects the graph as a whole. The PCGvisualization might come with sliders for setting the thresh-old of a hypothesis test, where increasing or decreasing thetolerances of the VE would make graph edges appear or dis-appear accordingly. They could also manipulate the scoringfunction and other parts of the experimental design.
Researchers may zoom in and out of the graph at dif-ferent levels of abstraction. If a scientist is looking at howclusters of cells interact with one another when cancer cellsgrow, they might zoom in to see the relationships betweenorganelles in a single cell. Each level will contain reference todifferent bodies of work, and mean plugging in to the graphsof researchers in neighboring fields.
The graph will also facilitate visualizing the strength of itsrelationships in different subgraphs. If a causal link breaksowing to continuous verification of the underlying VEs, theplatform will alert the user to new anomalies. Users couldalso generate a heat map, showing where the graph hasthe strongest statistical significance and where the modelis strained. Clearly, there are huge gains possible by main-taining this network of suspected causal relationships andsharing them with others. By formalizing bodies of researchas graphs, researchers will computationally verify the as-sumptions that underpin their work and visualize how newresults fit into the prior work.
4. RESEARCH CHALLENGESThe vision of Hephaestus gives rise to several important
challenges for the data management community. Many areinterdisciplinary and are well-positioned for collaborationswith statisticians and human-computer interactionresearchers. In this section, we explore the implications ofintegrating statistics for hypothesis testing into query op-timization. We then look at the challenges associated withman-machine symbiosis for VEs and PCGs. Lastly, this sec-tion contains an outline of several research opportunities forthe architecture of this meta-system.
4.1 Integrated StatisticsAlthough we propose Hephaestus as a meta-system on top
of existing databases, it will benefit from working with stor-age engines optimized for statistical analysis. Rather thandecoupling the query processing on open data repositoriesfrom statistical hypothesis testing, this issue lends itself toan integrated approach as demonstrated by BlinkDB [2].This database provides approximate query results over largedatasets using sampling. It taps into statistics about the un-derlying data’s distribution to compute results with boundederrors.
Hephaestus may benefit from a similar approach where ittakes into account the source data distribution and opera-tor characteristics to compile VEs into relational-style queryplans. Below we detail several statistics challenge that areamenable to performance optimization by integrating theminto the query optimization process.
Combining Disparate Datasets At present, puttingmultiple datasets into a single analysis takes careful manualplanning. Limited techniques exist for this issue [7], and theavailable options are targeted for data sources that share aschema. There is work to be done in aggregating over theresults of many studies with differing degrees of overlap intheir experimental design. A platform may improve queryperformance by selecting the most efficient intermediate rep-resentation for each study and ordering the computation ofeach result to rapidly rule out hypotheses.
The first version of Hephaestus will calculate the accuracymetrics of each dataset independently, and take a weightedsum over the control blocks shared among studies for thehypothesis’s score. The experiment designer will select aweighting function; they are likely to use factors such aseach block’s sample size or variance. This approach is ap-pealing because if the datasets are not collocated, it sim-plifies query planning by not aggregating all of the samplesinto one mega-study.
Missing Data Imputation One aspect of data reusethat makes designing experiments non-trivial is that not allof the variables the experimenter wants to account for maybe present in every dataset. To address this, the researchermay reduce their control blocks to the intersection of thesource schemas. They can then analyze the variance of theirexperiment blocks to see if this is satisfactory.
If these reduced sets of controls are insufficient, the re-searcher may statistically infer the missing variables frommore complete samples [20]. Any uncertainty introducedfrom this process needs to be propagated through the restof the analysis. This typically involves applying a modelingfunction, like linear regression, to the data in order to learnfrom the fully populated dataset the likely values of the un-available variables. Identifying opportunities to apply impu-tation at scale and optimizing this process over distributed,heterogeneous data sources is an open problem. The same istrue about efficiently managing the uncertainty created bythis technique for massive datasets.
False Discovery Rate Support Data-intensive sciencehas the novel potential that researchers can test an unprece-dented number of hypotheses over a single dataset. For ex-ample, a genomics study with n human subjects may recordthousands of measurements per person. It is likely that cor-relations will emerge from this analysis that pass the thresh-old of statistical hypothesis testing, but are nonetheless arespurious because the number of potential hypotheses vastly
exceed the count of human subjects. There are a variety oftechniques for controlling the number of false positives [6],such as taking some fraction of all of the hypotheses thattested true. This fraction is selected from the hypothesesthat have the highest accuracy ratings.
At first glance, this problem is similar to a top-k selection,but the k is not known up front because it is a functionof how many hypotheses make it over the bar. Moreover, konly grows with time as more hypotheses pass the threshold.Optimizing this adaptive cutoff of the query results is anunsolved challenge.
Sampling Another possibility for query speedup is touse sampling to estimate the hypothesis with high confi-dence over a smaller subset of the data. If the user is will-ing to accept some uncertainty, perhaps making the resultswithin 95% of the correct figure, many scoring functions areamenable to sampling.
As demonstrated by BlinkDB, integrating principled sam-pling into query execution dramatically speeds up the pro-cess. There are several generalizations needed to this frame-work to make it applicable for data reuse. This databaseleverages precomputed sample sets for its fast, approximateanswers. For data that is not stored locally, this approachmay need to create composite samples from multiple sources,each of which will be of varying size and may have differentdata distributions.
A related issue arises when the samples used for approxi-mate query processing produce inaccurate error bounds. Theresearch in [1] demonstrated that techniques for deriving er-ror bars on approximate relational query results producehigh error rates in practice. The authors created ways to es-timate these errors and use them to either enlarge the errorbars or to report that sampling is not possible. Clearly morework is needed for adaptive, iterative sampling within thequery planner. This class of queries will need error bars andprimitives describing their quality as first-class objects inits evaluations in order to converge on satisfactory solutionsquickly.
4.2 Man-Machine SymbiosisWe now examine a set of open challenges regarding how
to efficiently use human attention to accelerate scientific dis-covery. These problems revolve around making the compu-tation of results fast enough for interactive visualization.We also look at the conditions under which the engine willneed to alert the user to ambiguities in the datasets and hy-pothesis testing results. We also briefly touch on the issueof empowering researchers to prune the space of hypothesesand visualize uncertainty.
Incremental Graph Evaluation Probabilistic causalgraphs call for a rich set of interactions, as outlined in Sec-tion 3.2. First off, the visualizer will need techniques tostore the results from VEs in a way such that they can becombined with new runs of the same VE over different in-put data. Having these intermediate results would enablethe database to combine the hypothesis tests from multi-ple datasets into a single scoring function without rerunningthe previous VEs. Materialized views may provide an effi-cient way to incrementally compute this figure for one ormore VEs, but they may require new building blocks in or-der to support complex scoring functions. Second, the PCGengine would benefit from working with sampling as out-lined above in order to rapidly recompute the visualization
when the user modifies parameters such as their hypothesistesting threshold.
Hypothesis Space Modeling One approach to tamingthe complexity of mining a large number of hypothesis isto selectively tap into human intelligence. When a VE isproposing interventions owing to a wildcard operator, theengine could display a partial list to the experiment writerand ask them to eliminate ones they deem uninteresting orirrelevant. If a community of users leverages Hephaestus,it may be possible to learn from this feedback collectively.Hence, domain experts could provide rules like “the weatheris never affected by a person’s pulse”, and anyone can usethem. Ultimately, we suspect that a hypothesis space will bepruned using a combination of sampling, feature engineer-ing, and crowdsourcing.
A second challenging aspect of hypothesis space modelingin Hephaestus is handling complex correlations. If the exper-iment designer asks a question of the form A =⇒ B =⇒C, they want to score each link in the chain. If A and B areboth a large set of proposed interventions, this will create anexplosion in the space of correlations to quantify. Clearly thiswon’t scale up. VEs where many interventions contribute toa single outcome will also call for sophisticated modeling toselect the most plausible hypotheses for user feedback.
Another scenario where this hypothesis space could getcomplicated to model is for conditional interventions. Somecausal relationships are not simply stated with “A impliesB”, hence Hephaestus may need to create forks in its causalgraph. In the running example, the VE may determine thatthe youngest cohort in the study has high-altitude living asits strongest intervention, whereas the elder control block’scancer rate is more influenced by skin tone.
Language Design VE language design involves under-standing and meeting the requirements of eScientists ex-pressed in a form that is amenable to database optimization.Examples include expressing empirical requirements such asmultiple, ordered hypotheses with scoring and blocking andallowing subqueries in a VE. We introduced a simple lan-guage in Section 3.1, but clearly a richer model is needed toexpress VEs. In particular, if nested queries have wildcards,careful thought is needed to find efficient ways to createrelational-style plans. This is another place where featureengineering is likely to make VEs more efficient.
Managing Inconsistency Building in mechanisms forinconsistency in eScience will be necessary make VEs ef-fective. Presently there is no principled way to differentiatecomplex interactions from confounders and human expertsare needed to intervene for these circumstances. Instead, wewill focus on identifying inconsistencies and finding ways toeconomize the user’s time for the ones that are most likelyto yield results. The system also needs to be flexible for adiverse set of directives in response to these alerts. Expertfeedback might include“eliminate this intervention”,“the or-der is most probably this, and these ones seem plausible”,or “ evaluate these combinations”.
Visualizing Uncertainty Another interesting challengein this framework is presenting uncertainty to the user. Al-though error bars are needed for nearly every step in Hep-haestus, displaying them on a graph is not a solved problem.There are many possible ways to do this, such as varying thethickness of the edges and color coding relationships by theirVE’s score. User studies are needed on the best way to con-vey this important element of the experimental results.
4.3 Architecture & PerformanceThere are several challenges associated with building this
platform to make it both accurate and performant. Here, weoutline a few of the architectural questions. Many of themare likely to build on existing database research, and wesketch out these approaches when applicable.
Source Data Search As we touched upon earlier, iden-tifying the best data sources for a VE will call for a mixof conventional search techniques and specialized ones toaccommodate the needs of statistical hypothesis testing. Inparticular, users will want to take advantage of metadataabout the provenance and schema of potential data sources.Work will need to be done to identify ones that meet theexperiment’s design, even in the presence of data that mayvary from empirical to abstract in the context of a VE.
Query Translation Once a language is researched andestablished for VEs, the Hephaestus engine will need to beable to compile it into queries for the open data repos-itory. These queries might be in SQL or any number ofdomain-specific languages depending on how the data isstored. Finding the right building blocks for rewriting VEsfor one or more storage engines is an open question.
Aggregation VEs with many possible interventions arelikely to benefit from reframing multiple hypothesis testsas data cube queries. Rather than executing the query inFigure 1 once per intervention, Hephaestus could composeand evaluate bins from multiple hypotheses at the sametime. If the system groups by the proposed interventions, thebinning query in Figure 1 becomes SELECT count(*) FROM
cancerSubjects GROUP BY age, gender, intervention1,
intervention2, . . . CUBE(<interventions>). This wouldaggregate the count at every level, potentially reusing in-tersecting sets of controls. This batching would also be use-ful for probabilistic causal graph verification for ambiguitieslike Simpson’s Paradox. Identifying the right levels of ag-gregation and coordinating this effort among multiple datasources is an open question.
Uncertainty The database community has created a va-riety of methods for managing uncertainty in relational data[14, 18, 54]. It is unclear how to propagate the models forthese solutions through the steps of a VE, especially in thepresence of multiple evaluations of the same VE over differ-ent data sources, and in cascading relationships. More workis needed to find efficient ways to complete these queries.
Top-k Generalization If the VE limits the number ofresults returned, this may reduce the search space of hy-potheses to evaluate. Taking a page from relational top-koptimization, there are at least two vectors for this approach.First, the database would use sampling to evaluate thresh-olds, such as the p-value being ≤ 0.05. Interventions that donot meet this requirement would not compute any additionalmetrics for complex relationships.
Another direction is to opportunistically ordering the eval-uation of multiple datasets for a single intervention. Here, ifthe results are combined by a weighted sum on their sam-ple size a la [7], the optimizer can determine the boundsof the smaller dataset’s scoring function that will result inthe intervention being rejected. This would prevent a secondround of testing on the larger data source. There are severalaspects to the VE’s structure that make this type of opti-mization challenging. Supporting false discovery rates, un-certainty, and complex analysis like p-values makes it hardto model the outcomes of different hypotheses. Sampling will
be key to speeding up this process.Distributed Query Optimization A related issue to
top-k generalization is that of coordinating queries over mul-tiple data sources. This work can be made more efficient bytaking into account the relative capabilities of each memberdatabase to select the storage engine that will run first. Run-ning the smallest datasets will efficiently eliminate hypothe-ses. In addition, if data needs to be moved from one host toanother for joins and other comparisons, the optimizer willneed to accurately estimate the cost of these operations andavailability of hardware resources on each host.
In summary, we outline the first research steps needed tocreate a data reuse platform. We examine the integration ofstatistics, optimization of man-machine symbiosis, and a setof architecture challenges associated with open science datamanagement. Each has the opportunity to build on existingdatabase solutions, but still has numerous novel directions.
5. CONCLUSIONSIn this vision paper, we explore how science is changing as
research data becomes more abundant and open. We notethat this creates an opportunity to statistically test hypothe-ses on existing data in many circumstances. To this end, wepropose Hephaestus, a platform for data reuse in eScience.This system will enable scientists to explore their theoriesin two ways. First, virtual experiments (VEs) are designedfor statistical hypothesis testing from empirical in-house tri-als, publicly available open science repositories, or a combi-nation of the two. These queries will simulate randomizedcontrolled trials by implementing the principles of empiricalscientific research. VEs will estimate the statistical signifi-cance of correlations using a scoring function supplied by theuser. We then propose to assemble the correlations found byHephaestus and by existing empirically-derived scientific dis-covery into probabilistic causal graphs, so that researcherscan share and inspect their findings, updating them as dis-coveries are made. This framework will let researchers cre-ate experimental designs that are testable on any number ofdata sources. Hence, they have the opportunity to performcontinuous verification on their discoveries as new data be-comes available from related research.
This work puts forth numerous research directions for thedata management community. In particular, we advocatefor integrating statistics more closely with query executionin science databases, carefully rationing human attention forhypothesis selection, and generalizations to relational-styledatabase architecture to support VEs. This work is a firststep toward enabling eScience practitioners to mine realityfrom massive datasets for scientific discovery.
6. ACKNOWLEDGMENTSThe authors thank their colleagues for their insightful
feedback, including Jaime Carbonell, Herb Lin, Sam Mad-den, Gregory Piatetsky-Shapiro, Michael Stonebraker, EliUpfal, and Eugene Wu. We are also grateful to the anony-mous reviewers of this paper whose comments guided manyimportant improvements. We also acknowledge the manyscientists who have so generously taken the time to answerour questions on how scientific research is conducted, includ-ing Clare Bernard, James Michaelson, Tanya Monro, PardisSabeti, and Pete Szolovits. This work was funded by theIntel Science and Technology Center for Big Data.
7. REFERENCES[1] S. Agarwal, H. Milner, A. Kleiner, A. Talwalkar,
M. Jordan, S. Madden, B. Mozafari, and I. Stoica.Knowing when you’re wrong: Building fast andreliable approximate query processing systems.SIGMOD ’14, pages 481–492, 2014.
[2] S. Agarwal, B. Mozafari, A. Panda, H. Milner,S. Madden, and I. Stoica. Blinkdb: queries withbounded errors and bounded response times on verylarge data. In Eurosys, pages 29–42. ACM, 2013.
[3] C. Anderson. The end of theory: the data delugemakes the scientific method obsolete. Wired, 14(6),2008.
[4] M. Anderson, D. Antenucci, V. Bittorf, M. Burgess,M. J. Cafarella, A. Kumar, F. Niu, Y. Park, C. Re,and C. Zhang. Brainwash: A data system for featureengineering. In CIDR, 2013.
[5] C. G. Begley and L. M. Ellis. Drug development:Raise standards for preclinical cancer research.Nature, 483(7391):531–533, 2012.
[6] Y. Benjamini and Y. Hochberg. Controlling the falsediscovery rate: a practical and powerful approach tomultiple testing. Journal of the Royal StatisticalSociety. Series B (Methodological), pages 289–300,1995.
[7] M. Borenstein, L. V. Hedges, J. P. Higgins, and H. R.Rothstein. Introduction to meta-analysis. Wiley, 2011.
[8] P. G. Brown. Overview of scidb: large scale arraystorage, processing and analysis. In SIGMOD, pages963–968, 2010.
[9] C. Carilli and S. Rawlings. Science with the SquareKilometer Array: motivation, key science projects,standards and assumptions. arXiv preprintastro-ph/0409274, 2004.
[10] CERN. Large hadron collider. http://home.web.cern.ch/topics/large-hadron-collider.
[11] C. Charig, D. Webb, S. Payne, and J. Wickham.Comparison of treatment of renal calculi by opensurgery, percutaneous nephrolithotomy, andextracorporeal shockwave lithotripsy. British medicaljournal (Clinical research ed.), 292(6524):879, 1986.
[12] Committee on the Analysis of Massive Data. Frontiersin Massive Data Analysis. The National AcademiesPress, 2013.
[13] Q. Cui, Y. Ma, M. Jaramillo, H. Bari, A. Awan,S. Yang, S. Zhang, L. Liu, M. Lu,M. O’Connor-McCourt, et al. A map of human cancersignaling. Molecular systems biology, 3(1), 2007.
[14] N. Dalvi, C. Re, and D. Suciu. Probabilistic databases:diamonds in the dirt. CACM, 52(7):86–94, 2009.
[15] P. A. David. The economic logic of “open science” andthe balance between private property rights and thepublic domain in scientific data and information: aprimer. In The role of scientific and technical data andinformation in the public domain, pages 19–34. BasicBooks, 2003.
[16] D. De Roure, C. Goble, and R. Stevens. The designand realisation of the virtual research environment forsocial sharing of workflows. Future GenerationComputer Systems, 25(5):561–567, 2009.
[17] A. R. Diekema, A. Wesolek, and C. D. Walters. TheNSF/NIH Effect: Surveying the Effect of Data
Management Requirements on Faculty, SponsoredPrograms, and Institutional Repositories. The Journalof Academic Librarianship, 2014.
[18] A. Faradjian, J. Gehrke, and P. Bonnet. GADT: Aprobability space ADT for representing and queryingthe physical world. In ICDE, pages 201–211. IEEE,2002.
[19] J. Ginsberg, M. H. Mohebbi, R. S. Patel, L. Brammer,M. S. Smolinski, and L. Brilliant. Detecting influenzaepidemics using search engine query data. Nature,457(7232):1012–1014, 2008.
[20] J. S. Greenlees, W. S. Reece, and K. D. Zieschang.Imputation of missing values when the probability ofresponse depends on the variable being imputed.Journal of the American Statistical Association,77(378):251–261, 1982.
[21] F. Griffiths and K. Jones. The use of hormonereplacement therapy; results of a community survey.Family practice, 12(2):163–165, 1995.
[22] W. Gunn. Reproducibility: Fraud is not the bigproblem. Nature, 505(7484):483–483, 2014.
[23] Y. Hagmayer, S. A. Sloman, D. A. Lagnado, andM. R. Waldmann. Causal reasoning throughintervention. Causal learning: Psychology, philosophy,and computation, pages 86–100, 2007.
[24] A. Halevy, P. Norvig, and F. Pereira. Theunreasonable effectiveness of data. IEEE IntelligentSys., 24(2):8–12, 2009.
[25] D. Halperin, V. T. de Almeida, L. L. Choo, S. Chu,P. Koutris, D. Moritz, J. Ortiz, V. Ruamviboonsuk,J. Wang, A. Whitaker, S. Xu, M. Balazinska, B. Howe,and D. Suciu. Demonstration of the Myria Big DataManagement Service. In SIGMOD, pages 881–884,2014.
[26] I. F. Ilyas, G. Beskales, and M. A. Soliman. A surveyof top-k query processing techniques in relationaldatabase systems. Computing Surveys, 40(4):11, 2008.
[27] J. P. Ioannidis. Why most published research findingsare false. PLoS medicine, 2(8):e124, 2005.
[28] V. E. Johnson. Revised standards for statisticalevidence. Proceedings of the National Academy ofSciences, 110(48):19313–19317, 2013.
[29] T. S. Kuhn. The structure of scientific revolutions.University of Chicago press, 1962.
[30] A. Kumar, F. Niu, and C. Re. Hazy: Making it easierto build and maintain big-data analytics. CACM,56(3):40–49, 2013.
[31] D. A. Lawlor, G. D. Smith, and S. Ebrahim.Commentary: The hormone replacement–coronaryheart disease conundrum: is this the death ofobservational epidemiology? International Journal ofEpidemiology, 33(3):464–467, 2004.
[32] D. Lazer. Mistaken analysis. MIT Tech Review, 2014.
[33] J. C. R. Licklider. Man-computer symbiosis. HumanFactors in Electronics, IRE Transactions on, (1):4–11,1960.
[34] T. Liptak. On the combination of independent tests.Magyar Tud Akad Mat Kutato Int Kozl, 3:171–197,1958.
[35] S. Lohr. Google flu trends: the limits of big data. NewYork Times, 2014.
[36] G. Marcus and E. Davis. Eight (No, Nine!) ProblemsWith Big Data. New York Times.
[37] G. A. Miller. The magical number seven, plus orminus two: some limits on our capacity for processinginformation. Psychological review, 63(2):81, 1956.
[38] NASA. Moderate-Resolution ImagingSpectroradiometer (MODIS). 1999.http://modis.gsfc.nasa.gov/.
[39] National Institutes of Health. Big data to knowledge(bd2k) initiative. http://bd2k.nih.gov/.
[40] National Institutes of Health. Biomedical informationscience and technology initiative.http://www.bisti.nih.gov.
[41] National Institutes of Health. NIH Grants PolicyStatement. http://grants.nih.gov/grants/policy/nihgps_2013/.
[42] F. Niu, C. Zhang, C. Re, and J. W. Shavlik.DeepDive: Web-scale Knowledge-base Constructionusing Statistical Learning and Inference. In VLDB,pages 25–28, 2012.
[43] J. Pearl. Causal diagrams for empirical research.Biometrika, 82(4):669–688, 1995.
[44] J. Pearl. Causality: Models, Reasoning and Inference,volume 29. Cambridge Univ Press, 2000.
[45] J. Robertson. Stats: We’re doing it wrong, Apr. 2011.
[46] M. Rubacha, A. K. Rattan, and S. C. Hosselet. Areview of electronic laboratory notebooks available inthe market today. Journal of the Association forLaboratory Automation, 16(1):90–98, 2011.
[47] N. Savage. Automating scientific discovery. CACM,55(5):9–11, May 2012.
[48] M. Schmidt and H. Lipson. Distilling free-form naturallaws from experimental data. Science,324(5923):81–85, 2009.
[49] N. Silver. The signal and the noise: Why so manypredictions fail-but some don’t. Penguin, 2012.
[50] S. Spangler, A. D. Wilkins, B. J. Bachman,M. Nagarajan, T. Dayaram, P. Haas, S. Regenbogen,C. R. Pickering, A. Comer, J. N. Myers, et al.Automated hypothesis generation based on miningscientific literature. In SIGKDD, pages 1877–1886.ACM, 2014.
[51] R. E. Tarjan and M. Yannakakis. Simple linear-timealgorithms to test chordality of graphs, test acyclicityof hypergraphs, and selectively reduce acyclichypergraphs. SIAM Journal on computing,13(3):566–579, 1984.
[52] J. A. Tyson. Large synoptic survey telescope:overview. In Astronomical Telescopes andInstrumentation, pages 10–20. International Societyfor Optics and Photonics, 2002.
[53] U.S. Defense Advanced Research Projects Agency. Bigmechanism seeks the “whys” hidden in big data. 2014.http://www.darpa.mil/NewsEvents/Releases/2014/
02/20.aspx.
[54] J. Widom. Trio: A system for integrated managementof data, accuracy, and lineage. Technical Report, 2004.