herding and information flows in emerging markets and information flows in emerging markets lei feng...
TRANSCRIPT

Herding and Information Flows in Emerging Markets
Lei Feng
Harvard Business School
Mark S. Seasholes
U.C. Berkeley
This Version April 2002∗
Abstract
This paper presents an in-depth study of individual investor behavior in an emerging stockmarket. We begin by documenting the existence of correlated buying (herding) among investors.Our sample has approximately the same level of herding as existing studies. A new measure ofherding based on a runs test is also proposed. We document which type of investors are proneto herding. Surprisingly, the propensity to herd is correlated (positively) only with length oftime that an account has been open. This is the first indication that herd behavior may not betied to the lack of investor sophistication. We are able to divide investors into isolated groups;each group places its trades at a specific brokerage branch office in the People’s Republic ofChina. The ability to isolate groups of investors allows us to test whether herding is the resultof group-psychology. Again, we find no evidence that this is the case. In fact, the decisionto buy or sell a given stock is significantly correlated across isolated groups of investors. Thecorrelation of stock buying/selling is even higher within a regional/language group than acrossdifferent groups. The final result is that herding among individual investors is negatively relatedto stock returns. This suggests that another group in the market buys as prices go up and theindividuals in our sample act as liquidity providers.
Keywords: Individual Investors, Behavioral Finance, Emerging Markets
JEL number: G15, F3, D1
∗Preliminary and incomplete - please do not cite without the authors’ permission. We thank Terry
Odean for helpful comments. Any mistakes are ours alone. Contact information: Lei Feng, Harvard Business School,
Morgan Hall, Boston MA 02134; Tel: 617-495-6784; email: [email protected]; Mark S. Seasholes, U.C. Berkeley Haas
School of Business, 545 Student Services Bldg., Berkeley CA 94720; Tel: 510-642-3421; Fax: 510-643-1420; email:
[email protected]. c©2002.
1

1 Introduction
Over the past decade, financial economists have become increasingly fascinated with herd
behavior in financial markets. Does a well-defined subset of investors tend to buy and sell
securities together? Such buying and selling en-masse (or “herding”) is often behavior
attributed to investors in emerging markets. If emerging market investors do engage in
herding, what drives this behavior? Do certain types of individuals have a propensity to join
the herd? Are investors simply choosing their investment strategy by observing investment
decisions of those around them? Or, does a subgroup of investors receive common informa-
tion? Finally, does the existence of herd behavior affect asset prices? In other words, is the
(high) volatility of emerging stock markets tied to investor behavior?
A number of papers document the existence of herd behavior and some show a link between
herding and asset prices. However, few empirical studies explain exactly what causes herding.
The lack of such empirical studies is understandable - financial economists cannot get inside
the head of every investor at the time of a trade. It is equally difficult to know what
information an investor has when placing a trade. Thus, understanding herding (ex-post)
becomes a difficult exercise in data analysis.
This paper provides a thorough investigation of herd behavior. We confirm the results of
previous studies regarding the existence of herding. We also propose a new measure of
herding based on a runs test. Once herding has been shown to be significant in our data, we
document which type of investor joins herds. Later, we provide evidence as to the cause(s)
behind the observed herding. Finally, we document the link between herd behavior and
changes in asset prices in an emerging market. We show that the causes of the observed
herding are consistent with the observed changes in asset prices.
This paper uses new, exciting, and detailed data from the People’s Republic of China (PRC)
to answer the questions posed above. The data contain information such as which investor
buys/sells which stock at what time (down to the second.) The structure of brokerage offices
in the PRC tells us exactly where an investor is standing when he or she places an order.
Brokerage offices in the PRC require each client to place orders through the branch office
where the account was opened. We then consider only trades made through terminals or
cashier windows that are physically located in the branch office. The research design and
the fact that groups of investors in the PRC actually stand in the same room at the time
they place orders allows us to examine isolated groups. Figure 1 provides a sketch of a
2

typical branch office. As we can see, the room allows for a free flow of conversation between
investors. If there is ever a chance for financial economists to observe herd behavior within
a well-defined group of investors, this set-up would appear to be it.
Thus, the paper proceeds as follows: Section 2 gives an overview of related work; Section
3 discusses the data used in this paper; Section 4 presents our tests and results; Section 5
provides alternative hypotheses and robustness tests; and Section 6 concludes.
2 Existing studies of herd behavior
Herd behavior in financial markets is a broad topic and commonly referred to by a number of
names (such as: correlated buying/selling, observational influence, or information cascades.)
Hirshleifer and Teoh (2001) provide a review and a “taxonomy of effects” related to this
subject. Another nice overview of herding in financial markets is provided by Bikchandani
and Sharma (2000). For the purposes of this paper, we measure correlated trading behavior
among investors. Rather than use the full taxonomy provided in the review articles, we focus
on three broad reasons why economists might observe such behavior: i) Ex-post measure-
ments that show highly correlated buying is simply a small-sample bias; ii) Investors base
their investment decisions on those around them; and iii) Heterogeneous investors receive
common information. Investors of one type tend to buy (sell) while other types tend to do
the opposite.
Herding behavior in the U.S.: Lakonishok, Shleifer, and Vishny (1992) examine the
impact of institutional trading in the U.S. on stock prices. The authors find that if money
managers of a tax-exempt fund are equally likely to buy or sell a stock in a given quarter,
52.7% of the managers tend to buy (sell) during a quarter while 47.3% do the opposite.
Though a slight imbalance of 2.7% could be potentially destabilizing to stock prices, the
authors find little evidence of this.
Grinblatt, Titman, and Wermers (1995) find only “weak evidence that funds tend[ed] to
buy and sell the same stocks at the same time.” The authors did, however, show that
approximately 77% of mutual funds bought past winners (which is known as positive feedback
trading.)
Nofsinger and Sias (1999) find a strong positive correlation between changes in aggregate in-
stitutional ownership and contemporaneous stock returns. Stocks that institutions purchase
3

outperform stocks they sell over the next year.
Wermers (1999) provides an extensive analysis of the mutual fund industry. Like Lakonishok,
Shleifer, and Vishny (1992), he finds more herding in small stocks than in the average stock.
He also finds that “stocks that herds buy outperform stocks that they sell by 4 percent
during the following six months.”
There are few studies of individual herding in the United States. Researchers have focused
more on individual biases and have not yet turned to group-psychology.
International studies of herd behavior: Choe, Kho, and Stulz (1999) conduct an early
study of herding in international markets. They calculate a similar measure of herding as
Lakonishok, Shleifer, and Vishny (1992). Choe et. al find strong evidence of herding among
foreign institutions operating in Korea before the financial crisis of 1997. The measure of
herding falls (slightly) during the crisis, and the authors find little evidence that foreign
investors helped destabilize prices. Kim and Wei (1999 and 2002) also document strong
herding by foreign investors and off-shore investment funds in Korea during a similar time
period.
3 Data
We use account-level data to investigate herding in financial markets. Our data come from
individual brokerage accounts in the People’s Republic of China (PRC) and are uniquely
suited for the task at hand. The data represent trades placed between May 4, 1999 and
December 4, 2000.
3.1 Brokerage accounts in the PRC
Brokerage accounts in the PRC are both similar to, and different from, what we are used to
in the U.S. A brokerage firm (the firm) has branch offices (branches) throughout the country,
region, or city. Many brokerage firms are regionally focused. Individuals open accounts at
a branch office and then place all of their trades through this one branch. Thus, there is a
critical difference in our study between brokerage firms (our data are from one firm) and
branch offices (our data come from seven different branches.)
A branch office may have a number of ways for investors to place trades: terminals in the
4

branch; cashier windows; telephone service; and computer links. Computer links from private
computers are uncommon at this time, effectively leaving three channels with which to place
a trade. Consider a brokerage firm with five regional branches in the country’s largest cities.
An individual who opens an account at the Beijing branch must place all his or her trades
with the Beijing branch. Even if the individual is visiting Shanghai, he or she may not place
trades at the local Shanghai branch. Instead, he or she must call Beijing to place a trade
(and may only do so if the account has previously been set up to allow phone trades.)
3.2 The brokerage account data
While investors in the PRC have a number of options for placing trades, we focus on trades
that are actually placed at the branch office. We intentionally look at groups of investors
who are physically standing near each other during the trading day and, for the time being,
do not consider trades that are called-in.1 We also limit ourselves to secondary trading of
shares and do not look at trades relating to IPOs, secondary offerings, or warrants. Our data
contain completed trades and not orders that have been submitted and later withdrawn.
Some stocks in the PRC trade infrequently. The highest-volume stock (measured by total
value traded in 1999 and 2000) traded 120.84-times more than the lowest volume stock,
7.96-times more than the one hundredth-ranked stock, and 3.14-times more than the seventh-
ranked stock. The extreme skewness in trading volume can be seen in Appendix 1: a graph
of the distribution of the natural log of trading volume. Since it is infeasible to measure
herding in stocks with low volumes, we choose to look only at trades in active stocks. For
simplicity we limit ourselves to stocks that are listed on the Shenzhen stock exchange and
denominated in local currency (RMB). We initially consider the 100 highest-volume stocks as
measured by total value traded in 1999 and 2000. We also examine the seven highest-volume
stocks.2
Finally, we treat one investor who makes five trades on a given day differently from five
different investors making one trade apiece on the same day. This difference in treatment
seems natural when studying herding. We sort our data to include only unique buy and sell
orders. That is, if an individual investor makes multiple purchases of a stock on a given day,
we count this as one purchase.
1Later in the paper we use the phone trades as a means to re-check our results.2We choose seven stocks so the number of branch offices matches the number of stocks. This makes interpreting
some of our results more straightforward.
5
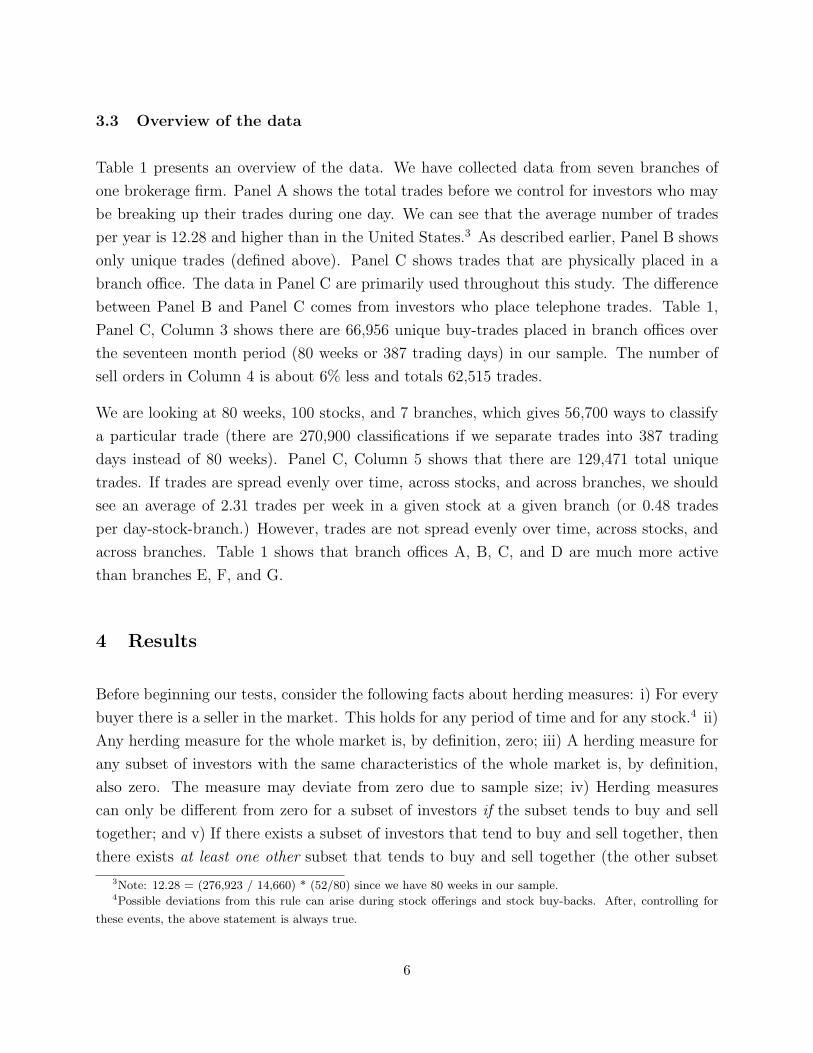
3.3 Overview of the data
Table 1 presents an overview of the data. We have collected data from seven branches of
one brokerage firm. Panel A shows the total trades before we control for investors who may
be breaking up their trades during one day. We can see that the average number of trades
per year is 12.28 and higher than in the United States.3 As described earlier, Panel B shows
only unique trades (defined above). Panel C shows trades that are physically placed in a
branch office. The data in Panel C are primarily used throughout this study. The difference
between Panel B and Panel C comes from investors who place telephone trades. Table 1,
Panel C, Column 3 shows there are 66,956 unique buy-trades placed in branch offices over
the seventeen month period (80 weeks or 387 trading days) in our sample. The number of
sell orders in Column 4 is about 6% less and totals 62,515 trades.
We are looking at 80 weeks, 100 stocks, and 7 branches, which gives 56,700 ways to classify
a particular trade (there are 270,900 classifications if we separate trades into 387 trading
days instead of 80 weeks). Panel C, Column 5 shows that there are 129,471 total unique
trades. If trades are spread evenly over time, across stocks, and across branches, we should
see an average of 2.31 trades per week in a given stock at a given branch (or 0.48 trades
per day-stock-branch.) However, trades are not spread evenly over time, across stocks, and
across branches. Table 1 shows that branch offices A, B, C, and D are much more active
than branches E, F, and G.
4 Results
Before beginning our tests, consider the following facts about herding measures: i) For every
buyer there is a seller in the market. This holds for any period of time and for any stock.4 ii)
Any herding measure for the whole market is, by definition, zero; iii) A herding measure for
any subset of investors with the same characteristics of the whole market is, by definition,
also zero. The measure may deviate from zero due to sample size; iv) Herding measures
can only be different from zero for a subset of investors if the subset tends to buy and sell
together; and v) If there exists a subset of investors that tend to buy and sell together, then
there exists at least one other subset that tends to buy and sell together (the other subset
3Note: 12.28 = (276,923 / 14,660) * (52/80) since we have 80 weeks in our sample.4Possible deviations from this rule can arise during stock offerings and stock buy-backs. After, controlling for
these events, the above statement is always true.
6

can simply be the rest of the market.)
Mutual funds, pension funds, foreigners, and individuals are subsets we might expect to act
homogenously but differently from other subsets in the market.
4.1 A traditional measure of herding
Existing papers on herding test whether one subset of investors tends to buy or sell the
same stock together. The “LSV measure” from Lakonishok, Shleifer, and Vishny (1992) has
become popular in the literature and provides just such a test. We begin by considering the
proportion (Pi,t) of number of buys (Bi,t) to number of total trades (Bi,t + Si,t) for stock “i”
on day “t”:
Pi,t =Bi,t
Bi,t + Si,t
(1)
Pt =1
N
N∑i=1
Pi,t (2)
The LSV measure of herding is defined as follows:
Hi,t =∣∣Pi,t − Pt
∣∣− E∣∣Pi,t − Pt
∣∣ (3)
H =1
NT
N∑i=1
T∑t=1
Hi,t (4)
The second term in (3) is an adjustment factor computed under the null hypothesis of no
herding. It assumes the number of buys follows a binomial distribution. See Wermers (1999)
for further explanation.
Table 2 presents our initial herding results. We group trades by week and stock (and do
not consider branches independently at this time.) In Panel A, the average LSV-measure is
0.0312 at a weekly frequency. Under the null hypothesis that trades are independent across
stocks and time, the result is significant at all conventional levels.5
Table 2, Panel B presents results of studies that also use the same LSV herding measure. The
studies look at trades in the USA and Korea for institutional traders as well as individuals.
Our herding measure of 0.0312 appears to be in-line with these studies.
5We consider trades at both a daily and weekly frequency but this doesn’t change our results materially.
7

4.2 An alternative measure of herding
We propose an alternative measure of herding based on a runs test. There exists some
(possibly very) small time interval such that no two trades are placed at the same time.
Therefore, if investors herd, we would expect to see “abnormally” long runs of buys or sells.
In addition, herding (e.g., long runs) cause the total number of runs per 1,000 trades to be
less than we would expect to see if buys and sells arrive randomly. Essentially, the runs test
transposes our estimation problem from calendar time to trade time.
From Campbell, Lo, and MacKinlay (1997), we can estimate the statistical significance of a
runs test with the following parameters: n = sample size; Nruns = number of runs; and π =
the ratio of buys to total trades.
zstat =Nruns + 1
2− 2nπ (1− π)
2√
nπ (1− π) [1− 3π (1− π)]a
˜N (0, 1)
(5)
To test whether traders in our dataset tend to go on buying and selling sprees, we exploit
the fact that our data has a time-stamp indicating exactly when each trade is placed. We
sort trades by stock ticker, then by date of trade, and finally by time stamp. We re-start
our counter whenever: i) investors switch from buying to selling or vice versa; and ii) we
consider a new stock.
Table 3 presents the results of our runs test using all unique trades that are placed by
investors who are physically in a given brokerage office. Despite having 129,471 unique
trades, we have only 54,890 runs. The number of runs is significantly shorter than expected
(meaning run lengths are longer than expected) and has corresponding -54.2347 z-stat. Note,
investors in our sample buy stocks 51.72% of the time which we can see from Table 1, Panel
C (0.5172 = 66,956/129,471). Further evidence of long runs is seen in Figure 2. We compare
our empirical distribution to the expected distribution when 51.72% of the trades are buys.
Notice the long, right-hand tail.
8

4.3 The propensity for an individual to herd
We have now confirmed that herding is statistically significant in our sample. Also, a popular
measure of herding is similar for our sample and existing studies. We now turn to document
what type of investor (if any) is prone to herding. To do this, we first construct a herding
score for each stock/week combination in our data. The herding score is equal to: i) the
absolute value of the number of buy orders minus the number of sell orders; ii) all divided
by the standard deviation of this measure.
Every time an investor trades, we count the stock/week herding score for the investor’s trade.
The sum of these scores is divided by the number of trades placed to arrive at an individual
investor’s “propensity to herd.” The propensity to herd is then regressed against individual
characteristics in Table 4. One might think that traits such as age, gender, trading frequency,
diversification, or wealth would be correlated to one’s propensity to herd. However, none of
these variables has explanatory power. In fact, only the length of time the account has been
open is statistically significant. This result is counter-intuitive since we would think that
experience would be negatively correlated with herding. Table 4 presents some of the first
results that herd behavior may not be related to the lack of investor sophistcation.
4.4 Shocks that affect total trades (buys+sell)
Our tests above confirm that individual investors in the PRC tend to herd, but the question
remains: what causes this finding? To answer this question, we group investors by the
branch office where they (physically) placed their trades. These groups are isolated both
across a city and across the country. We believe that this experimental design is such that
only publicly available data is observable to isolated groups at the same time. If one group
decides to buy a given stock for reasons other than publicly available information, then we
would not expect to see other isolated groups doing the same. 6
We begin by looking at the total number of trades (volume) as a reference point to understand
herding. We examine the principal component of total trading volume (defined as the number
6For this statement to be false, we would need an odd situation such as two friends. One friend would need to be
standing and shouting into his/her cell phone in office A and the other friend would need to be shouting into his/her
cell phone in office B by cell phone. There is no evidence this happens in the PRC.
9

of buy orders plus the number of sell orders) across stocks.7,8 If there is only one factor that
determines the trading volume of all stocks, then we should see the first principal component
explain 100% of the volume (and the other six principal components will explain 0.00%.) If
there is no common factor, then each of the seven factors should explain (17) or 14.2857%
of the variance. By construction, n-principal components explain 100% of the variance of
n-time series.
HA : if there is no common component in the total number of trades across
k-stocks, then the first principal component will explain(
1k
)of the total variance,
the first two principal components will explain(
2k
)of the variance in total, and
so on.
Table 5a, Panel A shows that the first principal component of total trades (buys+sells)
explains 51.71% of the variance of stocks in our sample. We then look at the trading
of stocks within each of the branch offices. Table 5a, Panel B shows that the average
pairwise correlation of total trades between stocks within a given branch is 26.07% and
highly significant. We use Monte Carlo methods and draw from the empirical distributions
to construct standard errors. This allows us to take into account the fact that stocks and
branches trade at different frequencies. Both of the measures in Table 5a show that the
whole stock market in the PRC experiences common shocks. These shocks affect the trading
volume of all stocks, regardless of which stocks we look at.
More interestingly, Table 5b looks at the total number of trades of a single stock in each of
the seven branches in our sample. In this way, we can measure a location-based common
component to total trades (e.g., across the isolated groups of investors.)
HB : if there is no common component of total trades for a single stock that is
7Since we have seven branch offices in our sample, we choose to consider only seven stocks. Having the same
number of stocks and branches helps us to compare the relative importance of a principal component across stocks
vs. a principal component across branches. We choose the seven highest-volume stocks from our sample of the 100
high-volume stocks. When feasible, we perform tests with both the 100-stock sample and the 7-stock sample.8It is important to note that we look at the principal component of normalized variables. This avoids problems
that might arise when different time series have very different variances (high volume stocks vs. medium volume
stocks.) In these cases, the first principal component will explain the variance of the highest-variance time series
rather than explain a common component across time series. Analysis of normalized variance is similar to looking at
the correlation matrix rather than the covariance matrix.
10

trading in n-different locations, then the first principal component across branches
will explain(
1n
)of the total variance, the first two principal components will
explain(
2n
)of the variance in total, and so on.
In Table 5b, Panel C, we see (on average) the first principal component (across branches)
explains 56.74% of the variance of the total trades in a single stock. The first two principal
components explain 73.75% of the variance. In addition, when we aggregate trades by stock
(across branches), the first principal component explains 73.66% of the variance of total
volume. Another look at the same phenomenon shows that the average pairwise correlation
for a given stock between branches is 46.17% and very significant. When we compare results
in Table 5b to results in Table 5a, we see individual stocks experience shocks. The shocks
affect trading volume of this one stock regardless of where investors are placing their trades.
In summary, Table 5a shows there are cross-stock shocks. Table 5b shows that stock-specific
shocks contain additional power (over the market-wide effects) to explain trading volume.
4.5 shocks that affect net trades (buys-sell) or herding
Rather than look at total trades, we now turn to look at net trades (also known as, “trade
imbalances” and defined as the number of buys minus the number of sells).
HC : if there is no common component in the net number of trades across
k-stocks, then the first principal component will explain(
1k
)of the total variance,
the first two principal components will explain(
2k
)of the variance in total, and
so on.
Table 6a, Panel A shows that net trade imbalances (defined as the number of buy orders
minus the number of sell orders) do not have a strong principal component across stocks.
A second measure is the average pairwise correlation of net trades between stocks within
a given branch. Table 6a, Panel B shows the correlation estimate is insignificant. We can
interpret this results as indicating that investors in our sample do not appear (in aggregate)
to sell one stock in order to raise funds to by another.
The final, and most important test, involves looking at the net trades in a single stock across
branches (i.e., across the isolated groups of investors in our sample.)
11

HD : if the decision to buy or sell a given stock is not related to market-wide
shocks, then the correlation of net trades will be zero across n-isolated groups of
investors. In other words, the first principal component across n-branches will
explain(
1n
)of the total variance, the first two principal components will explain(
2n
)of the variance in total, and so on.
When we look at a single stock, the principal components in Table 6b, Panel A appear to
have some explanatory power. On average, the first principal component explains 27.57% of
the variance of net trades (on average). When we aggregate by all stocks, the first principal
component explains 28.64% of the variance of net trades while the first two components
explain 51.69% of total volume. Likewise, the average pairwise correlation coefficient is
7.08% which is significant at the 0.0018 level.
To summarize the results up to this point, isolated groups of investors have significantly
correlated trading behavior. That is, these groups tend to buy at the same time and sell at
the same time, even though the groups of investors are separated by miles and miles. Thus,
we are able to rule out any hypothesis that relates herd behavior to group-psychology effects.
The theory that a group of investors can work itself into a panic is simply not supported by
this study.
4.6 Regional trading correlation
Tables 5b and 6b have another interesting feature. Panel C of both tables shows circum-
stantial evidence that total trades and net trades are mainly affected by two principal com-
ponents. A second check and a phone call to the PRC turned up the interesting fact that
the branches in our sample are from one of two regions. Branches offices A, B, C, and D
are located in Guangdong province while branches E, F, and G are located in the Shanghai
municipality. Inhabitants in the first region typically speak Cantonese and Mandarin while
inhabitants in the second region typically speak Shanghaiese and Mandarin.
HE : if information flows do not have a regional / language component, then
the correlation of net trades should the same between: i) two branch offices in the
same region; and ii) two branch offices in different regions.
12

Table 7 rejects HF . Panel B, in particular, shows that investors in the Guangdong province
tend to buy and sell at the same time (ρ = 0.1778). Investors in the Shanghai municipal-
ity tend to buy and sell together(ρ = 0.1171). But there is little correlation between the
buying/selling in Guangdong and buying/selling in Shanghai (ρ = −0.0062).
The results in Table 7, Panel B are quite stunning. Investors in four isolated branches in
Guangdong province engage in highly correlated investment decisions. We strongly reject
the null hypothesis that herd behavior is a small sample bias. We also strongly reject the
null hypothesis that herd behavior is caused by group-panics or group-psychology. Instead,
there is now evidence to support the theory that informational shocks hit all investors si-
multaneously. The arrival of new information induces investors to buy or sell (volume is
highly correlated.) However, the decision of whether to buy or sell depends on which region
/ language group the investor is in.
4.7 Herding and asset prices
Our final series of tests relates the existence of herding with asset prices. Again, we use
trading volume as a benchmark. In Table 8, Panel A we regress the absolute of returns (for
a given stock over a week) on the total number of trades. We use Newey-West standard
errors with four lags and find the coefficient on volume is extremely significant. To control
for heteroscedascity, we run regressions with normalized variables (1a and 1b) and non-
normalized variables (1c and 1d). We also consider trades placed by telephone as a double-
check. All results are qualitatively the same.
Table 8, Panel B presents more surprising results. When we regress returns (not absolute
values) on net trades of individual investors in our sample, we see a significantly negative
coefficient. Herding by investors in our sample is negatively correlated with contemporaneous
stock returns. Again we run regressions with standardized and non-standardized variables.
We also use telephone trades as a control group.
This is the final piece of evidence that individual investors are not prone to manic buying
sprees that send prices soaring wildly. Instead, all the evidence in this paper is consistent
with individual investors providing liquidity to another subset of investors. It is the other
subset of investors that has a positive correlation between buys and stock returns.
13

5 Robustness checks
Alternative LSV measures: The LSV measures presented in Table 2 are for the 100 high-
volume stocks and did not consider branches independently. We calculate the LSV measure
for Branch A only and find little difference in the measure: H=0.0282 (z-stat=13.43). We
also calculate the measure for the sub-sample of seven high-volume stocks only. Again the
measure does not change much: H=0.0239 (z-stat=5.43) when considering trading at all
branches.
Telephone trades as a control group: In Table 8, we use trades placed by telephone
as a control group. Coefficients from regressions that use data from these two groups are
not very different. This may not be surprising since investors from branch A who use the
telephone live near investors who go to the branch office. If common information shocks are
generating trading volume then we would not expect to see much difference between these
two types of investors.
Table 9 repeats the runs test with different samples of stocks and different groups of investors.
Again, there are few discernable differences.
Table 10 shows that correlation within a regional / language group is higher when considering
telephone trades than physically-placed trades.
6 Conclusion
This paper provides an in-depth look at investor behavior. We document some rather
straightforward (but new) items. A traditional herding measure of PRC trade data is sim-
ilar to existing studies. A runs test can be used to estimate the degree of herding within a
well-defined group of investors. And, the propensity of an individual to herd is found to be
correlated only with experience. Surprisingly, this correlation is positive.
On a more interesting level, we provide a number of tests that reject psychological theories
of herding. We do this through experimental design. That is, we isolate groups of investors
who are physically in the same room at the time they place trades. We document that large
trade imbalances do exist. However, even though we are set to see correlated buying behavior
within a group, we fail to detect it. Instead, we see that separate and isolated groups of
investors tend to buy and sell a given stock simultaneously. The correlation of such behavior
14

is statistically significant, especially when we control for regional / language effects.
Finally, individual investors are most likely to herd and buy when prices fall. The existence
of herd buying is not correlated to prices spiking upward. It is reasonable to conclude that
individual investors provide liquidity to the market. A number of new research topics that
are waiting to be explored. In particular, future research needs to identify what group of
investors has trades that are negatively correlated with individuals. Presumably, such a
group consists of institutions, but this question can only be answered after considerable
research effort.
15

References
[1] Banerjee, Abhijit, 1992, A Simple Model of Herd Behavior, Quarterly Journal of Eco-
nomics 107, 3, 797-817.
[2] Barber, Brad M. and Terrance Odean, 1999, The Courage of Misguided Convic-
tions: The Trading Behavior of Individual Investors, Financial Analyst Journal Novem-
ber/December, 41-55.
[3] Barber, Brad M. and Terrance Odean, 2000, Trading is Hazardous to Your Wealth: The
Common Stock Investment Performance of Individual Investors, Journal of Finance LV,
2, April, 773-806.
[4] Bikhchandani, Sushil, David Hirshleifer, and Ivo Welch, 1992, A Theory of Fads, Fash-
ion, Custom, and Cultural Change as Information Cascades, Journal of Political Econ-
omy, 100, 5, October 992-1026.
[5] Bikhchandani, Sushil and Sunil Sharma, 2000, Herd Behavior in Financial Markets: A
Review, IMF Working Paper, March.
[6] Choe, Hyuk, Bong-Chan Kho, and Rene M. Stulz, 1999, Do Foreign Investors Destabilize
Stock Markets? The Korean Experience in 1997, Journal of Financial Economics, 54,
227-264.
[7] Daniel, Kent, Mark Grinblatt, Sheridan Titman, and Russ Wermers, 1997, Measuring
Mutual Fund Performance with Characteristic-Based Benchmarks, Journal of Finance,
LII, 3, July 1035-1058.
[8] Froot, Kenneth A., David S. Scharfstein, and Jeremy C. Stein, 1992, Herd on the
Street: Informational Inefficiencies in a Market with Short-Term Speculation, Journal
of Finance, XLVII, 4, September 1461-1484.
[9] Griffin, John M., Jeffrey Harris, and Selim Topaloglu, 2001, When Do Institutions and
Individuals Buy and Sell? Evidence from the Nasdaq Shakeout, Working Paper, Arizona
State University.
[10] Grinblatt, Mark and Matti Keloharju, 2000, The Investment Behavior and Performance
of Various Investor Types: A Study of Finland’s Unique Data Set, Journal of Financial
Economics, 25, 43-67.
16

[11] Grinblatt, Mark, Sheridan Titman, and Russ Wermers, 1995, Momentum Investment
Strategies, Portfolio Performance, and Herding: A Study of Mutual Fund Behavior,
American Economic Review, December 1088-1105.
[12] Hasbrouck, Joel and Duane J. Seppi, 2001, Common Factors in Prices, Order Flows,
and Liquidity, Journal of Financial Economics, 59, 383-411.
[13] Hirshleifer, David and Siew Hong Teoh, 2001, Herd Behavior and Cascading in Capital
Markets: A Review and Synthesis, Working Paper, Ohio State University.
[14] Lakonishok, Josef, Andrei Shleifer, and Robert W. Vishny, 1992, The Impact of Insti-
tutional Trading on Stock Prices, Journal of Financial Economics, 32, 23-43.
[15] Kim, Woochan and Shan-Jin Wei, 1999, Offshore Investment Funds: Monsters in Emerg-
ing Markets?, Working Paper, Harvard University.
[16] Kim, Woochan and Shan-Jin Wei, 2002, Foreign Portfolio Investors Before and During
a Crisis, Journal of International Economics, 56, 77-96.
[17] Nofsinger, John R. and Richard W. Sias, 1999, Herding and Feedback Trading by In-
stitutional and Individual Investors, Journal of Finance, LIV, 6, December 2263-2295.
[18] Wermers, Russ, 1999, Mutual Fund Herding and the Impact on Stock Prices, Journal
of Finance, LIV, 2, April 581-622.
17

Figure 1 Layout of a Typical Branch Office
This presents a schematic drawing of a typical brokerage office. Stock prices are shown on a large, electronic board that covers a good portion of one side of the room. Individual investors can place trades in one of two ways. Some investors place trades through terminals that are located around the edge of the branch office. Sophisticated offices allow investors to “log in” by simply swiping a magnetic-strip card. Investors then enter electronic limit orders. A computer blocks any buy order for which the investor doesn’t have sufficient credit or any sell order when the investor does not own the shares. Some margin buying is possible. Other investors place trades at a cashier window after they fill out an order firm. The cashier then enters the buy or sell order into a computer. Again, the computer blocks non-conforming attempts to trade.
large digitalstock display
chairs for investors
cashier windows
terminals back office
rooms
front doors
back office rooms
back officerooms

Table 1 Overview of Data
This table presents overview statistics for the data used in this study. Data represent stock (equity) trades placed by individual investors in the People’s Republic of China between May 4, 1999 and December 4, 2000. Trades, or orders, are placed at one of seven brokerage offices which are responsible for maintaining the investors’ account data. We concentrate on a sample of buys and sells of 100 high-volume stocks that are listed on the Shenzhen Stock Exchange. Panel A shows the total number of trades placed in a particular brokerage office during our sample period. We take into account that some individual investors may “break-up” their trades throughout a day. Panel B considers a “unique trade” to be: i) one or multiple trades in the same stock; ii) by a single investor; iii) on the same day. Panel C considers only trades placed by investors who are physically standing in a particular branch office at the time the trade is placed.
Panel A: Total Trades in Dataset Branch # of # of Buy # of Sell Buy+Sell Office Accts Orders Orders Orders A. 1,939 24,092 21,296 45,388 B. 2,685 22,882 22,074 44,956 C. 2,707 31,657 29,448 61,105 D. 2,997 23,140 20,894 44,034 E. 1,450 14,288 11,216 25,504 F. 1,580 10,924 8,568 19,492 G. 1,302 19,829 16,615 36,444 total 14,660 146,812 130,111 276,923
Panel B: Unique Trades in Dataset Branch # of # of Buy # of Sell Buy+Sell Office Accts Orders Orders Orders A. 1,939 16,096 14,719 30,815 B. 2,685 15,937 15,455 31,392 C. 2,707 18,700 18,615 37,315 D. 2,997 19,488 18,447 37,935 E. 1,450 8,638 7,447 16,085 F. 1,580 7,438 6,458 13,896 G. 1,302 9,187 8,582 17,769 total 14,660 95,484 89,723 185,207
Panel C: Unique Trades That Were Physically Placed in a Branch Office Branch # of # of Buy # of Sell Buy+Sell Office Accts Orders Orders Orders A. 1,423 11,046 10,059 21,105 B. 1,855 9,845 9,559 19,404 C. 1,864 12,810 12,614 25,424 D. 2,210 12,694 11,814 24,508 E. 1,046 6,728 5,772 12,500 F. 1,284 6,527 5,712 12,239 G. 972 7,306 6,985 14,291 total 10,654 66,956 62,515 129,471

Table 2 Initial Herding Results Using the LSV Measure
This table presents an average herding measure (“H”) based on Lakonishok, Shleifer, & Vishny (1992) and defined below. Panel A presents results based on our sample of data: stock (equity) trades are placed by individual investors in the People’s Republic of China between May 4, 1999 and December 4, 2000. This time period represents 387 trading days or 80 weeks. We concentrate on a sample of trades of 100 high-volume stocks that are listed on the Shenzhen Stock Exchange. Panel B presents results from other academic studies that use the same LSV herding measure.
∑=
=
+=
N
1it,iN
1t
t,it,i
t,it,i
PP
SBB
P
∑∑= =
=
−−−=N
1i
T
1tt,iNT
1
tt,itt,it,i
HH
PPEPPH
Panel A: Herding Measure for China
Daily Weekly
Mean 0.0271 0.0312 z-stat (30.11) (22.29) Median 0.0044 0.0141
Panel B: Herding Measures in Comparable Studies LSV Study Country Sample Freq. Measure
a) Grinblatt et al (1995) USA Mutual Funds Quarterly 0.0250 b) LSV (1992) USA Pension Funds Quarterly 0.0270 c) Wermers (1999) USA Mutual Funds Quarterly 0.0340 d) Choe et. al. (1999) Korea Foreigners Daily 0.0365 e) Kim & Wei (2002) Korea Foreign Inst. Monthly 0.0434 f) Kim & Wei (2002) Korea Foreign Indiv. Monthly 0.1117 g) Choe et. al. (1999) Korea Foreigners Daily 0.2124
Panel B notes: a) all funds, all quarters, from Table 4; b) all cases, from Table 2; c) all funds, 1975-1994, five or more trades, from Table II; d) represents a lower-bound estimate from this study, average of all measures before crisis and during crisis, from Table 4; e) non-resident institutions, average of tranquil period, pre-crisis period, and in-crisis period, from Table 5; f) non-resident individuals, average of tranquil period, pre-crisis period, and in-crisis period, from Table 5; g) represents an upper-bound estimate from this study, average of all measures before crisis and during crisis, from Table 3;

Table 3 Herding Results Using a Runs Test
This table presents the results of a runs test. Stock trades (either buys or sells) are placed by individual investors in the People’s Republic of China between May 4, 1999 and December 4, 2000. This time period represents 387 trading days or 80 weeks. We concentrate on a sample of trades of 100 high-volume stocks that are listed on the Shenzhen Stock Exchange. If our sample has abnormally long runs, then the total number of runs will be low and the Z-stat will be significantly negative. If our sample consists of buy trades that are immediately followed by sell trades, then the total number of runs will by high and the Z-stat will be significantly negative.
( )
( ) ( )[ ] )1,0(~13112
1221
Nn
nNz
aruns
ππππ
ππ
−−−
−−+=
n Nruns π = p(Buy) z-stat
129,471 54,890 0.5172 -54.2347
Figure 2 This figure presents the distribution of run lengths (either buy or sell trades.) Stock (equity) trades are placed by individual investors in the People’s Republic of China between May 4, 1999 and December 4, 2000. This time period represents 387 trading days or 80 weeks. We concentrate on a sample of trades of 100 high-volume stocks that are listed on the Shenzhen Stock Exchange. Our data show a greater preponderance of long runs than one might expect given the number of buys in and sells in our data set.
0.0%
10.0%
20.0%
30.0%
40.0%
50.0%
60.0%
70.0%
80.0%
90.0%
100.0%
0 1 2 3 4 5 6 7 8 9 10 11 12 13 14 15 16 17 18 19 20
Length of Run
CDF
Hypothetical
Our Data

Table 4 Propensity to Herd and Investor Characteristics
(Initial Results Only) This table investigates whether certain types of investors are more likely to herd than others. Data come from the People’s Republic of China between May 4, 1999 and December 4, 2000. This time period represents 387 trading days or 80 weeks. This table concentrate only on the trades from one branch office (A) for one stock (#000001) that is listed on the Shenzhen Stock Exchange. We first construct a variable that measures whether an investor is more likely to trade during weeks with high net trade imbalances (i.e., herding periods.) Details about the measure are given in the text. We regress our measure on various investor traits. The table shows coefficient estimates and t-stats based on White standard errors.
Dependent Variable: Individual’s Propensity to Herd
(1) (2) (3) (4) (5) (6) (7) Age 0.0017 0.0010 t-stat (1.30) (0.66) Gender (1=Male) 0.0424 0.0417 t-stat (1.25) (1.22) Time Acct. Open 0.0035 0.0033 t-stat (3.59) (3.35) Transactions per Month -0.0001 -0.0002 t-stat (-0.16) (-0.25) # of Stocks Held in Port 0.0013 0.0019 t-stat (0.42) (0.50) Acct. Balance (RMB) -0.0000 -0.0000 t-stat (-0.77) (-0.47) Constant Y Y Y Y Y Y Y

Table 5a Shocks that Affect Total Trades (Buys + Sells)
The table examines total trading activity where total trades is defined as the number of unique buy orders that are physically placed in a branch office plus the number of unique sell orders. Panel A shows results from a principal component analysis where we have normalized total trades for each stock or branch by its standard deviation. Panel B shows the average pairwise correlation coefficient of total trades between stocks within a given brokerage office. Panels A & B are different ways to understand that the stock market experiences common shocks. These shocks affect the trading volume of all stocks, regardless of which stocks we look at.
Panel A: Principal Component for Total Trades (Buys+Sells) per Week Measured Across All Stocks
1st comp 2nd comp 3rd comp % of variance explained 51.7077 14.4179 12.0200
Panel B: Average Pairwise Correlation of Total Trades ( Buys + Sells ) Measured Between Stocks Within a Given Branch
average pairwise correlation 0.2607 z-stat (10.61)

Table 5b Shocks that Affect Total Trades (Buys + Sells)
The table examines total trading activity where total trades is defined as the number of unique buy orders that are physically placed in a branch office plus the number of unique sell orders. Panel C shows results from a principal component analysis where we have normalized total trades for each stock or branch by its standard deviation. Panel D shows the average pairwise correlation coefficient of total trades between stocks within a given brokerage office. Panels C & D are different ways to understand that a stock experiences common shocks. These shocks affect the trading volume of this one stock, regardless of where investors are placing their trades.
Panel C: Principal Component for Total Trades (Buys+Sells) per Week Measured for a Given Stock Between Branches
1st comp 2nd comp 3rd comp % of variance explained 56.7414 16.0125 10.4639 (average per stock) % of variance explained 73.6592 11.7651 6.2663 (for all stocks)
Panel D: Average Pairwise Correlation of Total Trades ( Buys + Sells ) Measured for a Given Stock Between Branches
average pairwise correlation 0.4717 z-stat (19.44)

Table 6a Shocks that Affect Net Trades (Buys - Sells)
The table examines net trading activity where net trades is defined as the number of unique buy orders that are physically placed in a branch office minus the number of unique sell orders. Panel A shows results from a principal component analysis where we have normalized net trades for each stock or branch by its standard deviation. Panel B shows the average pairwise correlation coefficient of net trades between stocks within a given brokerage office. Panels A & B are different ways to understand that the stock market does not experience common shocks to net trades. We can interpret this result as indicating that investors in our sample do not appear (in aggregate) to sell one stock in order to raise funds to buy another stock.
Panel A: Principal Component for Net Trades (Buys-Sells) per Week Measured Across All Stocks
1st comp 2nd comp 3rd comp % of variance explained 21.2358 17.1945 16.3576
Panel B: Average Pairwise Correlation of Net Trades (Buys-Sells) Measured Between Stocks Within a Given Branch
average pairwise correlation 0.0065 z-stat (0.28)

Table 6b Shocks that Affect Net Trades (Buys - Sells)
The table examines net trading activity where net trades is defined as the number of unique buy orders that are physically placed in a branch office minus the number of unique sell orders. Panel A shows results from a principal component analysis where we have normalized net trades for each stock or branch by its standard deviation. Panel B shows the average pairwise correlation coefficient of net trades between stocks within a given brokerage office. Panels C & D are different ways to understand that a given stock experiences common buying or selling shocks. That is, the decision to buy or sell a given stock is significantly correlated across isolated groups of individual investors.
Panel C: Principal Component for Net Trades (Buys-Sells) per Week Measured for a Given Stock Between Branches
1st comp 2nd comp 3rd comp % of variance explained 27.5712 19.3641 15.7106 (average per stock) % of variance explained 28.6389 23.0486 12.5854 (for all stocks)
Panel D: Average Pairwise Correlation of Net Trades (Buys-Sells) Measured for a Given Stock Between Branches
average pairwise correlation 0.0708 z-stat (2.92)

Table 7 Regional Trading Correlation
This table presents overview statistics of cross-office trading activity. Data represent stock (equity) trades placed by individual investors in the People’s Republic of China between May 4, 1999 and December 4, 2000. This time period represents 387 trading days. Trades are placed at one of seven brokerage offices and the office is responsible for maintaining the investors’ account data. We concentrate on a sample of buys or sells of 100 high-volume stocks that are listed on the Shenzhen Stock Exchange. Panel A shows the average pair-wise correlation of total trades. Panel B shows the average pair-wise correlation of the net trades. For net trades, especially, the decision to buy or sell is more correlated within a regional / language group than across such groups.
Panel A: Average Correlation of Total Trades (Buys+Sells) By Stock; Across Branches Deviation from Average
Guangdong Shanghai Guangdong Shanghai
Guangdong 0.5695 Guangdong +0.0978
Shanghai 0.4111 0.4705 Shanghai -0.0605 -0.0011
note: average correlation for all branches = 0.4717 (from Table 5b)
Panel B: Average Correlation of Net Trades (Buys-Sells) By Stock; Across Branches Deviation from Average
Guangdong Shanghai Guangdong Shanghai
Guangdong 0.1778 Guangdong +0.1070
Shanghai -0.0062 0.1171 Shanghai -0.0770 +0.0463
note: average correlation for all branches = 0.0708 (from Table 6b)

Table 8 Herding and Stock Returns
This table presents regression results of returns on trading activity in our sample. Data represent stock (equity) trades placed by individual investors in the People’s Republic of China between May 4, 1999 and December 4, 2000. This time period represents 387 trading days. Trades are placed at one of seven brokerage offices and the office is responsible for maintaining the investors’ account data. We concentrate on a sample of buys or sells of 7 high-volume stocks that are listed on the Shenzhen Stock Exchange.
Panel A: Regressions of Absolute Value of Returns on Total Number of Trades (1a) (2a) (3a) (4a) Dependent Var | ri,t | / σi | ri,t | / σi | ri,t | | ri,t | Stk dummies Yes Yes Yes Yes In Branch / Tel In Branch Telephone In Branch Telephone Indep. Var Toti,t / σTot,i Toti,t / σTot,i Toti,t Toti,t β-hat 0.2939 0.2415 0.0022 0.0035 Std Err NW 4 lags NW 4 lags NW 4 lags NW 4 lags T-stat 5.59 3.89 3.33 3.33
Panel B: Regressions of Returns on Net Number of Trades (1b) (2b) (3b) (4b) Dependent Var ri,t / σi ri,t / σi ri,t ri,t Stk dummies Yes Yes Yes Yes In Branch / Tel In Branch Telephone In Branch Telephone Indep. Var Neti,t / σNet,i Neti,t / σNet,i Neti,t Neti,t β-hat -0.1773 -0.1997 -0.0040 -0.0070 Std Err NW 4 lags NW 4 lags NW 4 lags NW 4 lags T-stat -2.82 -4.29 -3.53 -4.84

Table 9 In-branch vs. Telephone Runs Tests
This table presents a runs test of either buy or sell trades. Stock (equity) trades are placed by individual investors in the People’s Republic of China between May 4, 1999 and December 4, 2000. This time period represents 387 trading days or 80 weeks. We concentrate on a sample of trades of 100 high-volume stocks that are listed on the Shenzhen Stock Exchange and a sub-sample of the seven highest-volume stocks. We also consider trades placed by investors who physically trade from a given branch office and those who use a telephone to place their trades.
# of In-branch Stocks or Telephone n Nruns π = p(Buy) z-stat
100 In-branch 129,471 54,890 0.5172 -54.2347 100 Telephone 55,736 24,878 0.5118 -25.1791 7 In-branch 18,065 7,617 0.5126 -20.9570 7 Telephone 8,610 3,640 0.5031 -14.3184
Table 10
Regional / Language Correlation of Telephone Trades By Stock; Across Branches Deviation from Average
Guangdong Shanghai Guangdong Shanghai
Guangdong 0.3012 Guangdong +0.1884
Shanghai 0.0143 0.0824 Shanghai -0.0985 -0.0304
note: average correlation for all branches = 0.1128 (not reported previously)

Appendix 1 Trading Volume in the PRC
The figure graphs the distribution of the natural log of trading volume. Trading volume is defined as the total value of stock traded (in RMB) over the two-year period 1999-2000. The data come from the Shenzhen stock exchange and represent the aggregate trading volume across all stocks.
Distribution of the Natural Log of Trading Volume in RMB on
Shenzhen Stock Exchange, 1999-2000
0.00
0.10
0.20
0.30
0.40
0.50
0.60
0.70
0.80
0.90
1.00
20.0 21.0 22.0 23.0 24.0 25.0 26.0
ln ( Total Volume 1999-2000 in RMB )
Dis
trib
utio
n ( C
DF
)
Volume per stock(RMB)
Log NormalDistribution