here - csg justice center
TRANSCRIPT

Sentencing and Justice Reinvestment Initiative ������Michigan Law Revision Commission���September 24, 2013 ������Carl Reynolds, Senior Legal & Policy Advisor���Andy Barbee, Research Manager���Ellen Whelan-Wuest, Policy Analyst���Shane Correia, Program Associate���

Overview of Presenta/on
Council of State Governments Jus/ce Center 2
Stakeholder Perspec0ves
Reducing Criminal Behavior
Sentencing Analyses

Council of State Governments Jus/ce Center 3
Stakeholder Perspec0ves
Reducing Criminal Behavior
Sentencing Analyses

Stakeholder Engagement Has Been Substan/al and Rewarding
Council of State Governments Jus/ce Center 4
Correc0ons Administrators Law
Enforcement
Local Government Officials
Behavioral Health Treatment Providers
Judges
Proba0on & Parole Officers
Defense AIorneys
Community Correc0ons
Vic0m Advocates
Prosecutors
Parole Board
Business Leaders
Faith Based / Community Leaders
Advocacy Groups
MLRC
7 visits to Michigan
5 ci/es
50+ mee/ngs
40+ conference
calls
so far…

Divergent Views of Michigan’s Longer Lengths of Stay
Council of State Governments Jus/ce Center 5
Prosecutors see longer lengths of stay as the natural effect of a serious crime problem -‐ a hardening popula/on -‐ and of the difficulty of gePng to a prison sentence under the sentencing guidelines.
Defenders see an accumula/on of increased penal/es in amendments to the guidelines, increased maximums, harsh mandatory minimum terms, increased authority for consecu/ve sentencing, wide discre/on for habitual and repeat drug offenders, and tough parole prac/ces and policies.

Divergent Views of the “Short Sentence” Problem
Council of State Governments Jus/ce Center 6
2012 Felony
Sentences
50,638
q 21% Prison
q 20% Jail
q 35% Jail + Proba/on
q 23% Proba/on
76% of Sentences Involved Incarcera/on
q 1% Other
Coun/es feel burdened by exis/ng sentences to jail and fear the “shi] and sha]” where the guidelines are concerned.
DOC feels ineffec/ve when short sentences defeat their ability to provide appropriate programming sufficiently before ERD.

Survey of Prosecutors Informs the Ques/on of “Workability”
Council of State Governments Jus/ce Center 7

Divergent Views on Dispari/es in Sentencing and Charging
Council of State Governments Jus/ce Center 8
Proba/on Agents view PSIs as bench-‐driven, so prac/ces differ from place to place.
Prosecutors and judges view sentencing recommenda/ons in PSIs as driven by DOC policy.
Prosecutors perceive sentencing dispari/es and primarily abribute them to judicial philosophy.
Defenders perceive disparity in prosecutor charging prac/ces.
Rule 6.425 Sentencing; Appointment of Appellate Counsel
(A) Presentence Report; Contents.
(1) Prior to sentencing, the probation officer must investigate the defendant’s
background and character, . . .

Legal Financial Obliga/ons Are a Recurring Theme
Council of State Governments Jus/ce Center 9
Different perspec/ves: • Reentry & Offender Impact • Child Support Enforcement • Court System Collec/ons • Crime Vic/m Compensa/on • Crime Vic/m Res/tu/on
Issues Emerging in Michigan: • Vic/ms: Courts not priori/zing
res/tu/on • Defenders & Advocates: Courts
using ‘pay or stay’ sentencing
Consensus? Many Stakeholders suggest Driver Responsibility Fees are excessive
Council of State Governments Jus/ce Center 10
Stakeholder Perspec/ves
Reducing Criminal Behavior
Sentencing Analyses

Knowledge on Improving Criminal Jus/ce Outcomes Has Increased Drama/cally Over the Last 20 Years
Council of State Governments Jus/ce Center 11
Academics and prac//oners have contributed to this growing body of research

Responsivity
Risk
Need
Deliver programs the same way to every
offender
Deliver programs based on offender learning style, mo0va0on,
and/or circumstances
Reducing Criminal Behavior Requires Focusing on Risk, Need, and Responsivity
Council of State Governments Jus/ce Center 12
Supervise everyone the same way
Assess risk of recidivism and focus supervision on the highest-‐risk
offenders
Assign programs that feel or seem effec/ve
Priori0ze programs addressing the needs most associated with
recidivism
Evidence-‐Based Prac0ces Tradi/onal Approach

Iden/fy and Focus on Higher-‐Risk Offenders
Council of State Governments Jus/ce Center 13
Who?
LOW 10%
re-‐arrested
MODERATE 35%
re-‐arrested
HIGH 70%
re-‐arrested
Risk of Re-offending
Without Risk Assessment… With Risk Assessment…

Target the Factors that Evidence Shows Are Most Central to Criminal Behavior
Council of State Governments Jus/ce Center 14
Criminal Behavior
Leisure
Family
Employment/ Educa/on
Substance Use
Thinking
Peers
Personality
Past Criminality*
An0social The Big Four
(impac/ng these are the major drivers to reducing
criminal behavior)
Higher-‐risk offenders are likely to have more of the Big Four.
Programs targe/ng these needs can significantly lower
recidivism rates
* Past criminality cannot be changed.
Housing
What?

A]er GePng the Who and the What, Supervision and Programming Should Be Well Targeted
Council of State Governments Jus/ce Center 15
Low Supervision/
Program Intensity
Moderate Supervision/
Program Intensity
High Supervision/
Program Intensity
LOW 10% re-‐arrested
MODERATE 35% re-‐arrested
HIGH 70% re-‐arrested
Risk of Re-offending

Ensure Programs Are High Quality and Properly Implemented
Council of State Governments Jus/ce Center 16
Program Effec0veness (reduced recidivism)
Is the program based on principles demonstrated to be effec/ve?
Are program staff properly trained?
Is program matched with appropriate client popula/on?
Is program implemented as designed?
Is performance tracked and measured against expecta/ons?
How Well?

Elements of Effec/ve Supervision
Use a graduated range of sanc/ons and incen/ves to guide specific type of response to viola/ons and compliance.
Enable officers to respond meaningfully to viola/ons without delay or /me-‐consuming processes.
Priori/ze the most expensive, restric/ve sanc/ons for offenders commiPng the most serious viola/ons.
Focus supervision officer /me and program resources on the highest-‐risk offenders. Dosage/Intensity
Consistency
Swi]ness
Cost-‐effec/veness
Council of State Governments Jus/ce Center 17

Where and How Treatment Is Delivered Impacts the Degree of Recidivism Reduc/on
Council of State Governments Jus/ce Center 18
Source: Lee, S., Aos, S., Drake, E., Pennucci, A., Miller, M., & Anderson, L. (2012). Return on investment: Evidence-‐based op/ons to improve statewide outcomes, April 2012 (Document No. 12-‐04-‐1201). Olympia: Washington State Ins/tute for Public Policy.
Impact of Treatment Interven0on on Recidivism Rates
Supervision, with effec/ve “RNR” principles, yields the biggest recidivism reduc/on
Source: Latessa, Lovins, and Smith, “ Follow-‐up Evalua/on of Ohio’s Community Based Correc/onal Facili/es, Outcome Study, February 2010
-‐24% -‐30%
-‐17%
Supervision with Risk Need + Responsivity
Drug Treatment in the
Community
Drug Treatment in Prison

Council of State Governments Jus/ce Center 19
Stakeholder Perspec/ves
Reducing Criminal Behavior
Sentencing Analyses

q Public Safety
q Propor/onality
q Certainty
q Predictability
q Workability
Addressing Risk of Recidivism and Severity of Offense Are Cri/cal Components of Effec/ve Sentencing (and Parole)
Council of State Governments Jus/ce Center 20
These features are central to the idea of all guidelines using severity and risk.
Also fit within risk/severity framework
Risk of Reoffending
Offense Severity
High
High Low
Low
Low Severity Low Risk
High Severity High Risk
Low Severity High Risk
High Severity Low Risk

Council of State Governments Jus/ce Center 21
Michigan Sentencing Guidelines Abempt to Classify by Offense Severity and Risk of Recidivism
Source: Sentencing Guidelines Manual, Michigan Judicial Ins/tute, June 2012.
For all grids, defendants are:
v Moved along a ‘le] to right’ scale based on prior criminal ac/vity, AND
v Moved along a ‘top to bobom’ scale based on aggrava/ng factors.
The intersec3on of the horizontal and ver3cal scores indicates a cell-‐type into which the defendant falls for sentencing. There are 3 cell-‐types (Intermediate, Straddle, and Prison).
Risk of Reoffending
Offense Severity
High
High Low
Low
Low Severity Low Risk
High Severity High Risk
Low Severity High Risk
High Severity Low Risk

Sentencing Begins with Crime
Council of State Governments Jus/ce Center 22
Crime and Arrest Sta0s0cs are Down, but…
Ø 17% and 11% declines in crime and arrests since 2008, respec/vely
High Crime Remains a Problem Ø Four of na/on’s 10 most violent
ci/es Ø Very low clearance rates in high
crime areas
Resources Limited Ø Loss of sworn officers Ø Loss of en/re police departments
Source: Michigan Incident Crime Repor3ng, 2008-‐12, Michigan State Police.
, but…

61,841
68,111
57,442
293,902
266,968
244,198
100,000
160,000
220,000
280,000
340,000
400,000
50,000
60,000
70,000
80,000
90,000
100,000
With Arrests Declining, Felony and Misdemeanor Case Disposi/ons Declined 7% and 17% from 2003 to 2011
Council of State Governments Jus/ce Center 23
Criminal Cases Disposed in Michigan, 2003 – 2011
Misdemeanor Disposi/ons
Felony Disposi/ons
Arrests falling during this period.
Change in Arrests from 2008-‐2011
q Index Violent: -‐ 11% q Index Property: -‐ 9% q Simple Assault: -‐ 2% q Weapons: -‐ 18%
q Drug: -‐ 4% q OUI: -‐ 23%
Source: Annual Sta/s/cal Supplemental Reports on Statewide Filing and Disposi/on Trends, Michigan Supreme Court, State Court Administrator Office; Michigan Incident Crime Repor3ng, 2008-‐11, Michigan State Police.
Misdemeanor
Felony

54,482
60,177
50,862 50,641
25,000
35,000
45,000
55,000
65,000
75,000
Number of Felons Sentenced Declined 15% from 2007 to 2011, but the Decline Slowed Considerably in 2012
Council of State Governments Jus/ce Center 24
Felons Sentenced in Michigan, 2003 – 2012
Source: 2012 Sta3s3cal Report, Michigan Dept. of Correc/ons, August 2013.

Most Felony Sentences Include Jail/Prison Time
Council of State Governments Jus/ce Center 25
2012 Felony
Sentences
50,638 10,473
Prison
(21%)
10,438 Jail Only
(20%)
17,859
Jail + Proba0on
(35%)
11,486
Proba0on Only
(23%)
382
Other
(1%)
Sentence Imposed
“In” “Out”
q Sentences to jail may be for no more than 12 months, with up to 25% of sentence eligible to be credited by sheriff.
q Like those sentenced to prison, felony sentences to jail and proba/on result in a period of supervision upon comple/on of a period of confinement.
q Felony proba/on terms are typically set at 2 to 3 years.
q Other sentences are mainly fees, fines, and res/tu/on.
76% 24%
Source: Felony Sentencing (BIR) Data 2008-‐2012, Michigan Dept. of Correc/ons.

55%
q 19% Prison
q 18% Jail
q 33% Jail + Proba/on
10% Increase in Share of Sentences to Jail or Prison, and 21% Decrease in Share of Sentences to Proba/on, 2008-‐2012
Council of State Governments Jus/ce Center 26
2012 Felony
Sentences
50,638
q 29% Proba/on
q 21% Prison
q 20% Jail
q 35% Jail + Proba/on
q 23% Proba/on
70% of Sentences Involved Confinement
76% of Sentences Involved Confinement
2008 Felony
Sentences
58,108 q 1% Other
q 1% Other
Source: Felony Sentencing (BIR) Data 2008-‐2012, Michigan Dept. of Correc/ons.
55% of Sentences Involved Jail Confinement

64% of Felons Sentenced in 2012 Were not Involved with the Criminal Jus/ce System at the Time of Their Offense
Council of State Governments Jus/ce Center 27 Source: Felony Sentencing (BIR) Data 2008-‐2012, Michigan Dept. of Correc/ons.
2012 Felony Sentences
Rela0onship to CJ System at Time of New Offense (Prior Record Variable #6)
64%
34%
2%
Not Involved in CJ System
Parole, Proba/on, Bond
In Jail/ Prison
14% of those not involved with the CJ system were sentenced to prison

All Offense Grids Show Increase in Share of Sentences Involving Jail or Prison Incarcera/on
Council of State Governments Jus/ce Center 28
Offense Class 2008 2012 # Sent % Incarc. # Sent % Incarc.
All Felony Sentences 58,108 70% 50,638 76% Class H 2,217 61% 1,630 74%
Class G 13,316 66% 11,367 74%
Class F 7,571 63% 6,326 69%
Class E 15,661 72% 13,176 77%
Class D 7,060 72% 5,874 79%
Class C 2,844 81% 2,844 85%
Class B 1,828 84% 1,647 90%
Class A 1,103 97% 1,035 99%
2nd Deg. Murder 168 100% 150 100%
Subtotal SGL 51,768 70% 44,049 77% Non SGL 6,340 72% 6,589 75%
§ Offenses of 1st Degree Murder or Felony Firearm § Term of years sentences § Filed as felony but reduced to misdemeanor § Offense date preceding effec/ve date of SGL.
Sentencing outside of the guidelines:
The least serious offense grids have experienced the
largest increase in sentences involving
confinement.
Source: Felony Sentencing (BIR) Data 2008-‐2012, Michigan Dept. of Correc/ons.

Share of Felons Falling in Prison Cells Is Virtually Unchanged
Council of State Governments Jus/ce Center 29
10%
24%
66% Intermediate Sanc3on
Cells
Prison Cells
Straddle
11%
27%
62% Intermediate Sanc3on
Cells
Prison Cells
Straddle Cells
2008 Felony Guidelines Sentences 2012 Felony Guidelines Sentences
Distribu0on of Felons Across the Cell Types on the Grids
89% of all SGL sentences fall in ‘Intermediate’ or ‘Straddle’ cells.
Source: Felony Sentencing (BIR) Data 2008-‐2012, Michigan Dept. of Correc/ons.
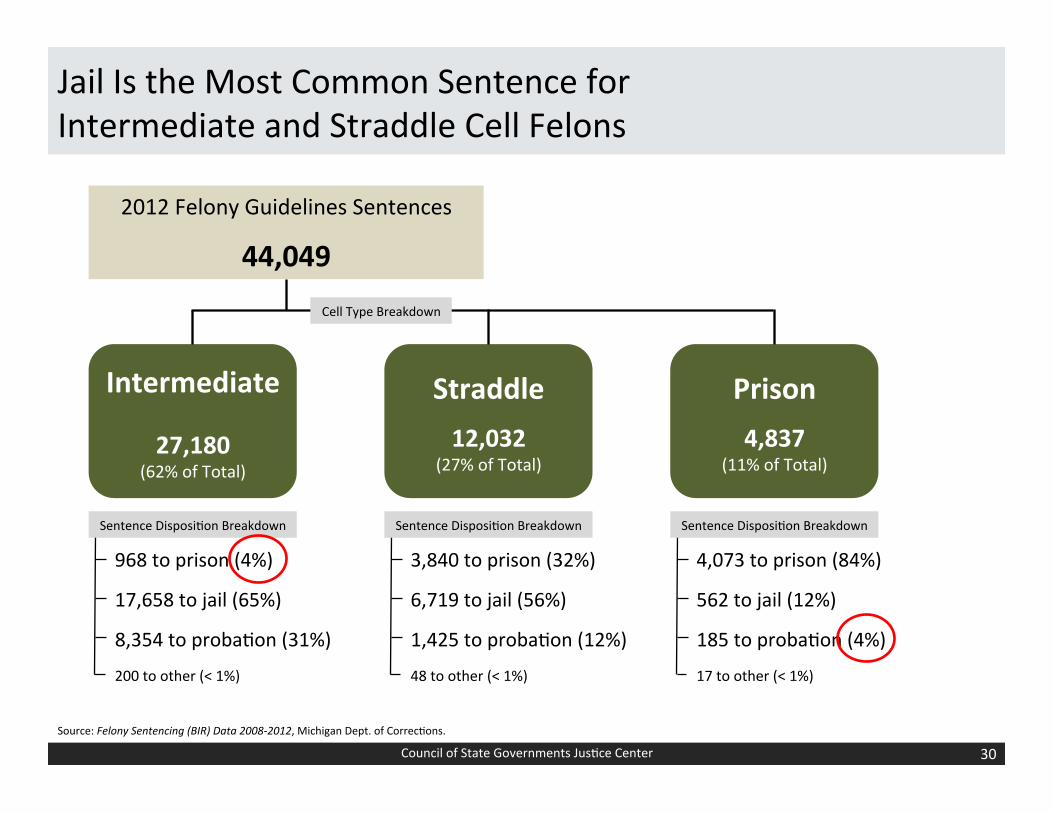
Jail Is the Most Common Sentence for Intermediate and Straddle Cell Felons
Council of State Governments Jus/ce Center 30
2012 Felony Guidelines Sentences
44,049
Intermediate
27,180 (62% of Total)
Straddle 12,032
(27% of Total)
Prison 4,837
(11% of Total)
Cell Type Breakdown
Source: Felony Sentencing (BIR) Data 2008-‐2012, Michigan Dept. of Correc/ons.
968 to prison (4%)
17,658 to jail (65%)
200 to other (< 1%)
8,354 to proba/on (31%)
Sentence Disposi/on Breakdown
3,840 to prison (32%)
6,719 to jail (56%)
48 to other (< 1%)
1,425 to proba/on (12%)
Sentence Disposi/on Breakdown
4,073 to prison (84%)
562 to jail (12%)
17 to other (< 1%)
185 to proba/on (4%)
Sentence Disposi/on Breakdown

Intermediate Cell Felons Sentenced to Jail Confinement Account for 40% of all Guidelines Sentences
Council of State Governments Jus/ce Center 31
Intermediate Cells 62% of all SGL Defendants
Straddle 27%
Prison 11%
40%
19%
2%
15%
9%
3%
9%
1% < 1%
Proba0on
Jail
Prison
Type of Sentence
2012 Guidelines Sentences (N = 44,049)
Source: Felony Sentencing (BIR) Data 2008-‐2012, Michigan Dept. of Correc/ons.

150 1,035 1,647
2,844
5,874
13,176
6,326
11,367
1,630
0
3,500
7,000
10,500
14,000
17,500
2008 2012
Almost 85% of All Guidelines Sentences Fall in Four Grids, D -‐ G
Council of State Governments Jus/ce Center 32
Classes D – G total sentences = 36,743
2008 and 2012 Guidelines Sentences by Offense Class
2012 Total Guidelines Sentences = 44,049
Source: Felony Sentencing (BIR) Data 2008-‐2012, Michigan Dept. of Correc/ons.

Workability: 84% of Class D-‐G Sentences Only U/lize the First Two Rows of the Grids
Council of State Governments Jus/ce Center 33
How much value is added with the effort of scoring OVs, plus li/ga/ng and legisla/ng over their interpreta/on?
Source: Felony Sentencing (BIR) Data 2008-‐2012, Michigan Dept. of Correc/ons.
A B C D E F
I 12.7% 10.1% 15.1% 12.0% 6.3% 5.1%
II 2.9% 2.3% 5.3% 4.8% 3.1% 2.2%
III 2.3% 2.0% 4.3% 4.5% 3.0% 2.0%
I 9.6% 7.0% 10.2% 9.0% 4.3% 3.5%
II 5.6% 6.0% 10.5% 9.2% 5.7% 4.0%
III 1.1% 0.9% 2.1% 2.1% 1.5% 1.8%
IV 0.5% 0.4% 0.9% 1.0% 0.6% 0.6%
V 0.2% 0.1% 0.3% 0.3% 0.2% 0.3%
VI 0.1% 0.1% 0.1% 0.1% 0.0% 0.1%
I 11.7% 8.4% 13.4% 10.3% 4.7% 3.1%
II 6.8% 5.0% 7.9% 8.0% 4.2% 2.9%
III 2.4% 2.0% 2.9% 2.6% 1.2% 1.0%
IV 0.3% 0.1% 0.4% 0.3% 0.2% 0.2%
2012 Sentences Class G 11,367
Class F 6,326
Class E 13,176
I 8.6% 6.4% 13.4% 11.6% 7.0% 7.6%
II 3.6% 3.0% 6.5% 7.3% 4.3% 4.6%
III 0.6% 0.7% 1.4% 1.4% 0.7% 0.7%
IV 0.8% 0.4% 1.0% 0.8% 0.7% 0.6%
V 0.6% 0.4% 1.1% 0.8% 0.4% 0.6%
VI 0.4% 0.1% 0.6% 0.4% 0.4% 0.3%
Class D 5,874
82%
86%
85%
84%
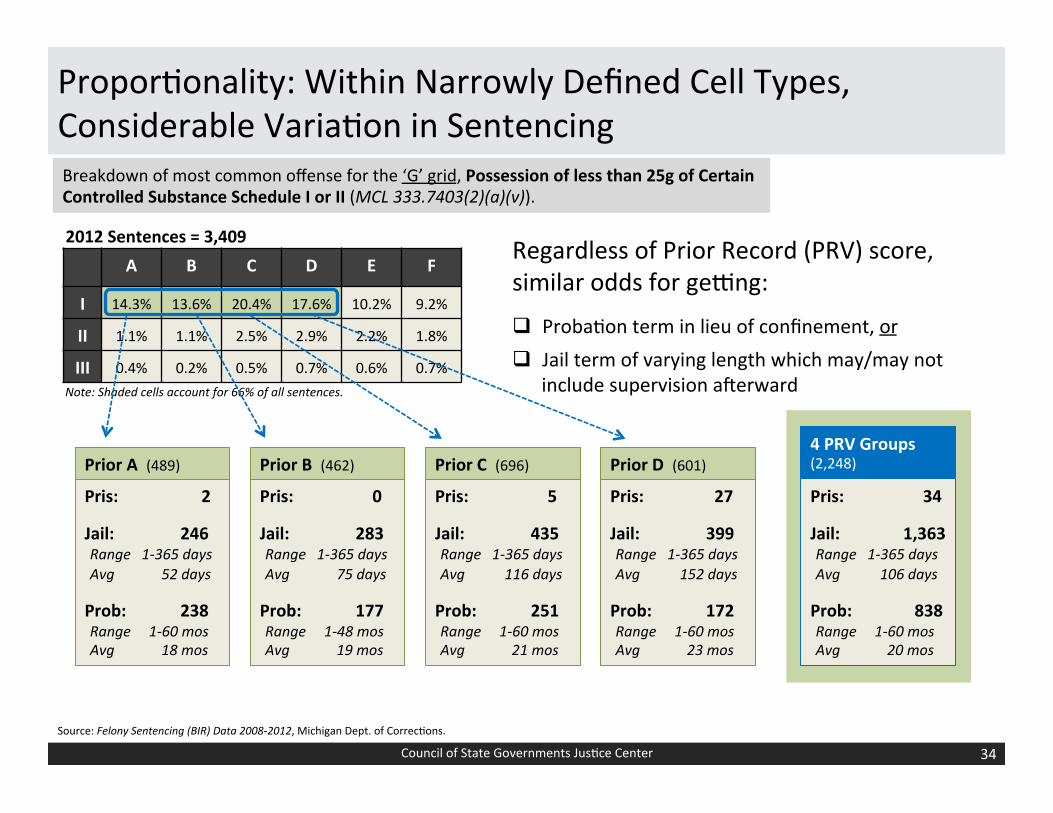
Propor/onality: Within Narrowly Defined Cell Types, Considerable Varia/on in Sentencing
Council of State Governments Jus/ce Center 34
Breakdown of most common offense for the ‘G’ grid, Possession of less than 25g of Certain Controlled Substance Schedule I or II (MCL 333.7403(2)(a)(v)).
A B C D E F
I 14.3% 13.6% 20.4% 17.6% 10.2% 9.2%
II 1.1% 1.1% 2.5% 2.9% 2.2% 1.8%
III 0.4% 0.2% 0.5% 0.7% 0.6% 0.7%
2012 Sentences = 3,409
Note: Shaded cells account for 66% of all sentences.
Pris: 27
Jail: 399 Range 1-‐365 days Avg 152 days
Prob: 172 Range 1-‐60 mos Avg 23 mos
Prior D (601)
Pris: 5
Jail: 435 Range 1-‐365 days Avg 116 days
Prob: 251 Range 1-‐60 mos Avg 21 mos
Prior C (696)
Pris: 0
Jail: 283 Range 1-‐365 days Avg 75 days
Prob: 177 Range 1-‐48 mos Avg 19 mos
Prior B (462)
Pris: 2
Jail: 246 Range 1-‐365 days Avg 52 days
Prob: 238 Range 1-‐60 mos Avg 18 mos
Prior A (489)
Pris: 34
Jail: 1,363 Range 1-‐365 days Avg 106 days
Prob: 838 Range 1-‐60 mos Avg 20 mos
4 PRV Groups (2,248)
Regardless of Prior Record (PRV) score, similar odds for gePng:
q Proba/on term in lieu of confinement, or q Jail term of varying length which may/may not
include supervision a]erward
Source: Felony Sentencing (BIR) Data 2008-‐2012, Michigan Dept. of Correc/ons.

Propor/onality: Within a Single Cell Type, Considerable Varia/on in Sentencing
Council of State Governments Jus/ce Center 35
Breakdown of most common offense for the ‘G’ grid, Possession of less than 25g of Certain Controlled Substance Schedule I or II (MCL 333.7403(2)(a)(v)).
A B C D E F
I 14.3% 13.6% 20.4% 17.6% 10.2% 9.2%
II 1.1% 1.1% 2.5% 2.9% 2.2% 1.8%
III 0.4% 0.2% 0.5% 0.7% 0.6% 0.7%
2012 Sentences = 3,409
PRV Level A (489)
Pris: 2 Jail: 246
Prob: 238
238 Proba0on Only
– Proba/on terms ranging from 30 days to 5 years
188 Jail & Proba0on
– Jail terms ranging from 1 day to 365 days
– Proba/on terms ranging from 30 days to 3 years
58 Jail Only
– Jail terms ranging from 3 days to 365 days
Despite falling in the same cell on the same grid for the same offense, defendants faced a wide range of possible punishments:
o As lible as 3 days in jail, o As much as 5 years on proba/on, or o A combina/on of the two, with widely ranging lengths of jail and
proba/on /me. Source: Felony Sentencing (BIR) Data 2008-‐2012, Michigan Dept. of Correc/ons.

Propor/onality: Top 10 Coun/es Show Wide Variance in Intermediate Cell Sentences
Council of State Governments Jus/ce Center 36
2012 Class D-‐G Intermediate Sentences in Top 10 Coun0es Type of Punishment Imposed
0% 10% 20% 30% 40% 50% 60% 70% 80% 90% 100%
Saginaw
Kalamazoo
OIawa
Ingham
Washtenaw
Genesee
Kent
Macomb
Oakland
Wayne
Prison Jail
Jail
q Lowest: Wayne 24%
q Highest: Ingham 96%
Proba0on
q Lowest: Ingham 3%
q Highest: Wayne 73%
Type of Sentence Imposed
Proba0on
Source: Felony Sentencing (BIR) Data 2008-‐2012, Michigan Dept. of Correc/ons.

Propor/onality: Top 10 Coun/es Show Wide Variance in Straddle Cell Sentences
Council of State Governments Jus/ce Center 37
2012 Class D-‐G Straddle Sentences in Top 10 Coun0es Type of Punishment Imposed
0% 10% 20% 30% 40% 50% 60% 70% 80% 90% 100%
Saginaw
Kalamazoo
OIawa
Ingham
Washtenaw
Genesee
Kent
Macomb
Oakland
Wayne
Prison Jail
Prison
q Lowest: Ingham 15%
q Highest: Kent 53%
Jail
q Lowest: Wayne 38%
q Highest: Ingham 83%
Proba0on
q Lowest: Ingham 3%
q Highest: Wayne 41%
Type of Sentence Imposed
Proba0on
Source: Felony Sentencing (BIR) Data 2008-‐2012, Michigan Dept. of Correc/ons.
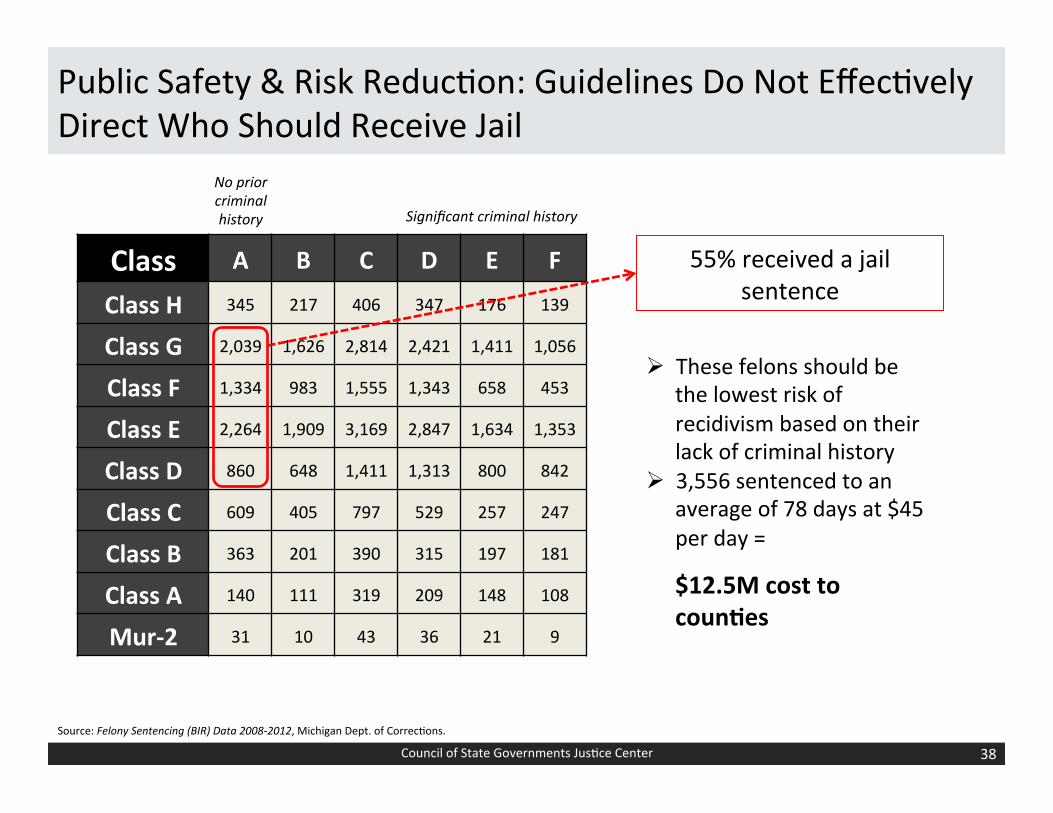
Public Safety & Risk Reduc/on: Guidelines Do Not Effec/vely Direct Who Should Receive Jail
Council of State Governments Jus/ce Center 38
Class A B C D E F
Class H 345 217 406 347 176 139
Class G 2,039 1,626 2,814 2,421 1,411 1,056
Class F 1,334 983 1,555 1,343 658 453
Class E 2,264 1,909 3,169 2,847 1,634 1,353
Class D 860 648 1,411 1,313 800 842
Class C 609 405 797 529 257 247
Class B 363 201 390 315 197 181
Class A 140 111 319 209 148 108
Mur-‐2 31 10 43 36 21 9
No prior criminal history Significant criminal history
55% received a jail sentence
Ø These felons should be the lowest risk of recidivism based on their lack of criminal history
Ø 3,556 sentenced to an average of 78 days at $45 per day =
$12.5M cost to coun0es
Source: Felony Sentencing (BIR) Data 2008-‐2012, Michigan Dept. of Correc/ons.

Public Safety & Risk Reduc/on: Guidelines Do Not Effec/vely Direct Who Should Receive Supervision
Council of State Governments Jus/ce Center 39
Class A B C D E F
Class H 345 217 406 347 176 139
Class G 2,039 1,626 2,814 2,421 1,411 1,056
Class F 1,334 983 1,555 1,343 658 453
Class E 2,264 1,909 3,169 2,847 1,634 1,353
Class D 860 648 1,411 1,313 800 842
Class C 609 405 797 529 257 247
Class B 363 201 390 315 197 181
Class A 140 111 319 209 148 108
Mur-‐2 31 10 43 36 21 9
No prior criminal history Significant criminal history
33% received a jail sentence without
proba/on supervision
Ø These felons should be a higher recidivism risk by virtue of their criminal history (PRV) scores.
Source: Felony Sentencing (BIR) Data 2008-‐2012, Michigan Dept. of Correc/ons.

Public Safety: Indica/ons Are that Guidelines Do Not Maximize Effec/veness of Scarce Resources
Council of State Governments Jus/ce Center 40
Recidivism Reduc0on Poten0al
Up to 20% Reduc/on in Re-‐Arrests.
Up to 5% reduc/on if programs provided. Poten/al increase.
$3.5M in state costs for supervision (assuming average cost/day of $7)
$6.4M in local county costs for jail confinement (assuming average cost/day of $45)
Costs to the Criminal Jus0ce System
Breakdown of most common offense for the ‘G’ grid, Possession of less than 25g of Certain Controlled Substance Schedule I or II (MCL 333.7403(2)(a)(v)).
Pris: 34 Jail: 1,363 Avg 106 days
Prob: 838 Avg 20 mos
4 PRV Groups
838 Proba0on 20 months avg.
1,363 Jail 3.5 months avg.
More cost-‐effec/ve path towards beber public safety outcomes.
Source: Felony Sentencing (BIR) Data 2008-‐2012, Michigan Dept. of Correc/ons.

Does System Achieve Goals?
Council of State Governments Jus/ce Center 41
Goal Ques0ons Current Knowledge Public Safety Do the sentencing and parole
decisions promote risk reduc/on? Proba/on recidivism is increasing Guidelines do not effec/vely direct jail and supervision sentencing
Propor0onality Is there disparity in sentencing and /me served for similar cases? If so, what are the causes?
Considerable varia/on within a narrowly defined cell type or individual cell; top 10 coun/es show wide varia/on
Certainty Are vic/ms sa/sfied or frustrated with the uncertain por/on of a sentence?
Unknown but under study
Predictability To what degree are sentencing and parole decisions driving popula/on trends?
Sentencing contributes, but parole is major driver
Workability Is the complexity of the sentencing system sufficiently advancing other goals to be worth the effort?
Lots of appellate ac/vity but not much user dissa/sfac/on OV scoring adds low value

Summary of Sentencing Analyses
Council of State Governments Jus/ce Center 42
High Odds of Doing Time ü 88% of Straddle sentences involve
confinement in jail or prison ü 69% of Intermediate sentences involve
confinement in jail or prison
Illusory Precision of Guidelines ü OV scoring adds lible precision ü Wide variance on type of sentence
imposed within narrowly defined offense ranges
Sentencing Poorly Aligned with Goals of Public Safety
ü Guidelines direct low risk to jail and high risk away from poten/ally effec/ve supervision

Recap of Key Points For the Day
Council of State Governments Jus/ce Center 43
ü Dis/nct stakeholder perspec/ves make consensus difficult ü Divergent views reinforce the value of data analysis 1. ü Iden/fy and focus on high-‐risk offenders ü Target the factors that most influence criminal behavior ü Ensure programs are high quality and properly implemented
2. ü Crime is a serious problem, par/cularly in four ci/es ü Felons typically, increasingly sentenced to do /me, most o]en in jail ü Wide discre/on in sentencing and observable disparity ü Sentencing is not well aligned with public safety objec/ves
3.
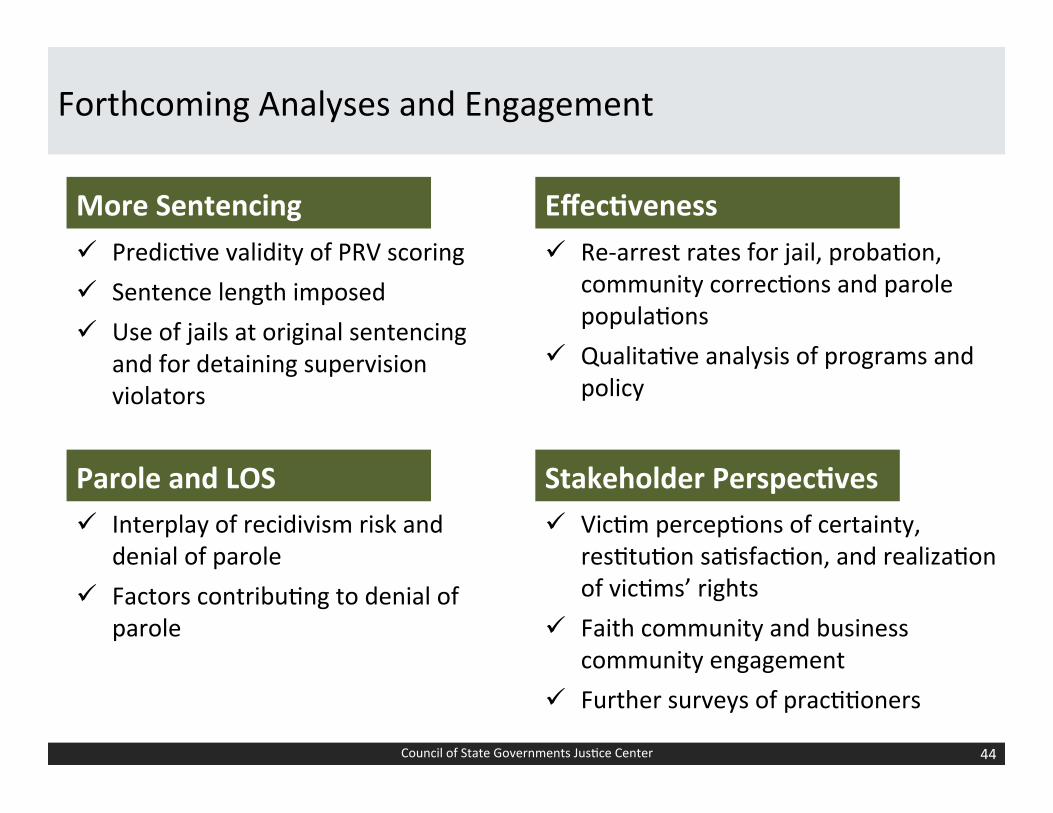
Forthcoming Analyses and Engagement
Council of State Governments Jus/ce Center 44
More Sentencing
Stakeholder Perspec0ves Parole and LOS
Effec0veness ü Predic/ve validity of PRV scoring ü Sentence length imposed ü Use of jails at original sentencing
and for detaining supervision violators
ü Re-‐arrest rates for jail, proba/on, community correc/ons and parole popula/ons
ü Qualita/ve analysis of programs and policy
ü Vic/m percep/ons of certainty, res/tu/on sa/sfac/on, and realiza/on of vic/ms’ rights
ü Faith community and business community engagement
ü Further surveys of prac//oners
ü Interplay of recidivism risk and denial of parole
ü Factors contribu/ng to denial of parole
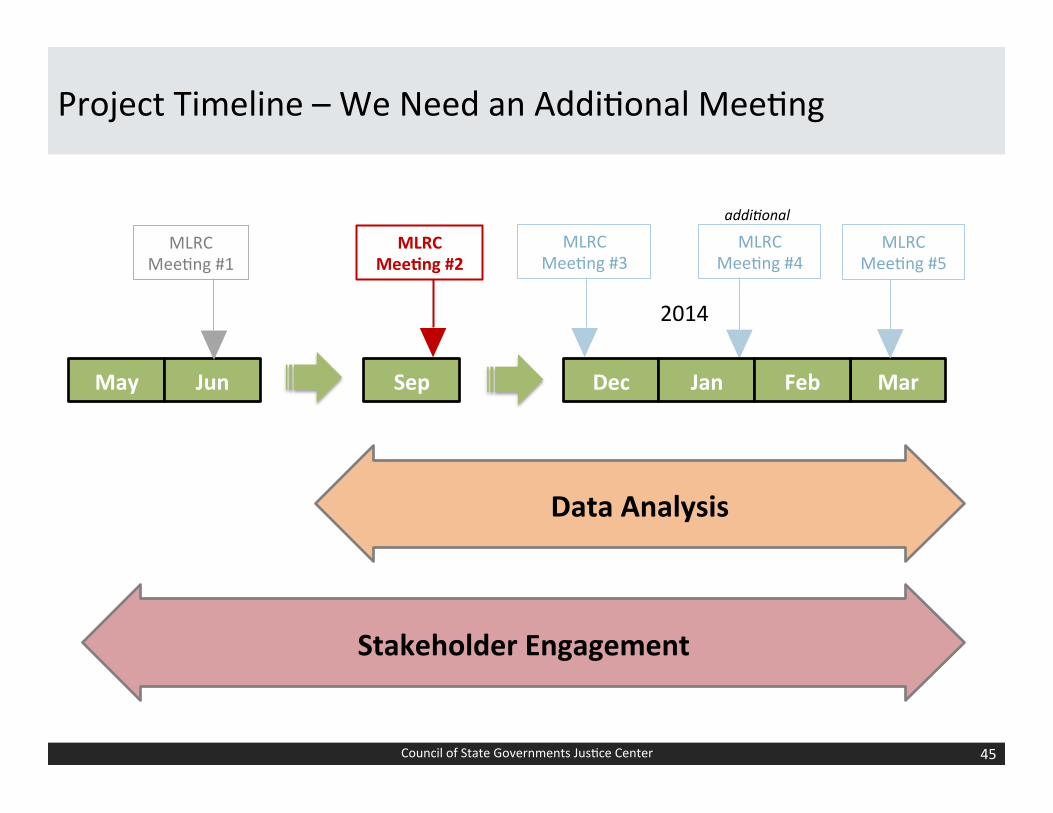
Project Timeline – We Need an Addi/onal Mee/ng
Council of State Governments Jus/ce Center 45
May Jun Sep Dec
MLRC Mee/ng #1
MLRC Mee0ng #2
MLRC Mee/ng #3
MLRC Mee/ng #4
Jan Mar
2014
MLRC Mee/ng #5
Data Analysis
Stakeholder Engagement
addi3onal
Feb

Council of State Governments Jus/ce Center 46
Thank You
Ellen Whelan-‐Wuest Policy Analyst ewhelan-‐[email protected]
This material was prepared for the State of Michigan. The presenta/on was developed by members of the Council of State Governments Jus/ce Center staff. Because presenta/ons are not subject to the same rigorous review process as other printed materials, the statements made reflect the views of the authors, and should not be considered the official posi/on of the Jus/ce Center, the members of the Council of State Governments, or the funding agency suppor/ng the work.
www.csgjus0cecenter.org