herefordshire bus improvement plan 2021
TRANSCRIPT

Herefordshire Bus Service Improvement Plan Creating an exemplar for rural bus services
October 2021

1. Herefordshire Bus Service Improvement Plan
Creating an exemplar for rural bus services
October 2021 Produced by:
with:
Herefordshire Council and Herefordshire’s bus operators Contact: Tim Edwards Integrated Transport Planning Ltd. Charles House 148 Great Charles Street Birmingham B3 3HT 0121 285 7301 [email protected] www.itpworld.net
Notice This report has been prepared for Herefordshire Council in accordance with the terms and conditions of appointment. Integrated Transport Planning Ltd cannot accept any responsibility for any use of or reliance on the contents of this report by any third party.

i
Table of Contents
1. Overview ............................................................................................................................................................. 1
Introduction ........................................................................................................................................................... 1
Development of the Bus Service Improvement Plan ............................................................................. 1
Aims and objectives of the BSIP .................................................................................................................... 3
Vision ................................................................................................................................................................... 3
BSIP goal ........................................................................................................................................................... 3
Objectives .......................................................................................................................................................... 3
2. Current offer to passengers ........................................................................................................................ 4
Introduction ........................................................................................................................................................... 4
Herefordshire in context ................................................................................................................................... 4
Challenges and opportunities ......................................................................................................................... 9
What do people think about buses in Herefordshire? .......................................................................... 9
Current offer to passengers .......................................................................................................................... 12
The network ................................................................................................................................................... 12
Operators ........................................................................................................................................................ 13
Herefordshire Council Support ............................................................................................................... 18
The impact of Covid-19 ............................................................................................................................. 18
Network density ............................................................................................................................................ 19
Reliability ............................................................................................................................................................. 21
Information, branding and ticketing ......................................................................................................... 25
Decarbonisation and support ...................................................................................................................... 27
Public transport and local policy ............................................................................................................ 29
Performance of Herefordshire’s current bus network against the ambitions of the National Bus Strategy and Herefordshire BSIP ........................................................................................................ 31
3. Targets ............................................................................................................................................................. 34
Supporting monitoring, targets and evaluation ................................................................................... 35
4. Delivery ............................................................................................................................................................ 36

ii
How do we get there? ................................................................................................................................ 36
The Network ....................................................................................................................................................... 37
The BSIP as a foundation ............................................................................................................................... 49
Phased implementation ................................................................................................................................. 49
Funding and priorities .................................................................................................................................... 50
5. Reporting ........................................................................................................................................................ 51
6. Overview .......................................................................................................................................................... 52
Appendix A – Public consultation summary ............................................................................................... 55
Appendix B – letters of support from local bus operators .................................................................... 68

iii
List of Tables Table 1 Proportion of population with access to different levels of service .................................. 19 Table 2 Summary of available bus information ........................................................................................ 25 Table 3 Core targets for measuring the success of the BSIP ............................................................ 34 Table 4 Summary of the ambition and measures relating to the network ..................................... 37 Table 5 Summary of the ambition and measures relating to reliability ........................................... 41 Table 6 Summary of the ambition and measures for information and branding ......................... 43 Table 7 Summary of the ambition and measures relating to ticketing and fares ........................ 45 Table 8 Summary of the ambition for decarbonisation and supporting measures ..................... 47 Table 9 Overview of the Herefordshire BISP and EP ............................................................................ 52
List of Figures Figure 1 Herefordshire BSIP Area .................................................................................................................... 2 Figure 2 Levels of deprivation across Herefordshire................................................................................. 5 Figure 3 Employment density in Herefordshire (2019) ............................................................................. 5 Figure 4 Travel to work in Herefordshire (Census 2011) ........................................................................... 6 Figure 5 Travel to work within Herefordshire (Census 2011) .................................................................. 7 Figure 6 LTP analysis of travel and transport in Herefordshire ............................................................ 9 Figure 7 Bus users’ satisfaction ...................................................................................................................... 10 Figure 8 Views on which improvements would encourage bus use ................................................ 11 Figure 9 BSIP priorities for bus users and non-users ............................................................................ 11 Figure 10 Passenger journeys on local services per head of population ...................................... 13 Figure 11 Share of servies run by each operator .................................................................................... 14 Figure 12 Share of patronage by each operator ...................................................................................... 14 Figure 13 Service frequency at different time periods (2021)............................................................. 15 Figure 14 Outbound services running per day (2021) ........................................................................... 16 Figure 15 Herefordshire Bus Network Link Frequency 2019 and 2021 ......................................... 17 Figure 16 Pinch points in Herefordshire identified by operators ........................................................ 22 Figure 17 Typical congestion in Hereford city in the am (left) and pm (right) Source - Google Maps, 2021 .............................................................................................................................................................. 23 Figure 18 Herefordshire’s BSIP Cornerstones ......................................................................................... 36

1
1. Overview
Introduction 1.1 Situated in the south west of the West Midlands region bordering Wales, Herefordshire
has beautiful unspoilt countryside with remote valleys and rivers and a distinctive heritage. The River Wye winds through the county, flowing east from the Welsh border through Hereford city before turning south to flow through the Wye Valley Area of Outstanding Natural Beauty (AONB). The Malvern Hills border the east of the county, while the south west is dominated by the western reaches of the Black Mountains.
1.2 Whilst the landscape and setting make for an idyllic place to live, there are significant challenges for the operation of effective and viable bus services. Small overall population dispersed across the area limits the demand for bus travel. Furthermore, high car ownership results from necessity. Even so, bus services are vitally important for those who do not have access to a car, particularly older and young people, and those that want to move away from a reliance on private vehicles. Buses will play an important role in actions to address the declared climate emergency.
1.3 Hereford is a centre of activity and a focal point for the county to which people converge. With a single bridging point of the river and significant through traffic, the city suffers from congestion, which impacts on the ability to provide efficient bus services.
1.4 Despite these challenges, Herefordshire is uniquely placed to transform its bus network, to bring real benefit to its residents. There is much support for change and even before the publication of the Bus Back Better: National Bus Strategy, Herefordshire Council was looking at ways to revitalise public transport through various initiatives.
With relatively modest levels of support for the proposals contained in this Plan, significant transformation can take
place, showing what can be achieved in a rural area
Development of the Bus Service Improvement Plan 1.5 The Herefordshire Bus Service Improvement Plan (BSIP) covers Herefordshire only,
reflecting the largely self-contained, inward-facing nature of the bus network, which focuses on Hereford city (where key health and education facilities are located) and the county’s market towns. There are several cross-boundary services that link to Worcester, Gloucester and into Wales, used by residents to reach further destinations,

2
although to some extent these are duplicated by rail services that offer quicker journeys and links with the national rail network.
Figure 1 Herefordshire BSIP Area
1.6 In developing the BSIP, there has been dialogue with neighbouring authorities. Many of the issues facing Herefordshire are also to be found in Shropshire, reflecting their rural geography, main centre of activity and surrounding market towns. With few cross-boundary services and largely different operators, there is little common ground for a joint BSIP. However, there will be opportunities to share experience and knowledge in delivering similar bus service improvements. With other neighbours, continued dialogue and collaboration will be important to maintain and develop existing cross-boundary services, including those into Wales
1.7 Following the publication of the National Bus Strategy, Herefordshire Council convened an all-operator group that has come together as a Partnership. Terms of Reference were agreed and monthly meetings held, chaired independently to allow authority officers and operators to discuss things freely on equal terms. The Group supported the proposal for an Enhanced Partnership (EP) and the Council published a notice of intent to develop an EP on 25 June 2021. All operators are invited to attend meetings and contribute to its work. There has been good representation at the meetings to date.
1.8 The Partnership Group has overseen the development of the BSIP and will ultimately be responsible for the EP Plan and Schemes that are established in 2022.

3
Herefordshire Council has committed to expand the Group to include wider interests such as user representation.
1.9 The BSIP will be maintained as a living document that is regularly reviewed and updated, at least annually. Monitoring reports will be produced every 6 months to demonstrate progress towards the objectives and targets set.
Aims and objectives of the BSIP 1.10 All partners have been fully engaged in the development of the BSIP and the
formulation of the vision and objectives set out below. Letters of support for the BSIP have been received from the majority of operators and are included at appendix b.
Vision
Buses in Herefordshire play a significant role in meeting travel needs, having a positive impact on the lives and wellbeing of those who use them and making a positive contribution to the county’s economy and environment.
BSIP goal
To establish a firm foundation for the Herefordshire bus network on which to build, develop and improve service provision. This will be achieved by focusing efforts and resources on measures that maximise benefits.
Objectives
1) Establish a coherent, consistent and integrated bus network that is well understood and easy to use.
2) Offer a quality service that is attractive to use and portrays a positive image.
3) Provide a service that offers value for money.
4) Contribute positively towards Herefordshire’s ambitions for decarbonisation and environmental improvement.
5) Support the wellbeing of Herefordshire residents, enabling people to access key services and live independently
4
2. Current offer to passengers
Introduction 2.1 The expectation on BSIPs is for local authorities to deliver a fully integrated bus
service, with simple multi-operator tickets, more bus priority measures, the same high-quality information for all passengers in more places, and better turn-up and go frequencies that keep running in to the evening and at weekends. By delivering these, the expectation is that patronage growth will follow.
2.2 This chapter summarises the existing position regarding the delivery and use of bus services across Herefordshire. It takes account of the evidence gathered from stakeholders and residents during summer 2021. By considering the gap between the current position and ambition, areas for improvement have been identified, along with targets, approaches to delivering change and reporting structures. These are set out in Chapters 3, 4 and 5.
Herefordshire in context 2.3 With a population of 192,100 (2018), Herefordshire is the fourth least populated county
in England, with 221 people per square mile. One third of the population lives in Hereford, one third in the five market towns and the remaining third distributed across the villages and hamlets. Most of the county (95%) is classed as rural and 53% of the population live in rural areas. In the DfT’s Index of Accessibility, it is the lowest ranking local authority in terms of access to key services.
Herefordshire at a glance
Median age - 44.3 years compared with national average 40.4
23% of the population is aged 65+ compared to 19% nationally
17% of people aged 0-15 compared to 23% nationally
Herefordshire has limited ethnic diversity – 2% of the population is non-white

5
Figure 2 Levels of deprivation across Herefordshire
2.4 Despite having higher than average life expectancy, Herefordshire has areas of high deprivation. The Indices of Multiple Deprivation (2019) highlight that 31% of the Lower Super Output Areas (LSOA) in the county are in the top 20% most deprived areas.
Figure 3 Employment density in Herefordshire (2019)
2.5 Herefordshire’s economy is predominantly rural. In 2018, 90% of enterprises registered in the county employed less than 10 people, with only 0.1% of companies in the county classified as ‘large employers’ and employing more than 250 people. Agriculture, Forestry and Fishing (24%), ‘construction’ (11%) and ‘professional and

6
technical activities’ (11%) sectors employed the largest share of people. Employment density, according to the 2019 Business Register and Employment Survey, is shown in Figure 3.
2.6 Hereford has the largest concentration of employment in the county, with an estimated 29,000 jobs located in the city in 2019. As such, the city is a major trip generator for journeys to work. Figure 4 shows the relative flows into the city for work from all parts of the county. Other important centres of employment include Ross on Wye, Leominster and Ledbury and, to a lesser extent Kington and Bromyard.
2.7 Within Hereford itself there are significant movements in and around the city for work, as illustrated in Figure 5.
Figure 4 Travel to work in Herefordshire (Census 2011)

7
2.8 Recent years have seen the development of large employment areas in Hereford, most notably the Hereford Enterprise Zone (HEZ) located to the south-east of the city.
Figure 5 Travel to work within Herefordshire (Census 2011)

8
Herefordshire Enterprise Zone - Why is the site important?
Skylon Park is the 72-hectare Hereford Enterprise Zone (HEZ) - the largest employment area in Hereford. It is intended that further highly skilled jobs will be created and investment encouraged into the area. There are currently around 4,000 people employed across the HEZ. The site is served by a new two-mile long access road directly onto the A49, and the M50 is around a 25-minute drive from the site. Shift times vary, with most operations between 07:00 and 19:00, with a few 24/7 operations.
Current public transport access
Bus service 78X, operated by Yeoman’s, links the HEZ and Hereford city centre. It operates every 30 minutes for much of the day, with some longer gaps at times.
296 passengers of the service were surveyed in 2018. People commented on the large gaps in the timetables in the morning (for instance between 08:00 and 08:45), which was not conducive for travelling to work. Furthermore, people noted that the service was often late with variable punctuality in the late afternoon due to traffic. There were calls for the service to be extended to the railway station to improve connectivity.
Whilst some improvements were made in response to the feedback, including updated timings and amendments to the route around the estate, the service continues to run only to the city centre and not beyond to the railway station.
Transport barriers for employees
In May 2019, 392 staff from 92 different businesses across the HEZ responded to a Herefordshire Council survey. 19% of respondents lived within 2 miles of Skylon Park and 49% within 5 miles. 68% of respondents travelled alone by car (72% in 2018), 14% cycled (12% in 2018) and 1% used the bus (2% in 2018). A reasonable number of employees occasionally cycled (22%), walked (14%) or car-shared (17%). Only 4% of respondents occasionally used the bus.
When asked what would encourage them to start, or continue using the bus, the most common measures were discounts on tickets (19%), better bus information (8%) and bus stop closer to the workplace (5%). Of those respondents who generally drove alone to work, two thirds indicated that none of the suggested changes would encourage them to use the bus.
People further commented on the inconvenience and expense of having to get connecting buses in Hereford city centre. A number highlighted that there was no suitable bus service close to their home. The main reasons for using the car were that it was quicker, easier and more convenient (54%), the distance of the journey (38%) and lack of suitable public transport services from where they live (37%).

9
Challenges and opportunities 2.9 Herefordshire’s Local Transport Plan (LTP) Strategy 2016-2031 outlines the main
challenges relating to travel and transport in Herefordshire, summarised in Figure 6 below.
Figure 6 LTP analysis of travel and transport in Herefordshire
What do people think about buses in Herefordshire? 2.10 Herefordshire Council has carried out a number of public consultation exercises over
the last few years, gauging opinion on bus and community transport services. Whilst providing useful insights, these have tended to focus on guiding future spending priorities on bus services, rather than transformational enhancements to the network. Therefore, in summer 2021, an on-line survey was undertaken to better understand people’s views of the current bus network and what they considered should be the priority actions for inclusion in the Bus Service Improvement Plan.

10
2.11 Appendix A contains a summary of the public consultation.
2.12 The survey received 753 responses, mainly from residents and with a few from representatives of organisations. 32% of respondents were non-users of bus. 33% were regular bus users and 35% occasional users of bus. Overall, 25% of respondents expected that their journey patterns would change because of the pandemic.
2.13 Bus users were most satisfied with journey length, distance to the bus stop and service reliability. They were least satisfied with service frequency, facilities to cater for those with disabilities and hours of operation.
2.14 In terms of reasons for using the car rather than bus, similar patterns existed for both bus users and non-users. Most cited were the lack of available buses and the frequency of services.
Figure 7 Bus users’ satisfaction
2.15 When asked what they considered to be the priorities for the BSIP, the following were highlighted:
• More frequent services (87%)
• Evening services (75%)
• Information that is easier to obtain and use (76%)
• More destinations reached by bus (72%)

11
Figure 8 Views on which improvements would encourage bus use
2.16 In terms of fares and ticketing, the provision of a multi-operator ticket was considered more important than lower fares. Meanwhile, improved bus stops were mid-ranking and rated above better vehicles. The priorities expressed by users and non-users were aligned and expressed almost in the same order, as highlighted in Figure 9.
Figure 9 BSIP priorities for bus users and non-users
2.17 For businesses and groups, priorities were:

12
• More frequent services (100%)
• Information that is easier to obtain and use (100%)
• Multi-operator ticketing (91%)
2.18 Two workshops were held to gauge the views and thoughts of elected members and wider stakeholder interests (business, Department of Work and Pensions, bus user representatives, community groups; disability groups). Both groups expressed a poor perception of the existing bus network, although bus users highlighted some positive points of services, including examples.
2.19 The main points to emerge were:
• Desire to see more consistent provision and improved frequencies on core routes (operating 07:00 – 22:00) and with a service 7 days per week
• Important to recognise the leisure/tourism potential of bus services
• More links between market towns, such as Kington – Leominster
• Concerns around the operation and image of City Bus Station
• Herefordshire Council should coordinate the provision of information
Current offer to passengers
The network
2.20 Just over 2 million passenger journeys were undertaken on local bus services in Herefordshire in 2018/19. The network has seen patronage decline over the past decade. Between 2009/10 and 2018/19, total local bus patronage fell by 35%. Concessionary travel use fell by 29%, suggesting that there has been a more significant fall in fare-paying passengers.
2.21 Between 2009/10 and 2019/20 passenger journeys per head of population fell by 46%, more than in neighbouring Shropshire (down 33.6%) and the West Midlands region (down 30.1%).

13
Figure 10 Passenger journeys on local services per head of population
2.22 The bus network is focused on Hereford, with services radiating out to the market towns. These operate with varying frequencies, which are at best hourly. From those towns, some services continue into neighbouring areas, running on to Gloucester, Worcester and Ludlow. There are a number of services that cross into Wales, including the X3 to Cardiff and TrawsCymru T14 service via Hay-on-Wye to Brecon, Merthyr Tydfil and Cardiff. There are also more local links to Llandrindod Wells and Monmouth.
2.23 There are a number of other rural bus services linking larger villages to Hereford. Across the county there are more occasional services, many only operating on certain days of the week, that provide links from rural hinterlands into the nearest market town or to Hereford.
2.24 Within Hereford itself is a network of local city bus services, linking the main residential areas to the city centre. These provide quite a complex pattern of loops and route variations and operate, with most offering a 30-minute frequency. The city network converges on the City Bus Station, whilst other bus services use the County Bus Station.
2.25 Several community transport operators offer a range of minibus and volunteer car services to residents in each of their areas. Between them, the entire county is covered. These benefit people who either are unable to use conventional public transport services or those for whom no other service is available.
2.26 The bus network is shown in Figure 15, with more detailed local maps available opn our website.
Operators
2.27 Herefordshire’s bus network is unique in being dominated by local independent companies. Eleven operators provide services. Whilst three of the large national
14
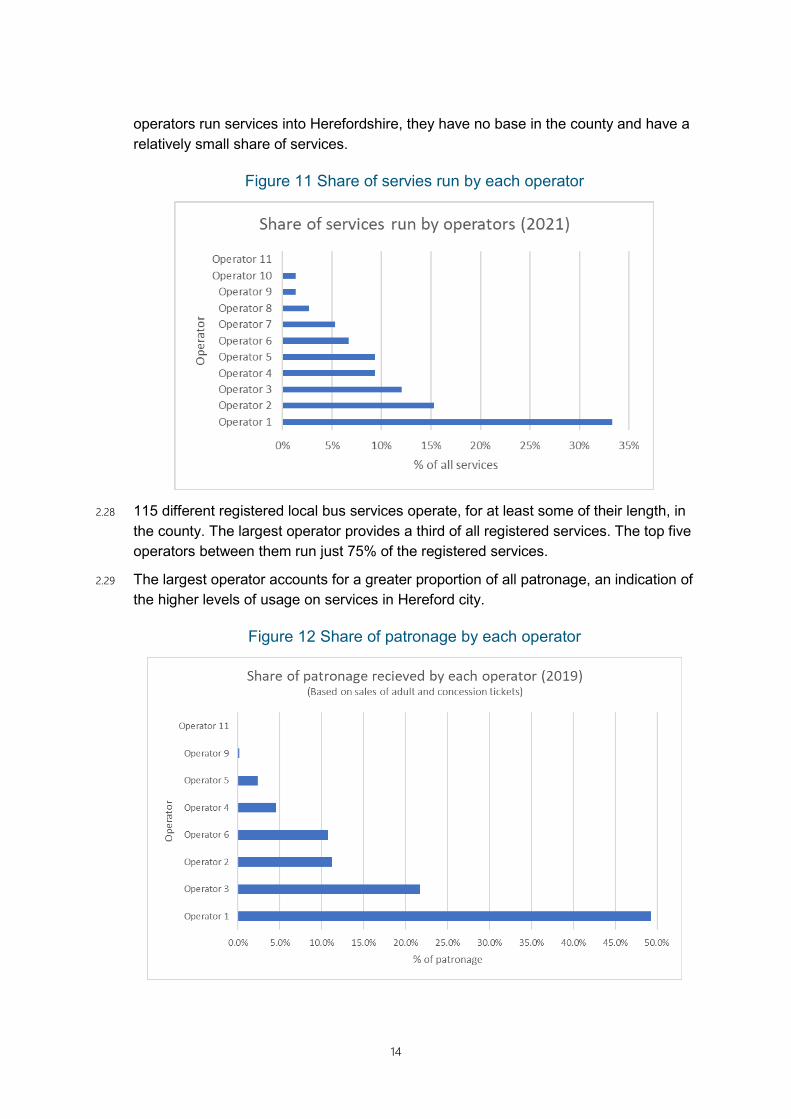
operators run services into Herefordshire, they have no base in the county and have a relatively small share of services.
Figure 11 Share of servies run by each operator
2.28 115 different registered local bus services operate, for at least some of their length, in
the county. The largest operator provides a third of all registered services. The top five operators between them run just 75% of the registered services.
2.29 The largest operator accounts for a greater proportion of all patronage, an indication of the higher levels of usage on services in Hereford city.
Figure 12 Share of patronage by each operator

15
Service Frequency
2.30 Much of the current bus network is designed around meeting the travel requirements of young people travelling to and from school and college. This results in journeys that fall out of regular service patterns. Equally, where buses carry large numbers of young people, it can deter other users.
2.31 The variability in service frequencies is shown in Figure 13.
Figure 13 Service frequency at different time periods (2021)
2.32 Levels of service also vary by day of the week, with less provision on Saturday than weekdays and significantly less on Sunday.

16
Figure 14 Outbound services running per day (2021)
2.33 The overall bus network is shown in Figure 15, along with maps showing the relative frequencies both now and pre-pandemic.

17
Figure 15 Herefordshire Bus Network Link Frequency 2019 and 2021

18
Herefordshire Council Support
In 2020/21 the Council spent over £3.5 million supporting bus services in Herefordshire. £800,000 secured13 contracts with operators, which account for more than a quarter of total patronage across the County. Over £1.2 million was spent reimbursing operators for carrying concessionary passholders. The remaining expenditure was on student passes, publicity, Covid-19 recovery and staffing costs
2.34 A team of 2 officers have prime responsibility for overseeing the support of the network, concessionary travel, information and liaising with operators.
The impact of Covid-19
2.35 Although there has been some uplift in service frequency on certain corridors between 2019 and autumn 2021 (notably the Hereford - Monmouth and Hereford - Kington routes), operators have not returned to full Pre-Covid levels on some services, due to caution surrounding demand.
2.36 Herefordshire Council is using Covid recovery funding to provide more Sunday buses and free weekend travel for a year (September 2021 – August 2022).
Free weekend bus travel scheme – September 2021
Free weekend travel on all bus journeys in Herefordshire was launched on 4th September 2021 as one of the council’s Covid-19 recovery schemes. The initiative has been positively received by bus operators and the public.
In the first full month since launch, there has been a positive effect on the numbers of passengers traveling by bus to Hereford and the market towns.
In addition to free weekend travel, several new Sunday bus services have been introduced to maximise the opportunities for weekend travel.
Highlights for September 2021
• Introduction of 8 new Sunday services, in addition to the 6 existing) • 14,004 free bus journeys were made • A further 7,153 weekend journeys were made by concession holders • Patronage grew by 32% from the first weekend of the month to the last • Patronage on Saturdays increased by 993 journeys (26%) • Patronage on Sundays increased by 473 journeys (72%) • Taking Covid-19 recovery scheme journeys in isolation, patronage grew by
1288 journeys (46%) over the month, with Saturdays increasing by 862 journeys (39%), and Sundays by 426 journeys (78%)
• 1227 journeys were made on the 8 new Sunday services
19
Network density
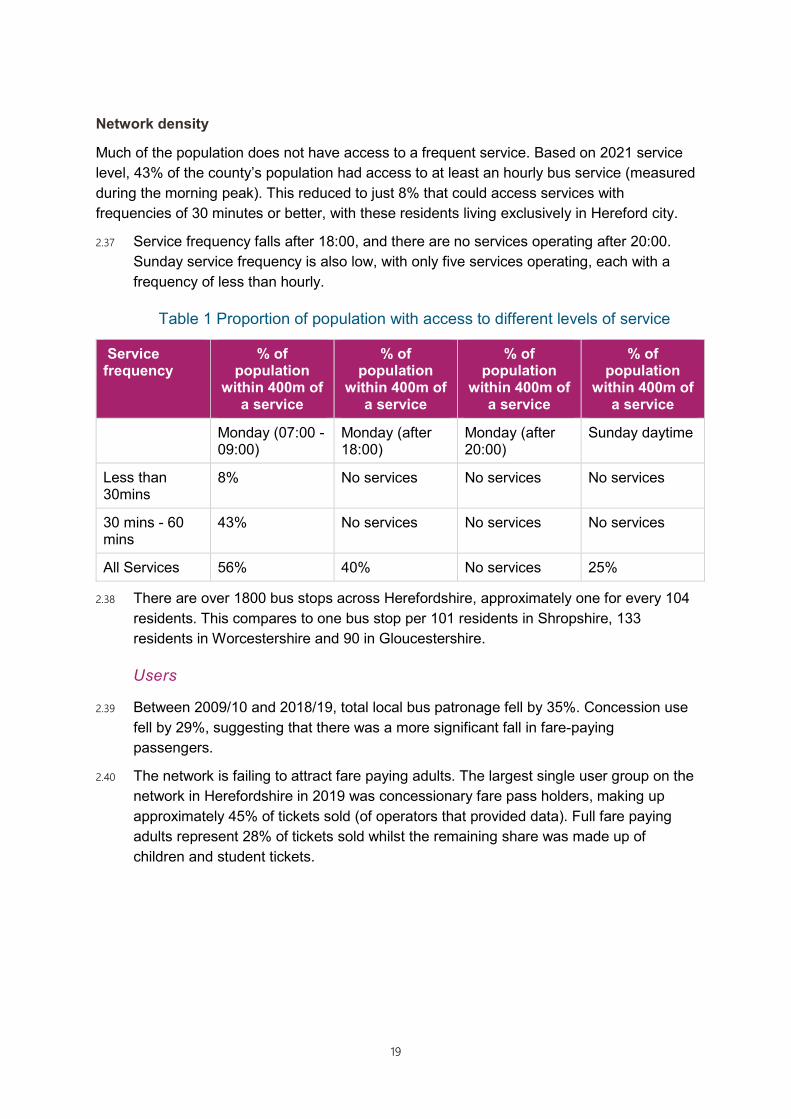
Much of the population does not have access to a frequent service. Based on 2021 service level, 43% of the county’s population had access to at least an hourly bus service (measured during the morning peak). This reduced to just 8% that could access services with frequencies of 30 minutes or better, with these residents living exclusively in Hereford city.
2.37 Service frequency falls after 18:00, and there are no services operating after 20:00. Sunday service frequency is also low, with only five services operating, each with a frequency of less than hourly.
Table 1 Proportion of population with access to different levels of service
Service frequency
% of population
within 400m of a service
% of population
within 400m of a service
% of population
within 400m of a service
% of population
within 400m of a service
Monday (07:00 - 09:00)
Monday (after 18:00)
Monday (after 20:00)
Sunday daytime
Less than 30mins
8% No services No services No services
30 mins - 60 mins
43% No services No services No services
All Services 56% 40% No services 25%
2.38 There are over 1800 bus stops across Herefordshire, approximately one for every 104 residents. This compares to one bus stop per 101 residents in Shropshire, 133 residents in Worcestershire and 90 in Gloucestershire.
Users
2.39 Between 2009/10 and 2018/19, total local bus patronage fell by 35%. Concession use fell by 29%, suggesting that there was a more significant fall in fare-paying passengers.
2.40 The network is failing to attract fare paying adults. The largest single user group on the network in Herefordshire in 2019 was concessionary fare pass holders, making up approximately 45% of tickets sold (of operators that provided data). Full fare paying adults represent 28% of tickets sold whilst the remaining share was made up of children and student tickets.

20
Modal share
2.41 With high car ownership, much of the population relies on the car as the main form of transport. The most recent available modal share statistics are from the 2011 Census, at a time when bus passenger journeys were 44% higher than in 2019/20.
2.42 In 2011, 62% of all journeys to work were by car and just 1.5% by bus (1% in rural areas, 2% in urban areas). 85% of households had a car, compared to 74% for England as a whole. The decline in bus patronage is likely to have increased the modal share towards car further, and when data is made available from the 2021 census, full analysis will be undertaken.
Ticketing and patronage data was provided from five operators. To obtain a more holistic view, concessionary fare returns were used to determine patronage on routes where data was not available. Action is underway to obtain data from the remaining operators, some of which do not hold the technology or expertise to provide the full
range of data requested for the BSIP.

21
Reliability 2.43 High car use is one factor that contributes to poor network reliability, particularly in
Hereford. Bus reliability and punctuality are key concerns for the operators. Over time, timetabled journey times have increased to manage falls in reliability, affecting service frequency, service regularity and operating costs. In Herefordshire, the percentage of non-frequent bus services running on time has decreased from 92% in 2015/16 to 78% in 2018/191.
2.44 Leading to longer journey times and unreliable journeys, congestion directly increases operating costs, therefore potential capital for investment in service improvements and better levels of services is lost by operators having to maintain headways.
Pinch Points
2.45 Operators were asked to identify sections of road and junctions where delays to their services occurred. Central Hereford is the main area for delays at locations including:
• Entry to the City and Country Bus Stations.
• Major roads into the city, including Belmont Road, Whitecross Road, Commercial Road and Aylestone Hill.
1 DfT stats Table BUS0902 - Non-frequent bus services running on time1 by local authority: England, annual from 2004/05
Bus vehicle speed and congestion by route and by time of day – using GPS vehicle data from operators was not possible as the operators in Herefordshire do not have
the technology to collect this data at present. Instead, consultation has been undertaken with operators to identify pinch points, with supplementary secondary
analysis undertaken to inform the BSIP goals.

22
• Newmarket Road (a key link between major roads in the city).
• St Peter’s Square (a narrow road located in the historic city centre).
2.46 Only one location outside of Hereford was identified, which was in Bromyard (Broad Street into Pump Street). The locations of pinch points identified is shown in Figure 17.
Figure 16 Pinch points in Herefordshire identified by operators
2.47 Operators were also asked about desirable interventions at these pinch points. Bus priority at junctions and bus lanes were considered to offer the best solutions.

23
Congestion
Traffic levels and a lack of priority are the cause of the problems at the identified pinch points. The maps below show typical congestion in Hereford city according to the Google Maps predictive model at 08:00 (left) and 17:00 (right). Virtually all major roads in the city are congested at these times, delaying buses and reducing the competitiveness of the bus compared to private vehicles.
Figure 17 Typical congestion in Hereford city in the am (left) and pm (right) Source - Google Maps, 2021

24
2.48 Overall Annual Average Daily Traffic (AADT) in Hereford fell by 1.6% between 2016/17 and 2019/20.2 During the same period for Herefordshire county (excluding Hereford), AADT rose by 1.3%.
2.49 During the Covid-19 pandemic, traffic levels fell across Hereford and Herefordshire, offering an opportunity to ‘lock in’ improvements to bus priority and promote a sustained decrease in traffic in the years ahead.
Existing bus priority
2.50 Delays caused by congestion are exacerbated by the lack of bus priority. There is only one bus lane in Herefordshire currently, with an approximate length of 15m (pictured). Otherwise, there are no specific bus priority measures, with buses left to queue with other general traffic.
Bus vehicle speed and journey times
2.51 Congestion in Hereford slows down vehicle speeds and impacts on bus journey times. In the absence of location or service-specific speed and journey time information, basic analysis has been undertaken using the timetabled journey time for the 33
2 The last full year without the pandemic influencing traffic levels

25
services that operate in Hereford city for at least part of their journey. This analysis indicated that:
• End-to-end average speed of services in the morning peak is 14.7mph (23.7 km/h)
• End-to-end average speed of services between the peaks is 15.5mph (25km/h).
2.52 Almost 65% of services have timetabled speeds slower in the morning peak than between the peaks, indicating the impact of congestion.
Information, branding and ticketing 2.53 There is no central or integrated system for information, branding and ticketing in
Herefordshire, and therefore, no consistency for customers. Users and Non-Users considered this their second most common priority for improvement.
Information
2.54 Information is provided through separate sources, with no central point available online where a person can access information for the entire network. Although operators make best efforts to ensure information is available to their passengers, some operators lack resource or skills to develop information provision in accessible and user-friendly formats.
2.55 A summary of information available through different sources is provided below.
Table 2 Summary of available bus information
Source of information Availability
Websites • Each operator has a website where timetable information from their services can be accessed.
• Fares information can be accessed via websites for only one operator
• Herefordshire Council uploads data files to Traveline.info, where timetable information can be obtained.
Social media • Each operator has an individual Facebook page. Timetable changes and other urgent information such as road closures are given on these sites.
• Some operators have other social media such as Instagram or Twitter.
• A central twitter site ‘Hereford Buses’ provides updates on bus travel for all services in the county.

26
Apps • Only the national operators, Stagecoach and First, provide individual apps where passengers can access information and buy tickets.
Real-Time Passenger Information (RTPI)
• RTPI screens are provided at main stops in Hereford city centre, with QR codes provided at other bus stops so passengers can access this information. Herefordshire Council uploads the relevant data files to support this service.
Roadside information • Herefordshire Council funds the provision of timetables and publicity at stops and shelters.
Paper timetables • Each operator produces individual paper timetables. There is no central resource available for all timetables.
Branding
2.56 Aside from bus stop signage, which is managed by the council and is consistent, all branding is undertaken by operators, meaning there is no one brand for bus services in Herefordshire.
Tickets
2.57 There is no multi-operator ticketing agreement in Herefordshire, with each operator offering its own range of singles, returns, daily, weekly and monthly tickets. Multi-operator tickets were cited by residents as one of the top 5 reasons that would encourage bus use.
2.58 Analysis of ticket sales, split according to the breakdown specified by the DfT, was undertaken. This breakdown was only possible for the operators that provided full set of data; therefore, it does not represent all journeys.
2.59 Concessionary fares accounted for the greatest proportion of ticket sales in 2019 (44%), followed by singles (25%), and then returns (17%).

27
Alternative data was taken from the forms submitted by operators for concessionary travel reimbursement. This gives a split of ticket types for all services.
In terms of payment, operators were not able to provide data about the split of electronic and cash payments. Card and contactless payment is available on all buses apart from those of one operator. By the end of 2021, all operators will offer contactless payment methods.
Decarbonisation and support 2.60 Herefordshire declared a climate emergency in 2019, which committed the authority to
become climate neutral by 2030/1 and reduce carbon emissions by 75% by 2025/6.
The split of electronic and cash payments was not possible to obtain from operators. The project team will work to obtain this data as soon as possible.

28
2.61 Transport is estimated to contribute 36% of emissions in Herefordshire and whilst the bus network offers a low-carbon alternative to driving, the bus fleet itself contributes to local air pollution and CO2 emissions.
2.62 Fleet information was provided by five operators. Whilst 27% of the fleet met the highest standard, Euro VI, nearly 40% of vehicles meet only Euro III and IV emission standards.
2.63 The lower standards for emissions reflect the age profile of the fleet. Almost 50% of the fleet is aged between 5 and 10 years, with less than 5% of the fleet less than 2 years old.
Fleet data was not provided by certain operators. The project team will seek to obtain this data.

29
Public transport and local policy
Herefordshire County Plan 2020-2024
“Respecting our past, shaping our future – we will improve the sustainability, connectivity and wellbeing of our county by strengthening our communities, creating a thriving local economy and protecting and enhancing our environment.”
Ambition for Herefordshire to be “an exemplar of 21st Century rural living where market towns and rural communities are properly valued and recognised for the contributions they make to the success of the county”
2.64 The Council’s ambitions for the role public transport can play in reducing congestion and carbon emissions, and contribute to enhanced wellbeing, is recognised in the County Plan:
“We will enable more healthy low carbon travel options, including walking, public transport and cycling, to reduce congestion, improve local air quality and enhance health and wellbeing.”
2.65 The plan is supported by the ambition to improve and extend active travel options throughout the county. Capital schemes are already progressing, which will support public transport and integration, including the Transport Hub project at Hereford rail station and public realm improvements that will consider improved access to rural and city-based services in Hereford.
2.66 The Local Transport Plan (LTP) 2016-31 centres on a transport network that supports growth, enables development and provides safe conditions for active travel. Its 5 objectives are to:
• Enable economic growth
• Provide a good quality transport network for all
• Promote healthy lifestyles
• Make journeys safer, easier and healthier
• Ensure access to services for those living in rural area
2.67 The role of public transport was assessed and developed through the Hereford Transport Strategy Review, 2020. Whilst the review focused on the Hereford urban area, it identified a series of priorities for public transport that impact the wider network and have been taken into account in the development of this BSIP. These include increased frequency and hours of operation of services, bus priority to increase the efficiency and attractiveness of services, electrification of the fleet and greater provision for school access. Further development work will be undertaken on these proposals during 2021/22.

30
2.68 The wider transport strategy recognises the importance of demand management for car-based travel (focusing primarily on parking charges and supply) in combination with positive measures to support bus use and active travel modes. The strategy and proposals are being developed further as part of a master plan for the city which will ensure coordination with land use planning proposals (the council is currently updating its adopted local plan), economic development strategy (the council is developing the Big Plan 2050 which will set out the strategy for long term economic growth and the Pathway to Carbon Neutral, the carbon management plan 2020-26.
2.69 The important role improved bus services and better integration with rail could play in supporting tourism is reflected in the priorities of the Herefordshire Sustainable Destination Management Plan 2018-22. This includes an action to encourage sustainable accessibility under the key priority to Grow Herefordshire as a Visitor Destination. This is further supported by the County Plan 2020-2024 that includes ambitions to:
• Protect and promote our heritage, culture and natural beauty to enhance quality of life and support tourism
31
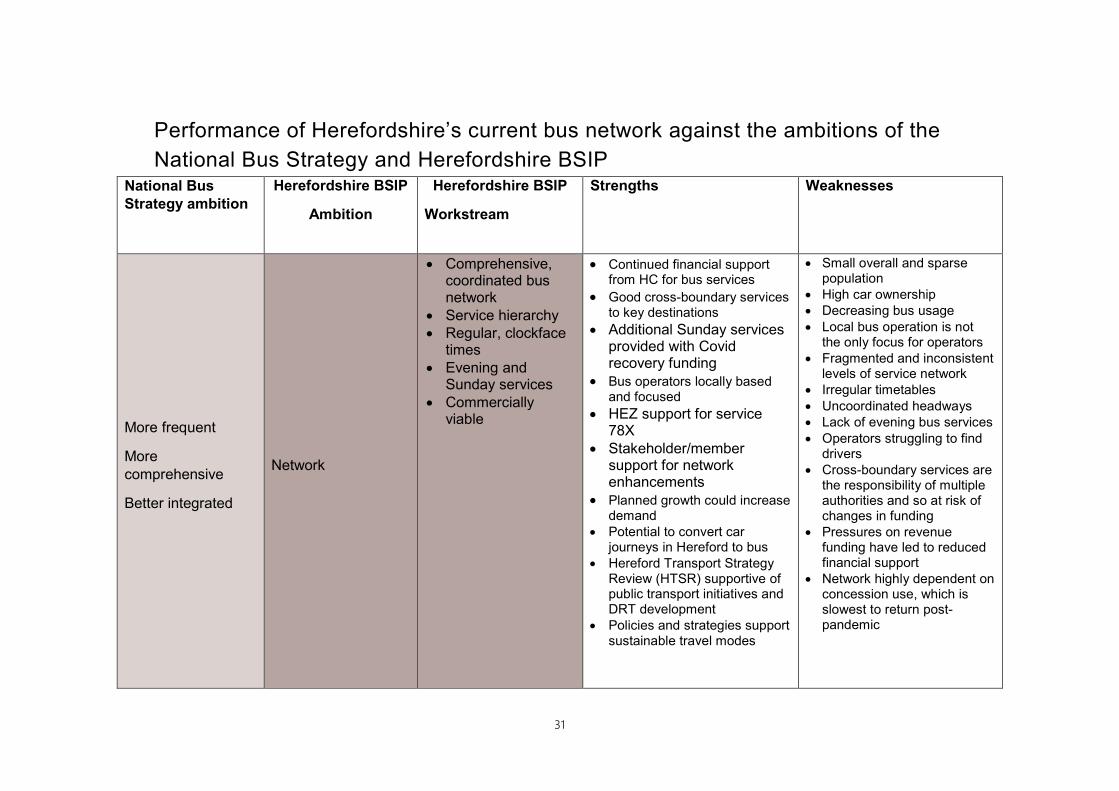
Performance of Herefordshire’s current bus network against the ambitions of the National Bus Strategy and Herefordshire BSIP
National Bus Strategy ambition
Herefordshire BSIP
Ambition
Herefordshire BSIP
Workstream
Strengths Weaknesses
More frequent
More comprehensive
Better integrated
Network
• Comprehensive, coordinated bus network
• Service hierarchy • Regular, clockface
times • Evening and
Sunday services • Commercially
viable
• Continued financial support from HC for bus services
• Good cross-boundary services to key destinations
• Additional Sunday services provided with Covid recovery funding
• Bus operators locally based and focused
• HEZ support for service 78X
• Stakeholder/member support for network enhancements
• Planned growth could increase demand
• Potential to convert car journeys in Hereford to bus
• Hereford Transport Strategy Review (HTSR) supportive of public transport initiatives and DRT development
• Policies and strategies support sustainable travel modes
• Small overall and sparse population
• High car ownership • Decreasing bus usage • Local bus operation is not
the only focus for operators • Fragmented and inconsistent
levels of service network • Irregular timetables • Uncoordinated headways • Lack of evening bus services • Operators struggling to find
drivers • Cross-boundary services are
the responsibility of multiple authorities and so at risk of changes in funding
• Pressures on revenue funding have led to reduced financial support
• Network highly dependent on concession use, which is slowest to return post-pandemic

32
National Bus Strategy ambition
Herefordshire BSIP
Ambition
Herefordshire BSIP
Workstream
Strengths Weaknesses
Faster and more reliable Reliability
• Reliable, unhindered operation of buses
• Shorter journey times for passengers
• Bus priority and dealing with school run traffic are work packages to emerge from the HTSR, with feasibility work underway
• Congestion in Hereford city • Congestion resulting in
weakened peak running time and frequency
• Worsening situation with planned growth
• Little road space to improve bus without worsening car
Cheaper
Fares and ticketing
• Easy to use/understand
• Single system • More affordable
• Free weekend travel being provided with Covid recovery funding
• No comprehensive ticketing (multi-operator) across the network
• Fares viewed as expensive and not value for money
• Few off-bus/mobile options within current operator resources
• Mixed technology/hardware
Easy ticketing
More understandable Information and
branding
• Umbrella branding • Centralised
information provision
• Different media
• HC produces county and city bus map
• HC maintains information at bus stops
• Real time information at city centre stops
• Pre-Covid operators adhered to a Code of Service Stability with
• Lack of comprehensive information provision
• Variable provision of information by different operators
• Uncoordinated route numbering
• Uncoordinated service change dates at present (during covid)

33
National Bus Strategy ambition
Herefordshire BSIP
Ambition
Herefordshire BSIP
Workstream
Strengths Weaknesses
Changes on 4 fixed dates in the year
Better to ride (comfortable; safe; accessible)
Decarbonisation and support
• Electrification of fleet
• Better buses • Passenger charter • Accessible/inclusive • Waiting
infrastructure improvements
• Hereford City Council’s Hereford Zipper electric bus trial, secured funding through Stronger Towns Fund
• New interchange being developed at Hereford Railway Station
• Lack of investment in vehicles and infrastructure
• Variable quality of passenger waiting infrastructure
• City Bus Station inadequate • Two bus stations with limited
connectivity and interchange opportunity
Greener

34
3. Targets 3.1 The core targets for measuring the success of the BSIP are set out below, and
supported in more detail by the table provided in Annex B.
Table 3 Core targets for measuring the success of the BSIP
Targets Description 2018/19 2019/20 Targets for 2024/25
Journey time Average bus speed (am peak)
- 14.7mph 5% increase in bus speed
Reliability Non-frequent bus services running on time (within 1min early, 5mins late)
78% 79% 86%
Passenger numbers
Total passenger journeys on the whole bus network
2.05 million 1.79 million 2.4million
Average passenger satisfaction
% of surveyed users who we dissatisfied with elements of the current networks
- 34% 27%
3.2 At present the availability of data is limited, especially regarding bus operation and passenger satisfaction. As data provision improves, through the Bus Open Data Service, it will be necessary to reset some of the targets. Going forward, the above targets will be refined and measured using the following approaches:
• Passenger satisfaction will be measured through participation in the Transport Focus Bus Passenger Survey, allowing comparisons with other areas. Five specific areas of satisfaction will be measured and targets developed:
• Overall passenger satisfaction with bus journey
• Satisfaction with value for money
• Satisfaction with bus punctuality
• Satisfaction with on-bus journey time
• Satisfaction with bus information
• Passenger growth will be measured by reviewing operator patronage data on a route-by-route basis, which is currently submitted to the Local Transport Authorities as part of their returns to the DfT. Growth will be monitored on an area

35
and corridor basis to understand the impact of specific BSIP measures, which will be used to inform the development of the BSIP in future years.
• Reliability will be measured by monitoring non-frequent bus services running on time, as submitted to DfT, and supported by local surveys. BODS data will be utilised to measure services running on time. Reliability will be monitored on an area and corridor basis to understand the impact of specific BSIP measures, which will be used to inform the development of the BSIP targets in future years.
• Journey time. Average speed has been estimated using the timetabled journey time for the 33 services that operate in Hereford city for at least part of their journey. Going forward it will be measured using a combination of timetable information and data supplied through BODs. Journey time will be monitored on an area and corridor basis to understand the impact of specific BSIP measures, which will be used to inform the development of the BSIP targets in future years. In addition to this
Supporting monitoring, targets and evaluation 3.3 In addition to measuring the above, a number of other measures will be monitored,
and targets set, to help steer BSIP implementation. It will be important to monitor the impact of specific interventions, in order to learn from experience and adapt to maximise success.
Journey time improvements
• Ratio of bus journey time compared to car journey time for the core network
Passenger growth
• Number of passenger journeys by bus per head of population
• % of passenger journeys made by concessionary travel holders
• % of passenger journeys made by fare-paying passengers
• % of total passengers boarding after 19:00 Monday – Saturday
• % of total passengers boarding on Sundays
Network improvements
• Proportion of Hereford city population within 400m of a bus service operating at least every 15 minutes (M-S daytime)
• Proportion of Herefordshire population within 400m of at least an hourly bus service (M-S daytime)
• Proportion of Herefordshire population within 400m of at least a half hourly bus service (M-S daytime)

36
• Proportion of Herefordshire population within 400m with an evening service
• Proportion of Herefordshire population within 400m with a Sunday service
Infrastructure
• Number of bus stops upgraded each year
• Number of bus shelters upgraded each year
• Number of Park and Choose sites connected directly to the bus network
De-carbonisation
• % of overall fleet that is zero emission and/or ultra-low emission
• Of diesel fleet, the % of fleet that is Euro VI or better
4. Delivery 4.1 The ambition is for buses to play a significant role in meeting travel needs, contributing
to the council’s commitment to reduce carbon emissions and reduce dependence on cars, having a positive impact on the lives and wellbeing of those who use them and making a positive contribution to the county’s economy and environment. The County Plan sets out a vision for Herefordshire to be an exemplar for rural living. The BSIP sets out a similar vision for the county to have an exemplar public transport network. The council is keen to work with government and explore the opportunity to demonstrate the potential to transform passenger transport in a rural area with a county town that suffers from similar challenges to larger urban areas, including congestion and poor air quality.
How do we get there?
4.2 This section sets out the measures and projects that will be developed through the life of the BSIP, with the goal to establish a firm foundation for the Herefordshire bus network on which to build. Developed around the National Bus Strategy objectives, and local objectives that have been determined through local engagement with operators, the public and key stakeholders, the BSIP focuses developing the ‘cornerstones’ of the network:
Figure 18 Herefordshire’s BSIP Cornerstones

37
The Network
Table 4 Summary of the ambition and measures relating to the network
The Network
Why it is important: • The current network is historic and has been adapted to meet different needs to as
viability and funding have declined. It is no longer fit for purpose and needs recasting. • From the public survey, for both users and non-users, the areas of least satisfaction
were the hours of operation and frequency of bus services. • The most cited reason for using the car instead of bus was the lack of availability of
suitable bus services and the inadequate frequency of services. • The top two priorities that would encourage people to use the bus more were more
frequent services and provision of evening services. • Operators agree with the need to develop a consistent and simple network for users. • Bus users predominantly use bus services for shopping and recreational purposes,
infrequently and off-peak. There is a need to develop the network to be more attractive to those accessing employment and education, as well as social/leisure in the evening.
• Significant shortages of PSV drivers in Herefordshire means that any proposed changes that lead to expansion of service provision will have to be preceded by measures to encourage and train new drivers.
• Long term impact of the pandemic, marginal network profitability and a base of smaller local operators means that opportunities to develop the network commercially are seen as high-risk and unattractive without support.
The ambition:
• An integrated, comprehensive network that will encourage modal shift and reduce car usage.
• Service hierarchy, with minimum standards, that is clearly defined and easy to understand.
• Regular, clockface timetables. • Evening and Sunday services that mirror the day-time core network, at appropriate
frequencies. • Services that are increasingly commercially viable.

38
The Network
Herefordshire’s exemplar network
A review of the entire bus network will be undertaken and then planned from scratch with the operators. There will be two main elements to the network development. Firstly, enhancements to the ‘core’ network. In the city, a number of main services will be increased to 15-minute frequencies, and evening and Sunday buses offered. On the core county services, between the market towns and Hereford, routes will be made as direct as possible, frequencies increased to every 30 minutes, and again evening and Sunday journeys provided. Where appropriate, interchange hubs will be developed on the core routes to facilitate connections with other services.
In parallel, improvements will be made to the supporting network. This will include other city services and links connecting market towns and villages. These will be less frequent than core services (30 minutes in Hereford and local town services in the market towns; and hourly elsewhere), but still offering regular headways. Supporting services will include a mix of timetabled and demand responsive services. As well as providing local links, these will be routed and timed to provide connections with core services, either in the market towns or at intermediate interchange hubs, with through ticketing available.
What is already being done:
• Herefordshire Council’s strategic change to a pro-public transport policy. • Herefordshire Council continues to financially support many local bus services at a
cost of £800,000 p.a. • Covid recovery funding is being used to provide additional Sunday buses and free
weekend travel for all for journeys within Herefordshire for a year (September 2021 – August 2022).
• School and college transport arrangements are integrated into the local bus network, supporting current levels of provision.
• HTSR supported the concept of DRT and some outline feasibility work is underway.

39
Projects and schemes
No. BSIP Measure
Description Timescale
1. Network review and resourcing
The current network has evolved incrementally over a number of years, often responding to reduced subsidy or commercial pressures and falling revenues. This has resulted in fragmented services and inconsistencies between different geographies. A comprehensive review is required, having regard to the current commercial and subsidised services with a view to identifying a holistic network which meets the aspirations of users and ambitions of the council. The review will be holistic and consider not just the existing and potential public transport network, but opportunities for further integration of travel and movement in, around and out of Herefordshire. It will involve network planning, operator and stakeholder consultation (including neighbouring authorities) , and consider delivery and procurement, being built around Herefordshire’s vision for an exemplar network of integrated core, supporting and DRT services.
Delivery of the new network will begin in 2022/23, with the review quickly identifying ‘early wins’ for funding and service improvements to be introduced on the network, including opportunity for increased daytime frequencies, evening, and Sunday journeys. Although the main focus in these early stages will be the core network, opportunity to develop both the supporting network and DRT in the first year of funding will be considered.
At the same time, internal resource to manage and co-ordinate the network review, co-ordinate the expanded bus network and DRT, and deliver the wider ambitions of the BSIP will be required. This will take the form of a new Network Manager position, and a junior supporting role.
2022/23 – 2025+
40
Projects and schemes
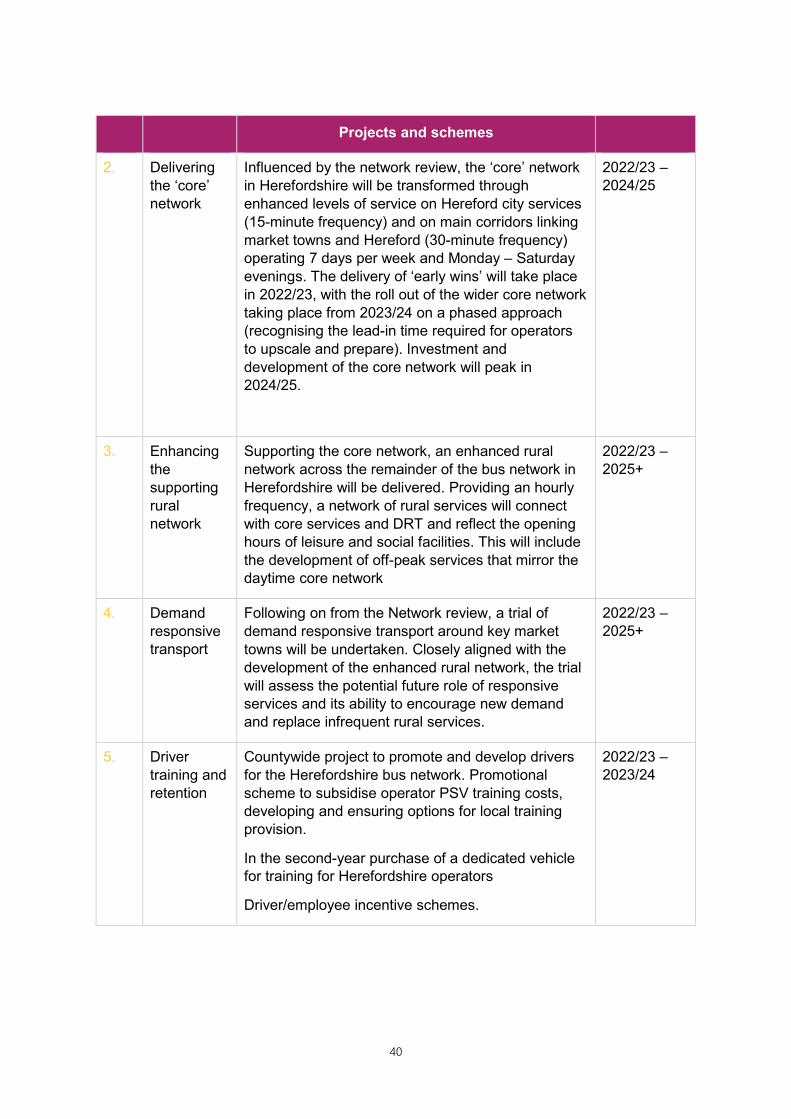
2. Delivering the ‘core’ network
Influenced by the network review, the ‘core’ network in Herefordshire will be transformed through enhanced levels of service on Hereford city services (15-minute frequency) and on main corridors linking market towns and Hereford (30-minute frequency) operating 7 days per week and Monday – Saturday evenings. The delivery of ‘early wins’ will take place in 2022/23, with the roll out of the wider core network taking place from 2023/24 on a phased approach (recognising the lead-in time required for operators to upscale and prepare). Investment and development of the core network will peak in 2024/25.
2022/23 – 2024/25
3. Enhancing the supporting rural network
Supporting the core network, an enhanced rural network across the remainder of the bus network in Herefordshire will be delivered. Providing an hourly frequency, a network of rural services will connect with core services and DRT and reflect the opening hours of leisure and social facilities. This will include the development of off-peak services that mirror the daytime core network
2022/23 – 2025+
4. Demand responsive transport
Following on from the Network review, a trial of demand responsive transport around key market towns will be undertaken. Closely aligned with the development of the enhanced rural network, the trial will assess the potential future role of responsive services and its ability to encourage new demand and replace infrequent rural services.
2022/23 – 2025+
5. Driver training and retention
Countywide project to promote and develop drivers for the Herefordshire bus network. Promotional scheme to subsidise operator PSV training costs, developing and ensuring options for local training provision.
In the second-year purchase of a dedicated vehicle for training for Herefordshire operators
Driver/employee incentive schemes.
2022/23 – 2023/24
41
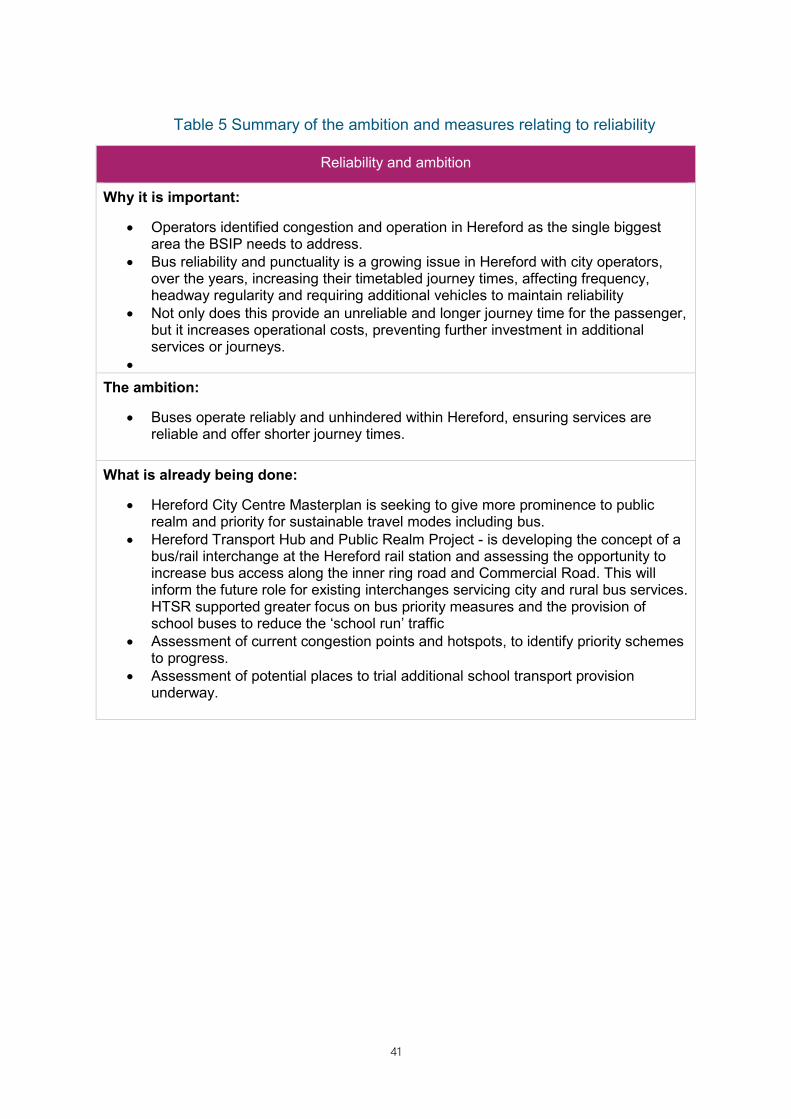
Table 5 Summary of the ambition and measures relating to reliability
Reliability and ambition
Why it is important:
• Operators identified congestion and operation in Hereford as the single biggest area the BSIP needs to address.
• Bus reliability and punctuality is a growing issue in Hereford with city operators, over the years, increasing their timetabled journey times, affecting frequency, headway regularity and requiring additional vehicles to maintain reliability
• Not only does this provide an unreliable and longer journey time for the passenger, but it increases operational costs, preventing further investment in additional services or journeys.
• The ambition:
• Buses operate reliably and unhindered within Hereford, ensuring services are reliable and offer shorter journey times.
What is already being done:
• Hereford City Centre Masterplan is seeking to give more prominence to public realm and priority for sustainable travel modes including bus.
• Hereford Transport Hub and Public Realm Project - is developing the concept of a bus/rail interchange at the Hereford rail station and assessing the opportunity to increase bus access along the inner ring road and Commercial Road. This will inform the future role for existing interchanges servicing city and rural bus services. HTSR supported greater focus on bus priority measures and the provision of school buses to reduce the ‘school run’ traffic
• Assessment of current congestion points and hotspots, to identify priority schemes to progress.
• Assessment of potential places to trial additional school transport provision underway.

42
Projects and schemes
No. BSIP Measure
Description Timescale
6,7 and 8.
Bus Priority Building on HTSR, congestion hotspots will be examined for potential interventions (traffic signal priority; bus lanes; bus gates). Feasibility studies will be undertaken and schemes brought forward in a phased approach, depending on funding available and relative benefit on reliability and journey time. Initial work has identified 3 areas to focus on:
• Belmont Rd – bus lane and priority towards the city centre.
• Newmarket St - bus lane and junction priority, supporting the development of the street as a key city interchange.
• Commercial Rd / Aylestone Hill – junction redevelopment and bus priority/bus lane towards city on Aylestone Hill
2022/23 – 2024/25
9. Enforcement and restrictions
Review across the whole county areas for increased enforcement, with the intention of developing redline routes in market towns. Funding to support the development and execution of TROs at key locations.
Considering enforcement, parking restrictions, loading restrictions etc,
2022/23 – 2024/25

43
Table 6 Summary of the ambition and measures for information and branding
Information and branding
Why it is important:
• Better information surrounding the buses, and it being easier to understand and obtain was the second highest BSIP priority for both bus users and non-users
• Information is sporadic across operators’ websites, with no consistency of format or information; some websites are difficult to find and navigate
• Smaller operators lack resource or skills to develop their own information in an accessible and up-to-date format
• Limited resource or capital for local operators to develop their own marketing campaigns or publicity
The ambition:
• An umbrella brand developed Transport for Herefordshire • Providing a single point of information for Herefordshire residents and visitors,
including timetables, maps, fares information and journey planning • Available via a range of mediums including app and web along with printed
information • Linked to wider active and sustainable travel across the county
What is already being done:
• HC produces and maintains a county bus map • HC maintains some provision of real time information • Free weekend travel for a year promotion • QR Codes linked to RTI being rolled out to most stops in Herefordshire during
early 2022

44
Projects and schemes
No. BSIP Measure Description Timescale
10. Transport for Herefordshire
Herefordshire Council leading a centralised, branded and coordinated approach to public transport information in all media, with all sources offering a complete picture of what is available, when and at what cost. This will improve understanding of travel options and make planning journeys easier.
2022/23-2024/25
11. Promotional and marketing campaigns
Enhance the image of bus and encourage modal shift, with campaigns specifically aimed at encouraging journeys to work by bus, leisure travel and sustainable tourism.
2023/24-2024/25

45
Table 7 Summary of the ambition and measures relating to ticketing and fares
Fares and ticketing
Why it is important:
• Buses accepting contactless payments was the third highest BSIP priority for both bus users and non-users
• For both users and non-users, the availability of a multi-operator ticket was cited in the top 5 reasons that would encourage them to use the bus more
• For young people, the cost of buses was one of the most significant barriers to use • Range of ticket offers across operators, but limited number of season and period
passes • No flexible ticketing arrangements to benefit those with flexible working
arrangements post-covid i.e. bundles/carnet tickets
The ambition:
• Ticketing products that are easily understood, simple to use and consistent across the entire public transport-network
• Single ticketing system that allows for travel across the whole of the bus network, regardless of operator
• Covers more than just bus, but cycle hire, car hire and potential expanding to rail • More affordable travel for those that need it
What is already being done:
• Free weekend travel promotion on all buses in Herefordshire (September 2021 – August 2022)
• HC ETM Loan scheme means that by the end of 2021 all operators will accept contactless ticket payment

46
Projects and schemes
No. BSIP Measure
Description Timescale
12. Ticketing and fares strategy
Review of ticketing and fare options and available technology to determine the most suitable options to be developed going forward, considering the needs of different groups, including young people, and future aspirational ticketing options.
Quick win project developing multi-operator tickets for all Herefordshire and Hereford city, allowing travel across different operators with minimal premium. Allowance for capital investment in ticket machine upgrades and supporting infrastructure
2022/23 – 2024/25
13. Mobile-ticketing solutions
Support and resource for local operators to provide mobile ticketing options to customers through existing suppliers (e.g. Mytrip).
2023/24

47
Table 8 Summary of the ambition for decarbonisation and supporting measures
Decarbonisation and supporting measures
Why it is important:
• Herefordshire declared a climate emergency in 2019, buses have a critical role to play in meeting the council objective of carbon neutrality by 2030
• With only 25% of the fleet in Herefordshire operating Euro VI engines, there is significant progress to be made
• Current grants for zero-emission vehicles require significant investment from the operator – with the majority of the network in Herefordshire provided by local operators (rather than larger national operators) these are financially unviable
• Regulatory challenge of more bespoke funding arrangements due to commercial competition in Hereford
• A safe to use and attractive bus network will support access for all members of the community
The ambition:
• The electrification of the urban bus fleet and, over time, the whole fleet • An attractive and safe network
What is already being done:
• Hereford City Council has secured funding from the Towns’ Fund to introduce the Hereford Zipper service operated by electric vehicles. It includes charging infrastructure sufficient for the scheme although with further investment it could be the basis for expanded provision to support the wider local bus fleet as more electric vehicles are brought into service.
• Hereford Enterprise Zone interested in converting the dedicated service that it supports to electric.

48
Projects and schemes
No. BSIP Measure Description Timescale
14. Electric vehicles Trials
Development of service 78X, serving the county’s biggest employment area, converted to fully electric vehicles. Additional resource built into the proposal brings opportunity to trial a number of fully electric park and choose services.
2022/23-2024/25
15. A service for all Operators putting disabled passengers at the heart of their service provision and playing a leading role in creating a more accessible transport system in Herefordshire, through training and resource (involvement in DfT’s Inclusive Transport Leaders Scheme).
2022/23 – 2023/24
16. Infrastructure development programme
In tandem with the Network Review, the development of an infrastructure programme to link bus and active travel modes through the development of 4 park and choose sites, travel hubs in key market towns and rolling programme of bus stop/shelter improvements, taking into account safe access and the needs of all users.
2022/23 – 2025+
17 Better cleaner buses
Through the wider network review, and development of the core and supporting network, improvements will come from development of the ‘quality’ element of the Council’s local bus contracts and network expectations set out and agreed in the Enhanced Partnership
2023/24 – 2024/25

49
Projects and schemes
18 Aspirational passenger charter
This will set out what passengers can expect in using any bus across Herefordshire and be consistent with neighbouring authorities for passengers travelling across the region.
It will be coupled with the inclusion of user representatives on the main Partnership Group overseeing the delivery of the EP.
2021
The BSIP as a foundation 4.3 The BSIP provides a foundation for the transformation of the Herefordshire bus
network over the next 3 years. However, Herefordshire Council’s ambition goes further. As the BSIP is reviewed and updated each year, the opportunity will be taken to set out that greater ambition, including electrification of the entire fleet.
Phased implementation 4.4 The 18 different BSIP measures or schemes within the tables above are not discrete
packages of work. There is a significant amount of dependency between them, with maximum impact achieved if they are all funded and able to be implemented in parallel (in a phased way) as part of an overall programme.
4.5 Important elements to take forward will be the bus priority schemes within Hereford, as they will have wide benefit for bus services generally and give a strong indication that improvements are taking place.
4.6 In parallel, a full review of the county’s bus network will be undertaken, in order to define what the future enhanced network and levels of service look like in accordance with the agreed hierarchy relating to core and supporting services. This will be planned in a coordinated way with regular clockface timetables, connecting services and feeder services. New patterns of service will be introduced on core services, including improved evening and Sunday provision. These routes will be the first to see enhanced bus stop infrastructure and information provision and roll out of the network branding.
4.7 Monitoring of these early improvements will help in the design and introduction of later improvements to other core services.
4.8 Improved supporting services will be introduced once the enhanced core network is in place, again on a phased approach. Demand responsive transport service will be trialled. This will be based on one of the market towns, providing semi-scheduled
50
feeder journeys into the market town, connecting with the core network. Associated with this will be the introduction of a hub with improved waiting infrastructure. By this stage, it will be important to have multi-operator ticketing in place to facilitate easy transfer between services.
4.9 Throughout the period of implementing the service enhancements there will be significant marketing and promotion to highlight the transformation and the travel opportunities provided. This will be accompanied by network-wide branding and provision of comprehensive information about routes, times and fares, coordinated by the enlarged team within Herefordshire Council.
4.10 Given the current network, and scale of the aspirations outlined in the BSIP, the full transformation of the network will take over 5 years to achieve.
Funding and priorities 4.11 The total funding requirement for the BSIP in Herefordshire over 3 years 2022/23 to
2024/25 is £18,130,000. Recognising the importance and need for infrastructure to improve priority to be in place ahead of the new network being delivered, there is a focus on developing and delivering bus priority measures in the first two years whilst the network is reviewed, ‘easy’ wins implemented and core network developed.
4.12 These costs are inclusive of resource to define, plan, deliver, monitor and evaluate the schemes and measures to be delivered through the BSIP.
4.13 Additionally, it is estimated that a further £3,490,000 funding will be required each year after 2025. This annual figure is representative of the average revenue and capital requirement considering a 5-year period after the initial BSIP fund. Revenue and capital would need to be higher in the earlier years (2025/26 estimated at £4.9m required), but should reduce as the network settles and patronage increases.
4.14 The rural nature of the area and challenges faced means that, to achieve the aspirational network for Herefordshire, a commitment to ongoing funding in the long term will be vital to sustain the network.

51
5. Reporting 5.1 Each workstream and some individual projects will have their own implementation
plans, with a designated project lead to coordinate and oversee progress.
5.2 In the short term, the expanded Herefordshire Bus Partnership will continue to meet monthly to monitor progress and take responsibility for the development and agreement of appropriate EP Schemes to gain suitable commitments to facilitate delivery of the various schemes and projects. This Group will receive monitoring reports and guide the implementation of the BSIP.
5.3 6-monthly monitoring reports will be produced, providing an update on implementation and assessing progress towards the targets set. These reports will be published on the Council’s website, as detailed below.
5.4 In the longer term, there will be a designated person responsible for overall monitoring, collection, and collation of data, to assess progress with expected outputs/outcomes and towards targets.
5.5 The Herefordshire Bus Partnership will be responsible for overseeing the updating and revising of the BSIP annually, to reflect changing circumstances; new challenges and opportunities; public feedback in annual satisfaction surveys; completed projects and schemes; and emerging ideas for improvement and/or funding.
5.6 A record of actions to address any under performance and a copy of the report will be published by Herefordshire Council on its website.

52
6. Overview Table 9 Overview of the Herefordshire BISP and EP
Name of authority Herefordshire Council
Franchising or Enhanced Partnership (or both) Enhanced Partnership
Date of publication 31st October 2021
Date of next annual update 31st October 2022
URL of published report www.herefordshire.gov.uk/bsip
Targets Description of measure
2018/19 2019/20 Targets for 2024/25
Journey time Average bus speed (am peak)
- 14.7mph 5% increase in bus speed
Reliability Non-frequent bus services running on time (within 1min early, 5mins late)
78% 79% 86%
Passenger numbers
Total passenger journeys on the whole bus network
2.05 million 1.79 million 2.4million
Average passenger satisfaction
% of surveyed users who we dissatisfied with elements of the current networks
- 34% 27%
Delivery - Does your BSIP detail policies to:
Yes/No Explanation (max 50 words)
Make improvements to bus services and planning
More frequent and reliable services
Review service frequency Yes Measure 1 – A review of the entire network will ensure that timetables are co-ordinated to address current inadequacies
Scheme 2/3/4 – will provide increased service frequencies on specified routes
Increase bus priority measures
Yes Measure 6/7/8 – will deliver bus priority measures along the network at points identified within the scheme description

53
Delivery - Does your BSIP detail policies to:
Yes/No Explanation (max 50 words)
Scheme 9 – will deliver enforcement measures including parking and loading measures to reduce bus delays.
Increase demand responsive services
Yes Measure 4 – will address the potential for DRT, beginning with a trial, with a view to roll out to replace infrequent rural services.
Consideration of bus rapid transport networks
No N/A
Improvements to planning / integration with other modes
Integrate services with other transport modes
Yes Measure 1/12/16 – will facilitate integration of bus with active travel modes.
Simplify services Yes Measure 1/2/3/4 will see a redevelopment of the network in line with simple and consistent criteria across services types across the whole of the county
Review socially necessary services
Yes Measure 1 – The entire network will be replanned meaning that all supported services will be reviewed.
Measure 3 – The development of a supporting network will enhance the bus provision for the local community.
Measure 4 – will address how DRT will play a part in providing socially necessary journeys
Invest in Superbus networks
No N/A
Improvements to fares and ticketing
Lower fares Yes Measure 12/13 the development of an MOT will reduce costs to the passengers making multiple trips on more than one bus service
Simplify fares Yes Measure 13 – mobile ticketing will allow for quick and easy purchasing of the correct ticket type for a specific journey
Scheme 12 – multi operator ticketing will allow seamless travel between operators with minimal premium
Integrate ticketing between operators and transport modes
Yes Measure 12 – will address multi- operator ticketing, allowing travel across all operators in Herefordshire and Hereford City
Make improvements to bus passenger experience
Higher specification buses
Invest in improved bus specifications
Yes Measure 14 – investment in electric vehicles on specific routes

54
Delivery - Does your BSIP detail policies to:
Yes/No Explanation (max 50 words)
Measure 15 – the development of the core and supported network with include a ‘quality’ element of local bus contracts to ensure that expectations are met.
Measure 16 – to set out expectations of the bus in Herefordshire
Invest in accessible and inclusive bus services
Yes Measure 17 – a commitment to providing an accessible transport system in Herefordshire, with great consideration for disabled passengers
Protect personal safety of bus passengers
Measure 16 – will address what passengers should expect from buses in Herefordshire and what to do if expectations are not met.
Improve buses for tourists Yes Measure 10 – Targeted promotional campaigns with a focus on sustainable tourism
Invest in decarbonisation Yes Measure 14 - investment in electric vehicles on specific routes
Improvements to passenger engagement
Passenger charter Yes Measure 16 – will provide an aspirational passenger charter
Strengthen network identity
Yes Measure 9 – Transport for Herefordshire will provide network identity.
Measure 10 – targeted promotional campaigns to target specific user groups.
Improve bus information Yes Measure 9 - a co-ordinated approach to public transport information, making it more accessible and easier to understand, with a complete picture of what is available and the associated costs
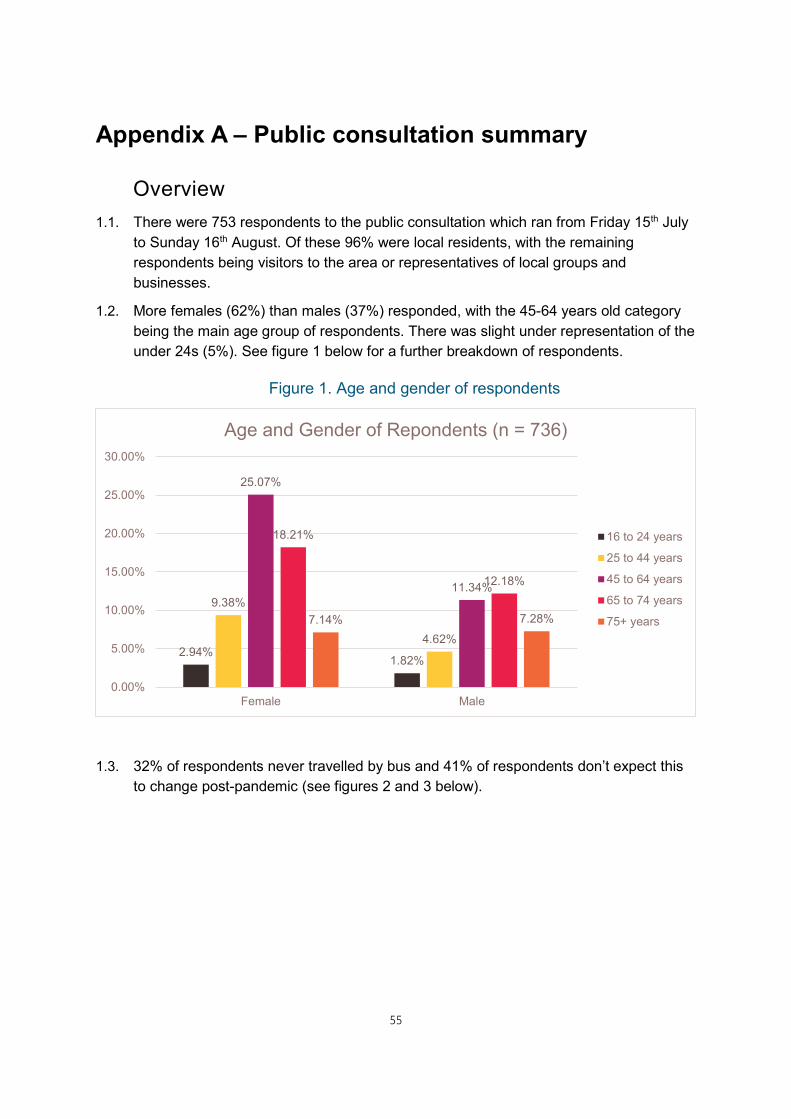
55
Appendix A – Public consultation summary
Overview 1.1. There were 753 respondents to the public consultation which ran from Friday 15th July
to Sunday 16th August. Of these 96% were local residents, with the remaining respondents being visitors to the area or representatives of local groups and businesses.
1.2. More females (62%) than males (37%) responded, with the 45-64 years old category being the main age group of respondents. There was slight under representation of the under 24s (5%). See figure 1 below for a further breakdown of respondents.
Figure 1. Age and gender of respondents
1.3. 32% of respondents never travelled by bus and 41% of respondents don’t expect this to change post-pandemic (see figures 2 and 3 below).
2.94%1.82%
9.38%
4.62%
25.07%
11.34%
18.21%
12.18%
7.14% 7.28%
0.00%
5.00%
10.00%
15.00%
20.00%
25.00%
30.00%
Female Male
Age and Gender of Repondents (n = 736)
16 to 24 years
25 to 44 years
45 to 64 years
65 to 74 years
75+ years

56
Figure 2. Bus frequency
Figure 3. Post-Covid expected bus use
6.65%
14.11%12.08%
10.04%
24.97%
32.16%
0.00%
5.00%
10.00%
15.00%
20.00%
25.00%
30.00%
35.00%
5 or more daysa week
2-4 days a week Once a week Once a month Less than oncea month
Never
Bus travel frequency pre-Covid 19 pandemic (n = 737)
25%
61%
14%
Do you envisage your work pattern changing post-Covid 19 pandemic? (n = 733)
Yes
No
Don't know

57
1.4. The greatest use of bus was to go shopping, followed by social, including visiting friends and family, and healthcare appointments (see figure 4 below)
Figure 4. Reasons for bus travel
Satisfaction with current bus services
Bus users 1.5. Amongst bus users (those who responded as having used the bus at least once -
68%), the satisfaction with local bus provision can be seen overleaf (figure 5).
1.6. The areas of greatest satisfaction were journey length, distance to the bus stop and reliability.
1.7. The areas of least satisfaction were hours of operation, facilities to cater for disabilities (although this category also received the most “don’t know” responses), and frequency of services.
0 50 100 150 200 250 300 350
Education (including taking children to school)
Travel during course of employment / business
Travel to and from work
Exercise or leisure
Health or medical appointment
Social, including to meet with or visit friends orrelatives
I did not use local bus services
Shopping
Most frequent reason for using the bus (pre-Covid 19 pandemic) (n = 309)

58
1.8. Alongside facilities to cater for a disability, the categories that received the most “don’t know” responses were multi-operator tickets (32%), intermodal services (16%) and cost of fares (13%).
Figure 5. Satisfaction with bus services - users
Non-bus users 1.9. Of those who responded as never having used the buses in Herefordshire (32%),
satisfaction with local bus provision can be seen below (figure 6).
1.10. Although these respondents will have less experience of bus services, the areas of (perceived) satisfaction were the distance to bus stops, ability to plan journeys and journey length – suggesting some respondents have considered using the bus.

59
Figure 6. Satisfaction with bus provision - non-users
2. Barriers to bus use 2.1 Amongst both users and non-users of the bus the main barrier to using the bus as
opposed to the car is that buses are unavailable when needed and that they are not frequent enough.
2.2 For the most part the reasons bus users give for opting for the car align with non-bus users, however there is a perception amongst non-users that the bus is a more complicated way to travel. This is summarised in figure 7 below.
4% 14%
10%
9%
6%
6%
4%
2%
3%
2%
2%
22%
14%
17%
20%
20%
14%
20%
10%
20%
8%
10%
15%
19%
8%
13%
18%
8%
24%
5%
22%
17%
22%
16%
13%
11%
25%
12%
33%
6%
33%
34%
38%
39%
52%
49%
39%
57%
30%
68%
35%
0% 10% 20% 30% 40% 50% 60% 70% 80% 90% 100%
Distance to the bus stop
Availability of information to plan journeys
Journey length
Reliability of service
Stations / stops that allow modal interchange
Cost of fares
Ability to use one ticket on any bus
Frequency of service
Facilities to cater for a disability
Hours of operation
Satisfaction with local bus service provision (non-users)
Very satisfied Satisfied Neither satisfied nor dissatisfied Dissatisfied Very dissatisfied Don’t know

60
Figure 7. Reasons for using the car over the bus
15
22
14
27
46
32
58
67
103
78
116
123
121
139
155
11
16
17
24
32
60
68
77
92
108
132
139
153
213
233
0 50 100 150 200 250
My car is more environmentally friendly
I don’t know how or where to get the bus
Difficulty due to a disability, mobility difficulty, orhealth condition
I feel safer in the car
I have to combine multiple journies into one
I am worried about the spread of Covid-19
I have too much baggage to carry to/from/on a bus
Parking and fuel is cheaper than the equivalent busjourney
It is less complicated to travel by car
I worry that the bus will be unreliable
It is significantly quicker than the bus
Buses do not go to the places I need to get to
The car is more convenient
Buses are not frequent enough
Buses are not available at the times I need them
Reasons for using the car instead of the bus (n = 414)
User Non-user

61
3. BSIP priorities 3.1 The factor which would make respondents use the bus more was more frequent
services (87%), followed by information surrounding the buses being easier to understand and obtain (76%) and longer operating hours (75%). This correlates with the main reasons for travelling by car rather than bus being that buses are not available when needed, they’re infrequent and don’t go to the places people wish to travel to. Over half of respondents felt that the car was quicker and more convenient than the bus.
3.2 Actual bus quality, such as Wi-Fi provision and vehicle cleanliness were deemed far less important than frequent and reliable services.
3.3 Despite 50% of people not being satisfied with the cost of fares, lower fares ranked 11th out of 19 bus improvement methods, with multi-operator tickets and contactless payments being higher ranked.
3.4 These can be seen summarised in figure 8 below.

62
Figure 8.BSIP priorities
3.5 For both users and non-users, the top four priorities were aligned, with more frequent services being the highest priority (88% and 83% respectively), followed by information about journeys being easier to obtain and use (79% and 74%), contactless payments being number 3 (78% and 73%) and more destinations served at 72% and 71%.
3.6 For bus users the fifth most requested change to bus services was multi-operator tickets (69%) followed by later hours of operation (68%). For non-users these were reversed with later hours of operation being a higher priority (68%) than multi-operator tickets (67%).
13%
15%
25%
23%
19%
35%
31%
34%
41%
25%
30%
33%
38%
34%
46%
44%
48%
51%
56%
20%
22%
23%
30%
38%
26%
28%
28%
22%
38%
33%
31%
29%
33%
23%
28%
28%
24%
31%
34%
26%
22%
27%
29%
17%
21%
19%
15%
23%
20%
20%
15%
21%
14%
14%
12%
13%
7%
27%
16%
16%
14%
10%
12%
15%
13%
12%
10%
11%
9%
10%
8%
11%
9%
8%
9%
5%
6%
21%
14%
5%
4%
9%
5%
7%
9%
4%
5%
7%
9%
4%
6%
5%
3%
3%
2%
0% 10% 20% 30% 40% 50% 60% 70% 80% 90% 100%
Availability of wi-fi
Better facilities to cater for disabilities
Pre-bookable on demand services
Vehicle quality and cleanliness
Quicker journeys
Simplified fares
Greener buses
Sunday services
Lower fares
High quality customer service
Better on-bus information
Better intermodal connections
Multi-operator tickets
Better bus stops or shelters
Contactless payment
Serving more destinations
Easier to use/obtain information
Operating later in the evening
More frequent services
Would the following make you personally, or the people whose views you represent, use local buses in
Herefordshire more? (n = 690)
A great deal To some extent Not very much Not at all Don’t know

63
3.7 For both groups the provision of Wi-Fi was the least popular measure with only 41% of users and 34% of non-users indicating it would encourage them to use the bus more.
3.8 For both categories an increased provision of facilities for disabled people were the poorly ranked (32-33%), however amongst disabled respondents this increased to 60% for users and 55% for non-users.
3.9 An increase in Sunday services was also ranked as a low priority with 46% of users and 47% of non-users indicating it would increase their likelihood of using the bus.
Business and group representatives 3.10 Figure 9 (below) shows the BSIP priorities for business and group representatives.
Whilst this was a small sample size of 11 it highlights the differing priorities compared to the general public.
3.11 More frequent services had 100% popularity, making it the top priority which echoes the views of local residents. Contactless payment was equally prioritised by representatives, whereas it ranked 3rd in the general results. This is followed by easier to use and obtain information, again 100% but with a higher proportion of “To some extent” respondents, which was a high priority for local residents.
3.12 The lowest priority for business and group representatives was more Sunday services (40%) compared to 62% for general responses, this is not unexpected given most business don’t operate on a Sunday. The provision of Wi-Fi, which was the lowest ranked priority generally (33%) was ranked 13/19 for representatives (70%), possibly to encourage work whilst travelling. Pre-bookable services and vehicle cleanliness and quality ranked lowly in priorities for both representatives and general respondents.

64
Figure 9. BSIP priorities for business and group representatives
4. Results by age demographics 4.1 Figure 10 shows that overall respondents under 24 are not happy with local bus
services. Under 24s are most satisfied with the reliability of the service (45%), followed by journey length (36%) – however although these are the categories with the highest levels of satisfaction over half of respondents are not happy with them.
4.2 The cost of fares was the area of least satisfaction, with only 3% of respondents feeling “satisfied” and none responding as “very satisfied”.
20%
27%
9%
18%
40%
55%
18%
18%
36%
55%
40%
27%
45%
9%
64%
45%
55%
55%
20%
18%
36%
55%
45%
30%
9%
55%
55%
36%
18%
40%
55%
36%
73%
27%
55%
45%
45%
40%
45%
55%
36%
27%
30%
36%
9%
18%
18%
18%
20%
18%
18%
18%
9%
20%
9%
9%
10%
18%
9%
9%
9%
9%
0% 10% 20% 30% 40% 50% 60% 70% 80% 90% 100%
Sunday services
Pre-bookable on demand services
Vehicle quality and cleanliness
Quicker journeys
High quality customer service
Availability of wi-fi
Lower fares
Greener buses
Better on-bus information
Better intermodal connections
Operating later in the evening
Serving more destinations
Better bus stops or shelters
Simplified fares
Better facilities to cater for disabilities
Multi-operator tickets
Easier to use/obtain information
Contactless payment
More frequent services
Would the following make the people whose views you represent use local buses in Herefordshire more? (n =
11)
A great deal To some extent Not very much Not at all Don’t know

65
4.3 Hours of operation was the second least satisfied category (6%) and the option with the most active dissatisfaction (88%). Cost of fares also received large amounts of dissatisfaction (76%), followed by frequency of service (75%).
Figure 10. Satisfaction with local bus service provision of 16-24 year olds (n=34)
4.4 As shown in figure 11 there are discrepancies in priorities between age groups.
4.5 The most popular improvement measure for those under 25 was lower fares (76%) and contactless payments (76%). In both these categories these received more enthusiasm by the 25-64 category (84% and 81% respectively) and less enthusiasm for those aged 65+ (49% and 62%).
4.6 The second most popular category for 16-24 year olds was later hours of operation and more frequent services (71%). More frequent services was 25-64 year olds highest priority (90%) and over 65s’s (89%), however operating later in the evening only received 70% of positive responses for those aged 65+; it did however rank as 25-64 year olds second priority (85%).
9%
9%
15%
6%
3%
3%
3%
36%
27%
12%
15%
12%
12%
9%
6%
6%
3%
15%
24%
18%
15%
38%
12%
26%
44%
3%
21%
9%
21%
27%
26%
3%
33%
24%
3%
32%
26%
30%
0%
18%
26%
32%
42%
24%
24%
56%
50%
9%
12%
12%
15%
21%
0% 10% 20% 30% 40% 50% 60% 70% 80% 90% 100%
Reliability of service
Journey length
Distance to the bus stop
Availability of information to plan journeys
Stations / stops that allow modal interchange
Frequency of service
Ability to use one ticket on any bus
Facilities to cater for a disability
Hours of operation
Cost of fares
Very satisfied Satisfied
Neither satisfied nor dissatisfied Dissatisfied
Very dissatisfied Don't know
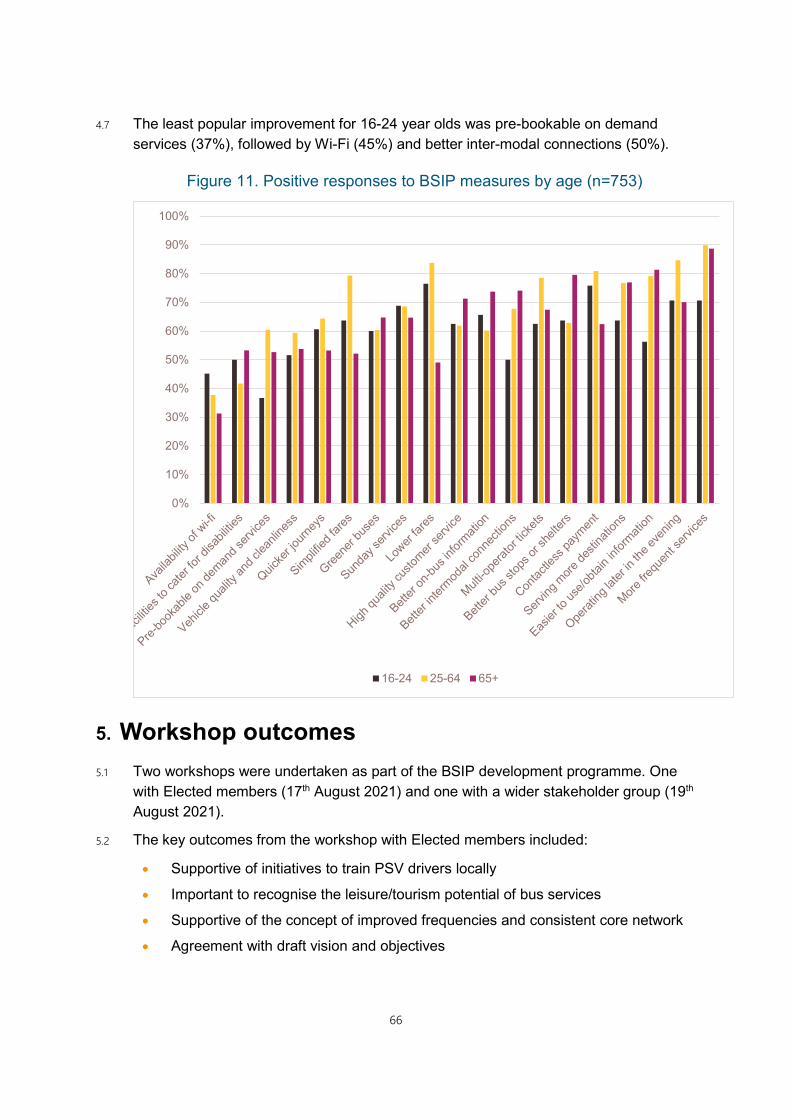
66
4.7 The least popular improvement for 16-24 year olds was pre-bookable on demand services (37%), followed by Wi-Fi (45%) and better inter-modal connections (50%).
Figure 11. Positive responses to BSIP measures by age (n=753)
5. Workshop outcomes 5.1 Two workshops were undertaken as part of the BSIP development programme. One
with Elected members (17th August 2021) and one with a wider stakeholder group (19th August 2021).
5.2 The key outcomes from the workshop with Elected members included:
• Supportive of initiatives to train PSV drivers locally
• Important to recognise the leisure/tourism potential of bus services
• Supportive of the concept of improved frequencies and consistent core network
• Agreement with draft vision and objectives
0%
10%
20%
30%
40%
50%
60%
70%
80%
90%
100%
16-24 25-64 65+

67
5.3 The key outcomes from the workshop with Stakeholders included:
• Desire to see more consistent provision / improved frequencies (hourly service on core routes 0700 – 2200 on 7 days per week
• More links between market towns (e.g. Kington – Leominster)
• Concerns around the operation / image of City Bus Station
• Herefordshire Council should take lead in information provision
Vision and objectives – more ambition and more explicit objectives

68
Appendix B – letters of support from local bus operators

69

70

71

72

73

74

Integrated Transport Planning Ltd Charles House 148 Great Charles Street Birmingham B3 3HT UK +44 (0)121 285 7301 Integrated Transport Planning Ltd 2 Abbey Gardens Great College Street, Westminster London SW1P 3NL UK +44 (0)7498 563196 Integrated Transport Planning Ltd 1 Broadway Nottingham NG1 1PR UK +44 (0)115 824 8250 www.itpworld.net

Integrated Transport Planning Ltd Page 76 28/10/2021
Version number 2
This page is left intentionally blank