heritage intermediate school school accountability report
TRANSCRIPT
2015-16 School Accountability Report Card for Heritage Intermediate School Page 1 of 13
Heritage Intermediate School
School Accountability Report Card
Reported Using Data from the 2015-16 School Year
Published During 2016-17
By February 1 of each year, every school in California is required by state law to publish a School Accountability Report Card (SARC). The SARC contains information about the condition and performance of each California public school. Under the Local Control Funding Formula (LCFF) all local educational agencies (LEAs) are required to prepare a Local Control and Accountability Plan (LCAP), which describes how they intend to meet annual school-specific goals for all pupils, with specific activities to address state and local priorities. Additionally, data reported in an LCAP is to be consistent with data reported in the SARC. • For more information about SARC requirements, see the California Department of Education (CDE) SARC Web page at
http://www.cde.ca.gov/ta/ac/sa/. • For more information about the LCFF or LCAP, see the CDE LCFF Web page at http://www.cde.ca.gov/fg/aa/lc/. • For additional information about the school, parents/guardians and community members should contact the school principal or
the district office. DataQuest DataQuest is an online data tool located on the CDE DataQuest Web page at http://dq.cde.ca.gov/dataquest/ that contains additional information about this school and comparisons of the school to the district and the county. Specifically, DataQuest is a dynamic system that provides reports for accountability (e.g., test data, enrollment, high school graduates, dropouts, course enrollments, staffing, and data regarding English learners). Internet Access Internet access is available at public libraries and other locations that are publicly accessible (e.g., the California State Library). Access to the Internet at libraries and public locations is generally provided on a first-come, first-served basis. Other use restrictions may include the hours of operation, the length of time that a workstation may be used (depending on availability), the types of software programs available on a workstation, and the ability to print documents.
About This School Contact Information (School Year 2016-17)
School Contact Information
School Name------- Heritage Intermediate School
Street------- 13766 S. Heritage Circle
City, State, Zip------- Fontana, CA 92336
Phone Number------- 909.357.1345
Principal------- Laura Rowland
E-mail Address------- [email protected]
Web Site------- teacherweb.com/CA/HIS
CDS Code 36677026119630
2015-16 School Accountability Report Card for Heritage Intermediate School Page 2 of 13
District Contact Information
District Name------- Etiwanda School District
Phone Number------- 909.899.2451
Superintendent-------
Shawn Judson, Ed.D.
E-mail Address------- [email protected]
Web Site------- www.etiwanda.org
School Description and Mission Statement (School Year 2016-17)
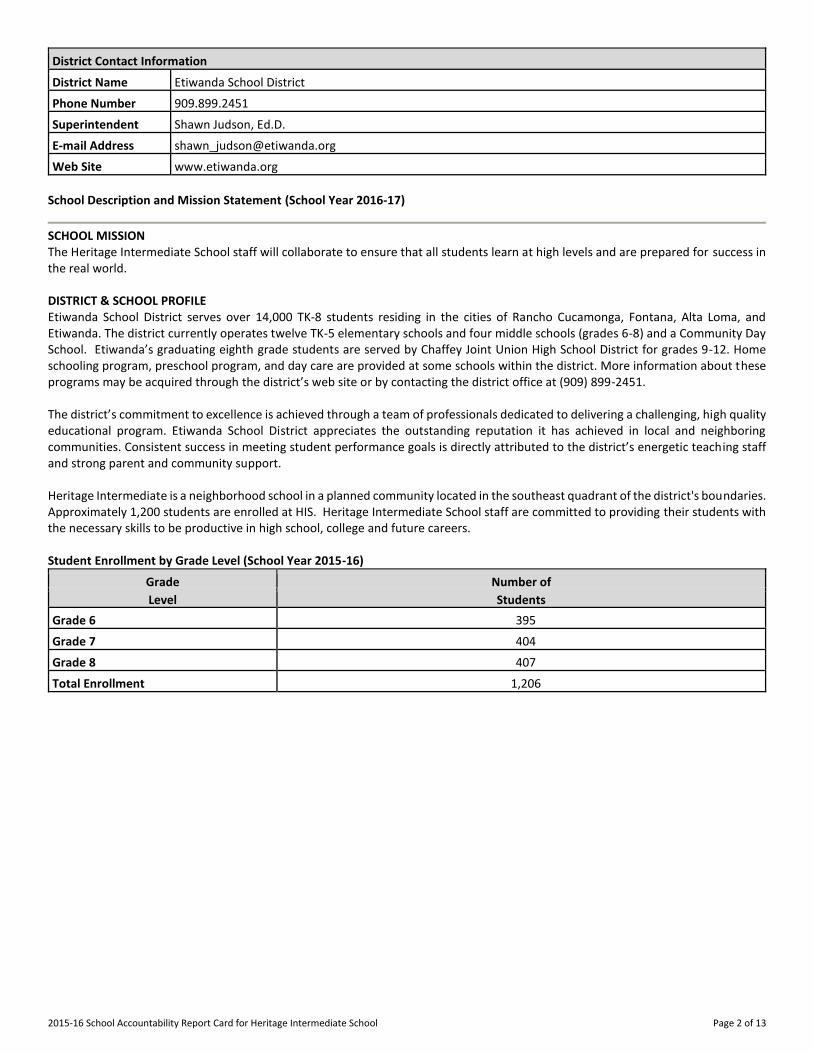
SCHOOL MISSION The Heritage Intermediate School staff will collaborate to ensure that all students learn at high levels and are prepared for success in the real world. DISTRICT & SCHOOL PROFILE Etiwanda School District serves over 14,000 TK-8 students residing in the cities of Rancho Cucamonga, Fontana, Alta Loma, and Etiwanda. The district currently operates twelve TK-5 elementary schools and four middle schools (grades 6-8) and a Community Day School. Etiwanda’s graduating eighth grade students are served by Chaffey Joint Union High School District for grades 9-12. Home schooling program, preschool program, and day care are provided at some schools within the district. More information about these programs may be acquired through the district’s web site or by contacting the district office at (909) 899-2451. The district’s commitment to excellence is achieved through a team of professionals dedicated to delivering a challenging, high quality educational program. Etiwanda School District appreciates the outstanding reputation it has achieved in local and neighboring communities. Consistent success in meeting student performance goals is directly attributed to the district’s energetic teaching staff and strong parent and community support. Heritage Intermediate is a neighborhood school in a planned community located in the southeast quadrant of the district's boundaries. Approximately 1,200 students are enrolled at HIS. Heritage Intermediate School staff are committed to providing their students with the necessary skills to be productive in high school, college and future careers. Student Enrollment by Grade Level (School Year 2015-16)
Grade Number of
Level Students
Grade 6 395
Grade 7 404
Grade 8 407
Total Enrollment 1,206
2015-16 School Accountability Report Card for Heritage Intermediate School Page 3 of 13
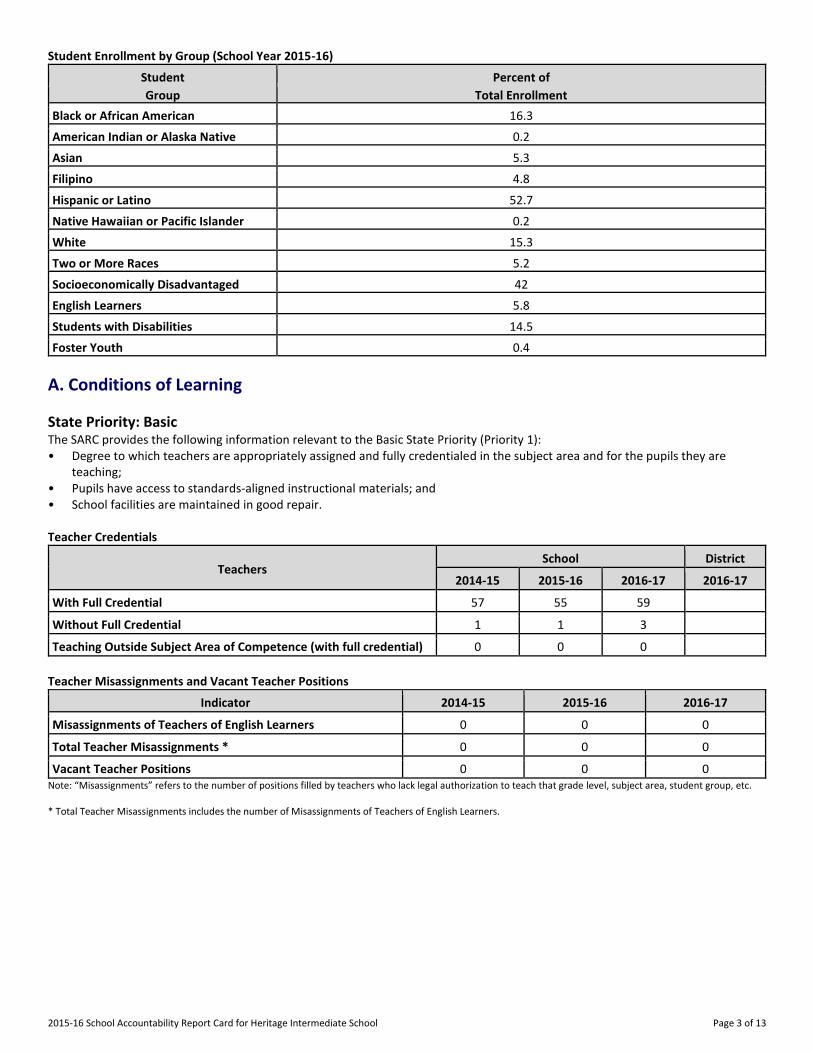
Student Enrollment by Group (School Year 2015-16)
Student Percent of
Group Total Enrollment
Black or African American 16.3
American Indian or Alaska Native 0.2
Asian 5.3
Filipino 4.8
Hispanic or Latino 52.7
Native Hawaiian or Pacific Islander 0.2
White 15.3
Two or More Races 5.2
Socioeconomically Disadvantaged 42
English Learners 5.8
Students with Disabilities 14.5
Foster Youth 0.4
A. Conditions of Learning
State Priority: Basic The SARC provides the following information relevant to the Basic State Priority (Priority 1): • Degree to which teachers are appropriately assigned and fully credentialed in the subject area and for the pupils they are
teaching; • Pupils have access to standards-aligned instructional materials; and • School facilities are maintained in good repair. Teacher Credentials
Teachers School District
2014-15 2015-16 2016-17 2016-17
With Full Credential 57 55 59
Without Full Credential 1 1 3
Teaching Outside Subject Area of Competence (with full credential) 0 0 0
Teacher Misassignments and Vacant Teacher Positions
Indicator 2014-15 2015-16 2016-17
Misassignments of Teachers of English Learners 0 0 0
Total Teacher Misassignments * 0 0 0
Vacant Teacher Positions 0 0 0 Note: “Misassignments” refers to the number of positions filled by teachers who lack legal authorization to teach that grade level, subject area, student group, etc. * Total Teacher Misassignments includes the number of Misassignments of Teachers of English Learners.
2015-16 School Accountability Report Card for Heritage Intermediate School Page 4 of 13
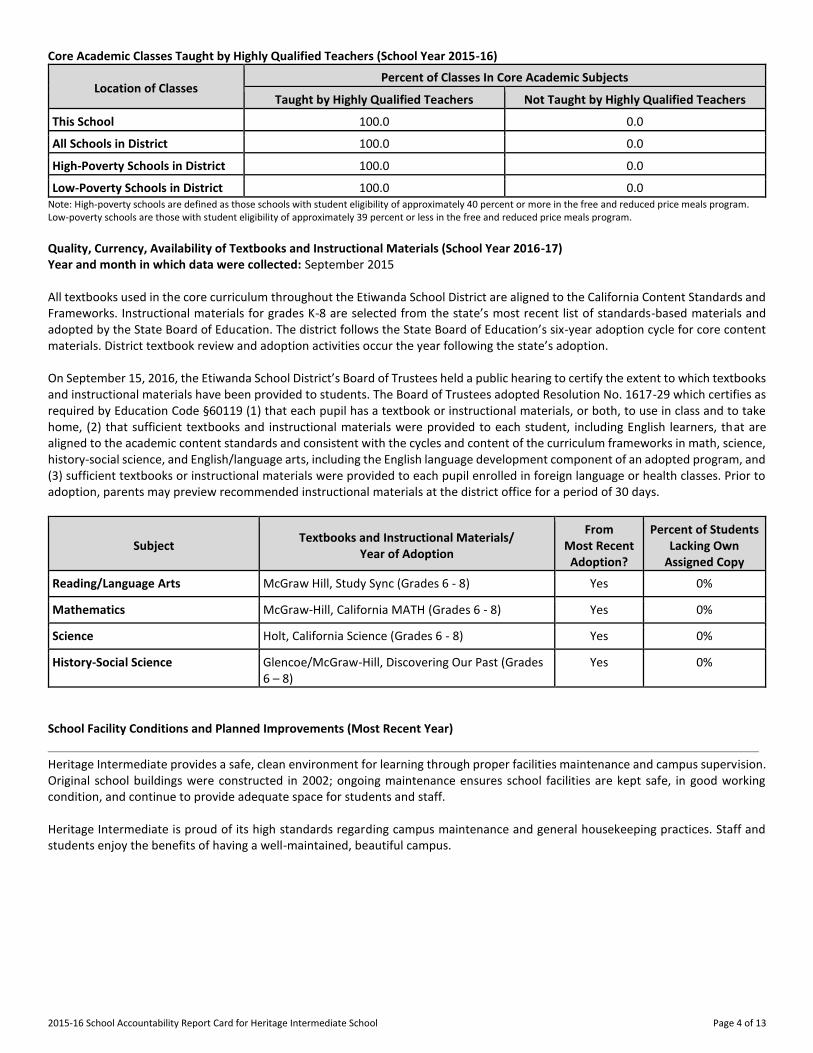
Core Academic Classes Taught by Highly Qualified Teachers (School Year 2015-16)
Location of Classes Percent of Classes In Core Academic Subjects
Taught by Highly Qualified Teachers Not Taught by Highly Qualified Teachers
This School 100.0 0.0
All Schools in District 100.0 0.0
High-Poverty Schools in District 100.0 0.0
Low-Poverty Schools in District 100.0 0.0 Note: High-poverty schools are defined as those schools with student eligibility of approximately 40 percent or more in the free and reduced price meals program. Low-poverty schools are those with student eligibility of approximately 39 percent or less in the free and reduced price meals program. Quality, Currency, Availability of Textbooks and Instructional Materials (School Year 2016-17) Year and month in which data were collected: September 2015 All textbooks used in the core curriculum throughout the Etiwanda School District are aligned to the California Content Standards and Frameworks. Instructional materials for grades K-8 are selected from the state’s most recent list of standards-based materials and adopted by the State Board of Education. The district follows the State Board of Education’s six-year adoption cycle for core content materials. District textbook review and adoption activities occur the year following the state’s adoption. On September 15, 2016, the Etiwanda School District’s Board of Trustees held a public hearing to certify the extent to which textbooks and instructional materials have been provided to students. The Board of Trustees adopted Resolution No. 1617-29 which certifies as required by Education Code §60119 (1) that each pupil has a textbook or instructional materials, or both, to use in class and to take home, (2) that sufficient textbooks and instructional materials were provided to each student, including English learners, that are aligned to the academic content standards and consistent with the cycles and content of the curriculum frameworks in math, science, history-social science, and English/language arts, including the English language development component of an adopted program, and (3) sufficient textbooks or instructional materials were provided to each pupil enrolled in foreign language or health classes. Prior to adoption, parents may preview recommended instructional materials at the district office for a period of 30 days.
Subject Textbooks and Instructional Materials/
Year of Adoption
From Most Recent
Adoption?
Percent of Students Lacking Own
Assigned Copy
Reading/Language Arts McGraw Hill, Study Sync (Grades 6 - 8) Yes 0%
Mathematics McGraw-Hill, California MATH (Grades 6 - 8) Yes 0%
Science Holt, California Science (Grades 6 - 8) Yes 0%
History-Social Science Glencoe/McGraw-Hill, Discovering Our Past (Grades 6 – 8)
Yes 0%
School Facility Conditions and Planned Improvements (Most Recent Year)
Heritage Intermediate provides a safe, clean environment for learning through proper facilities maintenance and campus supervision. Original school buildings were constructed in 2002; ongoing maintenance ensures school facilities are kept safe, in good working condition, and continue to provide adequate space for students and staff. Heritage Intermediate is proud of its high standards regarding campus maintenance and general housekeeping practices. Staff and students enjoy the benefits of having a well-maintained, beautiful campus.
2015-16 School Accountability Report Card for Heritage Intermediate School Page 5 of 13
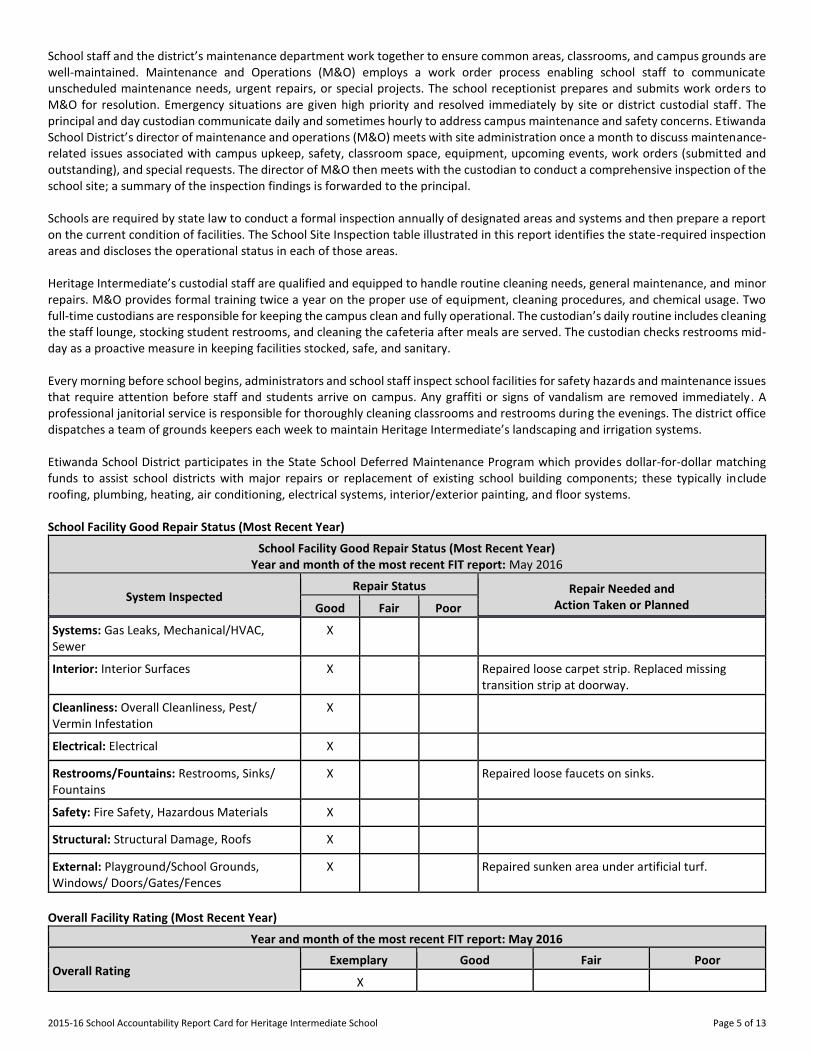
School staff and the district’s maintenance department work together to ensure common areas, classrooms, and campus grounds are well-maintained. Maintenance and Operations (M&O) employs a work order process enabling school staff to communicate unscheduled maintenance needs, urgent repairs, or special projects. The school receptionist prepares and submits work orders to M&O for resolution. Emergency situations are given high priority and resolved immediately by site or district custodial staff. The principal and day custodian communicate daily and sometimes hourly to address campus maintenance and safety concerns. Etiwanda School District’s director of maintenance and operations (M&O) meets with site administration once a month to discuss maintenance-related issues associated with campus upkeep, safety, classroom space, equipment, upcoming events, work orders (submitted and outstanding), and special requests. The director of M&O then meets with the custodian to conduct a comprehensive inspection of the school site; a summary of the inspection findings is forwarded to the principal. Schools are required by state law to conduct a formal inspection annually of designated areas and systems and then prepare a report on the current condition of facilities. The School Site Inspection table illustrated in this report identifies the state-required inspection areas and discloses the operational status in each of those areas. Heritage Intermediate’s custodial staff are qualified and equipped to handle routine cleaning needs, general maintenance, and minor repairs. M&O provides formal training twice a year on the proper use of equipment, cleaning procedures, and chemical usage. Two full-time custodians are responsible for keeping the campus clean and fully operational. The custodian’s daily routine includes cleaning the staff lounge, stocking student restrooms, and cleaning the cafeteria after meals are served. The custodian checks restrooms mid-day as a proactive measure in keeping facilities stocked, safe, and sanitary. Every morning before school begins, administrators and school staff inspect school facilities for safety hazards and maintenance issues that require attention before staff and students arrive on campus. Any graffiti or signs of vandalism are removed immediately. A professional janitorial service is responsible for thoroughly cleaning classrooms and restrooms during the evenings. The district office dispatches a team of grounds keepers each week to maintain Heritage Intermediate’s landscaping and irrigation systems. Etiwanda School District participates in the State School Deferred Maintenance Program which provides dollar-for-dollar matching funds to assist school districts with major repairs or replacement of existing school building components; these typically include roofing, plumbing, heating, air conditioning, electrical systems, interior/exterior painting, and floor systems. School Facility Good Repair Status (Most Recent Year)
School Facility Good Repair Status (Most Recent Year) Year and month of the most recent FIT report: May 2016
System Inspected Repair Status Repair Needed and
Action Taken or Planned Good Fair Poor
Systems: Gas Leaks, Mechanical/HVAC, Sewer
X
Interior: Interior Surfaces X Repaired loose carpet strip. Replaced missing transition strip at doorway.
Cleanliness: Overall Cleanliness, Pest/ Vermin Infestation
X
Electrical: Electrical X
Restrooms/Fountains: Restrooms, Sinks/ Fountains
X Repaired loose faucets on sinks.
Safety: Fire Safety, Hazardous Materials X
Structural: Structural Damage, Roofs X
External: Playground/School Grounds, Windows/ Doors/Gates/Fences
X Repaired sunken area under artificial turf.
Overall Facility Rating (Most Recent Year)
Year and month of the most recent FIT report: May 2016
Overall Rating Exemplary Good Fair Poor
X
2015-16 School Accountability Report Card for Heritage Intermediate School Page 6 of 13
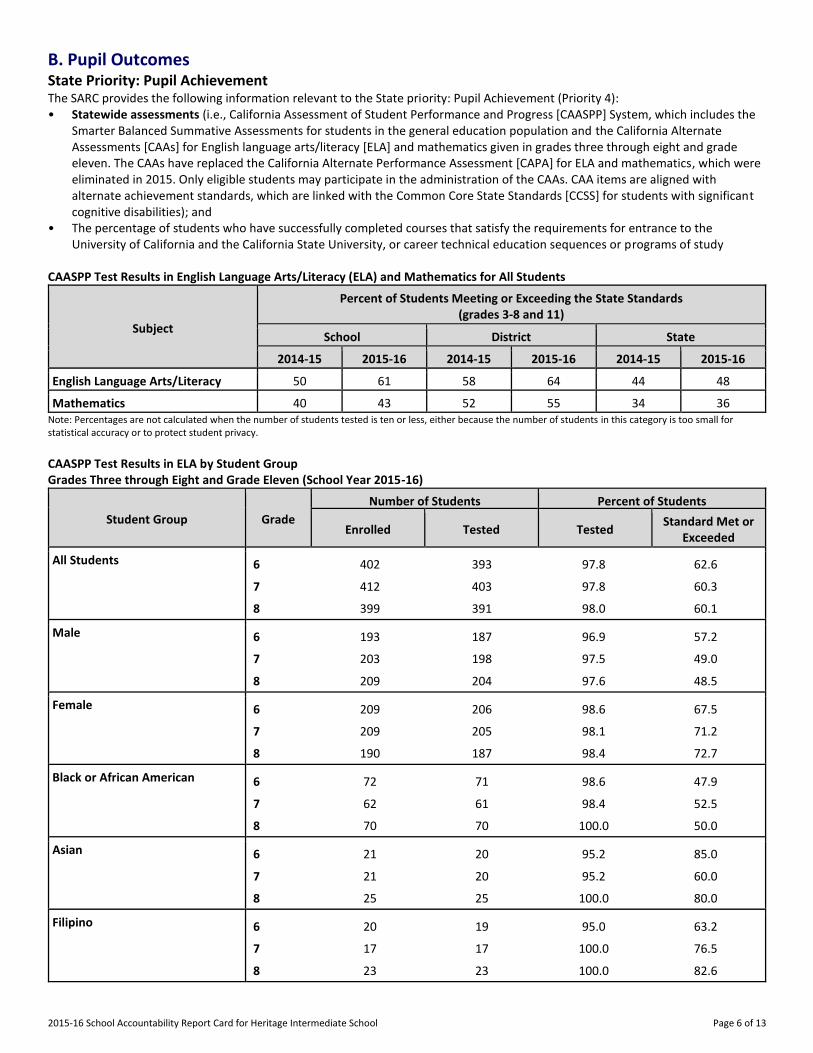
B. Pupil Outcomes State Priority: Pupil Achievement The SARC provides the following information relevant to the State priority: Pupil Achievement (Priority 4): • Statewide assessments (i.e., California Assessment of Student Performance and Progress [CAASPP] System, which includes the
Smarter Balanced Summative Assessments for students in the general education population and the California Alternate Assessments [CAAs] for English language arts/literacy [ELA] and mathematics given in grades three through eight and grade eleven. The CAAs have replaced the California Alternate Performance Assessment [CAPA] for ELA and mathematics, which were eliminated in 2015. Only eligible students may participate in the administration of the CAAs. CAA items are aligned with alternate achievement standards, which are linked with the Common Core State Standards [CCSS] for students with significant cognitive disabilities); and
• The percentage of students who have successfully completed courses that satisfy the requirements for entrance to the University of California and the California State University, or career technical education sequences or programs of study
CAASPP Test Results in English Language Arts/Literacy (ELA) and Mathematics for All Students
Subject
Percent of Students Meeting or Exceeding the State Standards (grades 3-8 and 11)
School District State
2014-15 2015-16 2014-15 2015-16 2014-15 2015-16
English Language Arts/Literacy 50 61 58 64 44 48
Mathematics 40 43 52 55 34 36 Note: Percentages are not calculated when the number of students tested is ten or less, either because the number of students in this category is too small for statistical accuracy or to protect student privacy.
CAASPP Test Results in ELA by Student Group Grades Three through Eight and Grade Eleven (School Year 2015-16)
Student Group Grade
Number of Students Percent of Students
Enrolled Tested Tested Standard Met or
Exceeded
All Students 6 402 393 97.8 62.6
7 412 403 97.8 60.3
8 399 391 98.0 60.1
Male 6 193 187 96.9 57.2
7 203 198 97.5 49.0
8 209 204 97.6 48.5
Female 6 209 206 98.6 67.5
7 209 205 98.1 71.2
8 190 187 98.4 72.7
Black or African American 6 72 71 98.6 47.9
7 62 61 98.4 52.5
8 70 70 100.0 50.0
Asian 6 21 20 95.2 85.0
7 21 20 95.2 60.0
8 25 25 100.0 80.0
Filipino 6 20 19 95.0 63.2
7 17 17 100.0 76.5
8 23 23 100.0 82.6
2015-16 School Accountability Report Card for Heritage Intermediate School Page 7 of 13
Student Group Grade
Number of Students Percent of Students
Enrolled Tested Tested Standard Met or
Exceeded
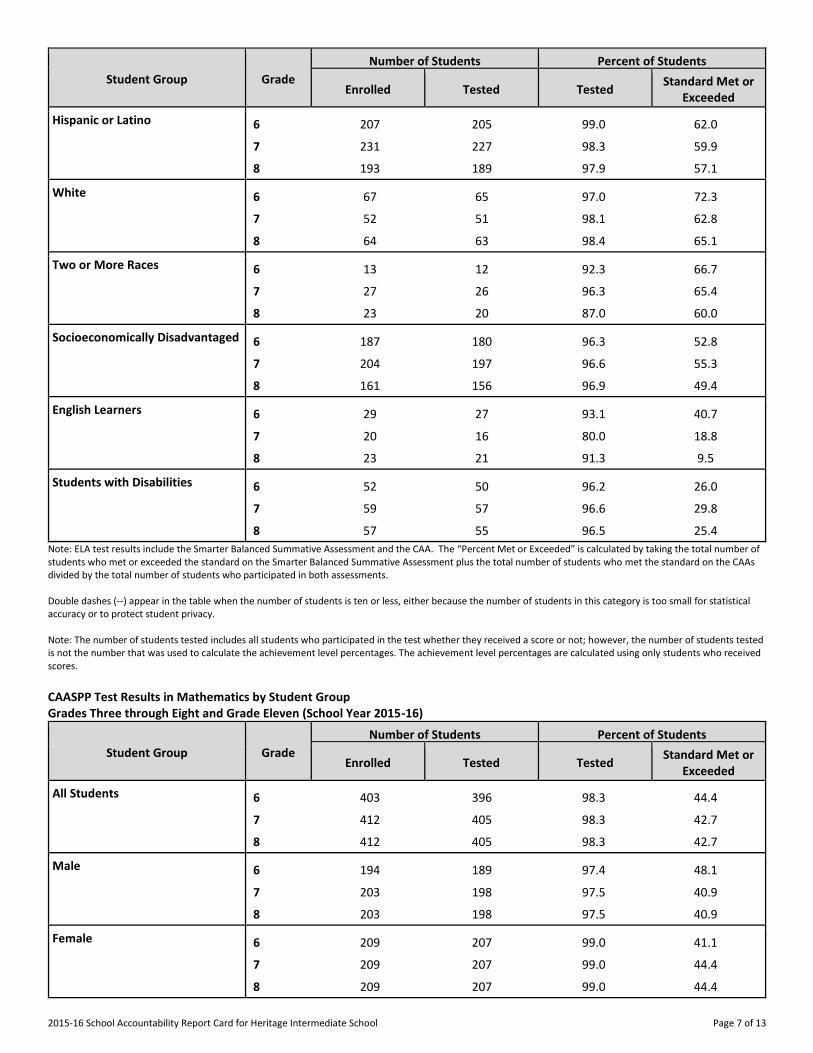
Hispanic or Latino 6 207 205 99.0 62.0
7 231 227 98.3 59.9
8 193 189 97.9 57.1
White 6 67 65 97.0 72.3
7 52 51 98.1 62.8
8 64 63 98.4 65.1
Two or More Races 6 13 12 92.3 66.7
7 27 26 96.3 65.4
8 23 20 87.0 60.0
Socioeconomically Disadvantaged 6 187 180 96.3 52.8
7 204 197 96.6 55.3
8 161 156 96.9 49.4
English Learners 6 29 27 93.1 40.7
7 20 16 80.0 18.8
8 23 21 91.3 9.5
Students with Disabilities 6 52 50 96.2 26.0
7 59 57 96.6 29.8
8 57 55 96.5 25.4
Note: ELA test results include the Smarter Balanced Summative Assessment and the CAA. The “Percent Met or Exceeded” is calculated by taking the total number of students who met or exceeded the standard on the Smarter Balanced Summative Assessment plus the total number of students who met the standard on the CAAs divided by the total number of students who participated in both assessments. Double dashes (--) appear in the table when the number of students is ten or less, either because the number of students in this category is too small for statistical accuracy or to protect student privacy. Note: The number of students tested includes all students who participated in the test whether they received a score or not; however, the number of students tested is not the number that was used to calculate the achievement level percentages. The achievement level percentages are calculated using only students who received scores.
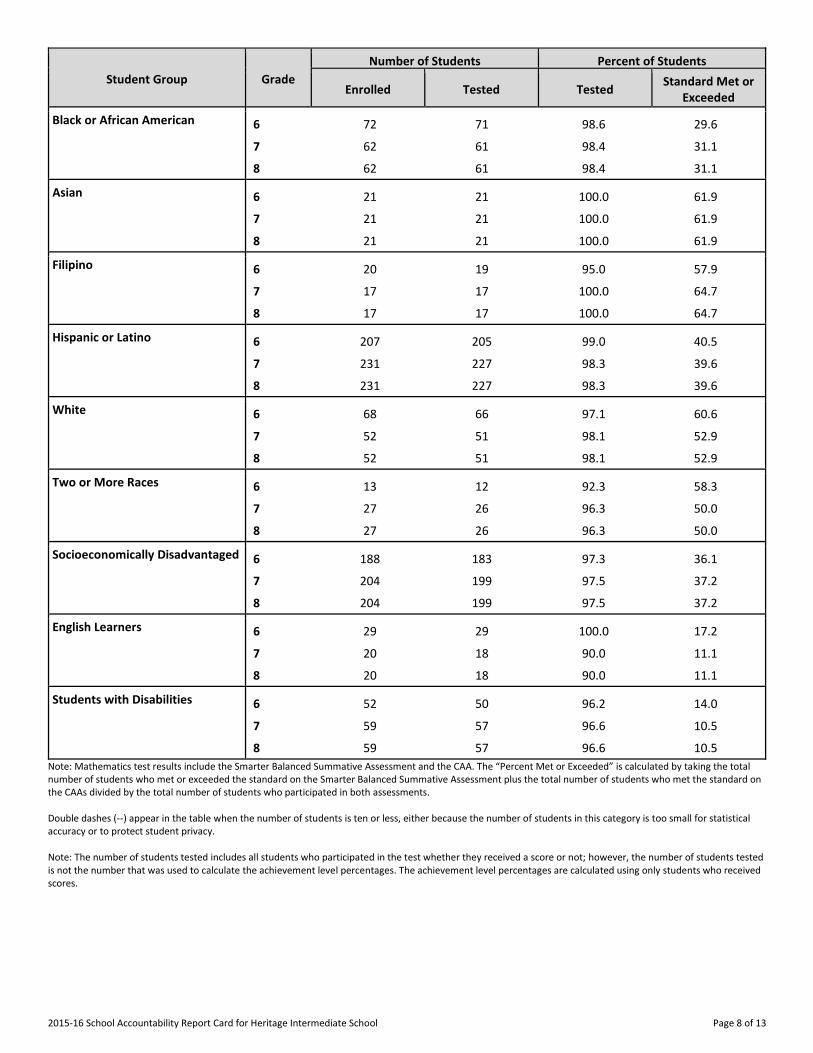
CAASPP Test Results in Mathematics by Student Group Grades Three through Eight and Grade Eleven (School Year 2015-16)
Student Group Grade
Number of Students Percent of Students
Enrolled Tested Tested Standard Met or
Exceeded
All Students 6 403 396 98.3 44.4
7 412 405 98.3 42.7
8 412 405 98.3 42.7
Male 6 194 189 97.4 48.1
7 203 198 97.5 40.9
8 203 198 97.5 40.9
Female 6 209 207 99.0 41.1
7 209 207 99.0 44.4
8 209 207 99.0 44.4
2015-16 School Accountability Report Card for Heritage Intermediate School Page 8 of 13
Student Group Grade
Number of Students Percent of Students
Enrolled Tested Tested Standard Met or
Exceeded
Black or African American 6 72 71 98.6 29.6
7 62 61 98.4 31.1
8 62 61 98.4 31.1
Asian 6 21 21 100.0 61.9
7 21 21 100.0 61.9
8 21 21 100.0 61.9
Filipino 6 20 19 95.0 57.9
7 17 17 100.0 64.7
8 17 17 100.0 64.7
Hispanic or Latino 6 207 205 99.0 40.5
7 231 227 98.3 39.6
8 231 227 98.3 39.6
White 6 68 66 97.1 60.6
7 52 51 98.1 52.9
8 52 51 98.1 52.9
Two or More Races 6 13 12 92.3 58.3
7 27 26 96.3 50.0
8 27 26 96.3 50.0
Socioeconomically Disadvantaged 6 188 183 97.3 36.1
7 204 199 97.5 37.2
8 204 199 97.5 37.2
English Learners 6 29 29 100.0 17.2
7 20 18 90.0 11.1
8 20 18 90.0 11.1
Students with Disabilities 6 52 50 96.2 14.0
7 59 57 96.6 10.5
8 59 57 96.6 10.5
Note: Mathematics test results include the Smarter Balanced Summative Assessment and the CAA. The “Percent Met or Exceeded” is calculated by taking the total number of students who met or exceeded the standard on the Smarter Balanced Summative Assessment plus the total number of students who met the standard on the CAAs divided by the total number of students who participated in both assessments. Double dashes (--) appear in the table when the number of students is ten or less, either because the number of students in this category is too small for statistical accuracy or to protect student privacy. Note: The number of students tested includes all students who participated in the test whether they received a score or not; however, the number of students tested is not the number that was used to calculate the achievement level percentages. The achievement level percentages are calculated using only students who received scores.
2015-16 School Accountability Report Card for Heritage Intermediate School Page 9 of 13
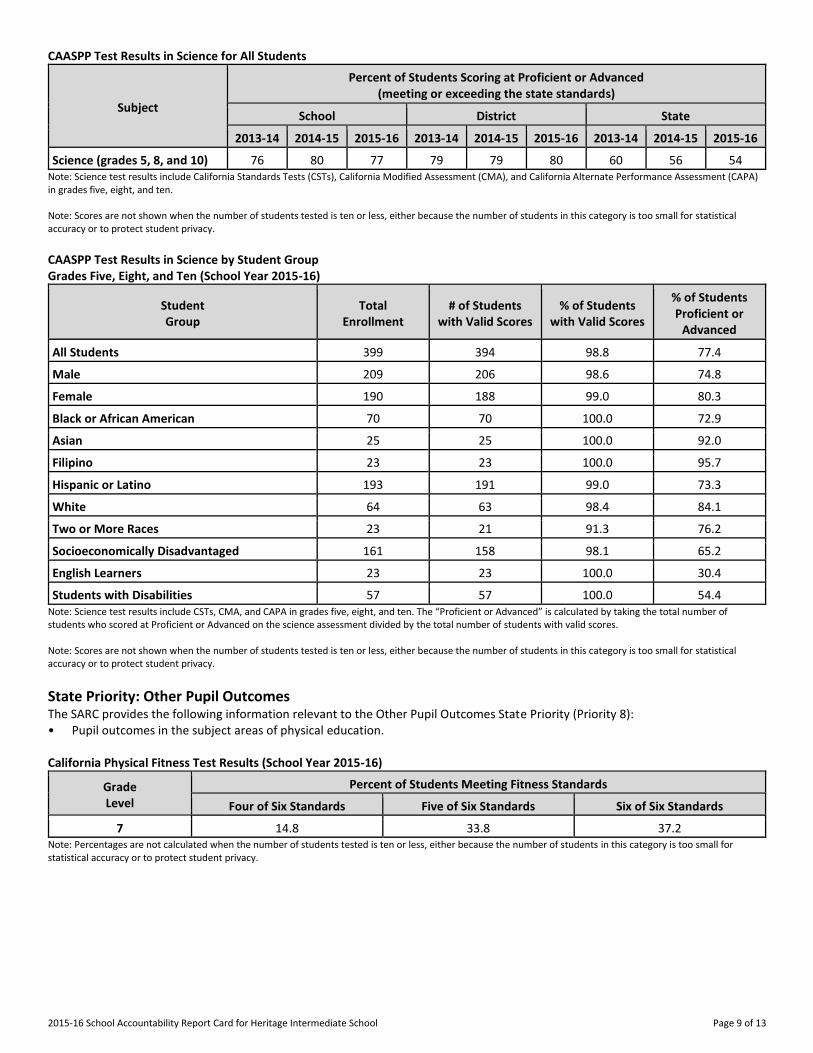
CAASPP Test Results in Science for All Students
Subject
Percent of Students Scoring at Proficient or Advanced (meeting or exceeding the state standards)
School District State
2013-14 2014-15 2015-16 2013-14 2014-15 2015-16 2013-14 2014-15 2015-16
Science (grades 5, 8, and 10) 76 80 77 79 79 80 60 56 54 Note: Science test results include California Standards Tests (CSTs), California Modified Assessment (CMA), and California Alternate Performance Assessment (CAPA) in grades five, eight, and ten. Note: Scores are not shown when the number of students tested is ten or less, either because the number of students in this category is too small for statistical accuracy or to protect student privacy.
CAASPP Test Results in Science by Student Group Grades Five, Eight, and Ten (School Year 2015-16)
Student Group
Total Enrollment
# of Students with Valid Scores
% of Students with Valid Scores
% of Students Proficient or
Advanced
All Students 399 394 98.8 77.4
Male 209 206 98.6 74.8
Female 190 188 99.0 80.3
Black or African American 70 70 100.0 72.9
Asian 25 25 100.0 92.0
Filipino 23 23 100.0 95.7
Hispanic or Latino 193 191 99.0 73.3
White 64 63 98.4 84.1
Two or More Races 23 21 91.3 76.2
Socioeconomically Disadvantaged 161 158 98.1 65.2
English Learners 23 23 100.0 30.4
Students with Disabilities 57 57 100.0 54.4 Note: Science test results include CSTs, CMA, and CAPA in grades five, eight, and ten. The “Proficient or Advanced” is calculated by taking the total number of students who scored at Proficient or Advanced on the science assessment divided by the total number of students with valid scores. Note: Scores are not shown when the number of students tested is ten or less, either because the number of students in this category is too small for statistical accuracy or to protect student privacy.
State Priority: Other Pupil Outcomes The SARC provides the following information relevant to the Other Pupil Outcomes State Priority (Priority 8): • Pupil outcomes in the subject areas of physical education. California Physical Fitness Test Results (School Year 2015-16)
Grade Level
Percent of Students Meeting Fitness Standards
Four of Six Standards Five of Six Standards Six of Six Standards
---7--- 14.8 33.8 37.2 Note: Percentages are not calculated when the number of students tested is ten or less, either because the number of students in this category is too small for statistical accuracy or to protect student privacy.
2015-16 School Accountability Report Card for Heritage Intermediate School Page 10 of 13
C. Engagement State Priority: Parental Involvement The SARC provides the following information relevant to the Parental Involvement State Priority (Priority 3): • Efforts the school district makes to seek parent input in making decisions for the school district and each schoolsite. Opportunities for Parental Involvement (School Year 2016-17)
Parents are encouraged to be involved in their child’s learning process by attending school events, serving on a school committee, and volunteering at the school. The staff welcomes parents’ assistance in the classroom or office and chaperoning field trips. Back to School Night, Open House, and PTSA-sponsored activities provide opportunities for parents to interact with school staff while supporting their child’s efforts. The School Site Council (SSC), English Language Advisory Council (ELAC), and Parent Teacher Student Association (PTSA) enable parents to provide oversight and input on the school budget, activities, and educational programs. Parents who would like to get more involved or volunteer their time may contact the school secretary or administrator at (909) 357-1345. School-to-home communication takes place in a variety of formats. All school events and updates are published every six weeks on the school website which features a message from the principal, calendar of upcoming events, highlights of school programs on, safety tips, and healthy family information. Progress reports are sent home every six weeks to update parents on their child’s current academic standing in each subject area. Heritage Intermediate’s web site is a valuable resource for general information about staff, schedules, facilities, activities, and educational tools. An automated telephone system enables staff to quickly contact parents with urgent or important information. A school marquee displays special announcements and reminders. Parents and students can also follow the school principal on Twitter. Parents are encouraged to access Aeries.net to monitor their child's academic progress. The district maintains an online mailing list for parents who wish to receive e-mail announcements and messages related to Heritage Intermediate and the district.
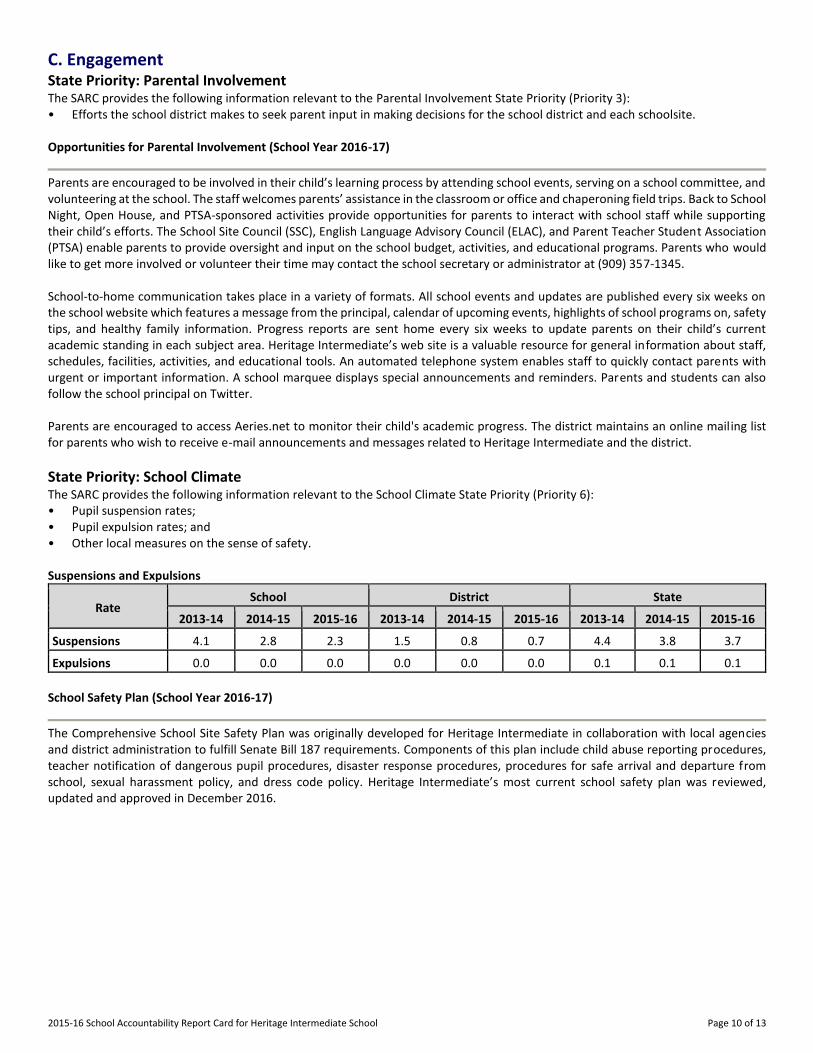
State Priority: School Climate The SARC provides the following information relevant to the School Climate State Priority (Priority 6): • Pupil suspension rates; • Pupil expulsion rates; and • Other local measures on the sense of safety. Suspensions and Expulsions
Rate School District State
2013-14 2014-15 2015-16 2013-14 2014-15 2015-16 2013-14 2014-15 2015-16
Suspensions------- 4.1 2.8 2.3 1.5 0.8 0.7 4.4 3.8 3.7
Expulsions------- 0.0 0.0 0.0 0.0 0.0 0.0 0.1 0.1 0.1
School Safety Plan (School Year 2016-17)
The Comprehensive School Site Safety Plan was originally developed for Heritage Intermediate in collaboration with local agencies and district administration to fulfill Senate Bill 187 requirements. Components of this plan include child abuse reporting procedures, teacher notification of dangerous pupil procedures, disaster response procedures, procedures for safe arrival and departure from school, sexual harassment policy, and dress code policy. Heritage Intermediate’s most current school safety plan was reviewed, updated and approved in December 2016.
2015-16 School Accountability Report Card for Heritage Intermediate School Page 11 of 13
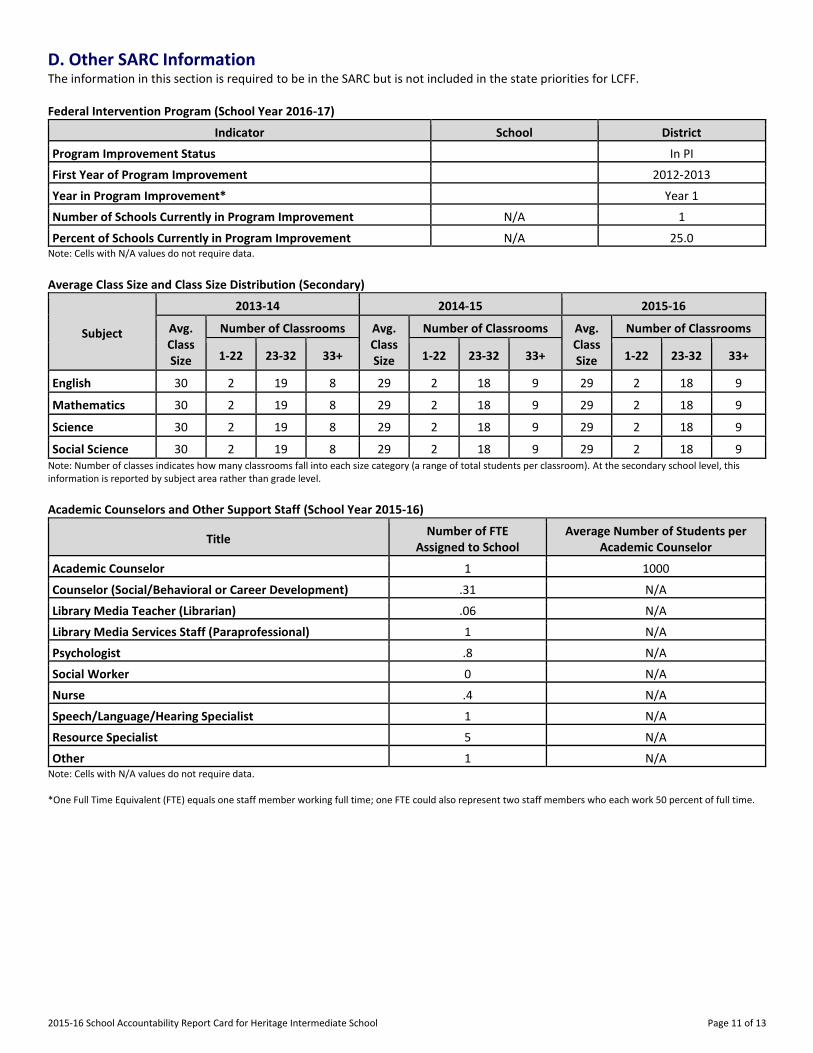
D. Other SARC Information The information in this section is required to be in the SARC but is not included in the state priorities for LCFF. Federal Intervention Program (School Year 2016-17)
Indicator School District
Program Improvement Status In PI
First Year of Program Improvement 2012-2013
Year in Program Improvement* Year 1
Number of Schools Currently in Program Improvement N/A 1
Percent of Schools Currently in Program Improvement N/A 25.0 Note: Cells with N/A values do not require data.
Average Class Size and Class Size Distribution (Secondary)
Subject
2013-14 2014-15 2015-16
Avg. Class Size
Number of Classrooms Avg. Class Size
Number of Classrooms Avg. Class Size
Number of Classrooms
1-22 23-32 33+ 1-22 23-32 33+ 1-22 23-32 33+
English------- ----------
30 2 19 8 29 2 18 9 29 2 18 9
Mathematics ----------
30 2 19 8 29 2 18 9 29 2 18 9
Science------- ----------
30 2 19 8 29 2 18 9 29 2 18 9
Social Science ----------
30 2 19 8 29 2 18 9 29 2 18 9 Note: Number of classes indicates how many classrooms fall into each size category (a range of total students per classroom). At the secondary school level, this information is reported by subject area rather than grade level. Academic Counselors and Other Support Staff (School Year 2015-16)
Title Number of FTE
Assigned to School Average Number of Students per
Academic Counselor
Academic Counselor------- 1 1000
Counselor (Social/Behavioral or Career Development) .31 N/A
Library Media Teacher (Librarian) .06 N/A
Library Media Services Staff (Paraprofessional) 1 N/A
Psychologist------- .8 N/A
Social Worker------- 0 N/A
Nurse------- .4 N/A
Speech/Language/Hearing Specialist 1 N/A
Resource Specialist------- 5 N/A
Other------- 1 N/A Note: Cells with N/A values do not require data. *One Full Time Equivalent (FTE) equals one staff member working full time; one FTE could also represent two staff members who each work 50 percent of full time.
2015-16 School Accountability Report Card for Heritage Intermediate School Page 12 of 13
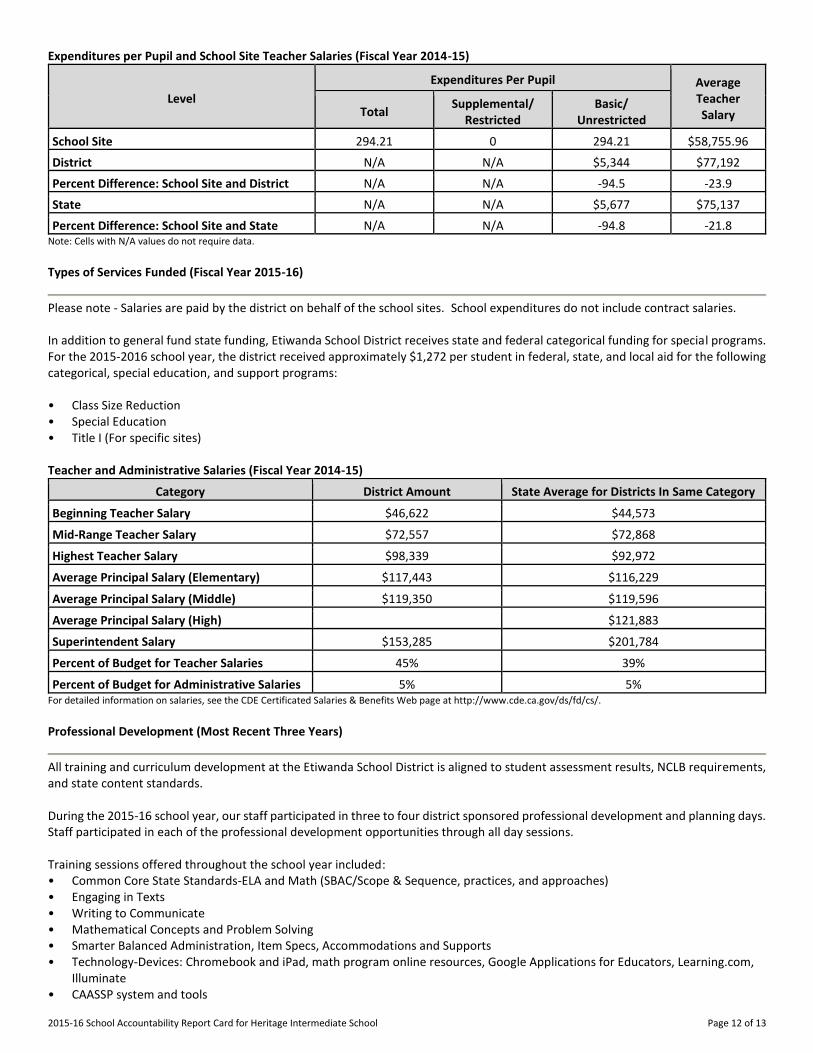
Expenditures per Pupil and School Site Teacher Salaries (Fiscal Year 2014-15)
Level
Expenditures Per Pupil Average Teacher Salary Total
Supplemental/ Restricted
Basic/ Unrestricted
School Site------- 294.21 0 294.21 $58,755.96
District------- N/A N/A $5,344 $77,192
Percent Difference: School Site and District N/A N/A -94.5 -23.9
State------- N/A N/A $5,677 $75,137
Percent Difference: School Site and State N/A N/A -94.8 -21.8 Note: Cells with N/A values do not require data.
Types of Services Funded (Fiscal Year 2015-16)
Please note - Salaries are paid by the district on behalf of the school sites. School expenditures do not include contract salaries. In addition to general fund state funding, Etiwanda School District receives state and federal categorical funding for special programs. For the 2015-2016 school year, the district received approximately $1,272 per student in federal, state, and local aid for the following categorical, special education, and support programs: • Class Size Reduction • Special Education • Title I (For specific sites) Teacher and Administrative Salaries (Fiscal Year 2014-15)
Category District Amount State Average for Districts In Same Category
Beginning Teacher Salary $46,622 $44,573
Mid-Range Teacher Salary $72,557 $72,868
Highest Teacher Salary $98,339 $92,972
Average Principal Salary (Elementary) $117,443 $116,229
Average Principal Salary (Middle) $119,350 $119,596
Average Principal Salary (High) $121,883
Superintendent Salary $153,285 $201,784
Percent of Budget for Teacher Salaries 45% 39%
Percent of Budget for Administrative Salaries 5% 5% For detailed information on salaries, see the CDE Certificated Salaries & Benefits Web page at http://www.cde.ca.gov/ds/fd/cs/. Professional Development (Most Recent Three Years)
All training and curriculum development at the Etiwanda School District is aligned to student assessment results, NCLB requirements, and state content standards. During the 2015-16 school year, our staff participated in three to four district sponsored professional development and planning days. Staff participated in each of the professional development opportunities through all day sessions. Training sessions offered throughout the school year included: • Common Core State Standards-ELA and Math (SBAC/Scope & Sequence, practices, and approaches) • Engaging in Texts • Writing to Communicate • Mathematical Concepts and Problem Solving • Smarter Balanced Administration, Item Specs, Accommodations and Supports • Technology-Devices: Chromebook and iPad, math program online resources, Google Applications for Educators, Learning.com,
Illuminate • CAASSP system and tools
2015-16 School Accountability Report Card for Heritage Intermediate School Page 13 of 13
• Classroom Management (New Teachers and Induction) • English Language Learners (proficiency expectations, standards, and instruction) • Site Administrators (SBAC, new academic standards, Kagan, Induction, LCFF/LCAP) • Substitute Teacher Training • Behavior Management (SPED)-(New Teachers and Induction) • Special Education-policy, procedures, accountability • Effective IEP Writing • Kagan Cooperative Learning • i-Ready Diagnostic Assessments • Towards Equity (Induction) • Special Populations (Induction-General Education) • Project Read • Step Up to Writing • District Adopted English Language Arts Publisher Training Etiwanda School District supports school administrators, new teachers, veteran teachers, substitute teachers, and instructional assistants in developing their teaching skills. Since the 2012-2013 school year, the primary/major areas of focus for staff development were aligned to the new academic standards (Common Core State Standards), 21st Century learning and teaching, technology, Universal Access, and meeting the needs of special populations and our English learners. Areas selected are based on state and local policies and student need. In addition to the above, data analysis of state summative assessments, local diagnostics, as well as formative classroom assessments determine professional development focus areas. Professional development is delivered through multiple methods: individual support, grade level teams, one-day during the work day sessions (grade level or grade span specific), conference style self-selected topics, as well as outside vendor sessions, based on site needs. All teachers are supported during this implementation period through multiple district sponsored professional development opportunities such as publisher sessions, district professional development sessions, district/site representative articulation, grade level collaboration, and site staff meetings. In addition to the above, teachers may seek in-class support from professional development providers. All staff members are encouraged to attend additional, non-district-sponsored workshops and conferences. New teachers, experienced teachers, TOSAs, teacher leaders, administrators, and support staff are encouraged to participate in workshops sponsored by the San Bernardino County Superintendent of Schools. New teachers are enrolled into the ESD Induction Program, a state-sponsored program designed for first- and second-year preliminary credentialed teachers. Comprehensive skills enhancement training is provided over a two year period. Candidates attend specific sessions related to implementation of district technologies, assessments, and scope and sequences. In addition, new teachers attend (prior to the start of the school year) sessions on equity, special populations, classroom management, and pedagogical approaches and practices. Monthly Induction support meetings focus on implementation and growth within the California Standards for the Teaching Profession. Teachers experiencing difficulty or in need of improvement may voluntarily select or be required to participate in the Peer Assistance and Review process. A consulting support teacher is assigned to the teacher. The support teacher meets on a regular basis with the teacher, observes the classroom, and makes suggestions for staff development. Etiwanda’s Professional Development Providers/Teachers on Special Assignment (TOSA) further develop their capacity to instruct and support teachers through professional reading, outside vendor conference attendance, and professional collaborative workshops on supporting teachers, pedagogy, and student achievement. Paraprofessionals or classified employees are prepared to work in their role through yearly staff notification sessions (online and in-person) as well as trained to work with colleagues and students through staff development sessions and meetings. They may also receive additional job-related training form vendors, department supervisors, and district representatives. In addition, there are selected workshops offered through West End SELPA for both certificated and classified personnel. Non-instructional support staff is prepared to work in their role through yearly staff notification sessions (online and in-person) and ongoing staff development during the day meetings/sessions around topics related to state and local policies, procedures, and practices.