herman palm short dissertation in partial fulfilment of
TRANSCRIPT

The Appl icat ion, Ut i l isat ion and level of value adding of selected Lean Manufacturing Techniques Amongst
Assembly Manufacturing in Gauteng
Herman Palm
SHORT DISSERTATION
in part ial ful f i lment of the requirements for the
degree
Masters in
Business Administration
Faculty of Management
Universi ty of Johannesburg
Study leader: Mrs. L.M.M Hewitt
October 2006
ACKNOWLEDGEMENTS
I would like to thank my father, wife, children and friends for their support and belief in
me.
To all the organisations that participated in this research, thank you for your willingness
and effort.
.
ii

EXECUTIVE SUMMARY
Any organisation’s aim is to make profit. This phenomenon determines the survival and
growth of each business activity. Organisations have to learn faster about new
production techniques in order to become leaner and to enter new competitive
environments as they experience lower reward potential in the existing environments.
Organisations have to deliver faster to the markets, with product quality exceeding
customers’ expectations with regard to competitive price.
Lean manufacturing provides manufacturers with techniques to overcome these
problems. The question arises which techniques to choose from the wide array of lean
manufacturing techniques that are available.
The aim of this study was to determine which lean manufacturing techniques Gauteng
manufacturers, specifically in the Johannesburg area, prefer to use. The value that
these techniques contribute to the manufacturing process was measured in a
percentage of productivity improvement, inventory reduction and operating cost
reduction.
The research design was both qualitative and quantitative in nature and a structured
questionnaire, applying the Likert scale, was used to gather the data.
Most of the manufacturers in the Johannesburg area indicated that the techniques had,
to a large extent, led to improvement in their productivity. These manufacturers indicated
the opposite of what the literature indicate, namely that the techniques only reduced
inventory to a moderate extent. The manufacturers did not prefer the techniques
recommend by the lean manufacture advocates, which are mainly Just in time (JIT),
waste elimination and value-stream mapping. They preferred total preventative
maintenance (TPM), cycle time and assembly line balancing.
iii

In general a positive relationship was indicated between how frequently the techniques
were used and the level of value it added, in terms of reduction in inventory levels, cost
reduction and productivity improvement.
Conclusion drawn from this research is that Gauteng assembly manufacturers use these
techniques to a limited extent, which is to their disadvantage. Of all the lean
manufacturing techniques Single Minute of Dies (SMED) has indicated a 87.5%
improvement in inventory reduction if it was used always and a 75% operating cost
reduction was reported. It is therefore recommended that Gauteng assembly
manufacturers should pursue the implementation of lean manufacturing techniques, to
reduce inventory levels, improve productivity and reduce cost. This will ultimately reduce
waste and lead to an increase in company profits.
The result suggested that further research can be conducted to verify industry’s
perception in terms of the reasons why they do not implement and use lean
manufacturing techniques, especially JIT. The same research can be extended to other
industries for example, logistics and procurement.
iv

GLOSSARY
ABC Analysis: Dividing inventory into percentage categories based on customer demand and
cost per unit, part complexity and lead time. “A” category products will be 80% of the customer
demand and will have the highest cost per unit. “B” category products will be 20% of customer
demand and will have the lowest cost per unit.
Assembly: An assembly line is a manufacturing process in which parts are added to a product in
a sequential manner to create a finished product.
Assembly Line Balancing: This technique entails ensuring that each workstation spends the
same amount of time on the task allocated to it; hence no workstation has to wait for the
previous workstation to complete a task and the manufacturing process is continuous. The time
it takes for each workstation to complete its task before handing it over to the next station in the
cell is equal.
Cell Manufacturing: Brings together machines and people previously scattered into different
sections or departments, either in a U-shape or straight line, to complete the process or product
in one place.
Cycle Time: The maximum time for a product to be completed at all the workstations. Continuous Flow: Allows the work to flow from one process to the next without inventory build-up before or after each process.
Just In Time (JIT): A process where supplies and components are pulled through the system to
arrive where they are needed, when they are needed. On-time delivery when you need it, with
no inventory or as little as possible and to eliminate waste (reduction of tasks that do not add
value to the product (unnecessary movement and handling, rework etc).
Kanban: The Japanese word for card that has come to mean “signal”. A kanban system moves
parts through production via a “pull” from a signal.
One-Piece Flow: Products are passed from operation to operation one piece at a time.
v

Poka Yoke: A mistake proofing device or procedure used to prevent defects from entering a
work process.
Single Minute Exchange of Dies (SMED): A structured method for reducing changeover down
time on equipment to less than 10 minutes. This refers to the reduction of changeover time from
one product to the next by performing some of the set-up operation to before and after the actual
set-up and using quick snap-in locking devices rather than bolt and nuts. This means shortening
the actual set-up time to the minimum.
Statistical Process Control (SPC): The use of statistics and data gathering to monitor process
output and to control the quality of the process.
Total Preventative Maintenance (TPM): All employees must carry out productive maintenance.
TPM is maintenance management that recognises the importance of reliability, maintenance and
economic efficiencies in the plant, allowing employees to be responsible for some of the
maintenance tasks. Employees must take responsibility for their machines.
Total Quality Management (TQM): The management of an entire organisation to ensure that the
organisation excels in all aspects of production and services important to the customer. TQM
stresses a commitment by management to a continuing company-wide drive towards excellence
in processes through incremental improvements to satisfy the needs of customers.
Value-Stream Mapping: A value stream includes all the actions, both value-adding and non-
value-adding, required from the input stage to the output stage for every product manufactured.
It is the production flow from raw material to final product for consumption by the customer. The
same concept is applicable to the design process, i.e. from the concept to the launch of the new
product or service.
Waste Elimination: Whatever does not contribute to profit is waste. Every action that does not
add value is waste: overproduction = waste, waiting time = waste, unnecessary transportation =
waste, unnecessary inventory = waste, defects and rework = waste, excessive walking or
reaching = waste.
vi

CONTENTS
ACKNOWLEDGEMENTS ii
EXECUTIVE SUMMARY iii
GLOSSARY v
CHAPTER 1 BACKGROUND 1
1.1 BACKGROUND AND RATIONALE 1
1.2 PROBLEM STATEMENT 2 1.3 LITERATURE SURVEY 3 1.4 AIMS OF THE STUDY 5 1.5 RESEARCH METHODOLOGY 5 1.6 BENEFICIARIES 6 1.7 LAYOUT OF THE STUDY 7 1.8 CONCLUSION 7
CHAPTER 2 LITERATURE REVIEW 8
2.1 BACKGROUND ON LEAN MANUFACTURING 8 2.2 DIFFERENT VIEWS ON LEAN MANUFACTURING 9 2.3 TECHNIQUES USED FOR THE PURPOSE OF THIS RESEARCH 18 2.3.1 ABC Analysis 18
2.3.2 Assembly Line Balancing 19
2.3.3 Cell Manufacturing 19
2.3.4 Continuous Flow 21
2.3.5 Cycle Time 21
2.3.6 JIT 21 2.3.7. One-piece flow 22 2.3.8 Product-Quantity (P-Q) Analysis 22
2.3.9 Poka Yoke 23
2.3.10 Single Minute Exchange of Dies (SMED) 23
2.3.11 Takt Time 24
2.3.12 Total Preventative Maintenance (TPM) 25
vii
2.3.13 Total Quality Management (TQM) 26
2.3.14 Value-stream mapping (VSM) 27
2.3.15 Waste (Muda) 28 2.4 CONCLUSION 29
CHAPTER 3 RESEARCH DESIGN AND METHODOLOGY 30
3.1 RESEARCH QUESTION 30 3.2 RESEARCH DESIGN 30 3.2.1 Quantitative research. 31 3.2.2 Surveys 31 3.2.3 Questionnaire Design 31 3.2.4 Data types 32 3.3 METHOD USED TO CONDUCT THE SURVEY 33 3.4 POPULATION AND SAMPLING 33 3.5 METHODOLOGY 34 3.6 METHOD OF DATA ANALYSIS 35 3.6.1 Chi-Square test 36
3.6.2 Cross- Tabulation 36
3.7 CONCLUSION 36
CHAPTER 4 DATA PRESENTATION AND ANALYSIS 37
4.1 SECTION A (INFORMATION ABOUT THE RESPONDENT) 37 4.1.1 Job Designations of Respondents 37 4.1.2. Respondents’ Qualifications 38 4.2 SECTION B (NATURE OF THE MANUFACTURERS) 39 4.2.1 Assembly Manufacturers – Nature of Business 39 4.2.2 Size of Manufacturers 40 4.3 SECTION C (INFORMATION REGARDING THE TECHNIQUES) 41 4.3.1 Technique 1: ABC Analysis 41
4.3.2 Technique 2: Assembly Line Balancing 45 4.3.3. Technique 3: Cell Manufacturing 48
4.3.4. Technique 4: Cycle Time 53 4.3.5 Technique 5: Just In Time. (JIT) 56
viii

4.3.6. Technique 6: SMED or Quick Changeover 59 4.3.7 Technique 7: Total Preventative Maintenance (TPM) 62 4.3.8 Technique 8: Waste Elimination 65 4.3.9. More Techniques ` 69 4.4 FAMILIARITY WITH THE TECHNIQUES VERSUS UTILISATION 70
CHAPTER 5 DISCUSSIONS AND CONCLUSIONS 71
5.1 TECHNIQUES 71
5.1.1 Cell Manufacturing 71 5.1.2 Waste Elimination 72 5.1.3 Cycle Time 72 5.1.4 More Techniques 73 5.2 TECHNIQUES PREFERRED BY MANUFACTURERS AND USED “ALWAYS” . 73 5.3 VALUE ADDING 74 5.3.1 Inventory Reduction 74
5.3.2 Improved Productivity 76 5.3.3 Operating Cost Reduction 76 5.4 LIMITATIONS AND FURTHER RESEARCH OPPORTUNITIES 77 5.5 CONCLUSION 79
References
Bibliography
Appendix A Questionnaire
ix
FIGURES
Figure 2.2.1 Carlo Scodanibbio’s Lean Manufacturing View 11
Figure 2.2.2 Lean Enterprise Key Drivers 12
Figure 2.2.3 Non Lean Enterprise 13
Figure 2.2.4 Lean Manufacturing Techniques 14
Figure 2.2.5 “Just In Time” Philosophy 17
Figure 2.3.1 Cycle Time Formula 21
Figure 2.3.2 Takt Time Formula 24
Figure 4.1 Designations of Respondents 38
Figure 4.2 Respondents’ Qualifications 39
Figure 4.2.1 Different Types of Manufacturers 40
Figure 4.2.2 Number of Full-time Employees 41
Figure 4.3.1 ABC Analysis: Inventory Reduction 42
Figure 4.3.2 ABC Analysis: Improvement of Inventory Control 43
Figure 4.3.3 Assembly Line Balancing: Idle Time Reduction 46
Figure 4.3.4 Assembly Line Balancing: Improved Productivity 46
Figure 4.3.5 Cell Manufacturing: Inventory Reduction 49
Figure 4.3.6 Cell Manufacturing: Improved Productivity 49
Figure 4.3.7 Cycle Time: Inventory Reduction 54
Figure 4.3.8 Cycle Time: Improved Productivity 54
Figure 4.3.9 JIT: Inventory Reduction 57
Figure 4.3.10 JIT: Improved Productivity 57
Figure 4.3.11 SMED: Inventory Reduction 60
Figure 4.3.12 SMED: Operating Cost Reduction 60
Figure 4.3.13 TPM: Inventory Reduction 63
Figure 4.3.14 TPM: Operating Cost Reduction 63
Figure 4.3.15 Waste Elimination: Operating Cost Reduction 66
Figure 4.3.16 Waste Elimination: Improved Productivity 66
Figure 5.5.1 Conclusion of the Cross-Tabulation 79
x
TABLES
Table 3.6.1 Statistical Strength of Relationship 36
Table 4.3.1 Qualification versus Knowledge of Technique 43
Table 4.3.2 Usage versus Inventory Reduction 44
Table 4.3.3 Usage versus Improve Inventory Control 45
Table 4.3.4 Usage versus Idle Time Reduction 47
Table 4.3.5 Usage versus Improved Productivity 48
Table 4.3.6 Size of Manufacturer versus Knowledge of Technique 50
Table 4.3.7 Qualification versus Knowledge of Technique 51
Table 4.3.8 Usage versus Inventory Reduction 52
Table 4.3.9 Usage versus Improved Productivity 53
Table 4.3.10 Usage versus Inventory Reduction 55
Table 4.3.11 Usage versus Improved Productivity 56
Table 4.3.12 Usage versus Inventory Reduction 58
Table 4.3.13 Usage versus Improved Productivity 59
Table 4.3.14 Usage versus Inventory Reduction 61
Table 4.3.15 Usage versus Operating Cost Reduction 62
Table 4.3.16 Usage versus Inventory Reduction 64
Table 4.3.17 Usage versus Operating Cost Reduction 65
Table 4.3.18 Usage versus Operating Cost Reduction 67
Table 4.3.19 Usage versus Improved Productivity 68
Table 4.3.20 Utilisation of More Techniques 69
Table 4.3.21 Usage versus Qualification 70
Table 4.4.1 Familiarity with the Techniques versus used always 70
Table 5.3.1 Order of value added by each technique in the category “inventory
reduction” 75
Table 5.3.2 Order of value added by each technique in the category
“improved productivity” 76
Table 5.3.3 Order of value added by each technique in the category
“operating cost reduction” 77
xi

CHAPTER 1
BACKGROUND
This chapter provides background to the study. It starts with the overview of the
fundamental aim of a manufacturing company, which is to make profit. This is followed
by the problem statement, reasoning of the study, a short literature study, aim of the
study, research design and data gathering methodology.
1.1 BACKGROUND AND RATIONALE
The aim of any organisation is to increase profit and add value to the business
(Salvatore, 2001:11) and this is in line with the statement by Kachienga’a and
Koekemoer (2002:1) that it becomes extremely challenging in South Africa to increase
profit with the unstable rand and the low cost of imports.
Heizer and Render (2004:6) claim that when faced by global competition, the approach
that numerous companies take is to try to improve their operations activities. Heizer and
Render (2004:6) make use of a simple financial statement to demonstrate the
contribution of improving operations management activities they postulate that the
impact of reducing the production cost by 20% is far greater than either having a 50%
increase in sales or a reduction of 50% in finance cost. The end result of increasing
sales by 50% is a 71% increase in profit. A 50% reduction in finance cost will result in a
21% increase in profit. However, a 20% decrease in production cost will result in a net
increase of 114% in profit. This indicates that companies must focus on the reduction of
production costs to make profit and to survive low-cost imports.
Heizer and Render (1999:199) explain that when products and technology reach the
mature stage of their lifecycle, companies should focus on the processes that reduce
costs in order to maximize their profitability.
1

According to Halevi (1999:25) a company must change the manner in which it does
business in order to compete successfully and remain competitive in the global market
arena. Global markets impose new and greater demands on a business moving towards
the global arena. This requires greater delivery speed to markets, product diversity,
product quality, customer satisfaction and more competitive pricing
Where lean producers are committed to the continuous removal of activities that do not
add value to the products, lean manufacturing techniques can provide methods that
solve these problems (Heizer and Render, 2004: 596). Lean manufacturing can
constitute a formidable weapon in the increasingly more competitive global markets
(Soriano-Meier, & Forrester, (2002:104).
Traditional managers have accepted that a certain percentage of defective parts are
standard and therefore they build up a safety stock inventory to safeguard them against
inconsistent deliveries. “Customary production techniques have limited goals” (Heizer
and Render, 1999:240). Lean producers use many different techniques to identify and
eliminate product waste, such as JIT, TQM, value-stream mapping from suppliers to
customer, zero defects, one-piece flow, continuous flow and kanban. Whichever
technique is used, lean manufacturers are the key players in building a work culture that
endorses continuous improvement. Womack, Jones and Roos (1990:7) recommend that
these techniques be applied equally in any industry across the globe.
1.2 PROBLEM STATEMENT
Free market forces are the fluctuation of the rand, low-cost imports and technology and
product depreciation (Chaharbaghi and Nugent, 1994). According to Halevi (1999: 25)
this phenomenon determines the survival and growth of each business activity.
Organisations have to learn faster about new production techniques in order to become
leaner and to enter new competitive environments as they experience lower reward
potential in the existing environments. Organisations have to deliver faster to the
markets, with product quality exceeding customers’ expectations with regard to
competitive price.
2

Halevi (1999:26) further states that the manufacturing industry realises that it is going to
be the survival of the fittest and that a change towards lean manufacturing is essential in
the drive towards increased productivity in the global manufacturing arena. A
dissonance exists between the processes/techniques proposed by the advocates of lean
manufacturing and the real processes/techniques used by successful manufacturing
firms already achieving lean manufacturing. He also states that more than 90 different
lean manufacturing techniques are available.
The following question therefore requires more investigation: “Which lean manufacturing
techniques/processes are utilised by manufacturing enterprises that have successfully
evolved from the micro or local to the macro or global arena? ”In conjunction with this, it
should be investigated why certain techniques/processes are chosen above others from
the wide array of “lean manufacturing” techniques/processes available and also the
extent to which techniques/processes contribute to increasing productivity, reducing
inventory levels or reducing operating cost.
1.3 LITERATURE SURVEY
Lean manufacturing imply many things, but inventory is a highly visible measurable
phenomenon as Schonberger (2004:20) states: “know how to operate with little
(inventory) and you’re lean, hold lots (of inventory) and you’re fat”. One of the measures
of a company using lean manufacturing is a low inventory. This means that an enterprise
with a large inventory in the form of products in the process of manufacturing, or an
enterprise that stores a lot of finished goods in a warehouse, has a large amount of
money committed in the form of work-in-progress (WIP). Consequently the word “fat” is
used to describe such an enterprise.
When a company does the opposite, it is considered “lean” and the business makes use
of lean manufacturing as described by Schonberger (2004:20). The mission of lean
producers is to work towards perfection through continuous learning, creativity and
teamwork, and to continuously dispel non-value-adding activities (Heizer and Render,
1999:239).
3

Slack, Chambers and Johnston (2001:482) describe lean manufacturing techniques
under the heading of “JIT” (Just In Time). JIT aims to meet a demand instantaneously,
with perfect quality and almost no waste. JIT is a disciplined approach to improving
overall productivity and eliminating waste. It provides for cost-effective production and
delivery of only the necessary quantity of parts at the right quality, at the right time and
place, while using a minimum amount of facilities, equipment, materials and human
resources. JIT is dependent on the balance between the supplier’s flexibility and the
user’s flexibility. It is accomplished through the application of elements that require total
employee involvement and teamwork. “A key philosophy of JIT is simplification” (Slack
et al., 2001: 482).
Feld (2001:4) identifies five primary elements to present the various facets required to
support a solid lean manufacturing programme, namely manufacturing flow,
organisation, process control, metrics and logistics. For each of these elements there
are at least six tools for an organisation to become and promote lean manufacturing
Bicheno (2000:8) describes lean manufacturing as “a philosophy, not a system or a
technique. It is about simplicity, flow, visibility, partnership and value.” He highlights five
lean principles from Whomack and Jones for the elimination of waste:
• Specify value from the point of view of the customer.
• Identify the value stream.
• Make value flow.
• Pull at the customer’s rate of demand and seek perfection through continual
improvement.
• Seek perfection through continual improvement.
4

1.4 AIMS OF THE STUDY
• To determine which of the lean manufacturing techniques Gauteng, or more
specifically Johannesburg assembly manufacturers preferred.
• To rank the most frequently used techniques from “most used” to “least used”.
• To determine in percentage the well-being of the manufacturing process with
regard to the value being added to productivity, inventory reduction, reduction in
operating cost and inventory control.
• To construct a matrix illustrating the contribution in terms of value added by the
various techniques, from high to low.
1.5 RESEARCH METHODOLOGY
The research design was both quantitative and qualitative in nature. The data was
gathered by means of a structured questionnaire using an ordinal scale from “not at all”
to “always”. An introductory letter accompanied the questionnaire to explain the
research and to confirm the confidentiality of the information. The questionnaires were e-
mailed after telephonic confirmation of participation in the research. The questionnaire
consisted of three sections. Section one requested information about the respondent,
section two information about the manufacturer and section three covered the different
techniques, the frequency of usage of the techniques and the value the techniques add
to the business. The research included an empirical phase to gather data from actual
manufacturing sites in Gauteng (in the Johannesburg area) where lean manufacturing
techniques are utilised. Underpinning the study is the literature review on lean
manufacturing techniques in assembly cells and their place in the running of a
production assembly. The comparative data gathered from the questionnaire has been
analysed using a matrix/typology of the actual techniques used. The questionnaire
design was based on the analyses and observations of the literature review and with the
assistance of STATKON at the University of Johannesburg. The validity and the
reliability of the questionnaire were tested. STATKON assisted with the actual
processing of the data into cross tabulation and statistics.
5

A literature survey was conducted on lean manufacturing and lean manufacturing
techniques with specific emphasis on the following techniques: ABC product analysis,
assembly line balancing, cell manufacturing, continuous flow, cycle time, JIT, one-piece
flow, product-quantity (PQ) analysis, Poka Yoke, single minute exchange of dies, takt
time, TPM, TQM, value-stream mapping and elimination of waste. These techniques are
applicable to assembly manufacturing.
The value added to the enterprise was measured in terms of inventory reduction,
productivity improvement, operation cost reduction and improvement to inventory
control. The results were expressed in percentages.
The sites chosen for the research were mainly assembly-manufacturing companies in
the Johannesburg area (Gauteng Province). Gauteng was selected on the basis of
information provided by Statistics South Africa (2004) according to which 43% of
manufacturers in South Africa were situated in Gauteng at the time of the census in
1996. Gauteng manufacturers further contribute 40% of the South African production
output.
1.6 BENEFICIARIES
Companies that contributed to the study were existing and new businesses with
assembly lines that could benefit from the research as it will confirm whether the industry
is using the techniques and to what extent the techniques contributed to business
profitability. In addition, technological institutions and operational research consultants
could also benefit as their recommendations on and designs for continuous
improvements to the manufacturing process/tools/techniques are actually used by the
industry manufacturer who seeks to add real value in tougher markets. Academic
institutions in the field of operations management can convey the outcome of this
research to their students who are ready to enter employment.
6

1.7 LAYOUT OF THE STUDY
Chapter 1: Background
This chapter covers the background, the rationale behind the research, the problem
statement and the objectives of the research.
Chapter 2: Literature Review
The literature review will cover theory on lean manufacturing recommended by the lean
manufacturing advocates, the techniques they prefer and the simplification of the
techniques. It will provide an in-depth description of the tools/techniques and their
application and finally discuss the value the techniques can add to an enterprise.
Chapter 3: Research Design and Methodology
The research design will be presented, as well as the associated research methods
used to accomplish the study.
Chapter 4: Data Presentation and Analysis
Findings based on the data will be presented. The findings were used to develop a
matrix of the lean manufacturing techniques actually used by some manufacturers in the
Johannesburg area.
Chapter 5: Discussions and Conclusions
Conclusions will be drawn and discussed.
1.8 CONCLUSION
From the background it is obvious that companies can benefit from lean manufacturing
to compete globally. Choosing the correct techniques can be confusing because
advocates of lean manufacturing have different opinions on the techniques to be used.
The research objective was to clarify the techniques used by manufacturers in the
Johannesburg area and the value these techniques add to the manufacturer.
7

CHAPTER 2
LITERATURE REVIEW
This chapter illustrates the background and history of lean manufacturing and then the
different lean advocates’ reasoning behind lean manufacturing and the preferred
techniques. In conclusion an explanation of a few selected techniques with relevance to
assembly manufacturing follows.
2.1 BACKGROUND ON LEAN MANUFACTURING
Womack, et al. (1990) were the first to use the phrase “lean manufacturing” in their book
‘The machine that changed the world’ that explained the pioneering work of Eiji Toyoda
and Taiichi Ohono at the Toyota Motor Company in Japan. The famous quote used to
describe the lean production is “uses less of everything, half the human effort in the
factory, half the manufacturing space, half the investment in tools, half the engineering
hours to develop a new product in half the time. Also it requires keeping far less than
half the inventory on site, results in many fewer defects and produces a greater and ever
growing variety of products” (Womack et al.,1990:13).
Lean manufacturing must be viewed as a tactically formidable weapon in a more and
more competitive market (Soriano-Meier and Forrester, 2002). Although lean
manufacturing can be mastered by anyone, it takes 10 years of practice under expert
guidance (Womack et al., 1990:243). It is important to take note that lean manufacturing
can only be achieved over time and cannot be used to solve short-term competitive
problems (Soriano-Meier and Forrester, 2002). It took Toyota 20 years to develop their
production system (Womack et al., 1990:243).
The transformation to lean manufacturing requires careful strategy as lean
manufacturing brings considerable changes to corporate culture, visible support from top
management and patience. The considerable changes to corporate culture may be the
reason why so many lean manufacturing implementations fail. The failures are the
8

reason why so many managers view lean manufacturing just as another fad or buzzword
(Parks, 2002). The fact is that lean manufacturing is not a fad or buzzword, it works for
Toyota. Womack and Jones (1994) use Chrysler and Sony as examples in the
development of the lean concept. According to Conner (2001:1) the concept worked for
many others - from a 10-person manufacturer to larger manufacturers.
Leanness of a business or lean manufacturing involves lean development, lean
procurement, lean distribution and lean enterprise (Karlsson and Åhlström, 1996). In
lean manufacturing alone there are different views on the tools to be used to make a
manufacturer lean.
2.2 DIFFERENT VIEWS ON LEAN MANUFACTURING
This section explains the various lean manufacturing advocates’ viewpoints on lean
manufacturing and describes the different techniques each prefers. From these
techniques various techniques concerning assembly manufacturing and were selected
the advantages and value each tool might have added to a business.
Adendorff and De Wit (1997:16) explain that lean manufacturing is sometimes used
incorrectly as a synonym for JIT (just in time). JIT results in lean production. “Lean” is in
fact less of everything, for example human effort and manufacturing space. Lean
production methods need less inventory and have fewer defects than the competition,
with a greater variety of products.
Contrary to this Bicheno (2000:8) describes lean manufacturing as a philosophy, not as
a system or a technique. Essentially, it is about simplicity, flow, visibility, partnership and
value. Lean must be applied throughout the process - from the supply chain to
distribution. Bicheno uses five lean principles to eliminate waste and they are described
as follows: Specify value from the point of view of the customer, then identify the value
stream - this means to evaluate the processes to manufacture the products. He then
suggests mapping the physical flow of raw material and work-in-progress as it goes
through all the manufacturing processes. Then map the information flow (instructions to
9
the shop floor about what and when to produce). Mapping of information flow includes
purchase orders and customer orders that are essential to manufacturing. Each of these
processes includes value-adding and non-value-adding activities. The purpose of the
process recommended by Bicheno is to develop the value-adding activities and to get
rid of the non-value-adding activities and thereafter to make value flow by using one-
piece flow and removing bottlenecks that prevent flow from taking place. According to
Bicheno it is crucial to pull at the customer’s rate of demand by using the kanban
technique. Lastly, seek perfection through continual improvement.
Scodanibbio (2005) describes lean manufacturing under the heading of value-adding
management (VAM) (see Figure 2.2.1:). The foundation is total employee involvement.
All staff, from management to the worker on the shop floor, must be involved and
participate. There are three pillars carrying VAM, namely lean manufacturing, total
quality management (TQM) and total productive maintenance (TPM).
Lean manufacturing consists of lead-time reduction, stock reduction and flexibility of the
plant to meet customers’ needs. Productivity is the ability to produce efficiently with
better utilisation. With the three pillars in place, the aim should be to systematically
reduce waste (SEW) and orientate the business towards the client. Change of the
culture and values of the business will create a new performing system that will result in
value for the customers - this is called value-adding management. The lean process
cannot function if there is not a “zero defects” system in place and this may be
particularly true in a one-piece flow process. If the first operations pick up a quality
problem, the whole process line downstream comes to a halt. The same results are
experienced if a machine or tool, relative to the completion of a specific process, brakes
down - therefore TPM is important for the lean manufacturer.
Scodanibbio (2005) recommends techniques such as continuous flow, one-piece flow,
cell manufacturing, pull production, process mapping (arrow mapping), quick
changeover, P-Q analysis (categorising products in groups of product quantity produced
and numbers of process lines), systematic reduction of waste, value-stream mapping,
JIT and kanban to be used in the lean manufacturing process.
10

Figure 2.2.1: Carlo Scodanibbio’s Lean Manufacturing View
Equipment • Efficiency
• Utilisation
• Losses
Product service 100% quality
Zero Defects
W Waste
TPM Total
productive
maintenance
E Elimination of
TQM Total quality
management
S Systematic
LM Lean
Manufacturing
VAM Value-adding management
*search for excellence *continuous systematic improvement
*orientation to client *cultures and values
New performing systems
Source: A
Internet: h
Where S
manufac
ideal lea
Process • Lead time
• Stock
• Flexibility
Total employee involvement • Participation
• Creativity
dapted from Scodanibbio, C. (2005) Next generation lean manufacturing. [On-line]
ttp://www.scodanibbio.com/
codanibbio (2005) uses a building with pillars to describe his lean
turing philosophy, Conner (2001:15) uses a wagon with wheels to describe the
n enterprise (see Figure 2.2.2). Each wheel represents a critical part of the
11

business. The wheels are used as a visual measurement tool known as a Radar chart.
The steering tool is the vision of the company. The wheels represent the following:
• Sales, production and inventory management.
• Total organisation buy-in.
• Total quality management
• Lean manufacturing techniques.
Figure 2.2.2: Lean Enterprise Key Drivers
Lean manufacturing techniques
Total organisational buy -in
Sales, production, inventory planning
Total quality management
Lean Enterprise Key Drivers
Vision
S o u r c e : A d a p t e d f r o m C o n n e r , G . ( 2 0 0 1 : 1 ) L e a n m a n u f a c t u r i n g f o r t h e s m a l l s h o p D e a r b o r n , M i c h i g a n : S o c i e t y o f M a n u f a c t u r i n g E n g i n e e r s .
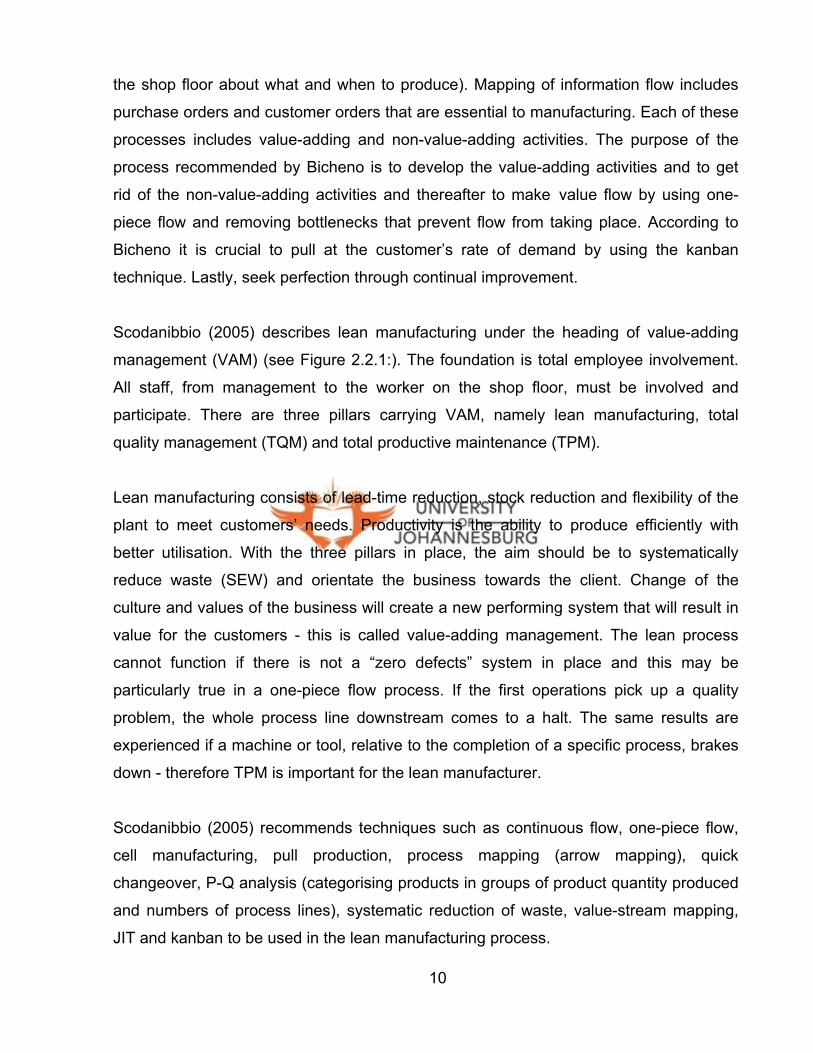
Each wheel has a number of spokes or key indicators that are the goals that can be
measured on a level from one to ten. Ten is at the outer diameter and represents
perfection. Zero is at the center and represents failure. When all the spokes (goals)
reach a level of ten, the wheel is a perfect circle. Figure 2.2.3 shows uneven wheels that
represent a non-lean wagon or enterprise.
12
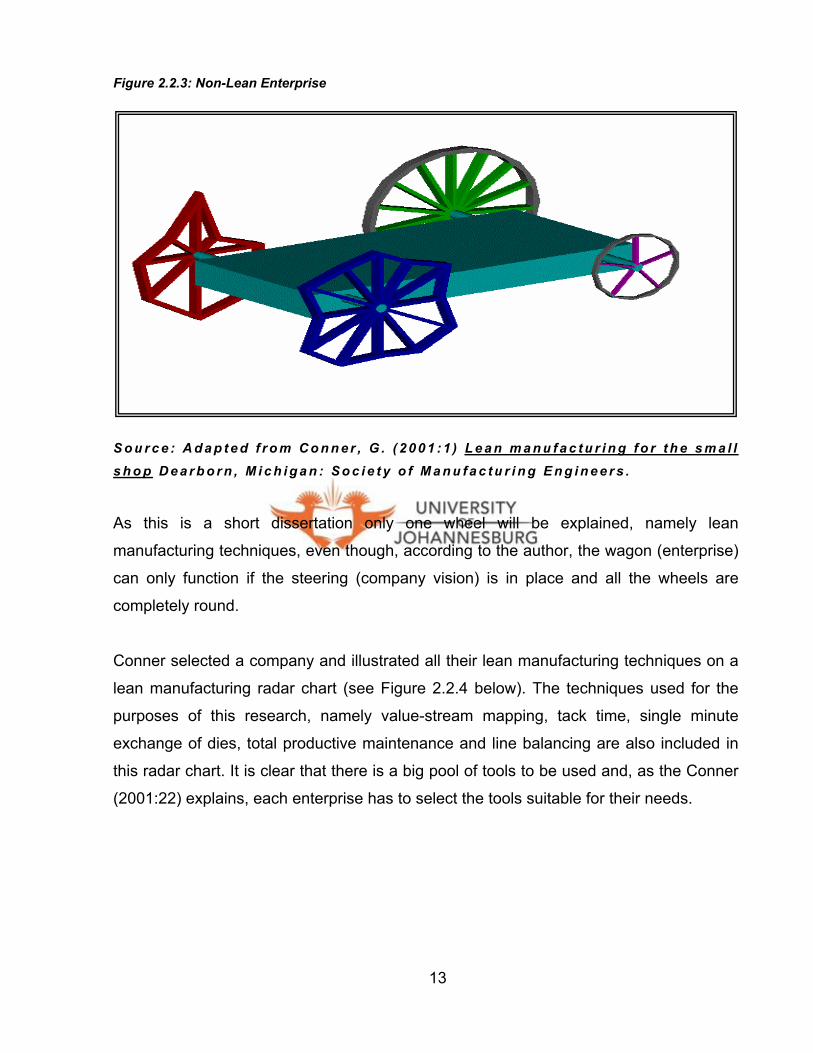
Figure 2.2.3: Non-Lean Enterprise
S o u r c e : A d a p t e d f r o m C o n n e r , G . ( 2 0 0 1 : 1 ) L e a n m a n u f a c t u r i n g f o r t h e s m a l l s h o p D e a r b o r n , M i c h i g a n : S o c i e t y o f M a n u f a c t u r i n g E n g i n e e r s .
As this is a short dissertation only one wheel will be explained, namely lean
manufacturing techniques, even though, according to the author, the wagon (enterprise)
can only function if the steering (company vision) is in place and all the wheels are
completely round.
Conner selected a company and illustrated all their lean manufacturing techniques on a
lean manufacturing radar chart (see Figure 2.2.4 below). The techniques used for the
purposes of this research, namely value-stream mapping, tack time, single minute
exchange of dies, total productive maintenance and line balancing are also included in
this radar chart. It is clear that there is a big pool of tools to be used and, as the Conner
(2001:22) explains, each enterprise has to select the tools suitable for their needs.
13

Figure 2.2.4: Lean Manufacturing Techniques
r t h e s m a l l
Lean Manufacturing Techniques
0123456789
10Value stream mapping
Takt time
One-piece flow
Pull system
SMED (setup)
OEE
Flow velocity
Productivity (labor cost)
Facility layoutStandard work
Jidoka (autonomation)
Machine reliability
TPM
Value-added ratio
Line balancing
Handling reduction
Sustainment of gains
Right-sized equipment
S o u r c e : A d a p t e d f r o m C o n n e r , G . ( 2 0 0 1 : 1 ) L e a n m a n u f a c t u r i n g f os h o p D e a r b o r n , M i c h i g a n : S o c i e t y o f M a n u f a c t u r i n g E n g i n e e r s .
present the various facets required to
sup r
•
Feld (2001:4) identifies five primary elements to
po t a solid lean manufacturing programme:
Manufacturing flow: Addresses the physical changes that ensures production
•
flow without inventory build-up.
The organisation: Focuses on identifying employees’ responsibilities and duties.
•
The crucial part is training in the new ways of working and communication.
Process control: Focuses on the monitoring, controlling and stabilising methods
•
to improve the process.
Metrics: Addresses the visible results-based performance measures, which
•
include target improvement and team rewards recognition.
Logistics: Provides meaning to operating rules and mechanisms for planning
and controlling the flow of material.
14

Feld (2001:4) believes that different techniques can be used to achieve lean
manufacturing with each of these elements. Halevi (1999: 50) disagrees and states that
“the lean system, however, is based on a strong and inseparable relationship between
JIT and TQM, leading to a virtual cycle in which quantity is a prerequisite of JIT, and JIT
allows quality to be improved through enhanced controls and increased visibility of all
productive activities. The lean system is also based on ‘jidoka’, which has the dual
meaning of automation and autonomous defect control”.
Heizer and Render (1999:240) believe JIT should be the main tool to reduce inventory
and that the focus should be on inventory reduction to remove any waste. JIT
techniques are employed to eliminate virtually all inventories. The reduction of inventory
removes the safety nets that allow a poor product too make its way through the
production process. This forces the manufacturer to build systems that will help
employees to produce a perfect part every time.
Another advantage of JIT is the contribution to space reduction. A close relationship is
developed with suppliers, i.e. helping them to understand the company’s needs and its
wants as a customer of the supplier. A further attempt is made at maintaining the decline
in costs by eliminating all activities that do not add value. Material handling, inspection,
inventory and rework jobs are among the likely targets because these do not add value
to production.
The workforce is continuously developed with a focus on improved training, employee
participation, commitment and work teams. Jobs are made more challenging, spreading
responsibility to the lowest post level possible. There is a reduction in the number of
posts and worker flexibility is encouraged. Lean manufacturing contributes to the
achievement of perfection, no faulty parts and no surplus inventory (Heizer and Render,
1999: 240).
The views of Karlsson and Åhlström (1996) are opposite to those of Heizer and Render
(1999: 240). Karlsson and Åhlström (1996) developed a model to put the different
principles of lean production in perspective. Lean production consists of lean
15

development, lean procurement, lean manufacturing, lean distribution and lean
enterprise. The following tools are used in lean manufacturing:
• elimination of waste;
• continuous improvement;
• multifunctional teams;
• zero defects;
• JIT;
• vertical information systems;
• decentralised responsibilities and integrated functions; and
• pull instead of push.
The purpose of elimination of waste is to reduce cost. Karlsson and Åhlström (1996)
explain that the elimination of waste is the most fundamental tool of lean manufacturing.
Everything that does not add value to the product is waste. Waste is the element that
the customer does not want to pay for. The most important forms of waste are inventory,
down time of machines, transportation of parts and lack of quality.
Continuous improvement is the second important tool in the lean manufacturing
process. Karlsson and Åhlström (1996) state that ongoing improvement implies
involvement of everyone who is part of the process in quality circles. This means that
employees meet and come up with suggestions and are responsible for the
implementation of their suggestions. Zero defects indicate how lean the company works
in order to attain quality. The main objective is to prevent defects from occurring by
using Poka Yoke instead of controlling the parts produced.
The views of Slack, Chambers and Johnston (2001:482) about lean manufacturing
principles are similar to those of Heizer and Render (1999:240), (Halevi 1999: 50) and
Adendorff and De Wit (1997:16). Slack et al. believe lean manufacturing is just another
phrase to describe JIT, as well as continuous-flow manufacture, high-value manufacture,
stockless production, war on waste, fast-throughput manufacture and short-cycle
manufacture. They also see JIT as a western personification of a philosophy and its
techniques developed by the Japanese. This philosophy espouses doing the simple
16
things well and reducing waste step by step. The philosophy consists off three elements,
namely eliminating waste, involving everyone and continuous improvement (illustrated in
Figure 2.2.5 below).
Figure 2.2.5: “Just In Time” Philosophy
S o u r c e : A d a p t e d
e d . O p e r a t i o n s M a
JIT uses some of the
include basic work
responsibility to mee
the authority to stop
allow shop floor per
shop floor problems
JIT as a philosophy of operations
• Eliminate waste
• Involve everyone
• Continuous improvement
JIT as a method of planning and control
• Pull scheduling
• Kanban control
• Levelled
scheduling
• Mixed modelling
• Synchronisation
JIT as a set of techniques for managing operations
• Basic working
practices
• Design for
manufacture
• Operations focus
• Small simple machines
• Layout and flow
• TPM
• Set-up reduction
f r o m S l a c k , N . , C h a m b e r s , S . & J o h n s t o n , R . ( 2 0 0 1 ) . 3 r d
n a g e m e n t . E n g l a n d : P r e n t i c e H a l l .
following techniques to manage, plan and control. The techniques
ing practices whereby the manufacturer gives employees the
t the required safety standards and quality of the product, as well as
the line and delegate simple material scheduling to employees,
formance and monitoring to be done by employees and to solve
. To decrease shop floor problems, designers must design for 17
manufacturing. This means designers must take manufacturing constraints into
consideration and design a manufacturing friendly product. This can save 70% to 80%
of manufacturing cost. Operation must also focus on simplicity, standardisation and
small manageable sets of production, which include small, simple machines. The
principle is using several small machines instead of one large machine. It is important
that the layout of the machines promotes a smooth operation flow of materials, data and
people in the operation. A final technique that ensures the operation flows smoothly is
total productive maintenance (TPM) that aims at eliminating unexpected down time by
using employees to do daily routine maintenance (Slack et al., 2001:482).
2.3 TECHNIQUES USED FOR THE PURPOSE OF THIS RESEARCH
According to Halevi (1999:26) there are more than 90 different proposed methods for
achieving lean manufacturing. The following techniques were chosen for discussion:
ABC product analysis, assembly line balancing, cell manufacturing, continuous flow,
cycle time, JIT, one-piece flow, product-quantity analysis, Poka Yoke, single minute
exchange of dies, takt time, TPM, TQM, value-stream mapping and elimination of waste.
2.3.1 ABC Analysis
Heizer and Render describe ABC analysis as the process that identifies which items are
more important to the organisation than others. Therefore, ABC analysis divides on-
hand inventory into three categories based on the demand and cost per unit. Category A
are high-value items (high in cost); they make up 70% to 80% of the total inventory cost
even though they sometimes contribute to only 15% of the inventory volume. Category B
items contribute 15% to 25% to inventory cost and 30% to the inventory volume.
Category C items contribute 5% to inventory cost and 55% to the inventory volume. The
advantage of ABC analysis lies in the ease to manage resources and control inventory.
More time and effort are spent on category A items and less time on category C and D
items. The end results include better forecasting and physical control becomes easier in
that the right amount of time is spent on the high-value items. As a result supplier
18

deliveries become more reliable and consequently safety stock is reduced (Heizer and
Render, 1999:441).
2.3.2 Assembly Line Balancing
According to Heizer and Render (1999:340) assembly line balancing is achieved by
maximum output at each workstation on the production line so that delay is minimised.
Each workstation must spend the same amount of time on the work allocated to it before
passing it on to the next workstation to prevent a pile-up. A workstation that does not
use a similar time period to complete the work allocated to it, is called an unbalanced
workstation or an unbalanced cell. Every workstation that is not balanced adds up to the
balance loss of the total production line. Slack et al. (2001:199) explain balance loss as
the proportion of the production time that is not used productively.
The use of line balancing as a technique has the following advantages: it reduces the
idle time at each workstation and the employees become more productive, thereby
reducing the operating cost and setting the stage for one-piece flow.
2.3.3 Cell Manufacturing
Slack et al. (2001:191) explain cell manufacturing as all the requirements needed to
complete all the stages of the process grouped together in one place. This implies
bringing together people and machines, previously dispersed in an arrangement, closer
together and arranging them in a straight line or “u-shape”. The condition of a cell is that
the volume of the product must be such that it validates the need for a cell. Therefore, a
work cell is built around a product or a group of products that require the same
processes with minimal changes to the layout. This is done to minimise changeover
times from one product to the next. A cell is made up of multiple workstations grouped
together, where a workstation is a specific process to be completed before the next
process can take place at the next workstation.
19

According to Slack et al. (2001:199) the advantages of cell manufacturing are as follows:
Working close together in a group can result in more motivated employees because of
work satisfaction and the possibility of working at different workstations simultaneously.
One employee can work at more than one operating station at a time because the
stations are closer together, where previously an operator was needed to fill every
operating station. This results in higher throughput.
Heizer and Render (1999:331) further explain that cell manufacturing will reduce work-
in-progress and inventory, because the layout of the cell is designed to manufacture
from machine to machine or from process to process. Where the line is balanced and
each process takes more or less the same time as the previous process, there is no
need for inventory between processes. This will result in reduced utilisation of floor
space; less space will be needed between processes to accommodate work-in-progress.
This has a direct impact on the raw material and finished goods inventories. Because
the changeover time is shorter and the line is more flexible, less finished goods are
needed to cover for long runs of one typical product before changeover to the next, and
less work-in-progress allows for less raw material inventory.
Sometimes fewer workers are needed and this results in a reduction in labour cost. The
quality improves because each employee is responsible for qualifying the previous
person’s work, which results in quality improvement and a reduction in the risk of high
volumes of rework. The effect of no or little work-in-progress means mistakes can be
identified early or immediately. Previously, if there were quality problems all work-in-
progress needed to be reworked. Cell manufacturing forces the workers to communicate
with each other. The result is improved scheduling which has a positive effect on
material flow, resulting in better utilisation of machines and equipment. The improved
communication outcome is that employees help each other where there is a sudden
build up of work in one process. This also stimulates the employees because they have
to be more flexible and learn more than one skill.
According to Slack et al. (2001:199) the disadvantage is that the changeover from the
existing method of layout to cell manufacturing layout can be costly. More or different
20
plant equipment may be required. In some cases it can lead to lower plant utilisation. If
there is a breakdown, it can affect the whole cell. A good maintenance plan is therefore
needed.
2.3.4 Continuous Flow
Rother and Shook (2001:1) claim that continuous flow is the ultimate objective of lean
manufacturing. The production flows continuously from one workstation to the next and
from one department to the next without work-in-progress piling up.
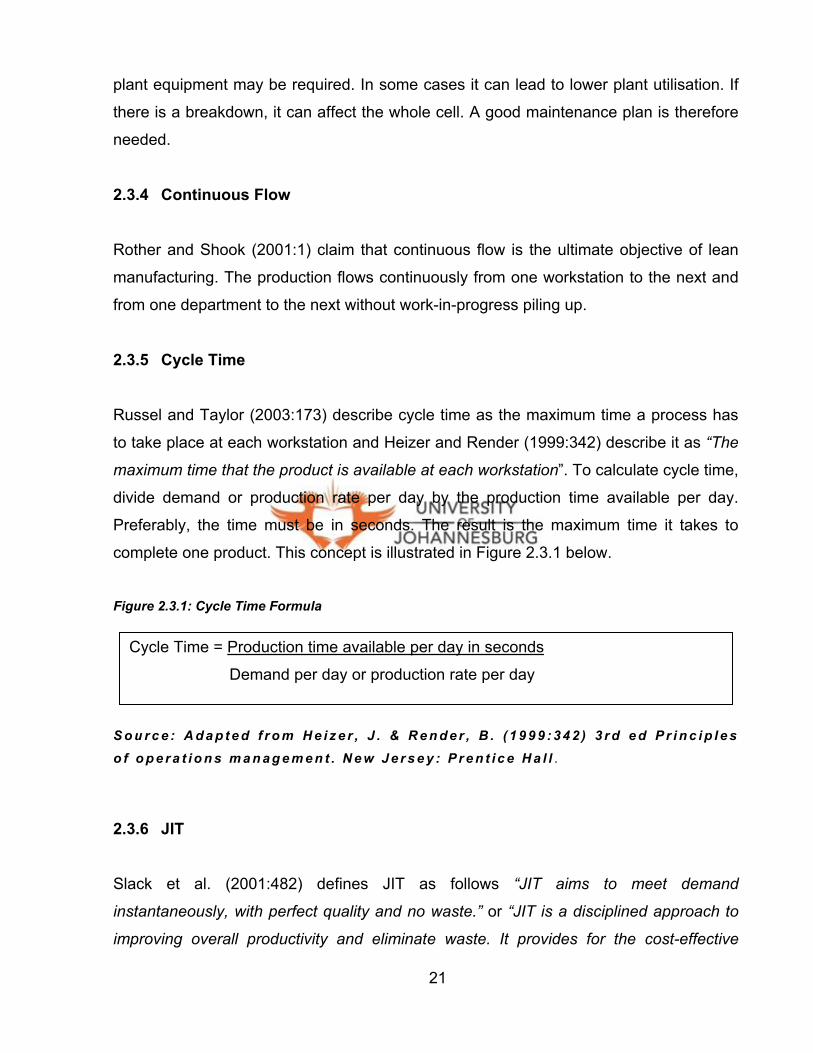
2.3.5 Cycle Time
Russel and Taylor (2003:173) describe cycle time as the maximum time a process has
to take place at each workstation and Heizer and Render (1999:342) describe it as “The
maximum time that the product is available at each workstation”. To calculate cycle time,
divide demand or production rate per day by the production time available per day.
Preferably, the time must be in seconds. The result is the maximum time it takes to
complete one product. This concept is illustrated in Figure 2.3.1 below.
Figure 2.3.1: Cycle Time Formula
So
2
S
in
im
Cycle Time = Production time available per day in seconds
Demand per day or production rate per day
o u r c e : A d a p t e d f r o m H e i z e r , J . & R e n d e r , B . ( 1 9 9 9 : 3 4 2 ) 3 r d e d P r i n c i p l e s f o p e r a t i o n s m a n a g e m e n t . N e w J e r s e y : P r e n t i c e H a l l .
.3.6 JIT
lack et al. (2001:482) defines JIT as follows “JIT aims to meet demand
stantaneously, with perfect quality and no waste.” or “JIT is a disciplined approach to
proving overall productivity and eliminate waste. It provides for the cost-effective
21

production and delivery of the necessary quantity of parts at the right quality, at the right
time and place, while using the minimum facilities, equipment, materials and human
resources” The main advantage of JIT is the reduction of inventory and waste.
2.3.7 One-Piece Flow
With one-piece flow products are passed one piece at a time from operation to operation
with a first-in first-out approach (FIFO) (Feld, 2001:72).
“A company’s customers could be best served by switching from batch-style operations
to one piece operations that extent from one-piece ordering to one-piece flow, one-piece
production, one-piece inspection and one-piece delivery” (Feld, 2001:72).
Rules and conditions of one-piece flow according to Sekine (1992:3):
• Base the cycle time on market requirements.
• Base equipment capacity utilisation on cycle time.
• Centre production on assembly processes.
• Factory layout must be conducive to one-piece production.
• Goods must be conducive to one-piece production.
Advantages of one-piece flow according to Feld (2001:72):
• The improvement in manufacturing lead-time.
• Drop-in level of inventory.
• The feedback on quality issues are far more superior to the advantages offered by
batch and queue systems.
• Faster delivery response to customers.
• Less staff needed to complete the process, which results in employees doing their
own quality checks.
2.3.8 Product-Quantity (P-Q) Analysis
P-Q analysis uses the different types of products and their respective quantities to
arrange products in percentage groups. Group A products are the runners and use the
22

40/60-rule. This means 40% of the products will account for 60% of the parts volume
and the process used to manufacture these products. The suggested manufacturing
process is a free flow-line. Group B products are classified as repeaters and will use a
flexible manufacturing cell; specifically U-cells for wide-variety, small-lot production.
Group C products fall into the group “strangers”, where production of these items may
fall into a pattern of once per year. These products are best managed by a separate
production area or outsourcing (Sekine, 1992:125 and Feld, 2001:63).
2.3.9 Poka Yoke
Literally translated, Poka Yoke means “fool proof”, i.e. a device or technique that
ensures the production of a good unit every time (Heizer and Render, 1999:96). This is
a means by which the manufacturer can take the guessing out of employees’ duties.
The employee must either use a checklist or a device or technique in order to ensure
that the next product or service is defect free. “A better term for Poka Yoke devices
might be ‘mistake proofing’” (Conner, 2001:114).
2.3.10 Single Minute Exchange of Dies (SMED)
This is “sometimes called ‘quick changeover’” (Russell and Taylor, 2003:523), “zero
changeover” (Sekine 1991:117) or “set-up reduction” (Rubrich and Watson, 2000:311).
Halevi (2001:265) explains SMED as the objective to reduce set-up times. The aim is to
use different techniques to reduce set-up time to a single minute. One of the techniques
is to separate internal and external set-up operations: “Internal set-up can be performed
only when a process is stopped … external set-up can be performed in advance”
(Russell and Taylor, 2003:523).
According to Rubrich and Watson (2000:346), when a manufacturer starts to introduce
the set-up reduction process, the results after one year can show up to 41%
improvement in reducing the set-up time. After four years the reduction time can be
improved by 62%. Advantages of SMED have a direct influence on utilisation and
productivity will increase. SMED will improve the flexibility of the cell to change quickly to
23

the next order and therefore smaller orders can be planned and delivery to the customer
can be faster. SMED reduces production cost and inventory, and eliminates waste
(Rubrich and Watson, 2000:311).
2.3.11 Takt Time
Rother and Shook (2001:13) explain takt time as the synchronisation of production with
the demand of the customer. Takt is the German word for pace or beat. This means the
manufacturer must manufacture at the rate at which the customer wants the products. If
the manufacturer produces at a slower rate, the customer demand will not be met,
resulting in a loss in sales. Producing at a faster rate is a waste of resources and it
increases inventory - a further form of waste. Inventory is expensive as it involves
handling and storage costs, as well as more storing space. The formula to calculate takt
time is shown in Figure 2.3.2 below.
Figure: 2.3.2: Takt Time Formula
Takt Time = Production Time Available
Customer Demand
S o u r c e : A d a p t e d f r o m R o t h e r , M . & S h o o k , J . ( 2 0 0 1 : 1 3 ) C r e a t i n g c o n t i n u o u s
f l o w . M a s s a c h u s e t t s : T h e l e a n e n t e r p r i s e i n s t i t u t e I n c . [ O n - l i n e ] . I n t e r n e t : http://www.lean.org.
An advantage of takt time is that the technique forces the manufacturer to manufacture
just what the customer requires. Therefore, it reduces overproduction, saves resources,
limits overtime and saves on inventory levels. One disadvantage is that no backup
inventory is available if something goes wrong.
24
2.3.12 Total Preventative Maintenance (TPM)
Slack et al. (2001:659) define TPM as “the productive maintenance carried out by all
employees through small group activities.”
TPM makes use of five goals to establish a good maintenance practice:
• Improve equipment effectiveness by analysing all the losses incurred by down time,
and speed and defect losses.
• Achieve autonomous maintenance by allowing employees to be responsible for
some of the maintenance tasks.
• Plan maintenance by having a preventative maintenance plan and describing the
responsibilities of each operating employee and maintenance employee.
• Train all staff in relevant maintenance skills.
• Achieve early maintenance management by designing equipment to avoid
maintenance altogether.
TPM is a continuous process of improving the effectiveness of the production equipment
by involving all the people in the organisation (Rubrich and Watson, 2000:209).
Some of the greatest advantages of TPM include the following:
• Improvement of quality.
• Machinery and equipment are in the best operating condition.
• Manufactured components that have less variation.
• Improved productivity.
• Less down time, stoppages, reduced machine speeds to accommodate poorly
maintained machines, resulting in a more productive company.
• Improved delivery to customers.
• Improved customer satisfaction because customers can rely on scheduled delivery
dates.
• Reduced inventory, no more safety stock in case of breakdowns.
• Improved job satisfaction, because operators will not become frustrated when their
machines brake down.
25
Rubrich and Watson (2000: 216) compare the “before” and “after” of implementation of
TPM. Before implementation of TPM operators have down time because of breakdowns;
non-conforming products and reworks; loss of operating speed; unnecessary
adjustments; idling; or stoppages. Down time adds up to 50% of the total operating time.
Customers pay for 100% of the production time where, without TPM, only 39% of the
time is productive. With TPM production time increases to 87%, with only 2% of the
production time spent on TPM.
2.3.13 Total Quality Management (TQM)
Conner (2001:21) states that doing it right the first time plays a critical role in lean
manufacturing. He further states that it does not matter which quality system is used -
the ISO 9000, the six-sigma approach or any other quality systems - as long as the
system meets the following principles: “the systems must be sound, the practices
defined and the processes capable”.
Heizer and Render (1999:82) describe TQM as the “management of an entire
organisation so that it excels in all aspects of products and services that are important to
the customer.” They describe five concepts for an effective TQM programme, namely
continuous improvement, employee empowerment, benchmarking, just in time (JIT) and
the knowledge of TQM tools. The knowledge of TQM tools includes quality function
deployment, the tagunchi technique, pareto charts, cause and effect diagrams and
statistical process control.
Conner (2001:144) explains that there are more that 700 tools that can be used to solve
problems. This proves TQM is a subject to be researched on it is own. For the purposes
of this research the benefits and explanation of TQM are relevant.
26

Slack et al. (2001:677) explain TQM as follows: “TQM is best thought of as a philosophy
of how to approach quality management.” It lays particular emphasis on the following:
• Meeting the expectations of the customers.
• Covering all parts of the organisation.
• Including every person in the organisation.
• Examining all costs related to quality, especially failure cost.
• Getting things “right the first time”.
• Developing the system and procedures that support quality and improvement.
• Developing a continuous process of improvement
An advantage of TQM, according to Slack et al. (2001:677), is that the expenditure on
and effort to prevent defect parts will result in a more than equivalent reduction in other
costs. The biggest advantage is a more than satisfied customer. One of the measures to
monitor TQM success is the number of customer complaints and claims.
2.3.14 Value-Stream Mapping (VSM)
Rother and Shook (1999:3) claim that plotting the material flow, information flow and the
process to manufacture a product on paper (value-stream mapping) will include all the
actions needed to manufacture a product. The person doing the mapping work will
include all the processes and actions in the current process whether these actions add
value or not. Value-stream mapping is to view the overall picture of the business - from
supplier to customer. Value-stream mapping is a pencil-and-paper tool where the lean
manufacturing specialist will map all the actions needed to get information flowing at the
top of the sheet of paper and the material flow at the bottom. From this map the lean
specialist will identify the wastes and draw a new map of how value should actually flow.
VSM gives you a big picture of the operating functions of the organisation and helps you
understand the business as a whole. Identifying the sources of waste becomes much
easier. The map shows a link between the information and material flow, which will help
to create and improve on the material flow and create a futuristic map with less waste.
27
.
2.3.15 Waste (Muda)
Scodanibbio (2005) defines waste as follows: “Whatever is not useful is waste.” and “
Whatever does not contribute to profitability is waste.” and “useful = value adding” and “
adding no value = waste”
According to Slack et al. (2001:488) waste can be described in seven categories:
• Overproduction: producing more than what is needed immediately through the next
process.
• Waiting time is measured in terms of machine utilisation, the efficiency of machines
and people, and materials queuing for changeover.
• Transport: moving of materials around the plant, double handling of work in
process.
• Processes: some process can be attributed to poor component design or poor
maintenance and can be eliminated.
• Unnecessary inventory: inventory in stores (in the form of components or finished
goods), buffer stock or safety stock must be reduced to a minimum.
• Defects: he consequences of not doing it right the first time: rework, rejects,
unnecessary inspection.
• Motion: excessive reaching and walking to do your normal duties.
Rubrich and Watson (2000: 271) state that 50% of production time is spent on waste
and that only 37% of time is actually productive. To improve productivity waste must be
removed. When waste is eliminated, the productive time can increase to 87%. By
reducing waste, productivity will increase.
28

2.4 CONCLUSION
Lean manufacturing does not provide a quick fix tool and needs a well thought-out
implementation strategy. It takes time to implement and the manufacturing culture must
change to adapt to the new way of doing business. A few lean manufacturing advocates
believe that lean manufacturing consists of JIT, removing waste and TQM. The other
lean manufacturing believers mostly advocate improving value-adding processes and
removal of non-value-adding processes. All of the lean manufacturing advocates agree
that inventory is the most measurable means to determine whether a manufacturer is
lean or not. There is an almost endless list of techniques to be used in becoming lean.
29
CHAPTER 3
RESEARCH DESIGN AND METHODOLOGY
This chapter provides a detailed background to the research design, questionnaire
design and methodology used to conduct the survey. This is followed by the discussion
concerning the population and sample size. In conclusion an explanation of the method
used to analyze the data is provided.
3.1 RESEARCH QUESTION
To what extent does the application of lean manufacturing techniques in assembly
manufacturing contribute to an increase in productivity, a reduction in inventory levels
and operating cost.
3.2 RESEARCH DESIGN
Research design is a plan or blueprint of the methods employed by the researcher to
accomplish his/her objectives (Mouton, 2001:55).
The research took on the form of a quantitative empirical survey. According to Mouton
(2001:53) empirical studies address real-life problems by collecting new data or
analysing existing data. The researcher collected new data (primary data) for the
research by using a structured questionnaire. Primary data is data captured at the point
where it is generated and the data is captured with a specific purpose in mind (Wegner,
1999:13).
30

3.2.1 Quantitative Research
According to De Vos, Strydom, Fouché and Delport (2003:138) quantitative research
includes experiments, surveys and content analysis. Quantitative research is more
formally structured, more explicitly controlled and more acceptable to the physical
sciences than a qualitative approach. In a quantitative approach the researcher is only
an objective observer; studies are focused on specific questions or hypotheses; and
data collection methods are structured prior to the study and applied in a standardised
manner. Measurements are focused on specific variables that are quantified through
rating scales, frequency counts and other means. Analysis takes the form of statistical
methods to determine associations and differences between the variables (De Vos et
al., 2003:363).
3.2.2 Surveys
The term “survey” means to collect data or information, and the opinions of the
population. Surveys use structured and predefined questions. The aim of a survey is to
determine whether theories are related to the observable facts, to test theories and seek
relationships between the data. Surveys assist in bringing models, theories, concepts
and variables into better focus (Filippini, 1997).
3.2.3 Questionnaire Design
Mouton (2001:100) states that existing instruments can be used as they have their
advantages; or the researcher can design a new instrument. The researcher decided a
new design would be more suitable. It was a limitation that the instrument had to be
tested for validity. A pilot study was done to test the validity of the questionnaire.
Other errors made in questionnaires, according to Mouton (2001:100), are ambiguous or
vague items, double-barrelled questions, the order and sequence of questions and
leading questions. The researcher therefore used the help of Statcon at the University of
Johannesburg to structure the questionnaire.
31

The questionnaire was descriptive in nature and the questions were constructed in three
sections. The first section covered information about the respondent, the second section
covered the respondent’s company and section three covered the techniques and the
value the techniques might have added to the company. Because the techniques were
selected from the literature, it was possible that they might not form part of the
respondents’ field of reference. Each technique was therefore accompanied by a short
description.
Vinten (1995) states that closed questions may be referred to as “check answer”, “pre-
coded” or “restricted”. The advantages are that closed questions are easier to handle
and cost less to manage. Another advantage is that they take up less interview time and
will therefore possibly increase the responses from respondents. Open questions can
lack clarity.
Ranchod and Zhou (2001) find a questionnaire of more than 6 pages intolerably lengthy.
The researcher was therefore restricted to 6 pages and had to tabulate the last eight
techniques, requesting simple “Yes” or “No” responses – a limitation of this research.
3.2.4 Data Types
Wegner (1999:7) states that the type of data gathered determines the type of analysis
that can be performed on the data. The questionnaire used mainly qualitative data.
Wegner (1999:7) describes qualitative data as data with non-numeric responses. The
data can be broken down into different groups, namely nominal-scale data, ordinal-scale
data, interval-scale data and ratio-scale data. Nominal-scale data was used where
respondents had to choose between a “Yes” and “No” response. Nominal-scale data,
according to Wegner (1999:8), is where there is no implied order between the groups of
variables. The researcher used nominal-scale data where the respondents had to
indicate whether they were familiar with the technique described. The rest of the
questionnaire consisted of ordinal-scale data. According to Wegner (1999:8) ranking is
implied between the categories - although there is a difference between categories, the
difference cannot be measured exactly. The researcher used ordinal-scale data to
32

determine how frequently the specified technique was used (“Not at all, Sometimes,
Often and Always” - refer to Appendix B). Ordinal-scale data was used to determine the
value of the specified technique to the respondent’s organisation (“To no extent, to a
small extent, to a moderate extent and to a large extent”) The value of each technique
was used as described by the literature and was limited to inventory reduction and
productivity improvement, improvement in inventory control, reduction in idle time and
reduction of operating cost.
3.3 METHODS USED TO CONDUCT THE SURVEY
A pilot study was conducted to verify reliability and validity, after which minor changes
were made. The responses from the pilot study were excluded from the research results.
Mouton (2001:103) claims that a common error in questionnaire design is that the
questionnaire is not pre-tested.
3.4 POPULATION AND SAMPLING
According to general statistics the following sectors contribute to South Africa’s
economy: Manufacturing 18.2%, Mining 6.5%, Agriculture 3.7 % and Finance 13.1%.
These statistics show that manufacturing contributes the biggest part of the economy in
South Africa (South Africa, 2005). (www.bombaychamber.com/southafrica.htm).
According 1999 census results census, there are 25 788 manufacturers in South Africa,
of which 11 099 (or 43%) are situated in Gauteng. (Statistics South Africa, 1996).
(www.statssa.gov.za). The number of these manufacturers concerned with assembly
manufacturing is however unknown.
Wegner (1999:170) describes sampling as the method to select a representative
observation from the population. There are two basic methods of sampling, namely non-
probability and probability sampling. Convenient sampling as a non probability sampling
technique was used. For these purposes three list were obtained. One list from the
33
South African Chamber of Business (SACOB), one from the UNISA Quality Forum and
another one from the Production Management Institute (PMI).
These list were scrutenised for possible companies that fall under the classification of
assembly manufacturers. A total of 222 companies were identified and selected
specifically in the Johannesburg surrounding area of Gauteng to form part of this
research.
3.5 METHODOLOGY
All potential respondents (222) on the above lists where contacted (where contact
numbers/e-mail addresses were provided) to verify their contact details and to request
their participation. 40 of the potential respondents contact details could not be verified
and they had to be excluded from the lists.
Ranchod and Zhou (2001) stated that, in general, responses from e-mail surveys are
low because of lack of anonymity, formal image, incentive and cosmetic features. The
lack of formal image was overcome by designing the questionnaire in Microsoft Word
and then attaching it to the e-mail message.
The questionnaire was accompanied by a covering letter stating the background and
purpose of the research (Appendix A & B). As an incentive for response the covering
letter notified respondents that they could apply for the executive summary of the
research result. The questionnaire together with the covering letter were sent via e-mail
and fax to respondents.
A total of 222 questionnaires were e-mailed, faxed or delivered by hand. The e-mail and
fax responses were poor, as predicted by the literature study (Ranchod and Zhou: 2001)
Of the 153 questionnaires sent via e-mail only 4 responses were returned. Of the 49
questionnaires which were delivered by hand, 14 of them where unfit to be used for this
research. Due to the poor response received via e-mail, other assembly manufacturers
not listed on the above lists were randomly approached to participate in this research. A
34
further 20 questionnaires were completed in this manner of which 17 were fit for purpose
of this research.
A total of 215 questionnaires were sent out, of which 56 were returned. During the
analyses a further seven questionnaires where declared invalid. This constitutes a
response rate of 22,7%.
3.6 METHOD OF DATA ANALYSIS
3.6.1 Chi-Square test
With the help of STATCON at the University of Johannesburg the data was captured
and sorted in frequency tables. Thereafter the data was sorted in cross-tables or
matrixes as described by Field (2005:140) and then the Pearsons Chi-square test was
used to test for significance. Pallant (2005:288) describes the Chi-square test as a test
that explores the relationship between two clear-cut variables. Wegner (1999:248)
describes the Chi-square test as a measure to test the hypotheses on patterns of
outcomes of a random variable in a population. The Chi-square is written as χ² and
measures the independence of association. “Independence implies that outcomes of
one random variable in no way influence the outcomes of a second variable” (Wegner,
1999:249).
In some cases “Fisher’s Exact Probability Test” was used. According to Pallant
(2005:288) Fisher’s test can be used in the place of the Chi-square test. Fisher’s test
can be used in a case where a 2x2 table is used and the rule of Chi-square of a
minimum count in a cell of the table is violated. A Chi-square value of less than 0.05
shows a significant relationship between the data variables. The strength of this
relationship (the Pearson relationship) can then be tested. Pallant, (2005:126) uses
guidelines suggested by Cohen (see Table 3.6.1 below):
35

Table 3.6.1 Statistical Strength of Relationship
Correlation value=r Correlation value=r Strength of relation ship
r= 0.1 to 0.29 r= -0.1 to -0.29 Small
r=0.3 to 0.49 r=-0.3 to -0.49 Medium
r=0.5 to 1.0 r=-0.5 to -1.0 Large
S o u r c e : A d a p t e d f r o m P a l l a n t , J . ( 2 0 0 5 : 1 2 6 ) 2 n d . S P S S S u r v i v a l m a n u a l .
N e w Y o r k : O p e n U n i v e r s i t y p r e s s .
3.6.2 Cross-Tabulation
Cross-tabulation is when the data of two variables are formatted in table form to test the
relationship between them. One variable is prearranged in columns and the other in
rows. The point where the two variables cross (row and column) on the table is the point
where the value in this cell has a shared influence. The data is expressed in a
percentage of the row total or the column total (Eiselen, Uys and Potgieter 2005:139).
3.7 CONCLUSION
The research was conducted in the Johannesburg area of the Gauteng Province, where
most of South Africa’s industries are concentrated. The main objective was to find out
which techniques manufacturers use and to what extent these techniques add increase
or reduce inventory, productivity and operating cost for the assembly manufacturer. The
research was mainly a quantitative empirical study. STATCON at the University of
Johannesburg assisted with data capturing, analysis, interpretation and presentation of
the results as presented in Chapter 4.
36
CHAPTER 4
DATA PRESENTATION AND ANALYSIS
This chapter makes use of bar charts and crosstables to represent the data that was
studied and analyzed. Only relevant and significant information was highlighted and
commented on. The structured questionnaire consisted of three sections. Section A
requested information about the respondents, section B requested information about the
nature of the manufacturer and section C requested information about the knowledge,
use and results obtained with regard to various techniques implemented by the
respondents.
4.1 SECTION A (INFORMATION ABOUT THE RESPONDENT)
4.1.1 Job Designations of Respondents
The positions of the various respondents are summarised in Figure 4.1 below. First-line
supervisors and managers each accounted for 22% of the population. The “Foreman”
section accounted for 14% (the smallest part of the population), while the senior
managers accounted for 25% (the largest part). The “other” section 18% included, inter
alia, directors, owners and engineers.
37

Figure 4.1: Designations of Respondents
22%
14%
22%
25%
18%
0%
5%
10%
15%
20%
25%
30%
Designations of Respondents
Firstline supervisorForemanManagerSenior managerOther
4.1.2. Respondents’ Qualifications
The respondents were asked to indicate their highest qualifications. This is summarised
in Figure 4.2 below. Of the respondents, 9% indicated having lower than grade 12 and
22% indicated having grade 12 or equivalent education. The biggest part of the
population 49% had post-school diplomas, 18% had university or technikon degrees and
2% had post-graduate degrees.
38
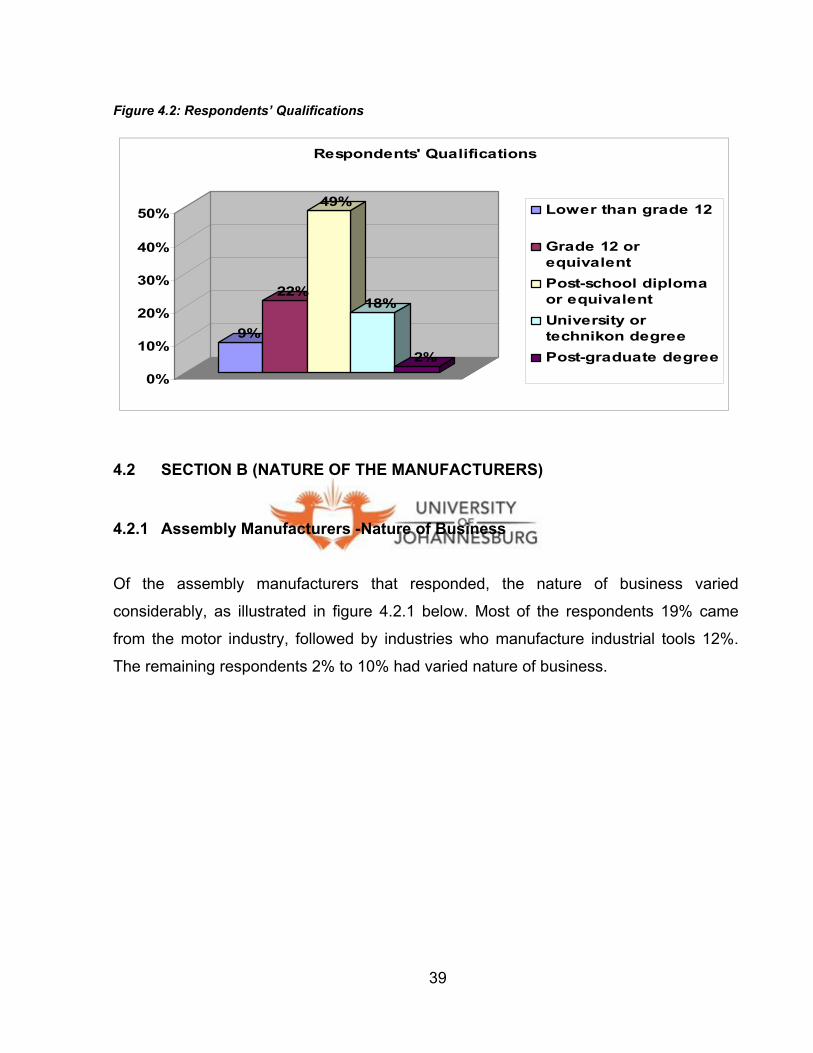
Figure 4.2: Respondents’ Qualifications
9%
22%
49%
18%
2%0%
10%
20%
30%
40%
50%
Respondents' Qualifications
Lower than grade 12
Grade 12 orequivalent Post-school diplomaor equivalentUniversity ortechnikon degreePost-graduate degree
4.2 SECTION B (NATURE OF THE MANUFACTURERS)
4.2.1 Assembly Manufacturers -Nature of Business
Of the assembly manufacturers that responded, the nature of business varied
considerably, as illustrated in figure 4.2.1 below. Most of the respondents 19% came
from the motor industry, followed by industries who manufacture industrial tools 12%.
The remaining respondents 2% to 10% had varied nature of business.
39
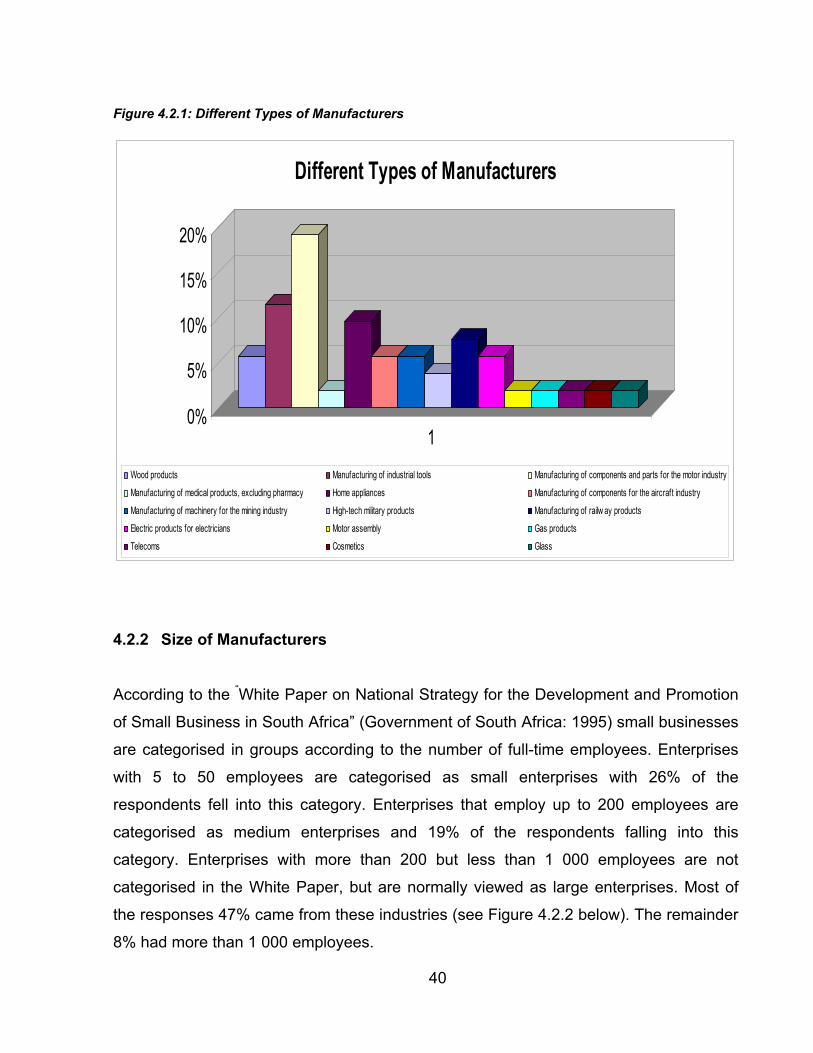
Figure 4.2.1: Different Types of Manufacturers
0%
5%
10%
15%
20%
1
Different Types of Manufacturers
Wood products Manufacturing of industrial tools Manufacturing of components and parts for the motor industry
Manufacturing of medical products, excluding pharmacy Home appliances Manufacturing of components for the aircraft industry
Manufacturing of machinery for the mining industry High-tech military products Manufacturing of railw ay products
Electric products for electricians Motor assembly Gas products
Telecoms Cosmetics Glass
4.2.2 Size of Manufacturers
According to the “White Paper on National Strategy for the Development and Promotion
of Small Business in South Africa” (Government of South Africa: 1995) small businesses
are categorised in groups according to the number of full-time employees. Enterprises
with 5 to 50 employees are categorised as small enterprises with 26% of the
respondents fell into this category. Enterprises that employ up to 200 employees are
categorised as medium enterprises and 19% of the respondents falling into this
category. Enterprises with more than 200 but less than 1 000 employees are not
categorised in the White Paper, but are normally viewed as large enterprises. Most of
the responses 47% came from these industries (see Figure 4.2.2 below). The remainder
8% had more than 1 000 employees.
40

Figure 4.2.2: Number of Full-Time Employees
26%
19%
47%
8%
0%
10%
20%
30%
40%
50%
Number of Full-time Employees
Less than 50
At least 50, but lessthan 200At least 200, but lessthan 1 0001 000 or more
4.3 SECTION C (INFORMATION REGARDING THE TECHNIQUES)
This section covered questions about the different techniques, whether the respondents
were familiar with the techniques and how frequently the techniques were used in the
respondents’ place of work. The respondents then indicated to what extent the
techniques improved inventory reduction or reduced operating cost and improved
productivity.
4.3.1 Technique 1: ABC Analysis
Familiarity with technique
Of the respondents 69% indicated that they were familiar with ABC analysis as a lean
manufacturing technique and 39% indicated that they were unaware of this particular
technique. 19% of the respondents that were familiar with the technique indicated that
they didn’t utilise the technique within their particular organisation.
41

Reduction of Inventory levels and Control Most of the respondents 54% indicated that this technique resulted in a moderate
reduction in inventory levels as shown in Figure 4.3.1 below. Only 4% indicated that this
technique to no extent contributed to a reduction in their inventory levels.
Figure: 4.3.1 ABC Analysis: Inventory Reduction
4%
17%
54%
25%
0%
10%
20%
30%
40%
50%
60%
ABC Analysis: Inventory Reduction
To no extent
To a small extent
To a moderateextentTo a large extent
Figure 4.3.2 below shows the response to the question whether or not the ABC analysis
assisted them to improve inventory control. 52% indicated “to a moderate extent” and
40% “to a large extent”, 4% responded to no extent, this being the same 4% who
responded that ABC analyses does not contribute to a reduction in their inventory levels
42

Figure 4.3.2: ABC Analysis: Improvement of Inventory Control
4% 4%
52%
40%
0%
10%
20%
30%
40%
50%
60%
ABC Analysis: Improvement of Inventory Control
To no extent
To a small extent
To a moderateextentTo a large extent
Qualification versus Knowledge of Technique
A total of 61.2% of the respondents (school and post-school diplomas, and university or
technikon degrees) were familiar with ABC analysis. Respondents with post-school
diplomas were the most familiar with the technique 53.3%, as indicated in Table 4.3.1
below.
Table 4.3.1: Qualification versus Knowledge of Technique
ABC analysis
School Post-school diploma or equivalent
University or technikon degree and Post-graduate
Row Total
YES % of row total
% of column total
23.3% 50%
53.3% 66.7%
23.3% 63.6%
61.2%
NO % of row total
% of column total
36.8% 50%
42.1% 33.3%
21.1% 36.4%
38.8%
Column Total 28.6% 49% 22.4% 100%
43

Usage versus Inventory Reduction
The responses to the question whether ABC analysis reduced inventory were cross
tabulated as follows: The responses “sometimes” and “often” were grouped together,
and “always” separately (Table 4.3.2 below). A total of 72.4% of the respondents who
used the technique indicated a “moderate to large extent” reduction. Most respondents
used the technique only “sometimes to often” 65.5%. Only 34.5% indicated that they
used the technique “always” and 90% of this 34.5% indicated a “moderate to large
extent” reduction.
Table 4.3.2: Usage versus Inventory Reduction
ABC analysis Inventory
Reduction
Sometimes to often
Always Row Total
No extent to
small extent
% of row total
% of column total
87.5% 36.8%
12.5% 10%
27.6%
Moderate to
large extent
% of row total
% of column total
57.1% 63.2%
42.9% 90%
72.4%
Column Total 65.5% 34.5% 100%
Usage versus Improved Inventory Control
Table 4.3.3 below illustrates responses to the question whether ABC analysis improved
inventory control. 86.7% of the respondents indicated that the technique resulted in a
“moderate to large extent” improvement of inventory control. Most of the respondents
used the technique only “sometimes to often” 65%. A total of 34.5% of the respondents
indicated that they used the technique “always” and all of them 100% indicated that it
resulted in a “moderate to large extent” improvement in inventory control.
44

Table 4.3.3: Usage versus Improved Inventory Control
ABC analysis Improved
inventory
control
Sometimes to often
Always Row Total
No extent to
small extent
% of row total
% of column total
100% 20%
0% 0%
13.3%
Moderate to
large extent
% of row total
% of column total
61.5% 80%
38.5% 100%
86.7%
Column Total 65.5% 34.5% 100%
4.3.2 Technique 2: Assembly Line Balancing Familiarity with technique
76% of the respondents were familiar with assembly line balancing. 89% of the
respondents that were familiar with this technique applied it in their organisations. A
further 39.5% of the respondents who applied the technique, used it “always”.
Reduction of idle time It was further found that of the above 89% the technique assembly line balancing
contributes positively “to a large extent” to a reduction in idle time 39%. 45% of the
respondents reported that assembly line balancing (ALB) contributed to a “moderate
extent” to are reduction in idle time as illustrated in Figures 4.3.3 below.
45

Figure 4.3.3: Assembly Line Balancing: Idle Time Reduction
3%
12%
45%39%
0%
10%
20%
30%
40%
50%
Assembly Line Balancing: Idle Time Reduction
To no extent
To a small extent
To a moderateextentTo a large extent
Productivity Improvement Figure 4.3.4 below illustrates that productivity did improve “to a large extent”, 51%
indicated that their productivity did improve ranging from “a small to moderate extent” .
Figure 4.3.4: Assembly Line Balancing: Improved Productivity
0%
18%
33%
48%
0%5%
10%15%20%25%30%35%40%45%50%
Assembly Line Balancing: Improved Productivity
To no extent
To a small extent
To a moderateextentTo a large extent
46
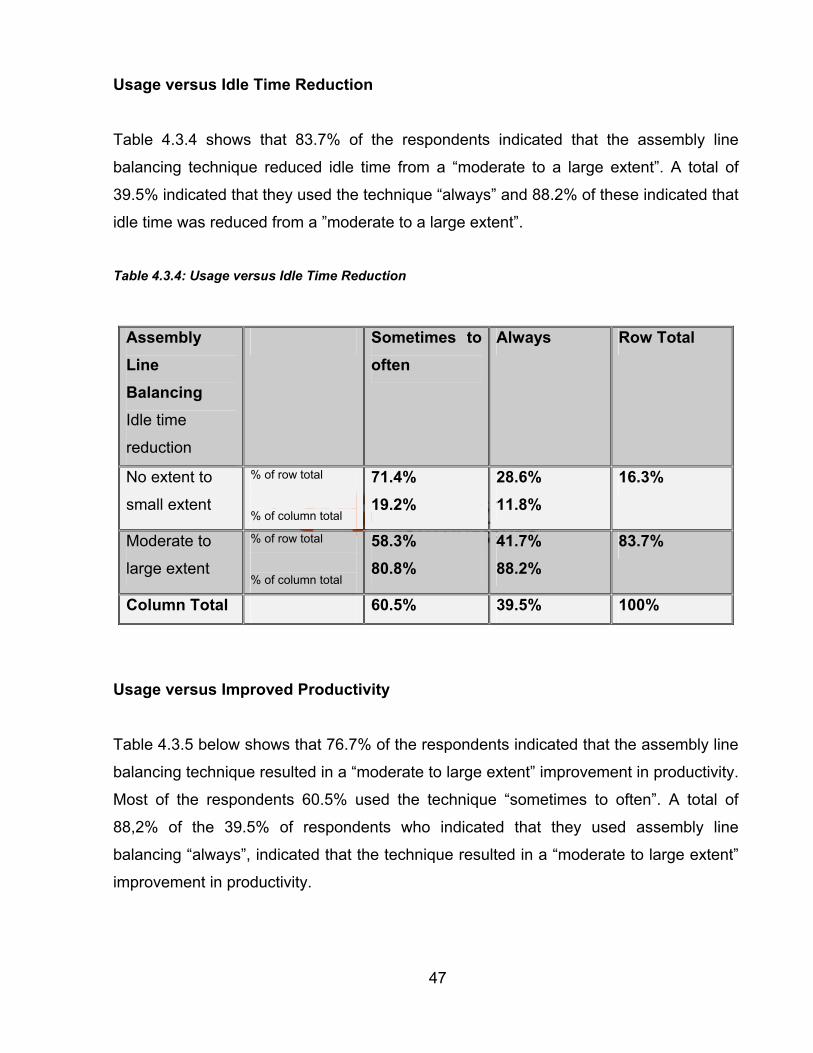
Usage versus Idle Time Reduction
Table 4.3.4 shows that 83.7% of the respondents indicated that the assembly line
balancing technique reduced idle time from a “moderate to a large extent”. A total of
39.5% indicated that they used the technique “always” and 88.2% of these indicated that
idle time was reduced from a ”moderate to a large extent”.
Table 4.3.4: Usage versus Idle Time Reduction
Assembly Line Balancing Idle time
reduction
Sometimes to often
Always Row Total
No extent to
small extent
% of row total
% of column total
71.4% 19.2%
28.6% 11.8%
16.3%
Moderate to
large extent
% of row total
% of column total
58.3% 80.8%
41.7% 88.2%
83.7%
Column Total 60.5% 39.5% 100%
Usage versus Improved Productivity
Table 4.3.5 below shows that 76.7% of the respondents indicated that the assembly line
balancing technique resulted in a “moderate to large extent” improvement in productivity.
Most of the respondents 60.5% used the technique “sometimes to often”. A total of
88,2% of the 39.5% of respondents who indicated that they used assembly line
balancing “always”, indicated that the technique resulted in a “moderate to large extent”
improvement in productivity.
47

Table 4.3.5: Usage versus Improved Productivity
Assembly Line Balancing
Improved
Productivity
Sometimes to often
Always Row Total
No extent to
small extent
% of row total
% of column total
80% 30.8%
20% 11.8%
23.3%
Moderate to
large extent
% of row total
% of column total
54.5% 69.2%
45.2% 88.2%
76.7%
Column Total 60.5% 39.5% 100%
4.3.3 Technique 3: Cell manufacturing Familiarity with technique
70% of the respondents indicated that they were familiar with cell manufacturing as a
lean manufacturing technique. 46.7% of the respondents indicated that they “always”
use the technique.
Reduction in inventory levels
As for the question whether cell manufacturing reduced inventories, most respondents
34% replied “to a moderate extent” as shown in Figure 4.3.5 below. 31% of the
respondents reported that they use the technique to “a large extent”.
48

Figure 4.3.5: Cell Manufacturing: Inventory Reduction
9%
25%
34%31%
0%
5%
10%
15%
20%
25%
30%
35%
Cell Manufacturing: Inventory Reduction
To no extent
To a small extent
To a moderateextentTo a large extent
Productivity Improvement Figure 4.3.6 illustrate the responses received for the question whether cell
manufacturing improved productivity, 97% responded indicated that it does improve
productivity of the 97% 10% reported to “a small extent” and 50% “to a large extent”.
Figure 4.3.6: Cell Manufacturing: Improved Productivity
3%
10%
37%
50%
0%
10%
20%
30%
40%
50%
Cell Manufacturing: Improved Productivity
To no extent
To a small extent
To a moderateextentTo a large extent
49

Size of Manufacturer versus Knowledge of Technique
A two-tailed Fisher’s exact probability test (p= 0.011) showed that the number of
participants from companies with less than 200 employees (55.9%. n=21) that were
familiar with the cell manufacturing technique was significantly greater than that of
companies with more than 200 employees (44.1%. n=28). This relationship between
familiarity with the technique and company size was moderate (r= 0.396). As illustrated
in Table 4.3.6, manufacturers with less than 200 employees were more conversant with
the technique than larger manufacturers with more than 200 employees.
Table 4.3.6: Size of Manufacturer versus Knowledge of Technique
Cell Manufacturing
Familiarity
Less than 200 employees
At least 200 employees
Row Total
YES % of row total
% of column total
55.9% 90.5%
44.1% 53.6%
69.4%
NO % of row total
% of column total
13.3% 9.5%
86.7% 46.4%
30.6%
Column Total 42.9% 57.1% 100%
Qualification versus Knowledge of the Technique
A full sample was used. This means that both assembly and non-assembly
manufacturing were used. As indicated in Table 4.3.7 below the Chi-square test showed
that the number of participants with a post-school qualification (53.1% post-school or
equivalent, n= 26 and 30.6% university or technikon degree, n= 15) that were familiar
with the cell manufacturing technique was significantly greater than the number of
participants with only a school qualification (16.3%, n= 8), [χ² (2, N= 73) = 17.204,
p < 0.001]. This relationship between familiarity with the technique and level of 50

qualification was moderate (Cramer’s V= 0.485). Employees with degrees and post-
graduates all responded positively 100% that they were familiar with the technique
whereas only 72.2% of the respondents with post-school diplomas indicated that they
were familiar with the cell manufacturing technique.
Table 4.3.7: Qualification versus Knowledge of Technique
Cell Manufacturing
School Post-school diploma or equivalent
University or technikon degree and Post-graduate
Row Total
YES % of row total
% of column total
16.3% 36.4%
53.1% 72.2%
30.6% 100%
61.2%
NO % of row total
% of column total
58.3% 63.6%
41.7% 27.8%
0% 0%
38.8%
Column Total 30.1% 49.3% 20.5% 100%
Usage versus Inventory Reduction
The responses to the question whether cell manufacturing reduced inventory are
illustrated in Table 4.3.8 below. A total of 64.4% of the respondents indicated that the
cell manufacturing technique resulted in a “moderate to large extent” inventory reduction
and most of these respondents 76.2% used the technique “always”. The “sometimes to
often” users was the biggest group, namely 53.3%.
51
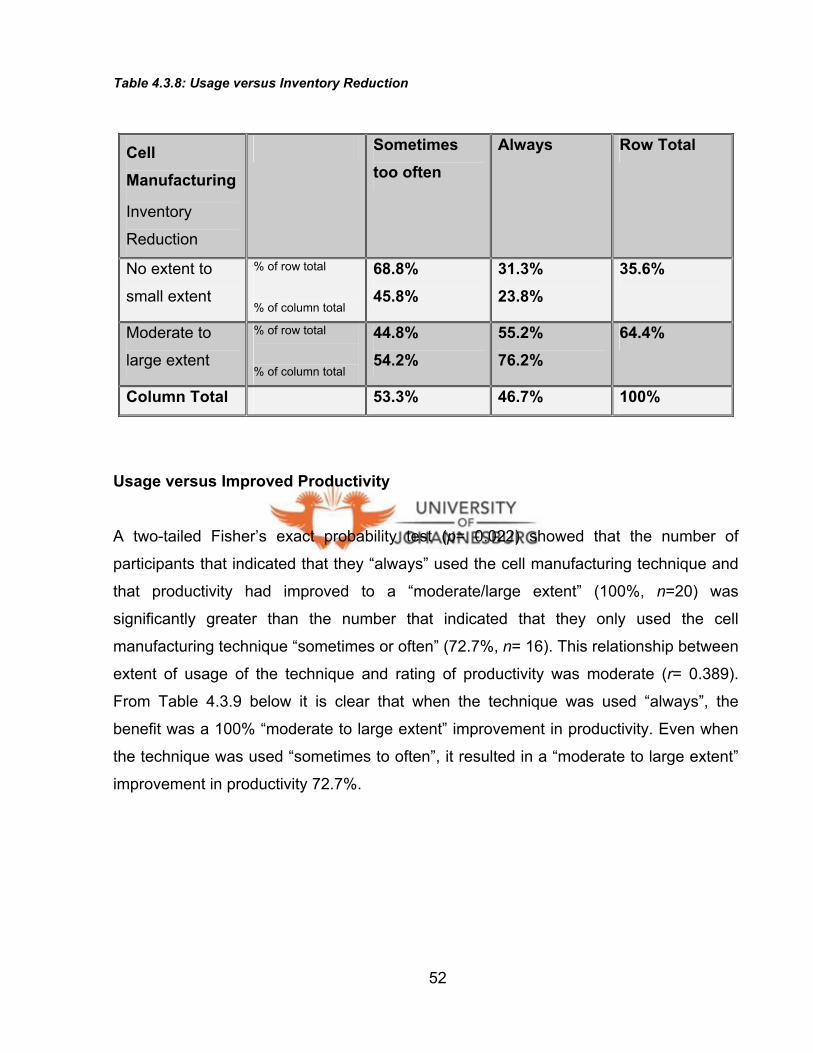
Table 4.3.8: Usage versus Inventory Reduction
Cell Manufacturing
Inventory
Reduction
Sometimes too often
Always Row Total
No extent to
small extent
% of row total
% of column total
68.8% 45.8%
31.3% 23.8%
35.6%
Moderate to
large extent
% of row total
% of column total
44.8% 54.2%
55.2% 76.2%
64.4%
Column Total 53.3% 46.7% 100%
Usage versus Improved Productivity
A two-tailed Fisher’s exact probability test (p= 0.022) showed that the number of
participants that indicated that they “always” used the cell manufacturing technique and
that productivity had improved to a “moderate/large extent” (100%, n=20) was
significantly greater than the number that indicated that they only used the cell
manufacturing technique “sometimes or often” (72.7%, n= 16). This relationship between
extent of usage of the technique and rating of productivity was moderate (r= 0.389).
From Table 4.3.9 below it is clear that when the technique was used “always”, the
benefit was a 100% “moderate to large extent” improvement in productivity. Even when
the technique was used “sometimes to often”, it resulted in a “moderate to large extent”
improvement in productivity 72.7%.
52

Table 4.3.9: Usage versus Improved Productivity
Cell Manufacturing
Improved
productivity
Sometimes to often
Always Row Total
No extent to
small extent
% of row total
% of column total
100% 27.3%
0% 0%
14.3%
Moderate to
large extent
% of row total
% of column total
44.4% 72.7%
55.6% 100%
85.7%
Column Total 52.4% 47.6% 100%
4.3.4 Technique 4: Cycle Time
Familiarity with technique
78% of the respondents indicated that they were familiar with cycle time as a lean
manufacturing technique.
Reduction in inventory levels
As for the question whether cycle time leads to reduced inventory levels, most
respondents 92% replied positively as shown in Figure 4.3.7 below. 53% of the
respondents reported that it reduces their inventory to “a large extent”. 18% and 21%
respectively reported to a “small and moderate extent”.
53
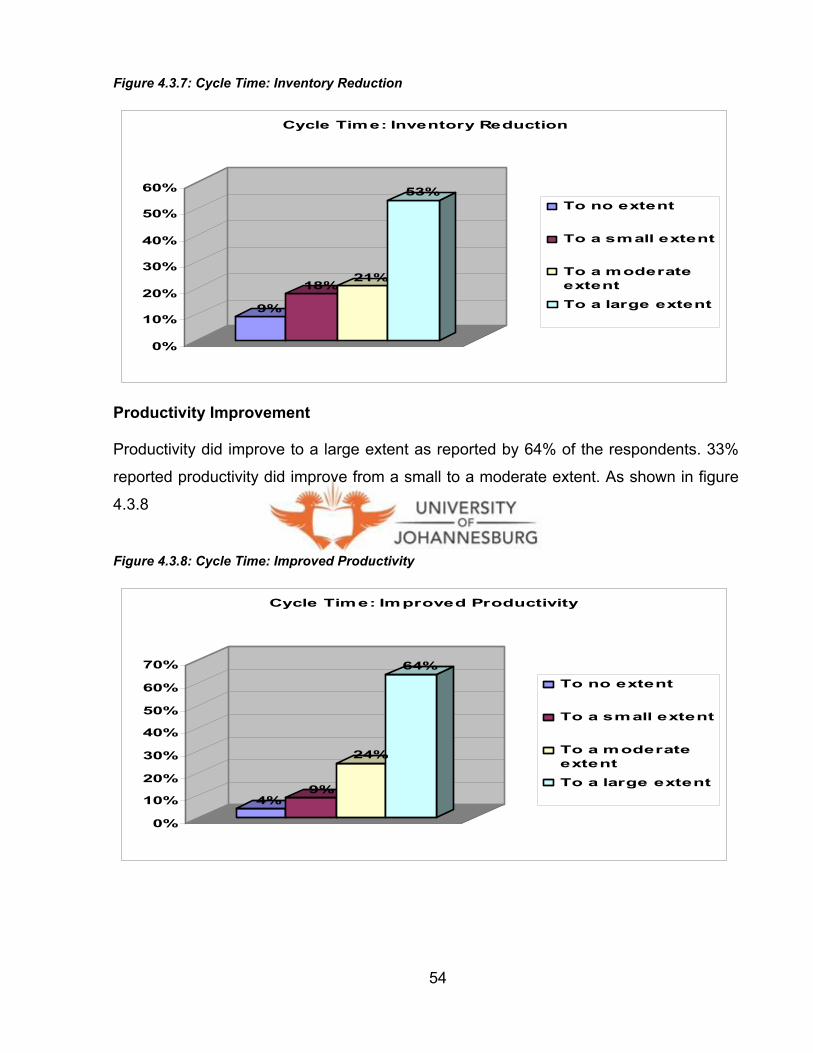
Figure 4.3.7: Cycle Time: Inventory Reduction
9%
18%21%
53%
0%
10%
20%
30%
40%
50%
60%
Cycle Time: Inventory Reduction
To no extent
To a small extent
To a moderateextentTo a large extent
Productivity Improvement
Productivity did improve to a large extent as reported by 64% of the respondents. 33%
reported productivity did improve from a small to a moderate extent. As shown in figure
4.3.8
Figure 4.3.8: Cycle Time: Improved Productivity
4%9%
24%
64%
0%
10%
20%
30%
40%
50%
60%
70%
Cycle Time: Improved Productivity
To no extent
To a small extent
To a moderateextentTo a large extent
54

Usage versus Inventory Reduction
Cycle time as a lean manufacturing technique and its relation to reduced inventory was
as follows: The Chi-square test using Yates’ correction showed that the number of
respondents who indicated that they “always” used the cycle time technique and that it
resulted in reduced inventory from a “moderate to a large extent” (87%. n= 20) was
significantly greater than the number that indicated that they used the cycle time
technique “sometimes to often” (41.7%, n= 10), [χ² (1,N= 47) = 8.565, p= 0.003]. The
relationship between extent of usage of the technique and the rating of inventory
reduction was moderate (r= 0.471). The results indicated that inventory was reduced
more specifically when the technique was used “always”. 87% of the “always” users
indicated the technique resulted in a “moderate to large extent” reduction as illustrated in
Table 4.3.10 below). The reverse happened when the technique was used “sometimes
to often” - the effect was a “no extent to small extent” reduction in inventory. The most
respondents 51.1% again indicated that they used the technique “sometimes to often” in
comparison to the 48.9% who used it “always”.
Table 4.3.10: Usage versus Inventory Reduction
Cycle Time Inventory
Reduction
Sometimes to often
Always Row Total
No extent to
small extent
% of row total
% of column total
82.4% 58.3%
17.6% 13%
36.2%
Moderate to
large extent
% of row total
% of column total
33.3% 41.7%
66.7% 87%
63.8%
Column Total 51.1% 48.9% 100%
55
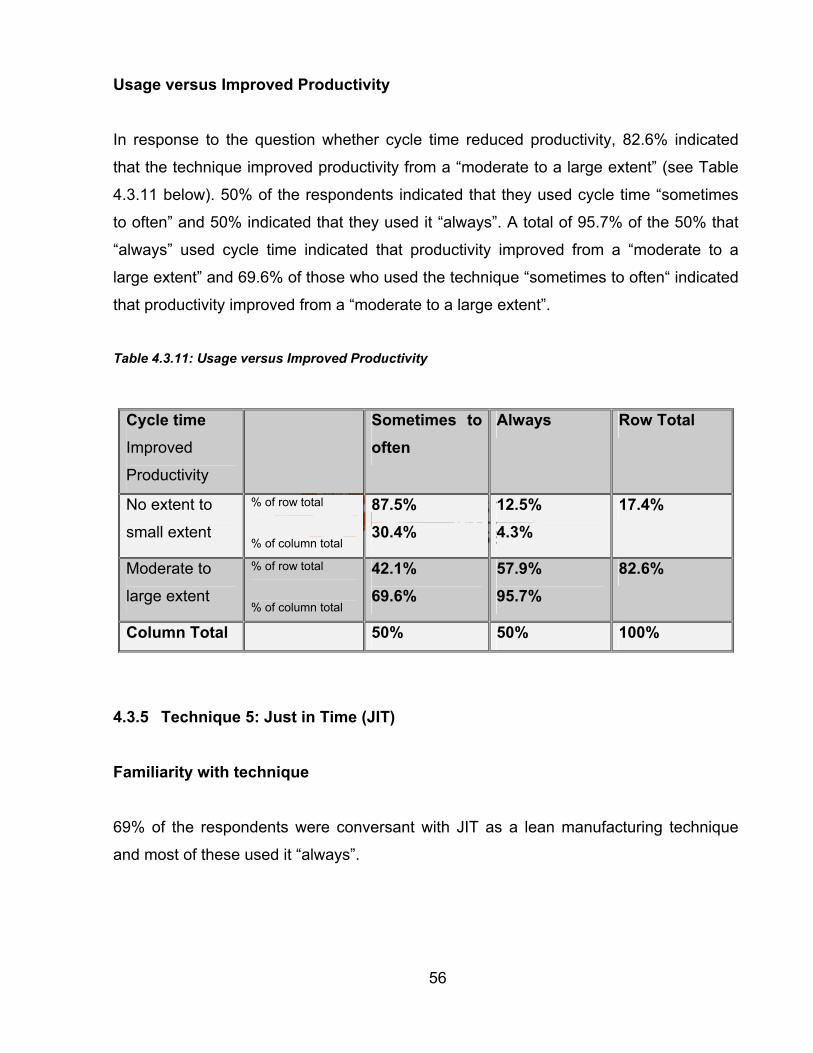
Usage versus Improved Productivity
In response to the question whether cycle time reduced productivity, 82.6% indicated
that the technique improved productivity from a “moderate to a large extent” (see Table
4.3.11 below). 50% of the respondents indicated that they used cycle time “sometimes
to often” and 50% indicated that they used it “always”. A total of 95.7% of the 50% that
“always” used cycle time indicated that productivity improved from a “moderate to a
large extent” and 69.6% of those who used the technique “sometimes to often“ indicated
that productivity improved from a “moderate to a large extent”.
Table 4.3.11: Usage versus Improved Productivity
Cycle time Improved
Productivity
Sometimes to often
Always Row Total
No extent to
small extent
% of row total
% of column total
87.5% 30.4%
12.5% 4.3%
17.4%
Moderate to
large extent
% of row total
% of column total
42.1% 69.6%
57.9% 95.7%
82.6%
Column Total 50% 50% 100%
4.3.5 Technique 5: Just in Time (JIT)
Familiarity with technique
69% of the respondents were conversant with JIT as a lean manufacturing technique
and most of these used it “always”.
56

Reduction in Inventory levels With regard to the question whether JIT reduced inventory, the responses were almost
evenly spread - from “to a moderate extent” 45% to “to a large extent” 32%, as illustrated
in Figure 4.3.9 below.
Figure 4.3.9: JIT: Inventory Reduction
3%
19%
45%
32%
0%
10%
20%
30%
40%
50%
JIT: Inventory Reduction
To no extent
To a small extent
To a moderateextentTo a large extent
Productivity Improvement As shown in figure 4.3.10 below JIT does contribute to improvement of productivity as
reported by 93% of the respondents.
Figure 4.3.10: JIT: Improved Productivity
57
7%
23%
30%
40%
0%
5%
10%15%
20%
25%
30%
35%
40%
JIT: Improved Productivity
To no extent
To a small extent
To a moderateextentTo a large extent
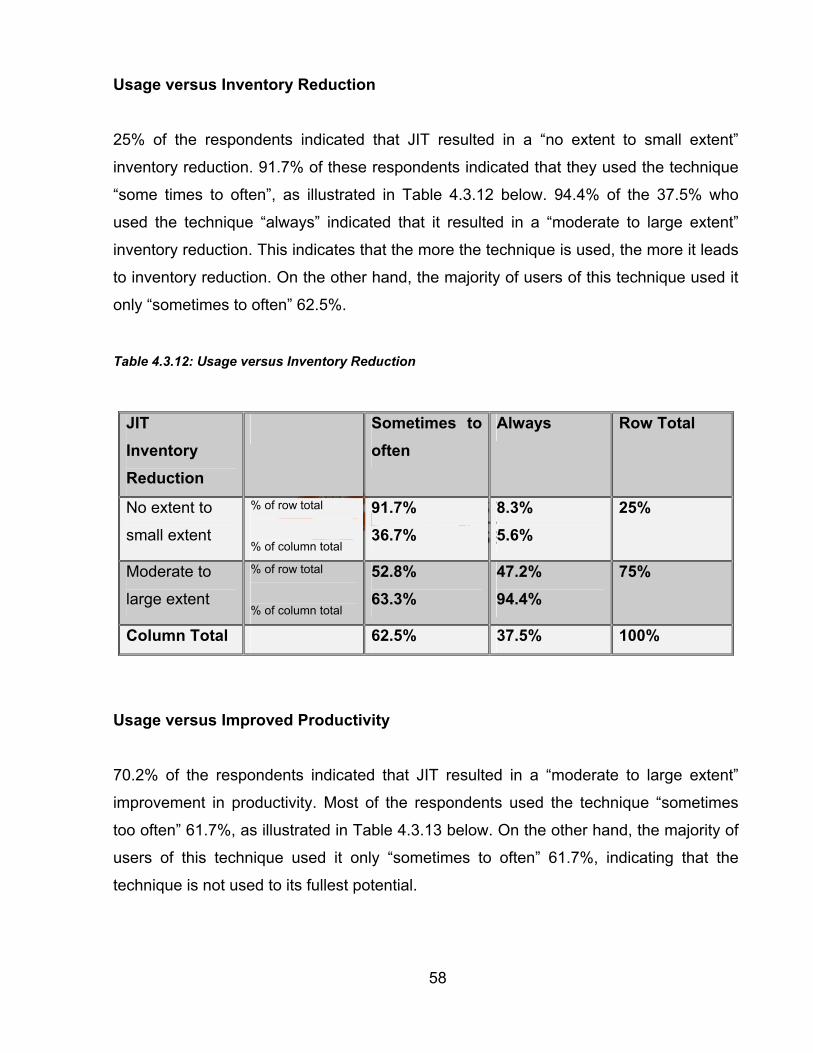
Usage versus Inventory Reduction
25% of the respondents indicated that JIT resulted in a “no extent to small extent”
inventory reduction. 91.7% of these respondents indicated that they used the technique
“some times to often”, as illustrated in Table 4.3.12 below. 94.4% of the 37.5% who
used the technique “always” indicated that it resulted in a “moderate to large extent”
inventory reduction. This indicates that the more the technique is used, the more it leads
to inventory reduction. On the other hand, the majority of users of this technique used it
only “sometimes to often” 62.5%.
Table 4.3.12: Usage versus Inventory Reduction
JIT Inventory Reduction
Sometimes to often
Always Row Total
No extent to
small extent
% of row total
% of column total
91.7% 36.7%
8.3% 5.6%
25%
Moderate to
large extent
% of row total
% of column total
52.8% 63.3%
47.2% 94.4%
75%
Column Total 62.5% 37.5% 100%
Usage versus Improved Productivity
70.2% of the respondents indicated that JIT resulted in a “moderate to large extent”
improvement in productivity. Most of the respondents used the technique “sometimes
too often” 61.7%, as illustrated in Table 4.3.13 below. On the other hand, the majority of
users of this technique used it only “sometimes to often” 61.7%, indicating that the
technique is not used to its fullest potential.
58

Table 4.3.13: Usage versus Improved Productivity
JIT
Improved
Productivity
Sometimes to often
Always Row Total
No extent to
small extent
% of row total
% of column total
78.6% 37.9%
21.4% 16.7%
29.8%
Moderate to
large extent
% of row total
% of column total
54.5% 62.1%%
45.5% 83.3%
70.2%
Column Total 61.7% 38.3% 100%
4.3.6 Technique 6: SMED or Quick Changeover
Familiarity with technique
Only 49% of the respondents indicated that they were familiar with the technique SMED.
Reduction in Inventory Levels In response to the question whether the technique reduced inventory, 7% stated “to no
extent”, 47% stated “to a moderate extent” and 33% stated “to a large extent” (illustrated
in Figure 4.3.11 below).
59

Figure 4.3.11: SMED: Inventory Reduction
7%
13%
47%
33%
0%5%
10%15%20%25%30%35%40%45%50%
SMED (Quick Changeover): Inventory Reduction
To no extent
To a small extent
To a moderateextentTo a large extent
Operating Cost Reduction
Of the respondents 96% indicated that SMED leads to a reduction in operating cost of
which 40% of the respondents who applies the quick changeover technique indicated
that it reduced operating cost “to a moderate extent”. 27% reported that SMED reduces
operating cost to “a large extent” as illustrated in Figure 4.3.12 below.
Figure 4.3.12: SMED: Operating Cost Reduction
7%
27%
40%
27%
0%5%
10%15%20%25%30%35%40%
SMED (Quick Changeover): Operating Cost Reduction
To no extent
To a small extent
To a moderateextentTo a large extent
60
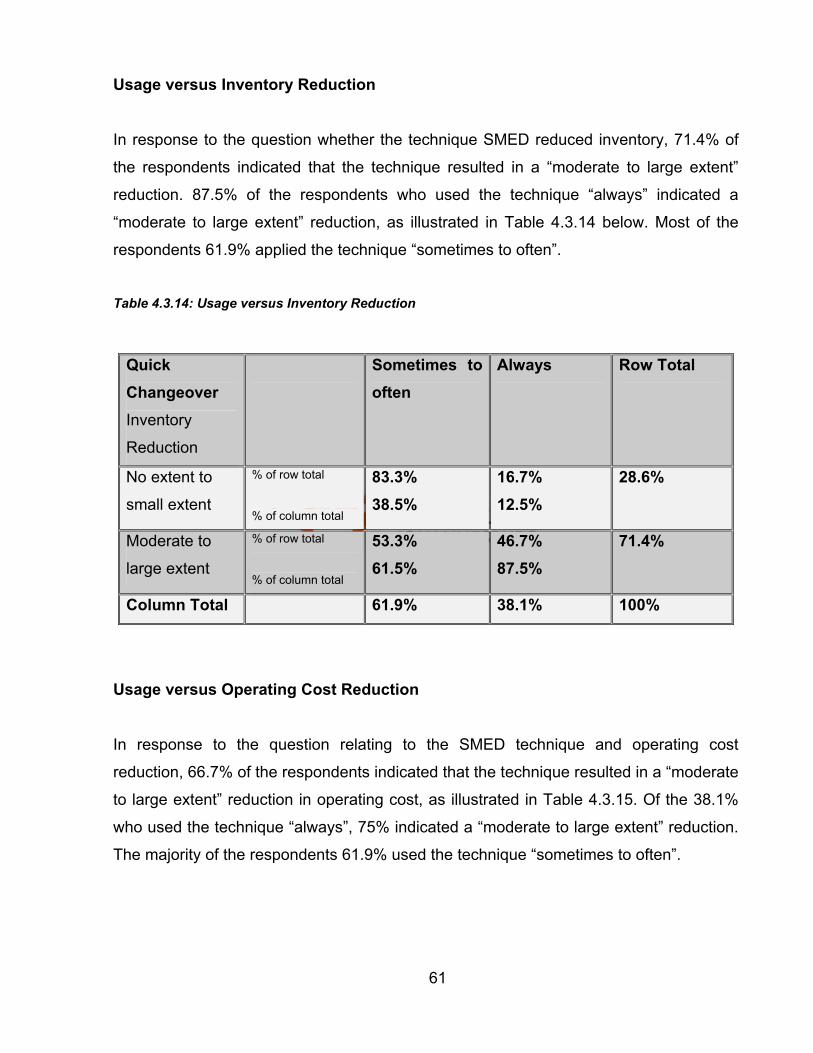
Usage versus Inventory Reduction
In response to the question whether the technique SMED reduced inventory, 71.4% of
the respondents indicated that the technique resulted in a “moderate to large extent”
reduction. 87.5% of the respondents who used the technique “always” indicated a
“moderate to large extent” reduction, as illustrated in Table 4.3.14 below. Most of the
respondents 61.9% applied the technique “sometimes to often”.
Table 4.3.14: Usage versus Inventory Reduction
Quick Changeover Inventory
Reduction
Sometimes to often
Always Row Total
No extent to
small extent
% of row total
% of column total
83.3% 38.5%
16.7% 12.5%
28.6%
Moderate to
large extent
% of row total
% of column total
53.3% 61.5%
46.7% 87.5%
71.4%
Column Total 61.9% 38.1% 100%
Usage versus Operating Cost Reduction
In response to the question relating to the SMED technique and operating cost
reduction, 66.7% of the respondents indicated that the technique resulted in a “moderate
to large extent” reduction in operating cost, as illustrated in Table 4.3.15. Of the 38.1%
who used the technique “always”, 75% indicated a “moderate to large extent” reduction.
The majority of the respondents 61.9% used the technique “sometimes to often”.
61

Table 4.3.15: Usage versus Operating Cost Reduction
Quick Changeover Operating cost
Reduction
Sometimes to often
Always Row Total
No extent to
small extent
% of row total
% of column total
71.4% 38.5%
28.6% 25
33.3%
Moderate to
large extent
% of row total
% of column total
57.1% 61.5%
42.9% 75%
66.7%
Column Total 61.9% 38.1% 100%
4.3.7 Technique 7: Total Preventative Maintenance (TPM)
Familiarity with technique
90% of the respondents indicated that they familiar with the TPM technique. Of the 90%
the technique was “always” used by 50.9%.
Reduction in Inventory Levels
Figure 4.3.13 shows that 94% positively indicate that TPM does lead to a reduction in
inventory levels. Of the 94%, 37% respectively reported a reduction in inventory from a
“moderate to a large extent” 20% reflected a reduction of inventory to a “small extent”.
Only 7% reported no effect.
62
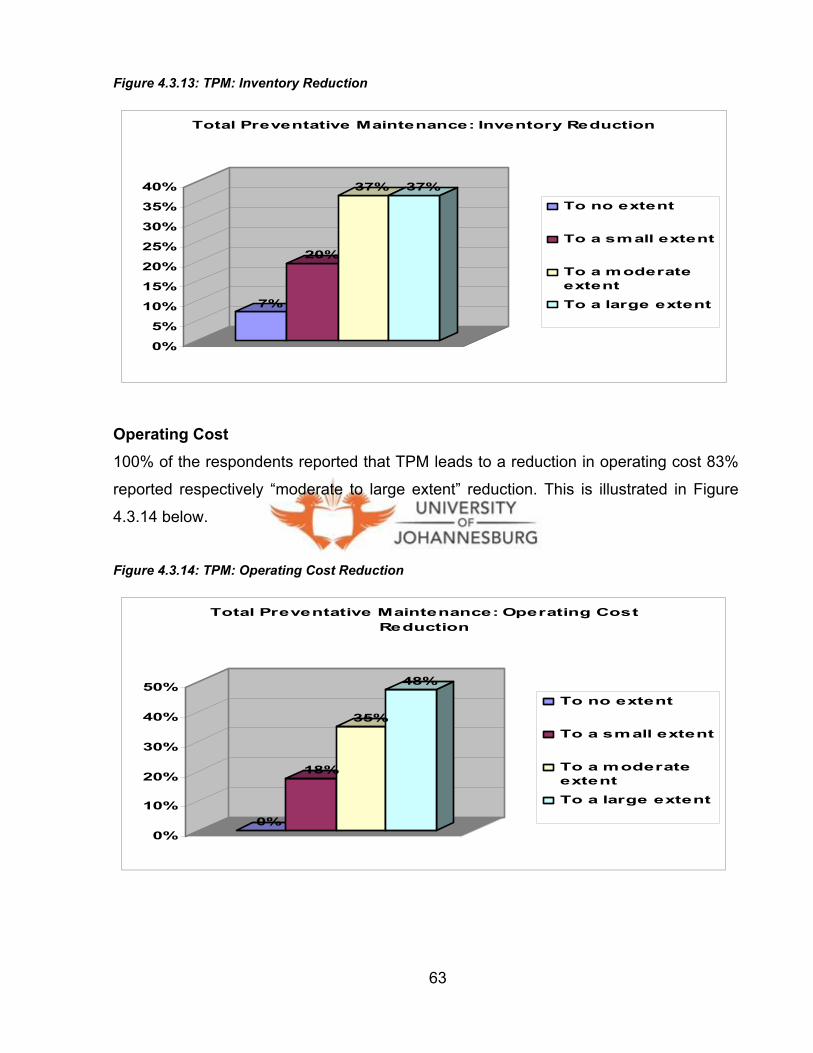
Figure 4.3.13: TPM: Inventory Reduction
7%
20%
37% 37%
0%
5%
10%
15%
20%
25%
30%
35%
40%
Total Preventative Maintenance: Inventory Reduction
To no extent
To a small extent
To a moderateextentTo a large extent
Operating Cost 100% of the respondents reported that TPM leads to a reduction in operating cost 83%
reported respectively “moderate to large extent” reduction. This is illustrated in Figure
4.3.14 below.
Figure 4.3.14: TPM: Operating Cost Reduction
0%
18%
35%
48%
0%
10%
20%
30%
40%
50%
Total Preventative Maintenance: Operating Cost Reduction
To no extent
To a small extent
To a moderateextentTo a large extent
63

Usage versus Inventory Reduction
Most of the respondents indicated that the TPM technique resulted in a “moderate to
large extent” reduction in inventory 61.4%, as illustrated in Table 4.3.16 below. Where
the technique was used “sometimes to often”, the majority indicated a “moderate to large
extent” reduction 57.1%. The usage of the technique was almost equally divided
between “sometimes to often” 49.1% and “always” 50.9%.
Table 4.3.16: Usage versus Inventory Reduction
TPM
Inventory
Reduction
Sometimes to often
Always Row Total
No extent to
small extent
% of row total
% of column total
54.5% 42.9%
45.5% 34.5%
38.6%
Moderate to
large extent
% of row total
% of column total
45.7% 57.1%
54.3% 65.5%
61.4%
Column Total 49.1% 50.9% 100%
Usage versus Operating Cost Reduction
The more the JIT technique was utilized, the greater the reduction in operating cost
96.6% of the respondents who used the technique “always” indicated a “moderate to
large extent” reduction, as illustrated in Table 4.3.17 below. Where the technique was
used “sometimes to often”, the result was a 90% “no extent to small extent” reduction.
Almost the same number of respondents used the technique “sometimes” 49.1% and
“always” 50.9%.
64
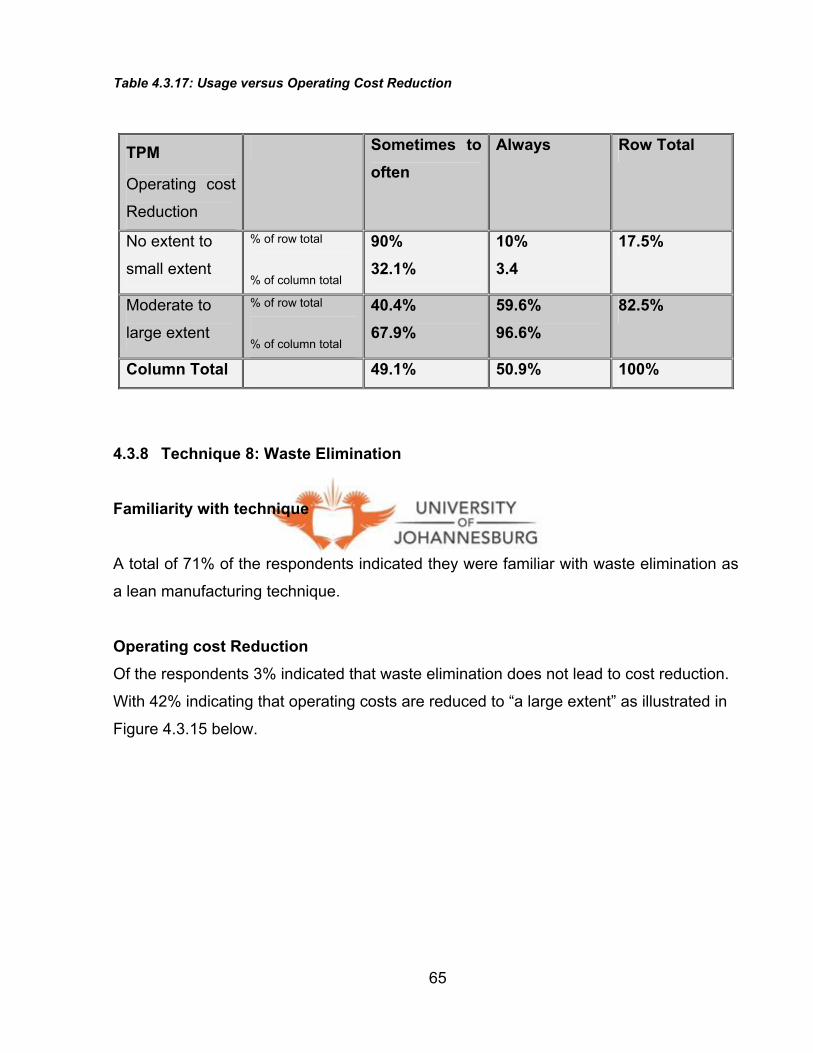
Table 4.3.17: Usage versus Operating Cost Reduction
TPM
Operating cost
Reduction
Sometimes to often
Always Row Total
No extent to
small extent
% of row total
% of column total
90% 32.1%
10% 3.4
17.5%
Moderate to
large extent
% of row total
% of column total
40.4% 67.9%
59.6% 96.6%
82.5%
Column Total 49.1% 50.9% 100%
4.3.8 Technique 8: Waste Elimination
Familiarity with technique
A total of 71% of the respondents indicated they were familiar with waste elimination as
a lean manufacturing technique.
Operating cost Reduction Of the respondents 3% indicated that waste elimination does not lead to cost reduction.
With 42% indicating that operating costs are reduced to “a large extent” as illustrated in
Figure 4.3.15 below.
65

Figure 4.3.15: Waste Elimination: Operating Cost Reduction
3%
21%
33%
42%
0%5%
10%15%20%25%30%35%40%45%
Waste Elimination: Operating Cost Reduction
To no extent
To a small extent
To a moderateextentTo a large extent
Improved Productivity When asked whether the technique added value by improving productivity, 100% replied
positively, with 42% indicating “to a large extent” and 35% indicating that productivity did
improve “to a moderate extent”, as illustrated in Figure 4.3.16 below.
Figure 4.3.16: Waste Elimination: Improved Productivity
0%
23%
35%
42%
0%5%
10%15%20%25%30%35%40%45%
Waste Elimination: Improved Productivity
To no extent
To a small extent
To a moderateextentTo a large extent
66

Usage versus Operating Cost Reduction
A two-tailed Fisher’s exact probability test (p= 0.32) showed that the number of
participants that indicated that they “always” used the waste elimination technique and
that operating cost had been reduced to a “moderate/ large extent” (94.4%. n= 17) was
significantly greater than the number that indicated that they only used the waste
elimination technique “sometimes or often” (64.3%, n= 18). This suggests that the
relationship between extent of usage of the technique and rating of operating cost
reduction was moderate (r= 0.345). As illustrated in Table 4.3.18, 94.4% of the 39.1% of
the respondents who used the technique “always” indicated that the technique resulted
in a “moderate to large extent” reduction in operating cost. The majority of respondents
60.9% indicated that they used the technique “sometimes to often”. 35.7% of this 60.9%
indicated that operating cost was reduced from “no extent to a small extent”. The most
respondents 76.1% indicated a “moderate to large extent” reduction.
Table 4.3.18: Usage versus Operating Cost Reduction
Waste Elimination Operating cost
Reduction
Sometimes to often
Always Row Total
No extent to
small extent
% of row total
% of column total
90.9% 35.7%
9.1% 5.6%
23.9%
Moderate to
large extent
% of row total
% of column total
51.4% 64.3%
48.6% 94.4%
76.1%
Column Total 60.9% 39.1% 100%
67

Usage versus Improved Productivity
A Shi-square test using Yates’ correction showed that the number of participants that
indicated that they “always” used the waste elimination technique and that utilising this
technique reduced operating cost to a “moderate/large extent” (83.3%, n= 15) was
significantly greater than the number that indicated that they only used the waste
elimination technique “sometimes to often” (50%, n= 14), [χ² (1, N= 46) =3.8.92, p= 0.49].
This suggests a “moderate” relationship between extent of usage of the technique and
the rating of Improved productivity (r= 0.337). Most respondents used the technique
“sometimes to often” 60.9%. 50% of the 60.9% of the respondents who use the
technique “sometimes to often” indicated that there was a “no extent to small extent”
improvement in productivity and the other 50% indicated a “moderate to large extent”
improvement. 83.3% of the 39.1% of respondents who indicated that they used the
technique “always” indicated that there was a “moderate to large extent” improvement in
productivity.
Table 4.3.19: Usage versus Improved Productivity
Waste Elimination Improved
Productivity
Sometimes to often
Always Row Total
No extent to
small extent
% of row total
% of column total
82.4% 50%
17.6% 16.7
37%
Moderate to
large extent
% of row total
% of column total
48.3% 50%%
51.7% 83.3%
63%
Column Total 60.9% 39.1% 100%
68

4.3.9 More Techniques
The rest of the techniques were listed on the questionnaire and respondents simply had
to answer “Yes” or “No” as to whether these techniques were utilised by the various
manufacturers or not. Most of the respondents indicated they did not use “Product-
quantity (P-Q) analysis” “Poka Yoke” and “value-stream mapping” as illustrated in Table
4.3.20 below. The following techniques attracted a positive response with a 70% or
higher utilisation: continuous flow, tact time and total quality management.
Table 4.3.20: Utilisation of More Techniques
Technique Yes No Continuous Flow 78% 22%Takt Time 72% 28%Total Quality Management 71% 29%One-Piece Flow 59% 41%Poka Yoke 53% 47%Value-Stream Mapping 53% 47%Product-Quantity (p-q) analysis 42% 58%
Statistical Analysis
69
The Chi-square test was used to determine various relationships and dependencies. No
significant dependencies and relationships where found other than results on the
utilization of the P-Q analysis technique. The Chi-squire test indicated that the number
of respondents with a post-school or equivalent diploma (77.8%, n=23) who were
familiar with the P-Q analysis technique was significantly greater than the number of
respondents with either a school qualification (16.7%, n= 14) or a university or technikon
degree (5.6%, n= 11), [χ² (2, N= 48) = 10.690, p= 0.005]. This suggests a “moderate”
relationship between familiarity with the technique and level of qualification (Cramer’s V
= 0.472). Most respondents (62.5%) indicated that they did not use the technique. Of the
37.5% respondents who used the technique, 77.8% had post-school or equivalent
qualifications, as illustrated in Table 4.3.21 below. Of the 62.5% who indicated that they
did not use the technique, 90.9% had university, technikon or post-graduate degrees
and 78.6% had school qualifications.

Table 4.3.21: Usage versus Qualification
P-Q analysis School Post-school diploma or equivalent qualification
University or technikon degree and Post-graduate
Row Total
YES % of row total
% of column total
16.7% 21.4%
77.8% 60.9%
5.6% 9.1%
37.5%
NO % of row total
% of column total
36.7% 78.6%
30% 39.1%
33.3% 90.9%
62.5%
Column Total 29.2% 47.9% 22.9% 100%
4.4 FAMILIARITY WITH THE TECHNIQUES VERSUS UTILISATION
Table 4.4.1: Familiarity with the Techniques versus used always
Technique familiar Always yes % No % % Total Preventative Maintenance 90 10 50.9 Cycle Time 78 22 48.9 Assembly Line Balancing 76 24 39.5 Cell Manufacturing 69 31 46.7 JIT 69 31 37 Waste Elimination 69 31 39.1 ABC analysis 62 38 34.5 SMED (quick changeover) 51 48 38.1
Most respondents (90%) were informed about total preventative maintenance (TPM), as
illustrated in Table 4.4.1. The table further shows that this technique came first with a
usage of 50.9% in the “always” category. Cycle time came second with 48.9% of the
respondents indicating that they use it “always”. Respondents indicated that they were
less informed about single minute exchange of dies (SMED) and ABC analysis (35%)
was the technique utilised the least.
70

CHAPTER 5
DISCUSSIONS AND CONCLUSIONS
This chapter contains a discussion of the findings and results of the survey with regard
to lean manufacturing techniques and techniques preferred by manufacturers. The
limitations are highlighted and discussed, together with further possible topics for
research.
5.1 TECHNIQUES
Only techniques with a statistically significant result will be discussed under this heading.
5.1.1 Cell Manufacturing
There was a significant medium-strength relationship between the familiarity with the
technique and the qualifications of those using the technique. Employees with post-
school diplomas and university degrees seem to know more about the technique.
71
There was also a medium-strength relationship between utilisation of the technique and
productivity improvement. Manufacturers using the technique “always” showed a 100%
productivity improvement from a “moderate to a large extent“. This correlates with the
opinion of Slack et al. (2001) as discussed in Chapter 2, par. 2.3.3. They state that cell
manufacturing improves the motivation of employees and that the throughput will be
higher. According to Slack and most other advocates of lean manufacturing, reducing
inventory should be the focus. In cell manufacturing manufacturers tend to use the
technique to improve productivity and not to reduce inventory. There was, however, a
notable trend with regard to value being added to both inventory reduction and
productivity improvement. The more cell manufacturing was used, the greater the benefit
to inventory reduction and productivity improvement. The tendency of manufacturers to
use the technique to improve productivity rather than reduce inventory contradicts the
statements of Heizer and Render (1999) as discussed in Chapter 2, par 2.3.3.

There was a medium-strength relationship between the size of the business and the
knowledge of the cell manufacturing technique. Manufacturers with less than 200
employees (small to medium enterprises) tended to know more about cell manufacturing
than larger firms.
5.1.2 Waste Elimination
69% of the respondents indicated that they were familiar with the technique. Only 39.1%
of the 69% used the technique “always”. There was a significant medium-strength
relationship between productivity improvement and operating cost reduction when the
technique was used “always” in comparison to “sometimes to often”. This correlates with
the opinions of lean manufacturing advocates, for example Bicheno (2000) (Chapter 2,
par. 2.2) and Rubrich and Watson (2000) (Chapter 2, par. 2.3.15). The problem,
however, is the low utilisation of this technique by manufacturers in the Johannesburg
area. This may indicate that these manufacturers are not really lean manufactures. This
technique is one of the major techniques recommended by lean manufacturing
advocates, as discussed in Chapter 2, par. 2.2.
5.1.3 Cycle Time
There was a significant medium-strength relationship between the technique used
“always” and productivity improvement, in comparison to the technique used “sometimes
to often”. The results indicated a significant medium-strength relationship between the
technique used “always” and inventory reduction. Cycle time is second on the list of
most known techniques and it is also used second most of all the techniques.
72

5.1.4 More Techniques
Apart from the above techniques, seven more techniques were covered under the
heading “more techniques” in the questionnaire. They were continuous flow, takt time,
total quality management, one-piece flow, Poka Yoke, value-stream mapping and
product-quantity analysis ( P-Q analysis).
Respondents indicated that they used the P-Q analysis technique the least (see Chapter
4, Table 4.3.20). The technique was significantly different from the rest of the techniques
in that statistically there was a medium-strength relationship between respondents with
post-school diplomas and the utilisation of the technique. The rest of the techniques
marked in the category “other techniques” did not show a statistically significant
relationship between qualification and utilisation although the results displayed the same
trend as P-Q analysis. Value-stream mapping had the second lowest utilisation. The
findings of this study are contradictory to the opinions of Scodanibbio (2005) (Chapter 2,
par. 2.2), as well as those of Rother and Shook (1999) (Chapter 2, par. 2.3.14), who
prefer P-Q analysis and value-stream mapping as techniques for lean manufacturing.
5.2 TECHNIQUES PREFERRED BY MANUFACTURERS AND USED “ALWAYS”
The techniques preferred by manufacturers and used “always” were sorted from the
highest to the lowest percentage. Total preventative maintenance (TPM) was at the top
of the list, followed by cycle time and then cell manufacturing, assembly line balancing,
waste elimination, single minute exchange of dies (SMED), just in time (JIT) and ABC
analysis.
Utilization of the technique were reported mainly as some times to often. The
assumption can therefore be made that Gauteng assembly manufacturers are only in
the first phases of implementing lean manufacturing. This supports the statement of
73
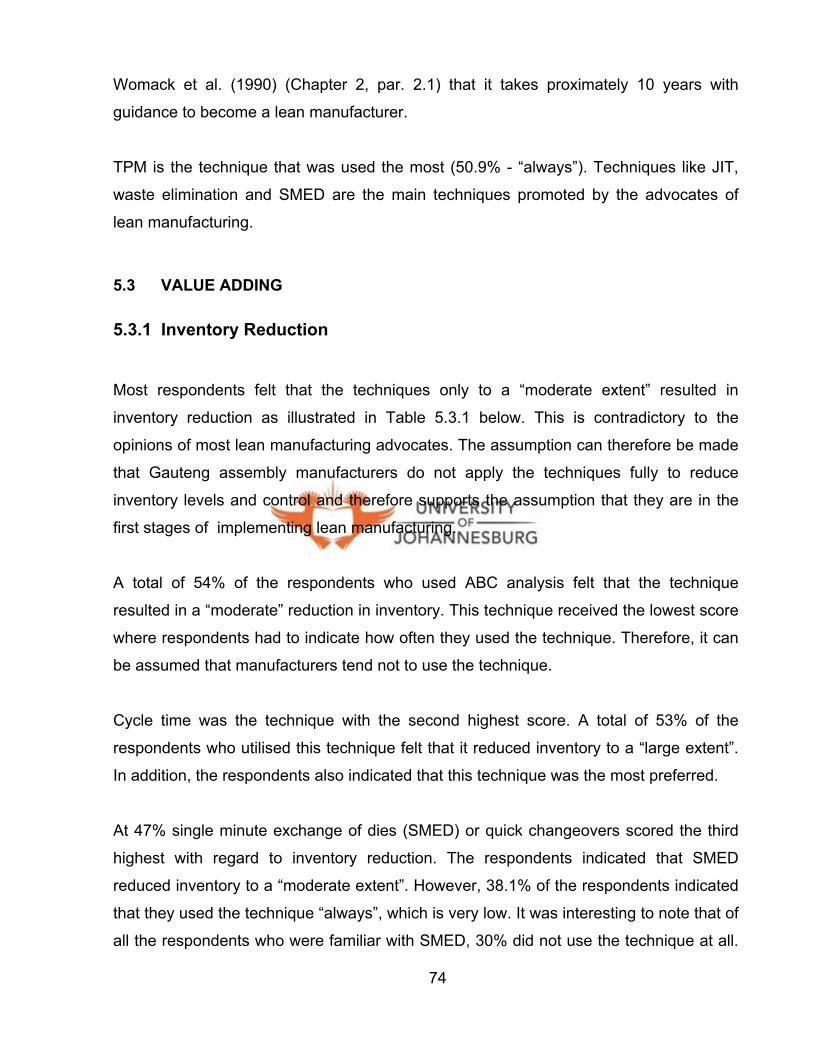
Womack et al. (1990) (Chapter 2, par. 2.1) that it takes proximately 10 years with
guidance to become a lean manufacturer.
TPM is the technique that was used the most (50.9% - “always”). Techniques like JIT,
waste elimination and SMED are the main techniques promoted by the advocates of
lean manufacturing.
5.3 VALUE ADDING
5.3.1 Inventory Reduction
Most respondents felt that the techniques only to a “moderate extent” resulted in
inventory reduction as illustrated in Table 5.3.1 below. This is contradictory to the
opinions of most lean manufacturing advocates. The assumption can therefore be made
that Gauteng assembly manufacturers do not apply the techniques fully to reduce
inventory levels and control and therefore supports the assumption that they are in the
first stages of implementing lean manufacturing.
A total of 54% of the respondents who used ABC analysis felt that the technique
resulted in a “moderate” reduction in inventory. This technique received the lowest score
where respondents had to indicate how often they used the technique. Therefore, it can
be assumed that manufacturers tend not to use the technique.
Cycle time was the technique with the second highest score. A total of 53% of the
respondents who utilised this technique felt that it reduced inventory to a “large extent”.
In addition, the respondents also indicated that this technique was the most preferred.
At 47% single minute exchange of dies (SMED) or quick changeovers scored the third
highest with regard to inventory reduction. The respondents indicated that SMED
reduced inventory to a “moderate extent”. However, 38.1% of the respondents indicated
that they used the technique “always”, which is very low. It was interesting to note that of
all the respondents who were familiar with SMED, 30% did not use the technique at all.
74

Only 51% of the respondents indicated that they were familiar with the technique – the
lowest score of all. It can therefore be assumed that manufacturers need to be made
aware of the advantages of this technique. The results showed that where the technique
was used “always”, inventory reduction benefited from a “moderate to large extent” (see
Chapter 4, par. 4.3.14). This is also confirmed by the literature (Chapter 2, par. 2.3.10).
JIT was the fourth highest reducer of inventory, but only reduced inventory to a
“moderate extent”. According to Slack et al. (2001:482), Heizer and Render (1999) and
Halevi (1999: 50) (Chapter 2, par. 2.2), JIT should play a major role in reducing
inventory. The research results showed that Gauteng manufacturers felt that JIT did not
play a major role in their manufacturing processes. It can therefore be assumed that
Gauteng manufacturers are either not lean manufacturers or they do not use the
technique correctly. They either need proper education with regard to the technique or
the lean manufacturing advocates’ theories on JIT are wrong. An interesting comment
was that of a respondent who believed that JIT only worked in Japan. This statement
opens the possibility for further research.
Table 5.3.1: Order of value added by each technique in the category “inventory reduction”
Large extent 25 53 33 32 37 31
Moderate extent 54 21 47 45 37 34
Small extent 17 18 13 19 20 25
No extent 4 9 7 3 7 9
Inventory Reduction
ABC analysis
%
Cycle
time %
SMED
%
JIT
%
TPM
%
Cell
manufacturing %
Order of value added
1 2 3 4 5 6
75

5.3.2 Improved Productivity
The research showed that all the techniques identified to improve productivity improved
it to a “large extent” (Table 5.3.2 below). A total of 64% of the manufactures using cycle
time felt that the technique contributed to a “large extent” to improving productivity. This
was followed by cell manufacturing where 50% of the manufacturers felt that the
technique contributed to improving productivity. Then came assembly line balancing and
waste elimination where 42% and 40% respectively indicated that these techniques
improved productivity to a “large extent”. These results correlate with the findings of the
literature study (Chapter 2, par. 2.3).
Table 5.3.2: Order of value added by each technique in the category “improved productivity”
Large extent 64 50 48 42 40
Moderate extent 24 37 33 35 30
Small extent 9 10 18 23 23
No extent 3 3 0 0 7
Improved Productivity
Cycle
time %
Cell
manufacturing %
Assembly line
balancing %
Waste
elimination %
JIT
%
Order of value added
1 2 3 4 5
5.3.3 Operating Cost Reduction
Table 5.3.3 below illustrates that 48% of the respondents indicated that total
preventative maintenance was believed to reduce operating cost to a “large extent”. This
correlates with the opinions of Rubrich and Watson (2000) as discussed in Chapter 2,
par. 2.3.12. Another finding that correlates with those of Rubrich and Watson (2000)
76

(Chapter 2, par. 2.3.15) is that 42% of the respondents indicated that they believed
waste elimination reduce operating cost to a “large extent”. Contrary to the opinions of
Rubrich and Watson (2000) (Chapter 2, par. 2.3.10), only 27% of the respondents
believed that (SMED) would reduce operating cost. Rubrich and Watson claim that a
manufacturer can improve setup time by 41% in the first year. This last finding therefore
needs further investigation. The possible reason for the negative feelings about SMED
may be education as the technique scored the lowest response with regard to familiarity
- 49% of the respondents did not know the technique.
Table 5.3.3: Order of value added by each technique in the category “operating cost reduction”
Large extent 48 42 27
Moderate extent 35 33 40
Small extent 18 21 27
No extent 0 3 7
Operating Cost Reduction
TPM % Waste Elimination
%
SMED %
Order of value added 1 2 3
5.4 LIMITATIONS AND FURTHER RESEARCH OPPORTUNITIES
According to Ranchod and Zhou (2001) a questionnaire of more than 6 pages is
intolerably lengthy - the researcher was therefore restricted to 6 pages. The last eight
techniques had to be tabulated and requested simple “Yes” or “No” responses – a
limitation of this research.
The research did not measure the implementing time period of the techniques that can
give a perspective to the value the techniques may add to the organization over a period
77

of time. The literature study in Chapter 2 showed that implementation of lean
manufacturing may take from 10 to 20 years.
Another limitation is that the size of a manufacturer is determined in terms of Value
added tax (VAT) or income tax turnover (IT), according to Statistics South Africa “the
real estate and business services’ industry, 2003”. This is a problem in that most
manufacturers classify this information as confidential and therefore the researcher used
the number of permanent employees as a determiner of size. This is a limitation
because Statistics South Africa only classifies manufacturers with maximum of 200
employees. Manufacturers with more than 200 employees are not classified.
The fact that Statistics South Africa could not determine how many assembly
manufacturers there were at the time of the survey was also a limitation. Therefore, a
representative sample size could not be calculated and the research use of a convenient
sample. This implies that the results might not be representative of all assembly
manufactures in Gauteng area.
Further research might reveal the reasons why the techniques are not applied or
utiliesed by assembly manufactures. Lean manufacturing can be extented to other types
of industries such as the service and food industries this needs to be researched as the
current application and utilization of these techniques as these fields are unknown.
Consequently, there are opportunities to measure the value of lean manufacturing in
these fields as well. Lean manufacturing starts at the supplier and ends at the customer.
This research measured current affairs in a definite appoint of time follow up research
might reveal whether the companies have benefited more over the long term. therefore
only measured a small part of a lean enterprise. “Lean” includes lean manufacturing,
lean procurement and lean logistics.
78
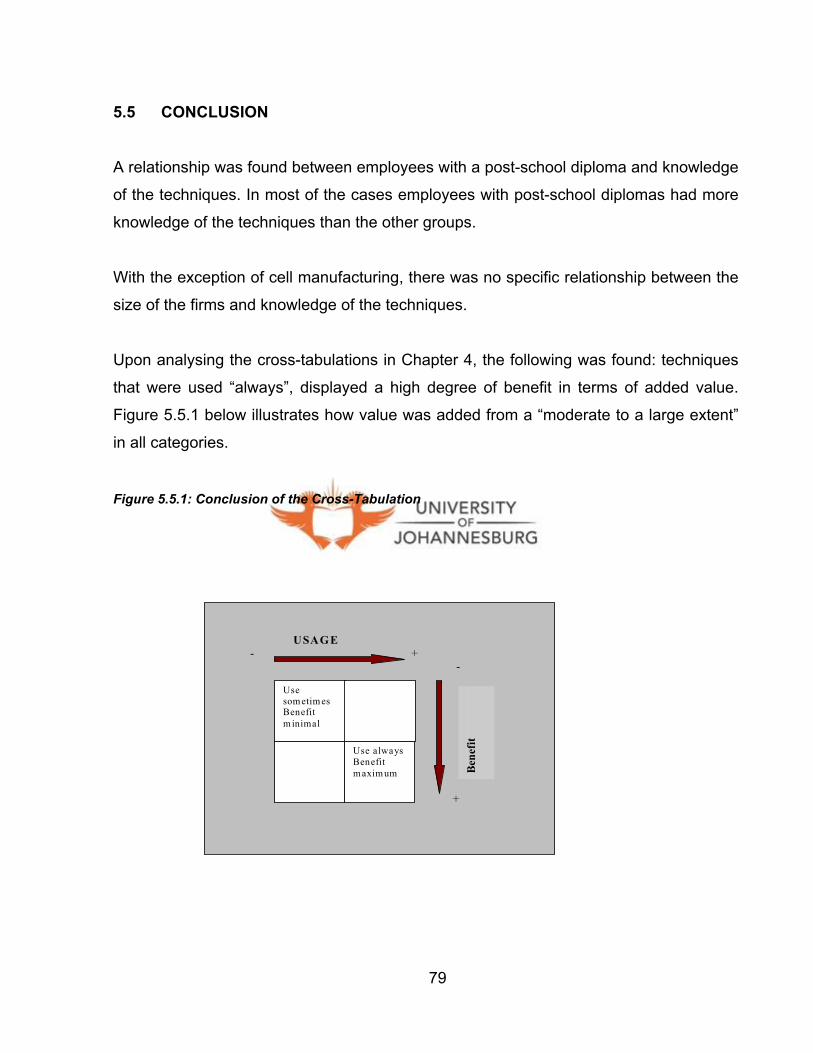
5.5 CONCLUSION
A relationship was found between employees with a post-school diploma and knowledge
of the techniques. In most of the cases employees with post-school diplomas had more
knowledge of the techniques than the other groups.
With the exception of cell manufacturing, there was no specific relationship between the
size of the firms and knowledge of the techniques.
Upon analysing the cross-tabulations in Chapter 4, the following was found: techniques
that were used “always”, displayed a high degree of benefit in terms of added value.
Figure 5.5.1 below illustrates how value was added from a “moderate to a large extent”
in all categories.
Figure 5.5.1: Conclusion of the Cross-Tabulation
USAGE
- + -
Use som etim es Benefit m inimal
Use alwaysBenefit m axim um B
enef
it
+
79
The statement can therefore be made that the more frequently the technique was used,
the greater the benefit. The categories included productivity improvement, operating
cost reduction and inventory reduction. This result correlates with the findings of the
literature study (see Chapter 2). When the technique was used “less”’ the results were
negative. In almost all the cases, most manufacturers indicated that they used the
techniques “sometimes to often”. Therefore it can be stated that the most manufacturers
in this study are not lean producers or are in the process of becoming lean.
Analysis of the order in which techniques added value showed that respondents applied
techniques in a different order to that preferred by the advocates of lean manufacturing.
Most advocates of lean manufacturing placed JIT and waste elimination in the top ranks
(refer to Chapter 2, par. 2.2, where the different views of the lean developers were
discussed). More research needs to be conducted to find the reason why Gauteng
manufacturers do not want to use JIT and waste elimination and why they focus on
productivity rather than reducing inventories.
The respondents viewed TPM as a key function in the manufacturing process and it
appeared that respondents with diplomas were most aware of the techniques covered
by this research. It seemed that the attention was focused on improving productivity
rather than reducing inventory. The majority of respondents indicated that they used the
techniques only "sometimes to often". When the techniques were used "always", they
contributed the greatest advantages to the manufacturers. It can therefore be concluded
that Gauteng assembly manufacturers are limited lean manufacturers and that there is
great potential for improvement.
80

REFERENCES Adendorff, S.A. & De Wit, P.W.C. (1997). 2nd ed. Production and operations
management, a South African perspective. Oxford: Oxford University press.
Bicheno, J. (2000). 2nd ed. Cause and effect of lean. Buckingham England: Picsie
books.
Conner, G. (2001). Lean manufacturing for the small shop. Dearborn, Michigan: Society
of Manufacturing Engineers.
Chaharbaghi, K. & Nugent, E. (1994). Towards the dynamic organization. Management
Decision, 32 (6), 45-48.
De Vos, A.S., Strydom, H., Fouché, C.B. & Delport, C.S.C. (2003). 2nd ed. Research at
grass roots. Pretoria: Van Schaik Publishers.
Eiselen, R., Uys, T. & Potgieter, N. (2005). 3rd ed. Analysing survey data using SPSS
13: A work book. Johannesburg: University of Johannesburg.
Feld, W.M. (2001). Lean manufacturing: Tools, techniques, and how to use them.
Florida: The St. Lucie press/ Apics.
Field, A. (2005). 2nd ed. Discovering statistics using SPSS. London: SAGE Publications.
Filippini, R. (1997). Operations management research: some reflections on evolution,
models and empirical studies in OM. International Journal of Operations & Production
Management, 17 (7), 655-670. [On-line]. Internet: http://www.emerald-library.com/
Halevi, G. (1999). Restructuring the manufacturing process applying the matrix method.
Florida: The St. Lucie press/ Apics.
Heizer, J. & Render, B. (1999). 3rd ed. Principles of operations management. New
Jersey: Prentice Hall.
Heizer, J. & Render, B. (2004). 5th ed. Principles of operations management. New
jersey: Prentice Hall.
Karlsson, C. & Åhlström, P. (1996). Assessing changes towards lean production..
International Journal of Operations & Production Management, 16 (2), 24-41. [On-line].
Internet: http://www.emerald-library.com/
Kachieng’a, M.O. & Koekemoer, D.J. (2002). Technological entrepreneurship: Financing
new technology based enterprises in South Africa. Department of Engineering and
Technology Management: University of Pretoria South Africa.
Mouton, J. (2001). How to succeed in your master’s & doctoral studies. Pretoria: Van
Schaik Publishers.
Parks, C. M. (2002). Instill lean thinking. Industrial Management, 44 (5), 14-19. [On-line].
Internet: http://search.epnet.com/direct.asp?an=7600591&db=f5h
Pallant, J. (2005). 2nd ed. SPSS Survival manual. A step by step guide to analysis using
SPSS for Windows (version 12). New York: Open University Press.
Ranchod, A. & Zhou, F. (2001). Comparing respondents of e-mail and mail surveys:
understanding the implications of technology. Marketing intelligence & planning, 19 (4),
254-262 [On-line]. Internet:: http://www.emerald-library.com/
Rother, M. & Shook, J. (2001). Creating continuous flow. Massachusetts: The lean
enterprise institute Inc. [On-line]. Internet: http://www.lean.org.
Rubrich, L. & Watson, M. (2000). Implementing world class manufacturing. Indiana:
WCM Associates.
ii

Russell, R.R. & Taylor, B.W. (2003). 4th ed. Operations Management. Upper Saddle
river: Prentice Hall.
Salvatore, D. (2001). 4th ed. Managerial economics in global economy. Orlando:
Harcourt College Publishers
Schonberger, R. (2004). Is South African manufacturing lean? Management today, 20
(1) 20-22.
Scodanibbio, C. (2005).Next generation lean manufacturing. [On-line] Internet:
http://www.scodanibbio.com/
Sekine, K, (1992). One piece flow. Cambridge: Productivity press.
Slack, N., Chambers, S. & Johnston, R. (2001). 3rd ed. Operations Management.
England: Prentice Hall.
South Africa. (2005). Economic overview. [On-line].Internet:
http://www.bombaychamber.com/southafrica.htm.
Statistics South Africa. (1996). Census of manufacturing 1996, Principal statistics on
regional basis, Gauteng. Report 30-01-10. [On-line].Internet:
http://www.statssa.gov.za/publications/report-30-01-101996.pdf
Statistics South Africa. (2003).The real estate and business services’ industry, 2003.
http://www.statssa.gov.za/
Soriano-Meier, H. & Forrester, P.L. (2002). A model for evaluating the degree of
leanness of manufacturing firms. Integrated manufacturing systems, 13 (2),104-109 [On-
line]. Internet: http://www.emerald-library.com/
iii

Vinten, G. (1995). Open versus closed questions – an open issue. Management
Decision, 33 (4),27-31. [On-line]. Internet: http://www.emerald-library.com
Wegner, T. (1999). Applied business statistics. Cape Town: Juta.
Government of South Africa. (1995). White Paper on National Strategy for the
Development and Promotion of Small Business in South Africa. [On-line]. Internet:
http://www.logos-net.net/ilo/150_base/en/init/sa_10.htm
Womack, J.P., Jones, D.T. & Roos, D. (1990). The machine that changed the world.
New York: Rawson Associates.
Womack, J.P.& Jones ,D.T (1994). From lean production to the lean enterprise. Harvard
Business review, March-April, 93-103.
iv
BIBLIOGRAPHY Aurrecoechea, A., Busby, J.S., Nimmons, T. & Williams, G.M. (1994). The evaluation of
manufacturing cell designs. International Journal of Operations & Production
Management, 14 (1), 60-74 [On-line]. Internet: http://gottardo.emeraldinsight,com/
Harrison, A. (1998). Manufacturing strategy and the concept of world class
manufacturing. International. Journal of Operations & Production Management, 18 (4),
397-408.
Jeong, K. & Philips, D. T. (2001). Operational efficiency and effectiveness measurement.
International Journal of Operations & Production Management, 21 (11), 1404-1416. [On-
line]. Internet:http://www.emerald-library.com
Karlsson, C. & Åhlström, P. (1997). A Lean and Global smaller firm? International
Journal of Operations & Production Management, 17 (10), 940-952. [On-line].
Internet:http://www.emerald-library.com
McMullen, T. B. Jr. (1998). Introduction to the Theory of constraints (TOC) Management
systems. New York: The St. Lucie press/ Apics.
Ramasesh, R., Kulkarni, S. & Jayakumar, M. (2001). Agility in manufacturing systems:
an exploratory modeling framework and simulation. Integrated manufacturing
systems,12 (7), 534-548 [On-line]. Internet: http://leporello.emeraldinsight,com/
Rother, Mike., Shook, John. (1999). Learning to see. Massachusetts: The lean
enterprise institute Inc. [On-line]. Internet: http://www.lean.org.
Shingo, S. (1989). A study of the Toyota production system: From an industrial
engineering viewpoint. Cambridge: Productivity press.
Shingo, S. (1992). The Shingo production management system: Improving process
functions. Cambridge: Productivity press.
v

vi
Smeds, R. (1994). Managing change towards lean enterprises. International Journal of
Operations & Production Management, 14 (3), 66-82. [On-line]. Internet:
http://pippo.emeraldinsight,com/
Yan, H. S. & Jiang, J. (1999). Agile Concurrent Engineering. Integrated manufacturing
systems, 10 (2), 103-113. [On-line]. Internet: http://pippo.emeraldinsight,com/