heroin and opioids in maine special report: heroin, opioids, and other drugs in maine by tim...
TRANSCRIPT

SEOW Special Report: Heroin, Opioids, and Other
Drugs in Maine
By Tim Diomede, MPPM
October 2015
1 State Epidemiological Outcomes Workgroup

Introduction
The following report is a product of the Maine State Epidemiological Outcomes Workgroup (SEOW). The Maine SEOW, under the Office of Substance Abuse and Mental Health Services (SAMHS), is charged with collecting, analyzing, and disseminating data regarding substance use and related behavioral health in efforts to help prevention professionals and stakeholders make data driven decisions.
The following report examines the consumption, consequences, and contributing factors of substance use in Maine with a special focus on heroin and opioids. In addition, the report looks at data indicators related to the treatment of substance use as well as co-occurring mental health and substance use disorders. In order to provide for a more comprehensive report, SEOW relies on a multitude of data sources (Appendix A). When possible, indicators have been analyzed by demographics (e.g., age, gender) and defined geographical regions (e.g. public health district, county).
2

List of Charts Executive Summary (pages 6 and 7)
Impact/Consequences of Substance Use (pages 8-34)
9) Unintentional Deaths in Maine, by type: 2009-2014
10) Drug poisoning rates (per 100,000 residents), by state: 2013
11) Number of deaths* caused by pharmaceuticals and/or illicit drugs: 2010–2014
12) Number of drug deaths involving specific drug types*: 2014**
13) Number of drug deaths* involving specific drug types**: 2010–2014
14) Heroin related death overdoses, Maine vs. Nation: 2002-2013
15) Drug-related* death rate per 100,000, by county: 2012-14
16) Drug-related* death rate per 100,000, by public health district: 2009-10 to 2013-14
17) Number of overdose EMS responses related to drugs/medications*: 2011–2014
18) Distribution of EMS drug/medication* overdose responses, by age and type: 2014
19) Number of EMS overdose responses due to drugs/medications* per 10,000 residents, by public health district: 2014
20) Number of overdose EMS responses due to drug/medication* per 10,000 residents, by public health district: 2011-2014
21) EMS naloxone administrations, by gender and age: 2014
22) EMS naloxone administrations per 10,000 residents, by county: 2014
23) MDEA drug offense arrests in Maine, by drug type: 2010–2014
24) MDEA heroin arrest rate per 100,000, by county: 2012-14
25) MDEA pharmaceutical narcotics arrest rate per 100,000, by county: 2012-14
26) Rate of drug offense arrests made by state, county, and local law enforcement involving synthetic narcotics (per 10,000 residents): 2013
27) Rate of drug offense arrests made by state, county, and local law enforcement involving opium, cocaine, and derivatives (per 10,000 residents): 2013
28) Drug offense arrests made by state, county, and local law enforcement, by drug type: 2009-2013
29) Number of pharmacy robberies in Maine: 2010–2014
30) Rate of pharmacy robberies per 100,000 residents: 2012-14
31) Number of drug affected baby notifications*: 2005-2014
3

List of Charts
Impact (continued)
32) Average rate of drug affected baby notifications per 10,000 residents, by county: 2012-14
33) Average rate of drug affected baby notifications per 10,000 residents, by county: 2006-08 to 2012-14
34) Impact Summary
Consumption/Prevalence Rates (pages 35-42)
36) Percent of high school students who have taken prescription drugs that were not prescribed to them in their lifetime and in the past month: 2009–2013
37) Percent of high school students who have taken prescription drugs not prescribed to them by a doctor in past 30 days, by public health district: 2009-2013
38) Non-medical use of pain relievers among adult Maine residents in the past year, by age group: 2007–08 to 2012–13
39) Percent of adults who used prescription pain relievers in past year for nonmedical use, by age group and public health district: 2010-12
40) Illicit drug* use other than marijuana in the past month, by age group and state: 2012-13
41) Illicit drug* use other than marijuana in the past month among 18-25 year olds in Maine: 2012-13
42) Consumption Summary
Contributing Factors (pages 43-52)
44) Dispensed quantity of prescribed narcotics per capita, by county: 2014
45) Dispensed quantity of narcotics per capita, by county: 2010-2014*
46) Substances most frequently requested for verification by non-law enforcement, by drug type: (NNEPC, 2014)
47) Number of poisoning calls related to verification of opioids reported to New England Poison Center (per 10,000 residents), by county: 2013-14
48) Number of poisonings reported to Northern New England Poison Center 10,000 residents, by drug type and public health district: 2013-14
49) Parent perception of teen accessibility of prescription drugs at home without parental knowledge: 2015
50) Parent perception of teen accessibility of prescription drugs at home without parental knowledge, by public health district: 2015
51) U.S. residents aged 12 and older who used pain relievers nonmedically, by point of access: 2012-13
52) Contributing Factor Summary
4

List of Charts
Treatment (pages 53-65)
54) Needing but not receiving treatment for illicit drugs, by age group: 2007-08 to 2012-13
55) Average rate (per 10,000 residents) of adult primary treatment admissions, by drug type and county: 2012-14
56) Average rate (per 10,000 residents) of adult primary treatment admissions related to heroin/morphine: 2012-14
57) Primary admissions (18+) related to heroin/morphine, by public health district and drug type: 2010-2014
58) Average rate of adult primary treatment admissions (per 10,000 residents) related to synthetic opioids, by county: 2012-14
59) Primary treatment admissions (18+) related to synthetic opioids, by public health district and drug type: 2010-2014
60) Average rate of adult primary treatment admissions (per 10,000 residents) due to methadone/buprenorphine: 2012-14
61) Primary heroin/morphine treatment admissions, by age group: 2014
62) Primary substance use treatment admissions, by drug type and age group: 2014
63) Secondary admissions among primary heroin/morphine treatment admissions (adults 18+): 2014
64) Secondary admissions for substance use treatment, by primary drug: 2014
65) Treatment Summary
Co-occurring Disorders (pages 66-72)
67) Substance Dependence or Abuse in past year among U.S. adults (18+), by level of mental illness: 2014
68) Past year illicit drug use among U.S. citizens 12 to 17, by past year major depressive episode: 2014
69) Percent of total treatment admissions with reported mental health disorders: 2010–2014
70) Mental health disorders among substance abuse treatment admissions, by primary drug type: 2014
71) Percent of adults served through Maine state mental health agencies (SMHA) who had co-occurring mental health and substance use disorders: 2007-2014
72) Co-occurring Summary
5

Executive Summary
Prescription drugs continue to represent a serious public health concern.
Prescription drug misuse also continues to have a large impact on treatment, mortality/morbidity, and crime in Maine.
Pharmaceutical drugs contribute to the majority of drug overdose deaths.
Lethal co-toxicants such as Benzodiazepines and Fentanyl require closer monitoring.
As the availability of prescription narcotics has leveled off, heroin use and the consequences thereof have been on the rise.
Somerset and Kennebec have persistently observed some of the highest rates for narcotics prescribed per person since 2008.
6

Executive Summary (cont.)
Based on arrest and treatment data, heroin use is most prevalent among the southern and coastal regions (specifically York, Cumberland, Androscoggin, Kennebec, and Knox).
Rates of heroin trafficking/sales (DEA) arrests are highest in the Midcoast region.
Opioid and heroin treatment is most common among 26 to 34 year olds.
Availability and accessibility of opioids continues to be a problem.
Co-occurring mental health and substance disorders are increasingly common among those seeking treatment.
It’s evident that there is a strong relationship between substance use and mental health.
7

8
Impact (e.g., deaths, overdoses, arrests,
poisonings)
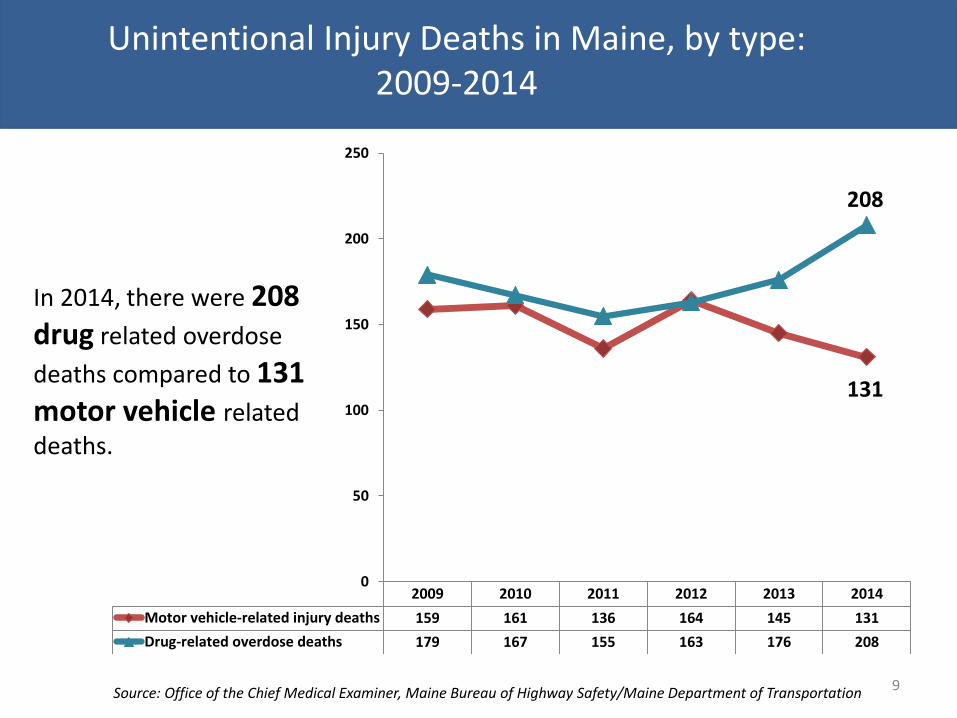
Unintentional Injury Deaths in Maine, by type: 2009-2014
9
2009 2010 2011 2012 2013 2014
Motor vehicle-related injury deaths 159 161 136 164 145 131
Drug-related overdose deaths 179 167 155 163 176 208
0
50
100
150
200
250
Source: Office of the Chief Medical Examiner, Maine Bureau of Highway Safety/Maine Department of Transportation
In 2014, there were 208
drug related overdose
deaths compared to 131
motor vehicle related
deaths.
208
131

Drug poisoning rates (per 100,000 residents), by state: 2013
10
Source: National Vital Statistics Report http://www.cdc.gov/nchs/data/nvsr/nvsr64/nvsr64_02.pdf
In 2013, Maine ranked 30th in drug poisoning deaths with 13.2 deaths per 100,000.

Number of deaths* caused by pharmaceuticals and/or illicit drugs: 2010–2014
11
2010 2011 2012 2013 2014
Pharmaceutical 160 140 140 105 186
Illicit 17 17 39 47 75
All 167 155 163 176 208
0
50
100
150
200
250
*Deaths involving pharmaceuticals and illicit drugs are not mutually exclusive.
Source: Marci Sorg, Margaret Chase Smith Policy Center at University of Maine, Office of the Chief Medical Examiner
In 2014, most (89%) drug overdose deaths involved
pharmaceutical drugs.
From 2011 to 2014, Maine observed a 34% increase in
the number of all drug
related overdose deaths.
There was a 340% increase
in the number of illicit drug-related overdose deaths was observed from 2011 to 2014.
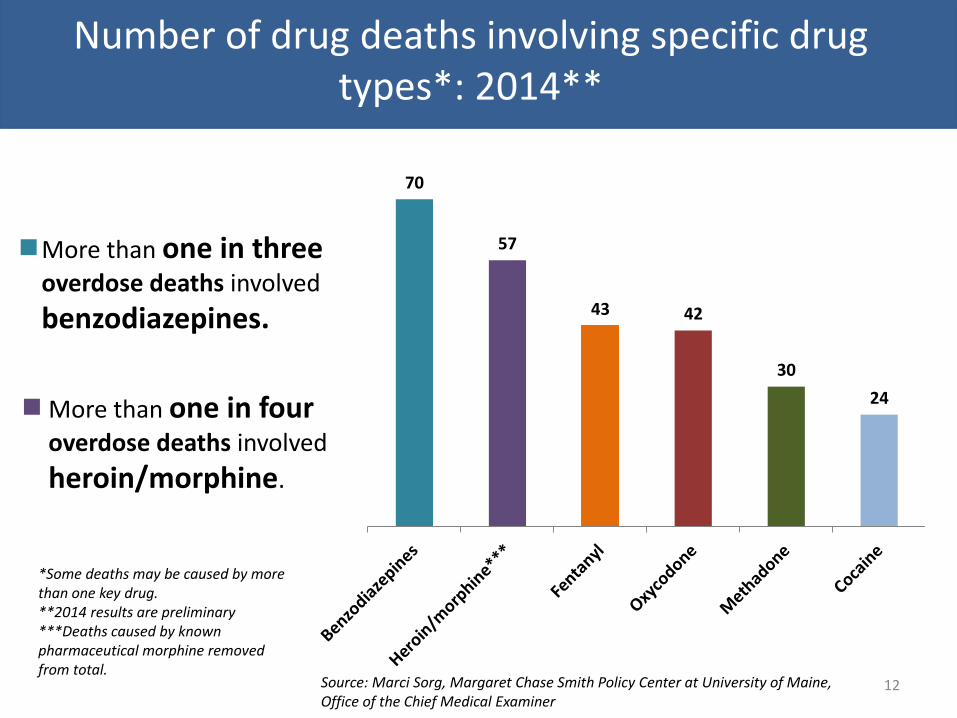
Number of drug deaths involving specific drug types*: 2014**
12
70
57
43 42
30
24
*Some deaths may be caused by more than one key drug. **2014 results are preliminary ***Deaths caused by known pharmaceutical morphine removed from total.
More than one in three overdose deaths involved
benzodiazepines.
More than one in four overdose deaths involved
heroin/morphine.
Source: Marci Sorg, Margaret Chase Smith Policy Center at University of Maine, Office of the Chief Medical Examiner

Number of drug deaths* involving specific drug types**: 2010–2014
13
*Deaths caused by known pharmaceutical morphine removed from total. **Some deaths may be caused by more than one key drug.
2010 2011 2012 2013 2014
Methadone 50 42 32 37 30
Oxycodone 48 36 45 32 42
Benzodiazepines 57 41 33 63 70
Heroin/morphine** 7 9 28 34 57
Cocaine 10 13 13 10 24
Fentanyl 10 14 10 9 43
0
20
40
60
80
Fentanyl related deaths increased by 377% from 2013 (9) to 2014 (43)
In 2014, there were 57 deaths involving
heroin/morphine; a 530% increase since 2011.
Source: Marci Sorg, Margaret Chase Smith Policy Center at University of Maine, Office of the Chief Medical Examiner

Source, National Data: USCDC; Multiple Cause of Death Files from the National Vital Statistics System, 2002-2013.
Heroin related death overdoses, Maine vs. Nation: 2002-2013
14 Source, Maine Data: Maine Department of Health and Human Services, Office od Research, Data and Vital Statistics
2.2
2.8
1.8
3.3
2.4
1.9
1.5
1.0
0.5 0.7
2.1
4.3
0.7 0.7 0.6 0.7 0.7 0.8
1.0
1.1 1.0
1.4 1.9
2.7
0.0
1.0
2.0
3.0
4.0
5.0
Maine
Nation

19.7
17.7
16.1 15.9 14.9
13.7 13.7 13.7 13.4 12.8 12.6
9.5 8.6 8.5
7.7
5.8 5.2
Drug-related* death rate per 100,000, by county: 2012-14
15
In 2012-14, Washington county observed
on average 19.7 drug related overdose
deaths per 100,000 residents per year.
*Drug related deaths include all drug types (illicit and pharmaceutical)
State average=13.7
Source: Marci Sorg, Margaret Chase Smith Policy Center at University of Maine, Office of the Chief Medical Examiner

Drug-related* death rate per 100,000, by public health district: 2009-10 to 2013-14
16
2009-10 2010-11 2011-12 2012-13 2013-14
Aroostook 6.3 10.5 11.2 9.9 10.8
Central 13.3 14.9 12.7 15.6 17.4
Cumberland 15.0 12.0 13.8 16.7 15.5
Downeast 13.3 12.0 12.6 9.8 13.3
Mid Coast 8.0 10.1 11.5 11.2 12.9
Penquis 16.0 14.9 12.3 11.4 12.9
Western 12.9 11.0 10.7 11.3 13.1
York 14.0 10.9 10.3 10.8 14.5
Maine 13.1 12.2 12.0 12.8 14.4
0.0
5.0
10.0
15.0
20.0
*Drug related deaths include all drug types (illicit and pharmaceutical)
Central and Cumberland have observed some of the
highest rates of drug related
overdose deaths.
In 2013-14, Central observed the highest average of drug related
deaths, at 17.4 per 100,000 residents per year.
Source: Marci Sorg, Margaret Chase Smith Policy Center at University of Maine, Office of the Chief Medical Examiner

Number of overdose EMS responses related to drugs/medications*: 2011–2014
17
2,189
3,465
3,217
2,947
2011 2012 2013 2014
*Drugs/medication include illicit drugs and prescription drugs. Data are not broken down further than this category.
Source: Maine Emergency Medical Services
From 2011- 2014, Maine EMS
reported a 35% increase in
overdoses from
drugs/medications.

Distribution of EMS drug/medication* overdose responses, by age and type: 2014
18
202
490
646
523
557
288
112 94
37
< 18
18 - 25
26 - 35
36 - 45
46 – 55
56 - 65
66 - 75
> 75
Unknown
< 18 18 - 25 26 - 35 36 - 45 46 – 55 56 - 65 66 - 75 > 75 Unknown Percent by Age Group (n=2947) 7% 17% 22% 18% 19% 10% 4% 3% 1%
*Drugs/medication include illicit drugs and prescription drugs. Data are not broken down further than this category.
Source: Maine Emergency Medical Services
EMS overdose responses due
to drugs/medication were
most common among Mainers
between 26 and 55 year
olds.

Number of EMS overdose responses due to drugs/medications* per 10,000 residents, by public
health district: 2014
19
32.7
25.2
22.2 21.5 19.9
17.7 17.3
14.1 13.5
*Drugs/medication include illicit drugs and prescription drugs. Data are not broken down further than this category.
Source: Maine Emergency Medical Services
In 2014, Cumberland observed the highest rate
of EMS overdose responses due to
drugs/medication with
an average of 32.7 responses per 10,000 residents.
State average=22.2

Number of overdose EMS responses due to drug/medication* per 10,000 residents, by public health district: 2011-2014
20
2011 2012 2013 2014
Aroostook 14.7 16.8 16.1 14.1
Central 19.4 30.4 25.1 19.9
Cumber. 14.2 43.6 38.1 32.7
Downeast 18.9 18.0 17.0 17.3
Midcoast 17.9 21.4 18.6 13.5
Penquis 14.7 16.2 17.8 21.5
Western 12.5 21.4 19.7 17.7
York 21.2 20.6 23.6 25.2
Maine 16.5 26.1 24.2 22.2
0.0
10.0
20.0
30.0
40.0
50.0
*Drugs/medication include illicit drugs and prescription drugs. Data are not broken down further than this category.
Source: Maine Emergency Medical Services
Most public health districts observed a decrease in the rates of EMS responses due to drugs/medication after 2012, with the exception of York and
Penquis.

EMS naloxone administrations, by gender and age: 2014
21
2%
12%
30%
32%
12%
11%
1%
<18
18-24
25-34
35-54
55-64
65+
Unknown6
39
81
99
38 41
3 8
57
170 170
63
51
2
<18 18-24 25-34 35-54 55-64 65+ Unknown
Female
Male
In 2014, there were a total of 829 EMS naloxone administrations
statewide. Males of all ages and males and females aged 25 to 54 years received the highest percentage of administrations.
Source: Maine Emergency Medical Services

EMS naloxone administrations per 10,000 residents, by county: 2014
22
9.0
8.4
7.7 7.2
6.2 5.9 5.8 5.7 5.5
4.7
3.7 3.5
2.9 2.7 2.4
2.0 2.0
Source: Maine Emergency Medical Services
York, Androscoggin, Cumberland, and Washington counties observed the highest
rates of EMS naloxone administrations.
State average=6.2

MDEA drug offense arrests in Maine, by drug type: 2010–2014
23
2010 2011 2012 2013 2014
Cocaine/crack 189 172 89 126 113
Heroin 40 58 63 127 216
Marijuana 196 69 96 37 38
Methamphetamine 30 23 32 51 63
Pharm-narcotic 327 236 222 230 163
Cathinones* 0 1 34 52 51
0
100
200
300
400
Source: Maine Drug Enforcement Agency, 2010-2014
In 2014, one in three drug offense arrests made
by MDEA involved heroin.
*Cathinones are synthetic derivatives of an alkaloid that are used as drugs for their stimulating properties.
The number of drug offense
arrests due to heroin more
than quadrupled from
2010 to 2014.
NOTE: The MDEA, through its regional multi-jurisdictional task forces is the lead
state agency in confronting drug trafficking crime.

24
32.8
20.0 18.3
13.0 12.7 11.5
10.2 9.6 9.3 8.3
7.3 6.0 5.8
3.3 2.9 2.6
0.0
MDEA heroin arrest rate per 100,000, by county: 2012-14
NOTE: The MDEA, through its regional multi-jurisdictional task forces is the lead
state agency in confronting drug trafficking crime.
Source: Maine Drug Enforcement Agency
During 2012-14, Knox county observed the highest rate of
MDEA arrests related to heroin with a yearly average of
32.8 arrests per 100,000 residents.
State average=10.2

25
MDEA pharmaceutical narcotics arrest rate per 100,000, by county: 2012-14
Source: Maine Drug Enforcement Agency
69.8
56.6
46.9
34.2
20.8 19.0 18.7 18.5
15.4
8.0 7.6 7.3 6.6 5.8 5.2 5.2 1.9
NOTE: The MDEA, through its regional multi-jurisdictional task forces is the lead
state agency in confronting drug trafficking crime.
During 2012-14, Knox, Lincoln, Hancock, and Waldo
counties observed the highest rates of MDEA arrests related
to pharmaceutical narcotics.
State average=15.4

26
11.1
8.9
6.5 6.4 6.3
5.4 5.1 4.6 4.6 4.3 4.0
3.5 3.3 3.1 2.3
1.8 1.2
Rate of drug offense arrests made by state, county, and local law enforcement involving synthetic narcotics (per 10,000 residents): 2013
Note: Arrests include sales, manufacturing, and possession of drugs. Although not shown, the
majority of arrests made by state, county, and local law enforcement are for possession.
Source: Maine Department of Public Safety/Uniform Crime Report
In 2013, local law enforcement arrests involving pharmaceutical narcotics were highest in Knox and Hancock counties .
State average=4.6

27
Rate of drug offense arrests made by state, county, and local law enforcement involving opium, cocaine, and derivatives (per 10,000
residents): 2013
13.8
10.2
7.3 6.9 6.9 6.9
4.9 4.3
3.8 3.8 3.1 3.0
2.2 1.9 1.7 1.5 1.2
Source: Maine Department of Public Safety/Uniform Crime Report
In 2013, state, county, and local law enforcement arrests involving
opium, cocaine, and derivatives were highest in
Cumberland and Androscoggin counties.
Note: Arrests include sales, manufacturing, and possession of drugs. Although not shown, the
majority of arrests made by state, county, and local law enforcement are for possession.
State average=6.9
28
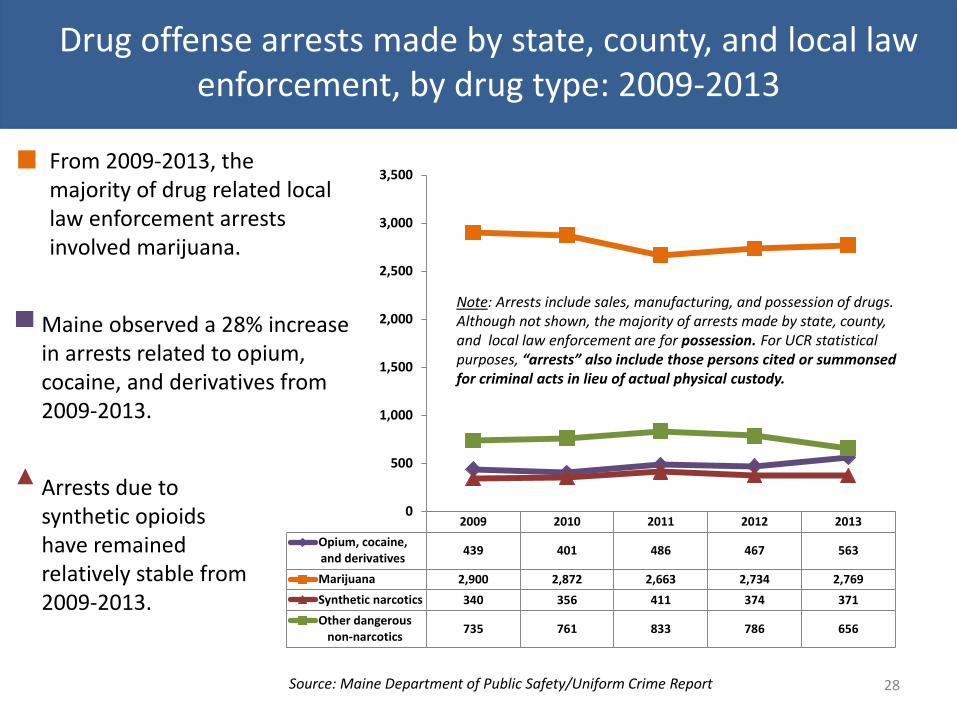
2009 2010 2011 2012 2013
Opium, cocaine,and derivatives
439 401 486 467 563
Marijuana 2,900 2,872 2,663 2,734 2,769
Synthetic narcotics 340 356 411 374 371
Other dangerousnon-narcotics
735 761 833 786 656
0
500
1,000
1,500
2,000
2,500
3,000
3,500
Drug offense arrests made by state, county, and local law enforcement, by drug type: 2009-2013
Source: Maine Department of Public Safety/Uniform Crime Report
From 2009-2013, the majority of drug related local law enforcement arrests involved marijuana.
Maine observed a 28% increase in arrests related to opium, cocaine, and derivatives from 2009-2013.
Note: Arrests include sales, manufacturing, and possession of drugs. Although not shown, the majority of arrests made by state, county, and local law enforcement are for possession. For UCR statistical purposes, “arrests” also include those persons cited or summonsed for criminal acts in lieu of actual physical custody.
Arrests due to synthetic opioids have remained relatively stable from 2009-2013.

Number of pharmacy robberies in Maine: 2010–2014
29
23 24
56
13
20
0
20
40
60
80
100
2010 2011 2012 2013 2014
Source: Maine Drug Enforcement Agency/Uniform Crime Report
From 2010-2014, pharmacy robberies in Maine remained relatively stable, with a spike in 2012.

Rate of pharmacy robberies per 100,000 residents: 2012-14
30
7.4
5.0
4.3
3.3 2.9 2.8
2.6 2.3 2.2
1.9 1.5
1.3 1.0 0.9
0.0 0.0 0.0
From 2012-14, Kennebec County held the highest
rate of pharmacy robberies reporting a yearly
average of 7.4 robberies per 100,000 residents.
Source: Maine Drug Enforcement Agency/Uniform Crime Report
State average=2.2

Number of drug affected baby notifications*: 2005-2014
31
165 201
274
343
451
572
667
779
927 961
0
200
400
600
800
1000
Source: Office of Child and Family Services (OCFS), Maine Automated Child Welfare Information System (MACWIS).
From 2005 to 2014, the number of drug affected baby notifications
increased by 480%.
In 2014, there were a total
of 961 reports of drug affected baby notifications.
*This measure reflects the number of infants born in Maine where a healthcare provider reported to OCFS that there was reasonable cause to suspect the baby may be affected by illegal substance abuse or demonstrating withdrawal symptoms resulting from prenatal drug exposure (illicit or prescribed appropriately under a physician’s care for the mother’s substance abuse treatment) or who have fetal alcohol spectrum disorders.
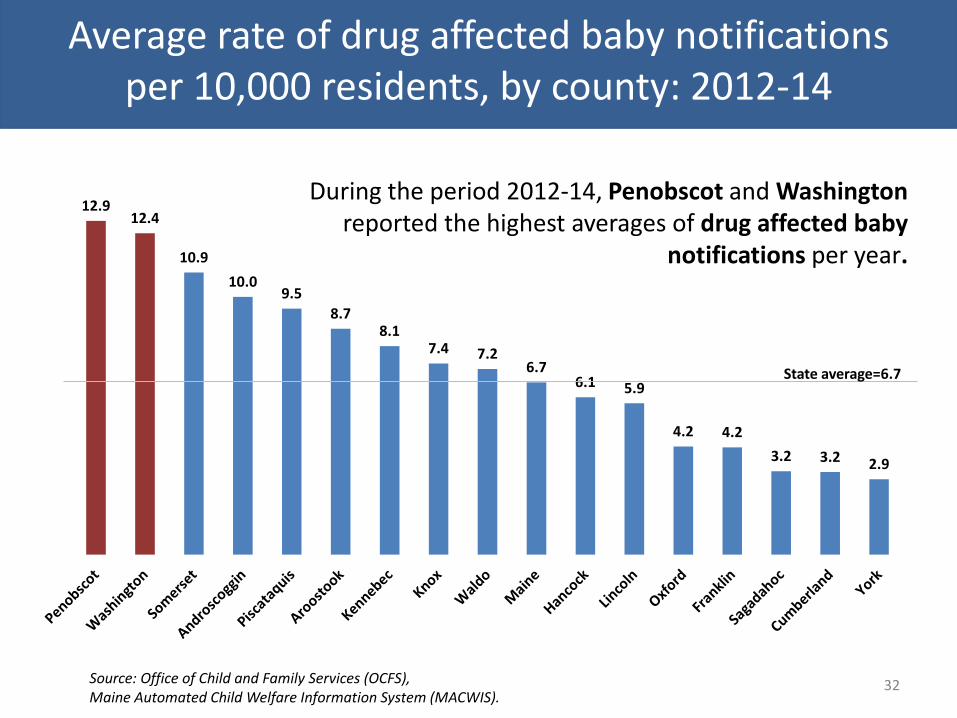
Average rate of drug affected baby notifications per 10,000 residents, by county: 2012-14
32
12.9 12.4
10.9
10.0 9.5
8.7 8.1
7.4 7.2 6.7
6.1 5.9
4.2 4.2
3.2 3.2 2.9
Source: Office of Child and Family Services (OCFS), Maine Automated Child Welfare Information System (MACWIS).
State average=6.7
During the period 2012-14, Penobscot and Washington reported the highest averages of drug affected baby
notifications per year.

Average rate of drug affected baby notifications per 10,000 residents, by county: 2006-08 to 2012-14
33
0.0
2.0
4.0
6.0
8.0
10.0
12.0
14.0
2006-08 2008-10 2010-12 2012-14
Androscoggin
Aroostook
Cumberland
Franklin
Hancock
Kennebec
Knox
Lincoln
Oxford
Penobscot
Piscataquis
Sagadahoc
Somerset
Waldo
Washington
York
Maine
Source: Office of Child and Family Services (OCFS), Maine Automated Child Welfare Information System (MACWIS).
Since 2006-08,
Penobscot has observed the highest rate of drug affected baby notifications.

34
Impact Summary • Drug overdose deaths increased by 34% from 2011 to 2014.
• One in three drug OD’s involved Benzodiazepines, one in four involved heroin, and one in five involved fentanyl.
• Fentanyl related deaths increased by 377% from 2013 to 2014
• From 2013 to 2014, the number of drug overdose deaths involving pharmaceutical drugs increased by 77% while those due to illicit drugs increased by 60%.
• Cumberland and York had the highest rates of EMS overdose responses due to drugs/medication.
• Majority of EMS naloxone admins were among males between 25 and 54.
• Rates of drug related OD’s are highest in Washington, Androscoggin, Cumberland, Kennebec, and Somerset counties.
• Majority of MDEA heroin and opioid arrests are from Midcoast and Downeast.
• The number of drug offense arrests due to heroin more than quadrupled from 2010 to 2014.
• Highest rate of local law enforcement arrests related to opium, cocaine, and derivatives were observed in Cumberland and Androscoggin.
• Kennebec had the highest rate of pharmacy robberies in recent years.
• From 2005 to 2014, the number of drug affected baby notifications increased by 480%; Penobscot and Washington counties reported the highest rates.

35
Rates of Use

Percent of high school students who have taken prescription drugs that were not prescribed to them in their lifetime and in
the past month: 2009–2013
36
18%
9%
15%
7%
12%
6%
Lifetime Past month
2009
2011
2013
Source: Maine Integrated Youth health Survey
In 2013, more than 1 out of 10 high school students reported
misusing a Rx drug in their
lifetime.
Rates for lifetime as well as
past month misuse of
prescription drugs decreased
from 2009 to 2013.

Percent of high school students who have taken prescription drugs not prescribed to them by a doctor in past 30 days, by
public health district: 2009-2013
37
Aroostook Central Cumber. Downeast Midcoast Penquis Western York Maine
2009 6% 8% 8% 9% 9% 9% 9% 10% 9%
2011 5% 7% 7% 5% 9% 8% 7% 8% 7%
2013 5% 4% 6% 6% 6% 6% 7% 6%
0%
5%
10%
15%
20%
25%
Source: Maine Integrated Youth health Survey
Rates across public health districts in Maine are relatively consistent.

Non-medical use of pain relievers among adult Maine residents in the past year, by age group:
2007–08 to 2012–13
38
14% 14%
11% 11%
9%
3% 3% 3% 3% 3%
18-25 year olds
26+ year olds
Source: National Survey on Drug Use and Health
In 2012-13, about 1 in 10 young adults 18 to 25
reported misusing pain relievers in the past year.
Rates among 18 to 25 year olds group have been
declined from 2008-2009 to 2012-2013.

Percent of adults who used prescription pain relievers in past year for nonmedical use, by age group and public health district:
2010-12
39
Aroostook/Downeast
Central Cumber. Midcoast Penquis Western York Maine
18+ 3.7% 4.2% 4.0% 3.5% 4.9% 4.5% 3.9% 4.1%
18 to 25 10.6% 11.4% 10.2% 10.6% 13.0% 12.1% 10.8% 11.3%
26+ 2.9% 3.2% 3.1% 2.8% 3.3% 3.4% 3.0% 3.1%
0.0%
5.0%
10.0%
15.0%
20.0%
25.0%
Source: National Survey on Drug Use and Health
Across public health districts, rates are consistently higher among
young adults 18-25 years of age.
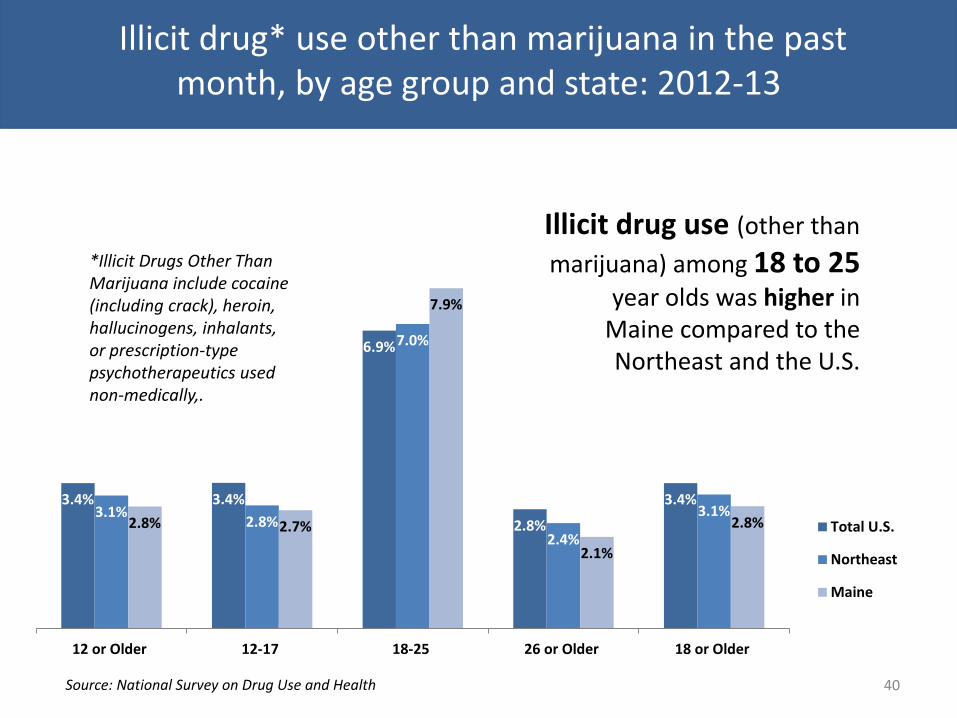
Illicit drug* use other than marijuana in the past month, by age group and state: 2012-13
40
3.4% 3.4%
6.9%
2.8%
3.4% 3.1%
2.8%
7.0%
2.4%
3.1% 2.8% 2.7%
7.9%
2.1%
2.8%
12 or Older 12-17 18-25 26 or Older 18 or Older
Total U.S.
Northeast
Maine
*Illicit Drugs Other Than Marijuana include cocaine (including crack), heroin, hallucinogens, inhalants, or prescription-type psychotherapeutics used non-medically,.
Source: National Survey on Drug Use and Health
Illicit drug use (other than
marijuana) among 18 to 25 year olds was higher in
Maine compared to the Northeast and the U.S.

Illicit drug* use other than marijuana in the past month among 18-25 year olds in Maine: 2009-10 to
2012-13
41
10.90%
9.45% 8.70%
7.86%
2009-10 2010-11 2011-12 2012-13
*Illicit Drugs Other Than Marijuana include cocaine (including crack), heroin, hallucinogens, inhalants, or prescription-type psychotherapeutics used non-medically.
Source: National Survey on Drug Use and Health
Illicit drug use (other
than marijuana) among
18 to 25 year olds has
been declining since
2009-10.
Consumption Summary
• In 2013, 12% of high school students reported misusing Rx drugs in their lifetime.
• Rates of illicit drugs and Rx misuse are higher among younger adults 18 to 25.
• Maine appears to have a higher illicit drug (other than MJ) use rate among 18 to 25 year olds compared to the Northeast and Nation (rates have decreased over the past several years).
42

43
Contributing Factors (e.g. availability, accessibility)
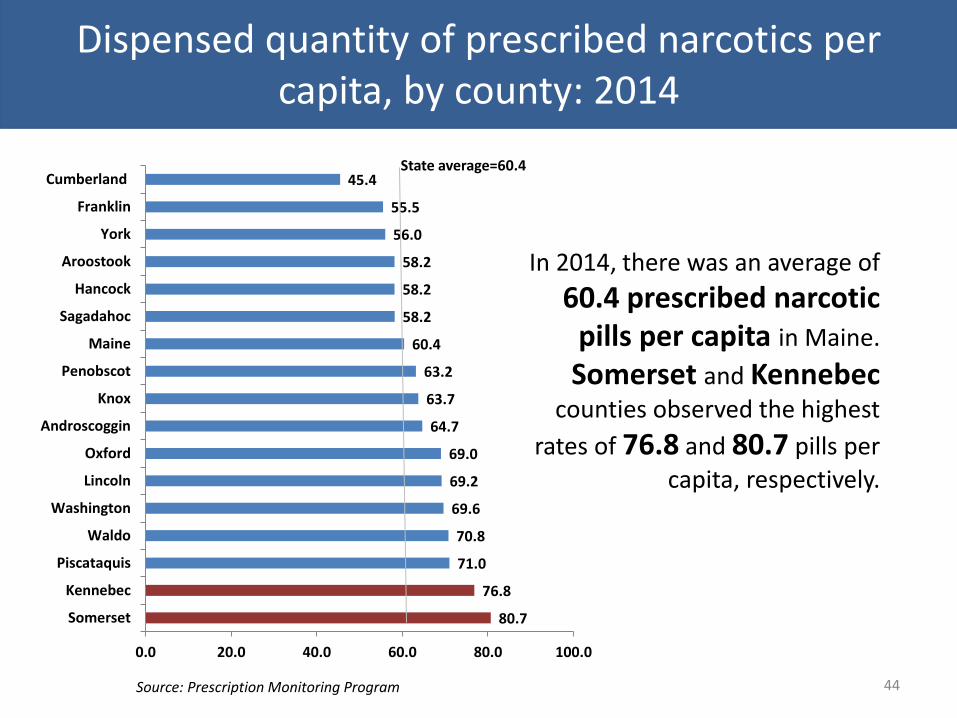
Dispensed quantity of prescribed narcotics per capita, by county: 2014
44
80.7
76.8
71.0
70.8
69.6
69.2
69.0
64.7
63.7
63.2
60.4
58.2
58.2
58.2
56.0
55.5
45.4
0.0 20.0 40.0 60.0 80.0 100.0
Somerset
Kennebec
Piscataquis
Waldo
Washington
Lincoln
Oxford
Androscoggin
Knox
Penobscot
Maine
Sagadahoc
Hancock
Aroostook
York
Franklin
Cumberland
Source: Prescription Monitoring Program
In 2014, there was an average of
60.4 prescribed narcotic pills per capita in Maine.
Somerset and Kennebec counties observed the highest
rates of 76.8 and 80.7 pills per
capita, respectively.
State average=60.4

Dispensed quantity of narcotics per capita, by county: 2010-2014*
45
40.0
50.0
60.0
70.0
80.0
90.0
100.0
2008 2009 2010 2011 2012 2013 2014
Androscoggin Aroostook
Cumberland Franklin
Hancock Kennebec
Knox Lincoln
Oxford Penobscot
Piscataquis Sagadahoc
Somerset Waldo
Washington York
Maine
* The increase observed in 2014 in number of narcotic pills prescribed per capita was due in part to the inclusion of the previously unscheduled drug Tramadol (as of 8/18/2014) as well as the inclusion of data submitted via the Veterans Administration (as of 10/31/2014). 2014 data shown includes only two months of VA data therefore rates are expected to increase in coming years.
Source: Maine Prescription Monitoring Program
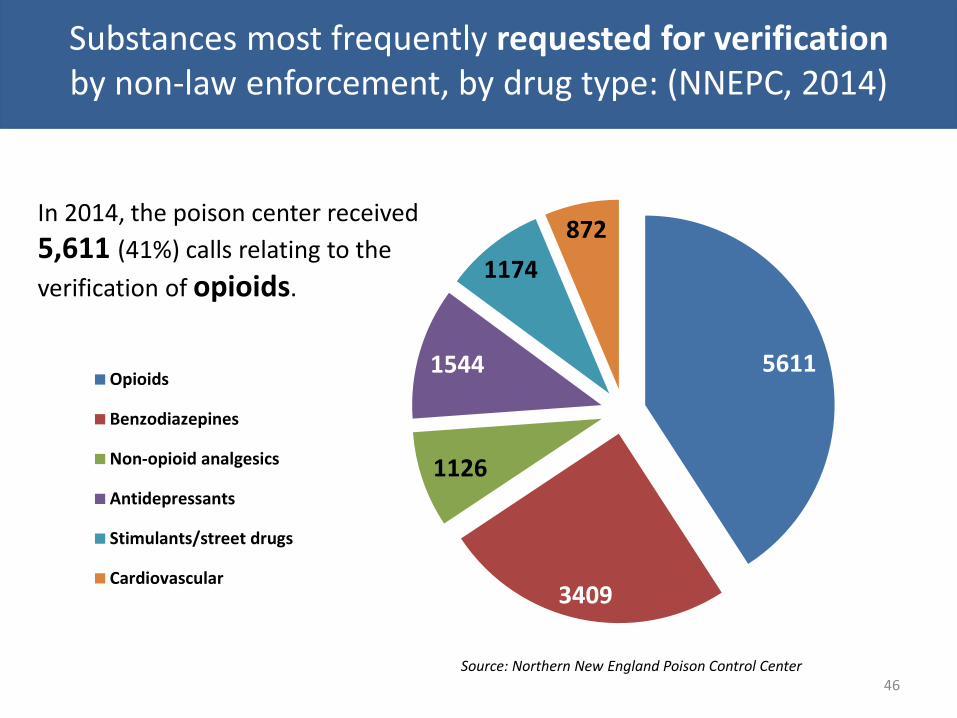
Substances most frequently requested for verification by non-law enforcement, by drug type: (NNEPC, 2014)
46
5611
3409
1126
1544
1174
872
Opioids
Benzodiazepines
Non-opioid analgesics
Antidepressants
Stimulants/street drugs
Cardiovascular
Source: Northern New England Poison Control Center
In 2014, the poison center received
5,611 (41%) calls relating to the
verification of opioids.

Number of poisoning calls related to verification of opioids reported to New England Poison Center (per 10,000 residents),
by county: 2013-14
47
104.38
79.24 77.57
67.28 63.56
56.22 53.01
48.93 48.06 43.10 41.54 39.12 38.57
31.74 30.98 25.01 24.55
Source: Northern New England Poison Center
During 2013-14, Washington county observed
the highest rate of poison center calls relating to
opioid verification with a yearly average of
104.8 calls per 10,000 residents.
State average=48.06
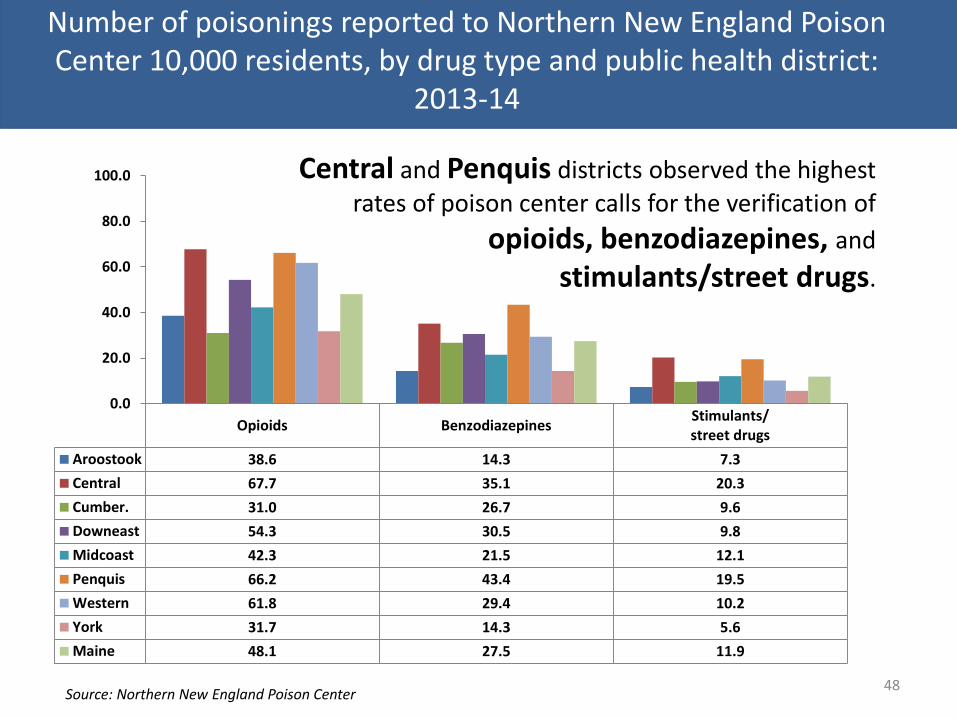
Number of poisonings reported to Northern New England Poison Center 10,000 residents, by drug type and public health district:
2013-14
48
Central and Penquis districts observed the highest
rates of poison center calls for the verification of
opioids, benzodiazepines, and stimulants/street drugs.
Source: Northern New England Poison Center
Opioids BenzodiazepinesStimulants/street drugs
Aroostook 38.6 14.3 7.3
Central 67.7 35.1 20.3
Cumber. 31.0 26.7 9.6
Downeast 54.3 30.5 9.8
Midcoast 42.3 21.5 12.1
Penquis 66.2 43.4 19.5
Western 61.8 29.4 10.2
York 31.7 14.3 5.6
Maine 48.1 27.5 11.9
0.0
20.0
40.0
60.0
80.0
100.0

Parent perception of teen accessibility of prescription drugs at home without parental knowledge: 2015
49
35%
59%
6% 0%
0%
20%
40%
60%
80%
100%
Yes No No medication in house Don't know
Source: Maine Parent Survey administered by Pan Atlantic for the Maine Office of Substance of Abuse and Mental Health Services.
More than one in three (35%) of Maine
parents felt that their teen would be able
to access Rx medications (that were
not prescribed to the child) at home without their parents’ knowledge.

Parent perception of teen accessibility of prescription drugs at home without parental knowledge, by public
health district: 2015
50
30%
38%
43%
33%
30%
34% 33%
41%
35%
Source: Maine Parent Survey
Cumberland and York
reported the highest rates of parents who felt
their teens could access Rx drugs at home.
State average
State average: 35%

U.S. residents aged 12 and older who used pain relievers nonmedically, by point of access: 2012-13
51
53%
11%
21%
4%
11%
Obtained from afriend or relative
Bought from afriend or relative
Prescribed by adoctor
Got from a drugdealer orstranger
Source: National Survey on Drug Use and Health
Of those who reported misusing
pain relievers,
over a half (64%)
obtained them from
a relative or friend.

Contributing Factors Summary
• For the past couple of years, Somerset and Kennebec have observed the highest rates of narcotics prescribed per person.
• 41% of calls to the poison center for purposes of verification were related to opioids; 25% were related to Benzodiazepines.
• Washington, Androscoggin, and Somerset had the highest rates of poison center calls related to the verification of opioids.
• Central and Penquis districts observed the highest rates of poison center calls for the verification of opioids, benzodiazepines, and stimulants/street drugs.
• A third of parents felt their teen could access meds in their home without permission; rates were highest in Cumberland and York.
• The majority of people who misuse pain relievers obtain them from a friend or relative.
52

53
Treatment

Needing but not receiving treatment for illicit drugs, by age group: 2007-08 to 2012-13
54
4.31% 4.12%
3.66% 3.25% 3.12% 3.04%
9.28% 8.97%
8.71%
7.88% 7.91% 7.96%
1.63% 1.72% 1.35%
1.10% 1.33% 1.39%
2007-08 2008-09 2009-10 2010-11 2011-12 2012-13
12-17 years old
18-25 year olds
26+ year olds
NOTE: Needing But Not Receiving Treatment refers to respondents classified as needing treatment for illicit drugs, but not receiving treatment for an illicit problem at a specialty facility (i.e., drug and alcohol rehabilitation facilities [inpatient or outpatient], hospitals [inpatient only], and mental health centers). Criteria is based on Diagnostic and Statistical Manual standards.
In 2012-2013, 8% of 18 to 25 year olds in Maine
are classified as
needing, but not receiving treatment.
Source: National Survey on Drug Use and Health

Average rate (per 10,000 residents) of adult primary treatment admissions, by drug type and county: 2012-14
55
0
10
20
30
40
50
60
70
Alcohol
Synthetic Opioids
Heroin/Morphine
Source: Treatment Data System, 2010-2014
During 2012-14, Maine observed a yearly rate of 31.6
primary admissions due to alcohol per 10,000 residents,
followed by 27.2 admissions per 10,000 residents due to
synthetic opioids, and 15.1 admissions per 10,000
residents due to heroin. Alcohol state average Synthetic opioid state average Heroin state average

Average rate (per 10,000 residents) of adult primary treatment admissions related to heroin/morphine: 2012-14
56
22.1
20.1 19.4
17.2
15.2 15.1
13.5 12.7 12.6 12.4
10.4 9.5
6.9 6.3 6.3
4.3
2.5
In 2012-14, Androscoggin had the highest yearly
rate of primary treatment admissions related to
heroin/morphine.
Source: Treatment Data System, 2010-2014
State average=15.1

Primary admissions (18+) related to heroin/morphine, by public health district and drug type: 2010-2014
57
2010 2011 2012 2013 2014
Aroostook 3% 3% 3% 3% 2%
Central 7% 8% 10% 15% 23%
Cumberland 11% 15% 20% 27% 38%
Downeast 4% 6% 7% 11% 17%
Midcoast 6% 7% 8% 14% 19%
Penquis 7% 8% 9% 13% 22%
Western 9% 9% 10% 12% 20%
York 7% 10% 16% 24% 31%
Maine 7% 9% 11% 17% 24%
0%
10%
20%
30%
40%
50%
The proportions of
primary treatment admission due to
heroin/morphine
have increased substantially since 2010 in most districts.
Source: Treatment Data System, 2010-2014
In 2014,
Cumberland,
York, and Central districts had the highest rates.
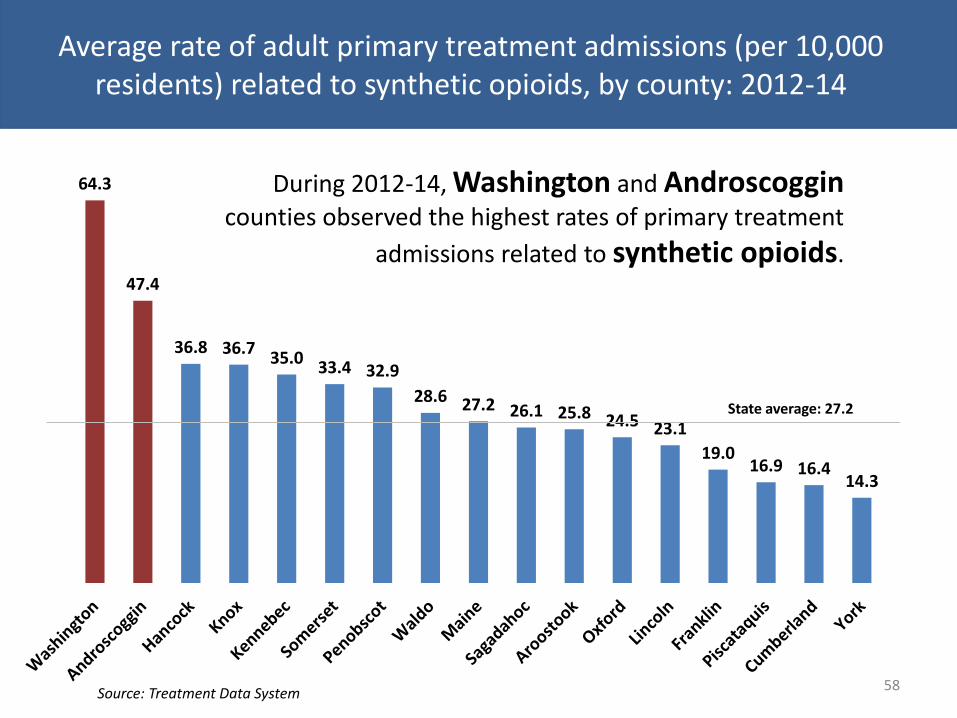
Average rate of adult primary treatment admissions (per 10,000 residents) related to synthetic opioids, by county: 2012-14
58
64.3
47.4
36.8 36.7 35.0
33.4 32.9
28.6 27.2 26.1 25.8 24.5 23.1
19.0 16.9 16.4
14.3
During 2012-14, Washington and Androscoggin counties observed the highest rates of primary treatment
admissions related to synthetic opioids.
Source: Treatment Data System
State average: 27.2
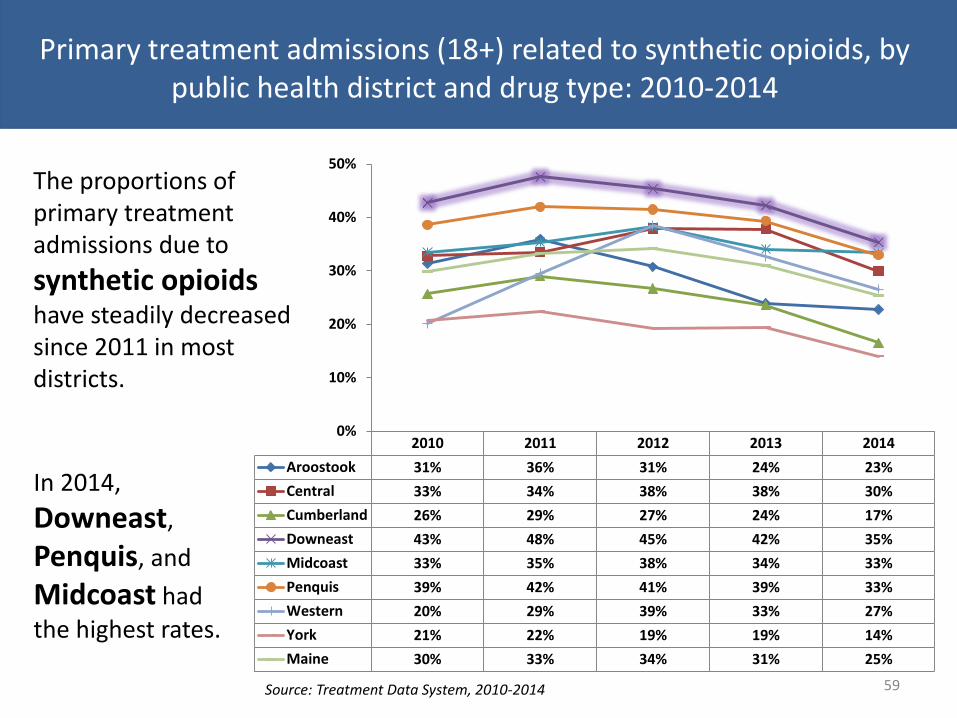
Primary treatment admissions (18+) related to synthetic opioids, by public health district and drug type: 2010-2014
59
2010 2011 2012 2013 2014
Aroostook 31% 36% 31% 24% 23%
Central 33% 34% 38% 38% 30%
Cumberland 26% 29% 27% 24% 17%
Downeast 43% 48% 45% 42% 35%
Midcoast 33% 35% 38% 34% 33%
Penquis 39% 42% 41% 39% 33%
Western 20% 29% 39% 33% 27%
York 21% 22% 19% 19% 14%
Maine 30% 33% 34% 31% 25%
0%
10%
20%
30%
40%
50%
Source: Treatment Data System, 2010-2014
The proportions of primary treatment admissions due to
synthetic opioids have steadily decreased since 2011 in most districts.
In 2014,
Downeast,
Penquis, and
Midcoast had
the highest rates.

Average rate of adult primary treatment admissions (per 10,000 residents) due to methadone/buprenorphine: 2012-14
60
11.9
6.7 6.3 6.0 5.9
5.5 5.0 4.7 4.6 4.3 4.0
3.1 3.1 2.7 2.6 2.6
1.3
During 2012-14, Knox observed the highest rate of primary
treatment admissions due to methadone/buprenorphine
with a yearly average of 11.9 admissions per 10,000 residents per year.
Source: Treatment Data System State average
State average: 4.6

0%
25% 47%
24%
4%
under 18
18-25
26-34
35-49
50 and over
Source: Maine Treatment Data System
Primary heroin/morphine treatment admissions, by age group: 2014
Almost half (47%) of primary admissions for heroin/morphine were among those ages 26 to 34 years. 61
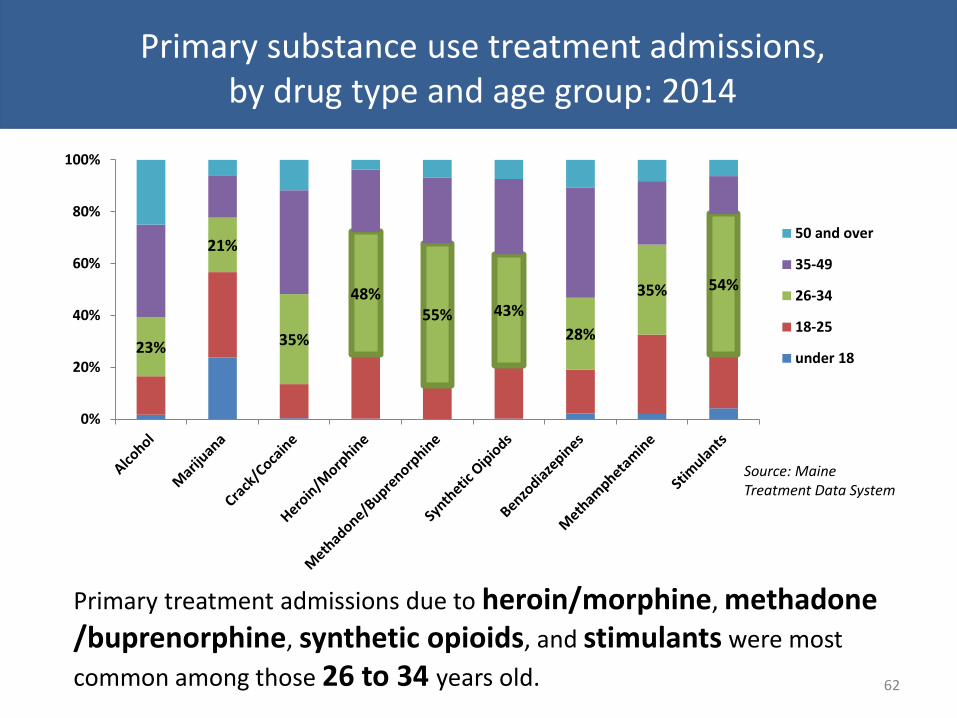
Primary substance use treatment admissions, by drug type and age group: 2014
62
Source: Maine Treatment Data System
Primary treatment admissions due to heroin/morphine, methadone /buprenorphine, synthetic opioids, and stimulants were most
common among those 26 to 34 years old.
23%
21%
35%
48% 55% 43%
28%
35% 54%
0%
20%
40%
60%
80%
100%
50 and over
35-49
26-34
18-25
under 18

Secondary admissions among primary heroin/morphine treatment admissions (adults 18+): 2014
63
7%
14%
17%
4%
36%
5%
17% Alcohol
Marijuana
Cocaine/crack
Methadone/Buprenorphine
Synthetic Oipiods
Other Drugs
None
Of those with a primary admission of heroin/morphine, 36% had a secondary
admission related to synthetic opioids, 17% related to cocaine, and 14% related to marijuana.
Source: Maine Treatment Data System

Secondary admissions for substance use treatment, by primary drug: 2014
64
Heroin/morphine Marijuana Alcohol Cocaine/crack Synthetic opioids
None 17% 32% 61% 15% 22%
Other Drugs 4% 7% 2% 9% 8%
Synthetic Opiods 36% 12% 4% 12% 13%
Methadone/Buprenorphine 4% 2% 1% 3% 7%
Heroin/Morphine 0% 5% 2% 26% 18%
Cocaine/crack 17% 4% 3% 0% 7%
Marijuana 14% 0% 26% 18% 19%
Alcohol 7% 37% 0% 19% 8%
5%
2%
26% 18%
0%
20%
40%
60%
80%
100%
Source: Maine Treatment Data System
Of those with a primary admission of cocaine/crack admissions, 26% had a secondary admission of heroin/morphine.

Treatment Summary
• 8% of 18 to 25 year olds in Maine are perceived as needing, but not receiving treatment (2012-13).
• In 2014, about 1 in 4 (24%) primary treatment admissions were related to Heroin; up from 7% in 2010.
• Androscoggin, Cumberland, York, and Kennebec had the highest rate of adult primary treatment admissions related to heroin.
• Washington and Androscoggin counties observed the highest rates of primary treatment admissions related to synthetic opioids.
• Washington county’s primary admission rate for synthetic opioids was more than twice the statewide rate.
• Knox observed the highest rate of primary treatment admissions due to methadone/buprenorphine.
• Primary treatment admissions due to synthetic opioids and/or heroin/morphine were most common among 26 to 34 year olds.
• Almost half (47%) of primary admissions for heroin/morphine were among those ages 26 to 34 years old.
65

66
Co-occurring Disorders (substance use and mental health)

67
18.2%
23.3%
19.6%
15.2%
6.3%
0.0%
5.0%
10.0%
15.0%
20.0%
25.0%
Any MentalIllness
SeriousMentalIllness
ModerateMentalIllness
MildMentalIlness
No MentalIllness
Substance Dependence or Abuse in past year among U.S. adults (18+), by level of mental illness: 2014
Source: National Survey on Drug Use and Health
18% of adults with any mental illness qualified as being dependent on
substances and/or abusing substances.
Adults with serious mental illness were nearly 4x as likely
to be dependent on and/or abuse substances when
compared to those with NO mental illness

68 Source: National Survey on Drug Use and Health
Past year illicit drug use among U.S. citizens 12 to 17, by past year major depressive episode: 2014
12 to 17 year olds who had a major depressive episode within the past
year were 2x as likely to use illicit
drugs within the past year.
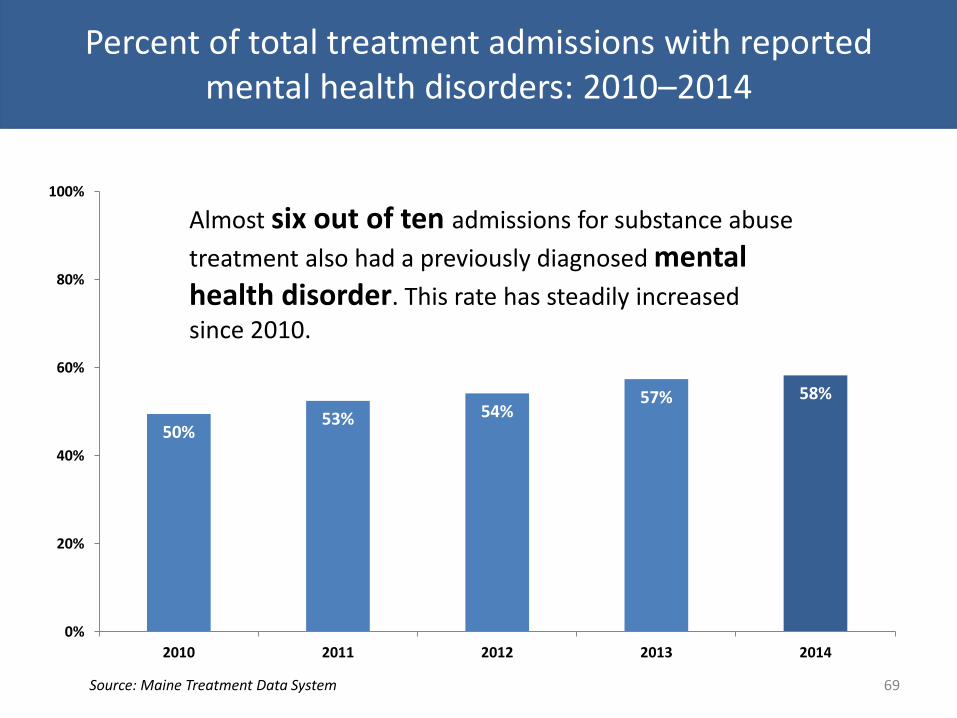
Percent of total treatment admissions with reported mental health disorders: 2010–2014
69
50% 53% 54%
57% 58%
0%
20%
40%
60%
80%
100%
2010 2011 2012 2013 2014
Almost six out of ten admissions for substance abuse
treatment also had a previously diagnosed mental health disorder. This rate has steadily increased
since 2010.
Source: Maine Treatment Data System

Mental health disorders among substance abuse treatment admissions, by primary drug type: 2014
70
79.6% 77.6%
71.0% 66.7%
63.1% 62.0% 61.3% 60.9% 59.8% 56.6%
50.2%
Source: Maine Treatment Data System
Co-occurring mental health disorders were most
common among primary admissions related to
benzodiazepines and stimulants.

Percent of adults served through Maine state mental health agencies (SMHA) who had co-occurring mental health and substance use
disorders: 2007-2014
71
39%
23% 22% 22%
28%
33%
46%
42%
FY 2007 FY 2008 FY 2009 FY 2010 FY 2011 FY 2012 FY 2013 FY 2014
From 2009 to 2013, the percentage of adults served through SMHA
who had a co-occurring mental health and substance use disorder increased by 24 points.
In 2014, almost half (42%) of adults served through
SMHA had a co-occurring mental health and substance use disorder.
Source: Center for Mental Health Services, Uniform Reporting System

Co-occurring Summary
• Adults with any mental illness are three times as likely to abuse and/or qualify as dependent on substances.
• Adolescents experiencing a major depressive episode in the past year were twice as likely to use illicit drugs within the past year.
• Almost 6 out of 10 admissions for substance abuse treatment also had a previously diagnosed mental health disorder; this rate has steadily increased since 2010.
• Co-occurring mental health disorders were most common among primary admissions related to benzodiazepines and stimulants.
• Nearly half of adults served in Maine SMHA’s also had a substance use disorder.
*For a more in depth report on mental health data in Maine please reference the SEOW Report: Mental Health in Maine
72

Appendix A (Data Sources)
• Behavioral Risk Factor Surveillance System (BRFSS)
• Maine Department of Public Safety (DPS), Bureau of Highway Safety (BHS), Maine Department of Transportation (MDOT)
• Maine Department of Public Safety (DPS), Uniform Crime Reports (UCR)
• Maine Drug Enforcement Agency (MDEA)
• Maine Emergency Medical Services (EMS)
• Maine Integrated Youth Health Survey (MIYHS)
• Maine Office of the Chief Medical Examiner
• Marci Sorg, Margaret Chase Smith Policy Center at the University of Maine
• National Survey on Drug Use and Health (NSDUH)
• Northern New England Poison Center (NNEPC)
• Office of Child and Family Services (OCFS), Maine Automated Child Welfare Information System (MACWIS)
• Office of Data, Research and Vital Statistics (ODRVS)
• SAMHS Parent Survey (administered by Pan Atlantic)
• Prescription Monitoring Program (PMP)
• Treatment Data System (TDS)/WITS Substance Abuse Treatment Data System (WITS)
• 2-1-1 Maine
73
*For more information including a source description and source contact information please visit www.maineseow.com

Contact
Timothy Diomede, MPPM SEOW Coordinator/Prevention Data Analyst
[email protected] www.maineseow.com
74