heuristic evaluation. sources of usability criteria organizational goals pre-existing, general:...
Post on 21-Dec-2015
219 views
TRANSCRIPT

Heuristic evaluation
Sources of usability criteria
• Organizational goals• Pre-existing, general: heuristics and
guidelines– Research– Convention– Consensus of experts– Legal requirements (e.g., accessibility)
• Empirical: – User and task analysis– Competitor sites (assumption: their goals apply
to your site, your users, also)
Heuristics
• Defined:– Rules of thumb– “providing aid or direction in the solution of
a problem but otherwise unjustified or incapable of justification” – Webster’s 3rd
• Method:– Find/develop set of criteria– Apply to software/website/etc
• Which are violated• How severe
Heuristic evaluation
• Uses• Methods• Sources of heuristics, criteria
– Existing sets of guidelines, heuristics– Customization for specific applications
• Applying the heuristics• Advantages, disadvantages of
heuristic evaluation

Uses of heuristics and guidelines
• Competitive testing• Design guidance• Evaluation criteria• Summarize lessons learned for future design
guidance
• The process of developing and applying heuristics helps design/evaluation group(s) to define and agree on goals, priorities,evaluation criteria

Heuristic evaluation: Method
• Multiple evaluators• Experts (in heuristic evaluation)• Representative users
• How many?– Nielsen’s rule of thumb: 3 to 5

Nielsen’s basis - # of evaluators

Empirical
• Evaluate for each major kind of use/user
• Keep going until you don’t find much that’s new and critical
Method
• Develop/identify heuristics• [weight by importance]• Apply heuristics
– Individually– Collective debriefing
• Determine severity• Make recommendations for improvement
• Inter-rater reliability: consistency x (similar) raters
Three Sets of Heuristics
• General– Nielsen– Other guidelines– accessibility
• For this kind of application (web, homepages, e-commerce sites…)
• For this specific application

Severity ratings
• e.g., Nielsen: Based on frequency, impact, persistence
• Possible severity rating scale:0 not a problem1 Cosmetic – need not be fixed unless
time available2 Minor – low priority3 Major – high priority4 Catastrophe – fix before release
Nielsen’s heuristics
• Visibility of system status • Match between system and the real world • User control and freedom • Consistency and standards • Error prevention • Recognition rather than recall • Flexibility and efficiency of use • Aesthetic and minimalist design • Help and documentation
Bruce Tognazzini’s principles
• Anticipation• Autonomy• Color Blindness• Consistency• Defaults• Efficiency of the User• Explorable Interfaces• Fitts's Law – size and
distance• Human-Interface
Objects
• Latency Reduction• Learnability• Limit Tradeoffs• Metaphors• Protect the User’s Work• Readability• Track State• Visible Interfaces
Guidelines and checklists• E.g. web guidelines from
http://usability.gov/guidelines/index.html– Design guidelines
• Page length, layout; font; graphics
– Design process guidelines• Set performance and/or preference goals • Create and evaluate prototypes
– Usability guidelines• Content/content organization; navigation;
download time• Accessibility

Web usability: some relevant characteristics of the web
• Uses, users may be hard to define– Multiple and varied users, contexts, technology, and so on– Uncontrolled– Must design for naïve and experienced users
• The web itself as the context of use– Users may be infrequent users who readily move to another
site– User expectations formed by other sites
• Users’ Web-specific concerns– Privacy, security– Users may not know who you are
• Demonstrating credibility

Nielsen’s113 Design Guidelines for Homepages
Determining Homepage Content Vertical Industry Segments Communicating the Site's Purpose Communicating Information About
Your Company Content Writing Revealing Content Through
Examples Archives and Accessing Past Content Links Navigation Search Tools and Task Shortcuts Graphics and Animation Graphic Design UI Widgets
Window Titles URLs News and Press Releases Popup Windows and Staging Pages Advertising Welcomes Communicating Technical Problems
and Handling Emergencies Credits Page Reload and Refresh Customization Gathering Customer Data Fostering Community Dates and Times Stock Quotes and Displaying
Numbers

Nielsen’s Homepage Design Statistics
(what people are used to; what others have found useful)
Download Time Basic Page Layout Page Width Liquid Versus Frozen Layout Page Length
Frames Fundamental Page Design
Elements Logo Search
Navigation Footer Navigation Site Map Routing Pages Splash Pages
Frequent Features Sign In, About Us, Contact Info,
Privacy Policy, Job Openings, Help
Graphics and Multimedia Pictures, ALT Text , Music,
Animation Advertising Typography Body Text and Background Colors Link Formatting
Guidelines based on research about users
http://usability.gov/guidelines/Usability_guidelines.pdf
• Guideline: Design for monitors with a screen resolution of 800 x 600 pixels.
Comments: There is a definite trend in monitor design to go from screen resolutions of 800 x 600 pixels to screen resolutions of 1024 x 768 pixels. Five studies of screen resolutions were reviewed. Two of the studies reported that the largest number of users (53%) were using screen resolutions of 800 x 600 pixels (27% were using 1024 x 768). However, three of the studies reported that the largest number of their users (43%) were using screen resolutions of 1024 x 768 pixels (only 24% were using 800 x 600 pixels). Only about 7% of users are using 640 x 480 pixels, and about 13% are using higher resolutions (1280 x 1024, 1600 x 1200, etc.)
http://usability.gov/guidelines/softhard.html#three
Research II
• Guideline: Design for connection speeds of 56 kilobytes per second (kbps).
Comments: Sixty percent of users use a 56 kbps connection speed or slower. The remaining users have faster connection speeds (ISDN, DSL, Cable, T1, etc.). Actual connection speeds are about 38% lower than modem speed capability. This means that users with a 56 kbps connection actually have a connection averaging about 35 kbps. If you have data indicating that most, if not all, of your users have slower or faster connection speeds than 56K, determine what is appropriate.
http://usability.gov/guidelines/softhard.html#one
Specialized Heuristics: e-Commerce and Order Forms
From http://www.weinschenk.com/tools/online_checklist.asp
• Shows total cost • Shows itemized costs • Shows product names and/or descriptions • Allows the user to change the quantity easily• Provides an option to save an order and complete it later • Provides details on any other charges on the order • Provides details on shipping options and charges • Provides shortcuts for repeat visitors to make transactions faster • Allows users to easily move from the order form to shopping and back again • Provides security information • Provides users with an alternate offline way of ordering• Allows users to view and/or change previous orders • Does not require users to register before a purchase
E-commerce IIhttp://www-3.ibm.com/ibm/easy/eou_ext.nsf/Publish/611
• Customer support: Supporting users before, during, and after a purchase.
• Trust: Establishing trustworthiness. • Product Navigation: Enabling users to browse
products easily. • Product Information: Providing the product
information that users want, need, and expect. • Purchase transaction: Providing easy means for
users to purchase products.
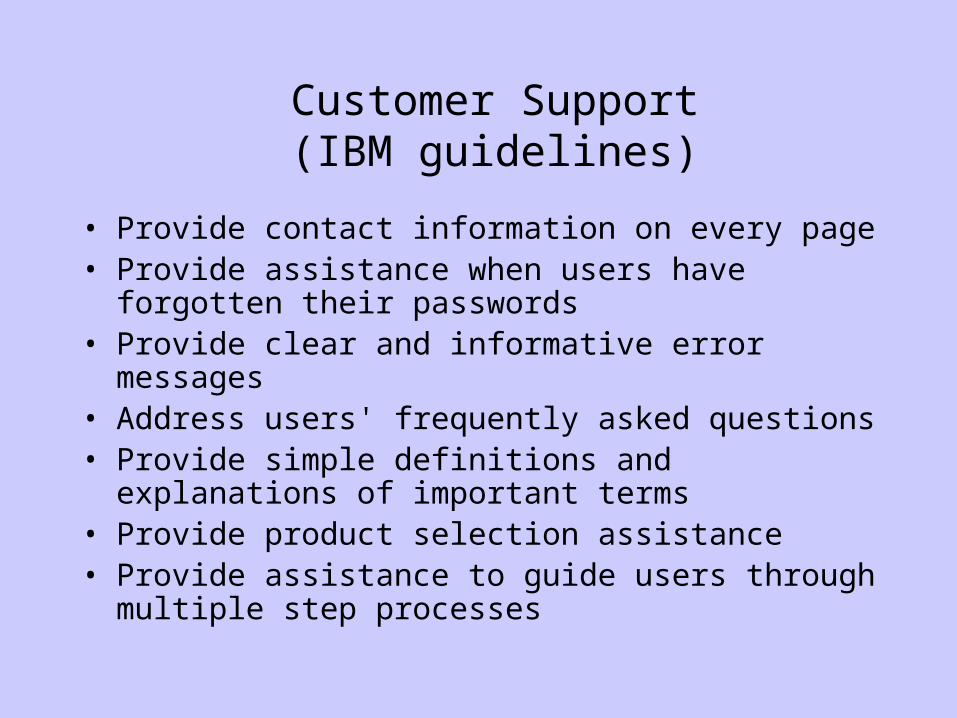
Customer Support(IBM guidelines)
• Provide contact information on every page• Provide assistance when users have forgotten their
passwords• Provide clear and informative error messages• Address users' frequently asked questions• Provide simple definitions and explanations of
important terms• Provide product selection assistance• Provide assistance to guide users through multiple
step processes

Heuristic evaluation: plusses and minuses
• Benefits– Low resource requirements– Usually find many problems fairly quickly– Easy to repeat in iterative design– Easy to communicate– Usually easy to get agreement on a basic set of heuristics– Face validity
• Limits– Can be superficial– Focuses on easily-seen problems; harder to find more subtle problems
associated with in-depth use, repeated use– Can be deceptive – assumption that evaluation has been more complete
and thorough than it has been– How similar to users are experts? How expert are users?– How appropriate are the heuristics to THIS site?– Tends toward a short list of heuristics– Trade-offs among heuristics, the fixes needed?
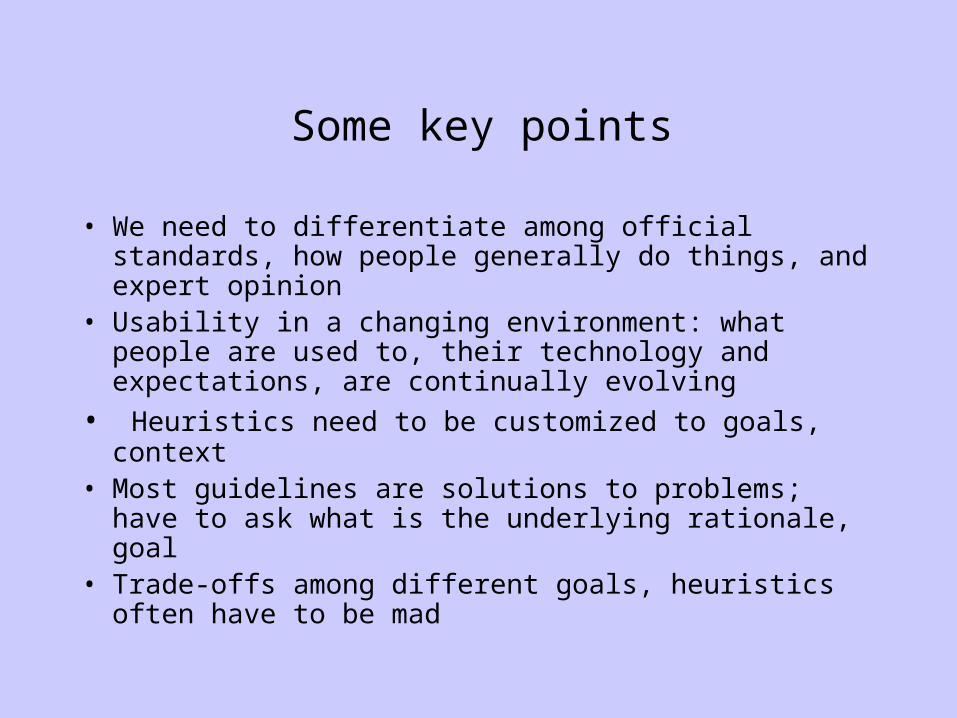
Some key points
• We need to differentiate among official standards, how people generally do things, and expert opinion
• Usability in a changing environment: what people are used to, their technology and expectations, are continually evolving
• Heuristics need to be customized to goals, context
• Most guidelines are solutions to problems; have to ask what is the underlying rationale, goal
• Trade-offs among different goals, heuristics often have to be mad
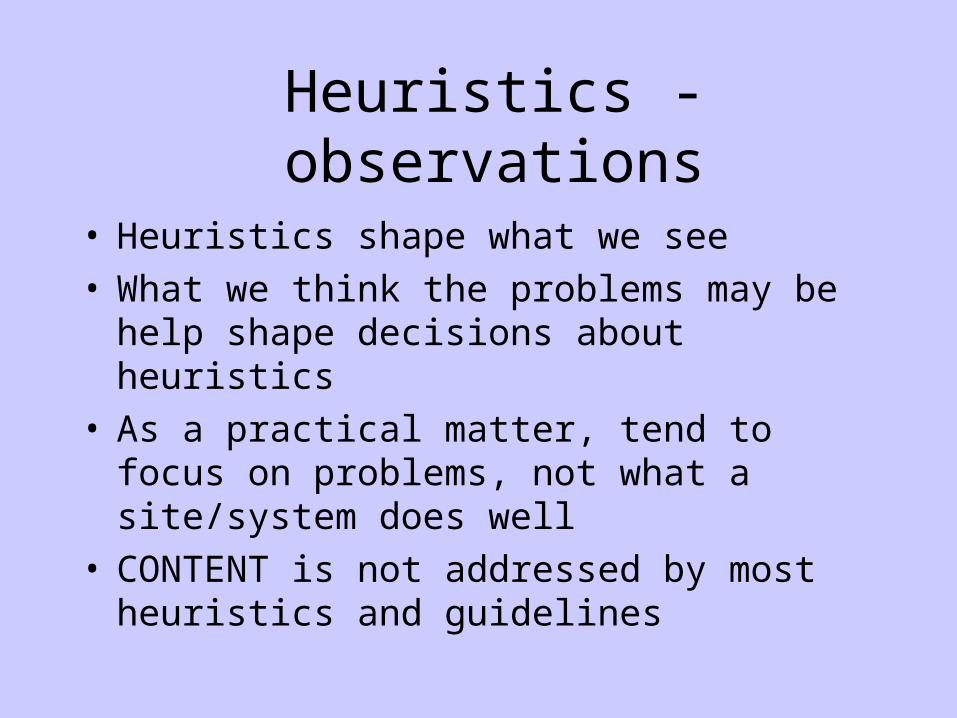
Heuristics - observations
• Heuristics shape what we see• What we think the problems may be
help shape decisions about heuristics• As a practical matter, tend to focus on
problems, not what a site/system does well
• CONTENT is not addressed by most heuristics and guidelines
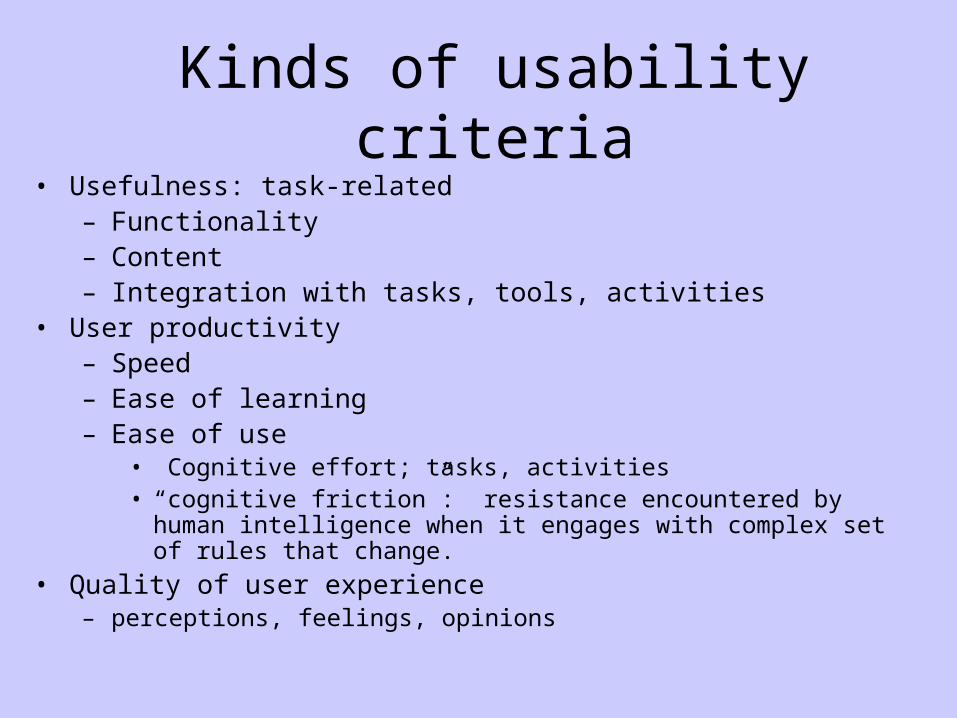
Kinds of usability criteria• Usefulness: task-related
– Functionality– Content– Integration with tasks, tools, activities
• User productivity– Speed – Ease of learning– Ease of use
• Cognitive effort; tasks, activities• “cognitive friction”: resistance encountered by human
intelligence when it engages with complex set of rules that change.
• Quality of user experience– perceptions, feelings, opinions
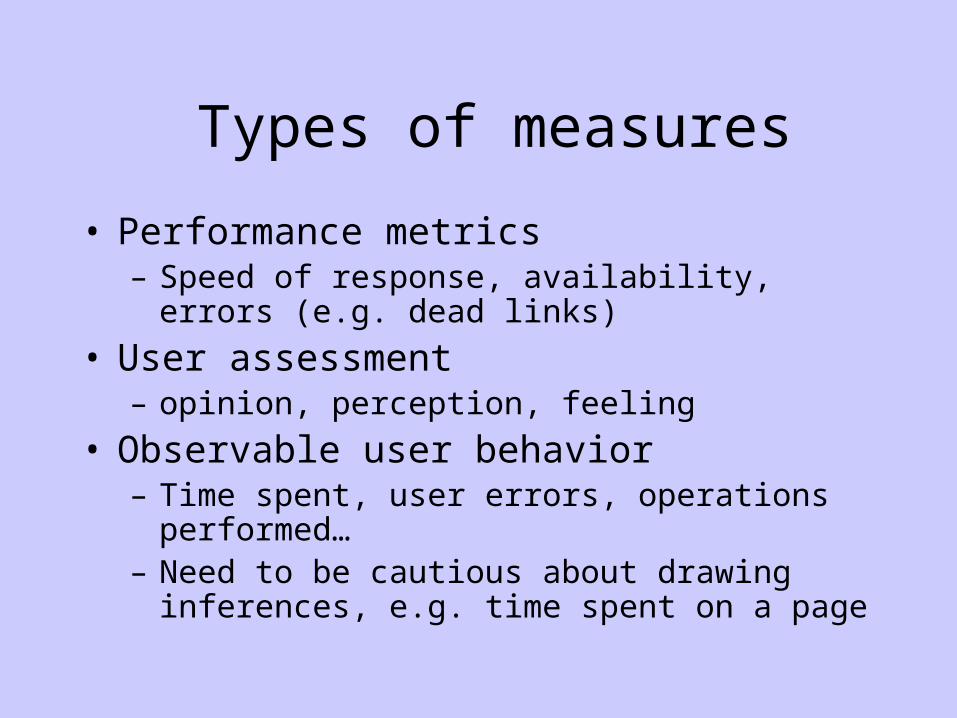
Types of measures
• Performance metrics– Speed of response, availability, errors (e.g.
dead links)
• User assessment– opinion, perception, feeling
• Observable user behavior– Time spent, user errors, operations
performed…– Need to be cautious about drawing
inferences, e.g. time spent on a page
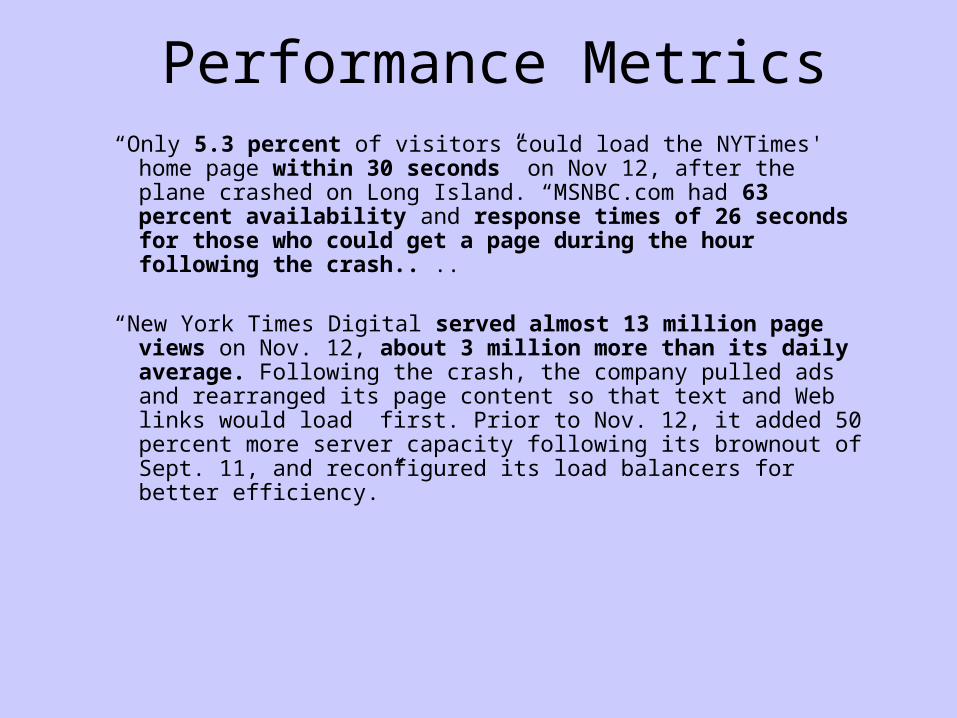
Performance Metrics“Only 5.3 percent of visitors could load the NYTimes' home
page within 30 seconds” on Nov 12, after the plane crashed on Long Island. “MSNBC.com had 63 percent availability and response times of 26 seconds for those who could get a page during the hour following the crash.. ..
“New York Times Digital served almost 13 million page views on Nov. 12, about 3 million more than its daily average. Following the crash, the company pulled ads and rearranged its page content so that text and Web links would load first. Prior to Nov. 12, it added 50 percent more server capacity following its brownout of Sept. 11, and reconfigured its load balancers for better efficiency.”
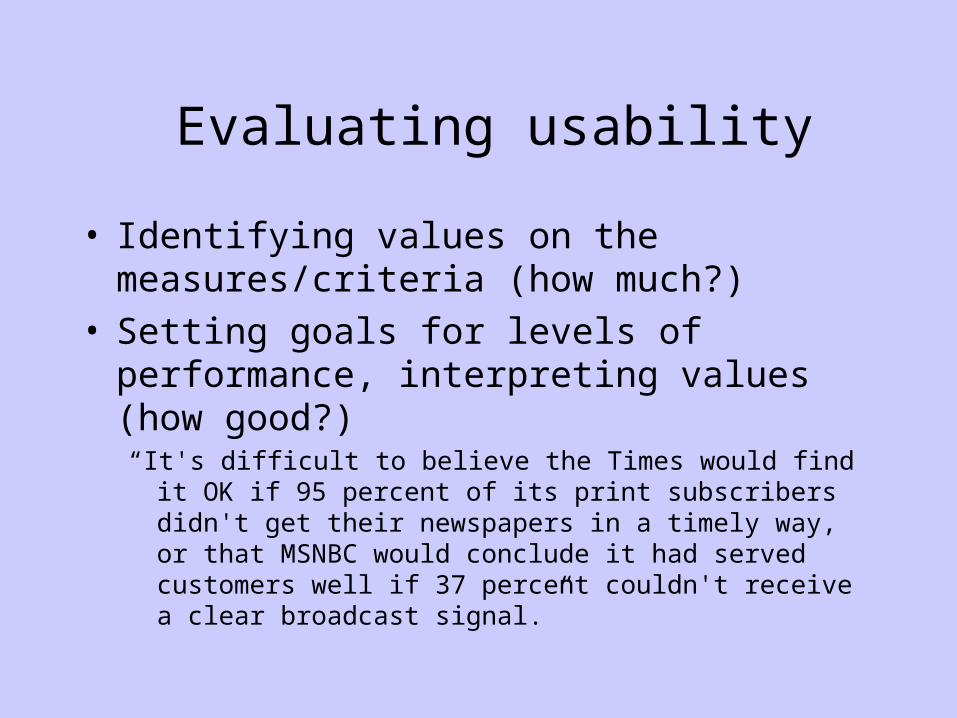
Evaluating usability
• Identifying values on the measures/criteria (how much?)
• Setting goals for levels of performance, interpreting values (how good?)“It's difficult to believe the Times would find it OK if 95
percent of its print subscribers didn't get their newspapers in a timely way, or that MSNBC would conclude it had served customers well if 37 percent couldn't receive a clear broadcast signal.”