hgca harvest report 9 week 11 final - …€¦ · summary harvest progress: harvest 2013 was the...
TRANSCRIPT

0936648
Prepared for: AHDB HGCA
Prepared by:
[email protected] and [email protected]
ADAS UK Ltd ADAS Boxworth Cambridge Date: 30 September 2013
For inclusion on the distribution list contact [email protected]
ADAS Harvest Report 2013 Report 9 – Week 11 of normal harvest window Final Summary Report Note: Harvest reports run up to close of play on Tuesday of each week
Harvest reports produced by ADAS on behalf of HGCA
2
Summary
Harvest progress: Harvest 2013 was the latest and slowest start to harvest in the last five years, but with good weather at the end of August coinciding with peak crop maturity, it finished around normal timing. The cold spring caused developmental delays so harvest started 2 weeks later than normal. Cumulative rainfall during harvest was higher than normal, but most fell before or after peak harvest and caused only minor delays. A period of 10-12 warm and settled days at the end of August allowed rapid progress, with an estimated 1.3M ha, or 30% of total combinable crop area, harvested in a single week, bringing 2013 harvest progress back in line with the 5-year average with most crops harvested by the end of September.
Yields: Winter crop yields were very variable with poor yields from crops affected by the wet autumn and winter, and on light land that suffered moisture stress in July. National average wheat yields are expected to be just below average aided by the sunshine in July and low disease pressure. However, the national average winter oilseed rape yield is estimated to be 15% lower than average due to the high proportion of very poor crops, although many did yield well. Despite the late drilling of many spring crops, they have yielded well with estimated national spring barley yield above the 5 year average, in part due to the higher proportion of crop on heavier soils originally destined for winter crop.
Quality: Quality of the 2013 combinable crops is generally good, with a good supply of milling wheat and malting barley within specification. The absence of harvest delays due to weather is a key factor in the good quality.
Headlines Wheat 99% GB area harvested – Estimated national average yield
7-6-7.7 t/ha. Quality throughout harvest was good with high specific weights (78 kg/hl group 1 and 77 kg/hl group 4), Hagbergs remained above specification for the whole of harvest and protein contents were variable, averaging 12.9%. There are reports of mycotoxin levels over 1,250 ppb in 2% of samples.
Winter barley 100% GB area harvested – Estimated national average yield 6.7-6.9 t/ha. Quality throughout harvest was good with plenty of malting specification samples. Specific weights averaged 67.9 kg/hl, with grain nitrogen levels averaging 1.66%.
Spring barley 99% GB area harvested – Estimated national average yield 5.4-5.6 t/ha. Quality was good with malting specifications met.
Oats 98% GB area harvested – Estimated national average yield 5.6-5.8 t/ha. Specific weights averaged 52 kg/hl.
Oilseed rape 100% (winter) and 90% (spring) GB area harvested – Estimated national average yield 2.3-3.3 t/ha. Typical oil contents ranged from 42-46%.

3
Weather
The weather during the harvest period was generally good, and there were no significant or widespread harvest delays, despite some rainfall. Cumulative rainfall was on average 20% higher than normal due to high rainfall at the end of July and early August (when few crops were ready for harvest) and mid-September (when bulk of harvest was complete), but there were periods of settled weather that allowed good progress (Figure 1). Of the 9 week harvest period from 24 July, only 3 weeks had rainfall that was significantly above normal. For the five week period between 7 August and 9 September the weather was largely dry and settled giving plenty of harvesting opportunities to farmers in both the north and south of the country. The main harvest window was between late August and early September with low rainfall during this period (average 0.4mm).
Average air temperatures were 1-2 degrees above normal throughout the whole of the harvest period, with the exception of the wet week in mid-September, when temperatures dropped slightly below normal.
Figure 1 Average weekly harvest rainfall 2013: This shows the two starting points of harvest for winter barley (early August) and wheat (early September).
Pre-harvest (3-23 July) - The run up to harvest was particularly dry, with an average rainfall of less than 10mm across the country (29% of normal) for the three week period. The dry weather was accompanied by warm temperatures and sunny conditions that boosted incident radiation and aided grainfill. However, the dry and hot weather caused some visual symptoms of moisture stress particularly on lighter soils and crops with poor root systems. The dry soils meant that there was capacity to absorb any rain during the harvest period without waterlogging (unlike 2012 when soils were very wet prior to harvest).

4
Start of winter barley and winter oilseed rape harvest (24 July – 6 August) - The first crops were harvested in mid-July, but most crops were only ready at the end of the month which coincided with a change in the weather to more unsettled conditions. Over the two week period, rainfall was over 200% of normal, but this did not affect harvest progress as crops remained slow to mature, with the bulk of activity in the southern counties.
Start of wheat harvest (7-13 August) - The second week of August was dry, with an average rainfall of 2.8 mm. Harvest progress was limited by crop ripeness rather than weather.
Mid-August (14-27 August) - Conditions became slightly more unsettled with occasional heavy rain showers. However, the heavier rain occurred predominantly in the North and West where there were few crops ready to harvest, so the impacts on harvest progress were limited. Rainfall over the two week period ranged from 16 mm in the south east to 52 mm in the north west. Conditions turned drier towards the end of this period, with 3-4 dry days at the end of the week coinciding with increased ripeness of crops. This allowed harvest rate to start to increase.
Peak of harvest (28 August – 3 September) - The dry weather that finished the previous week lasted right through into early September giving a period of almost 12 days (stretched across 3 of our weather weeks) of warm dry weather, allowing long hours of harvest to occur late into the night. Many farms in the south completed their harvest during this period, whilst those in the north made significant progress on their main crops.
Early-September (4-17 September) - The mainly dry, settled conditions in early September started to become more unsettled as September progressed, with occasional patchy showers affecting most regions. By mid-month, a band of heavy rain passed across the country, with the South East and South West particularly affected. With most crops in these regions already harvested there was limited impact on harvest progress.
Late September (18-30 September) - A period of more settled weather in the latter part of September allowed the completion of harvest for farmers with remaining crops.
Harvest progress overview
Harvest 2013 started late, with slow early progress, but good weather in late August coincided with peak crop maturity and led to a record weekly clearance rate, bringing the end of harvest in line with the 5 year average. Figure 2 shows weekly combinable crop harvest progress over the 2013 harvest period by the crop.
A - In 2013, the delayed development of winter crops meant that the start of harvest was delayed by at least two weeks with the first crops of winter barley and occasional crops of winter oilseed rape, harvested from mid-July, but only starting in earnest in the last week of July.
B - Winter crops were very slow to ripen, so the slightly unsettled weather in early August did not have a major impact on harvesting progress. Wheat and spring barley harvest started in mid-August, although, again, crops were slow to mature, so progress was limited by available ripe crops. Harvest progress remained well behind the five year average and behind most recent years.
5
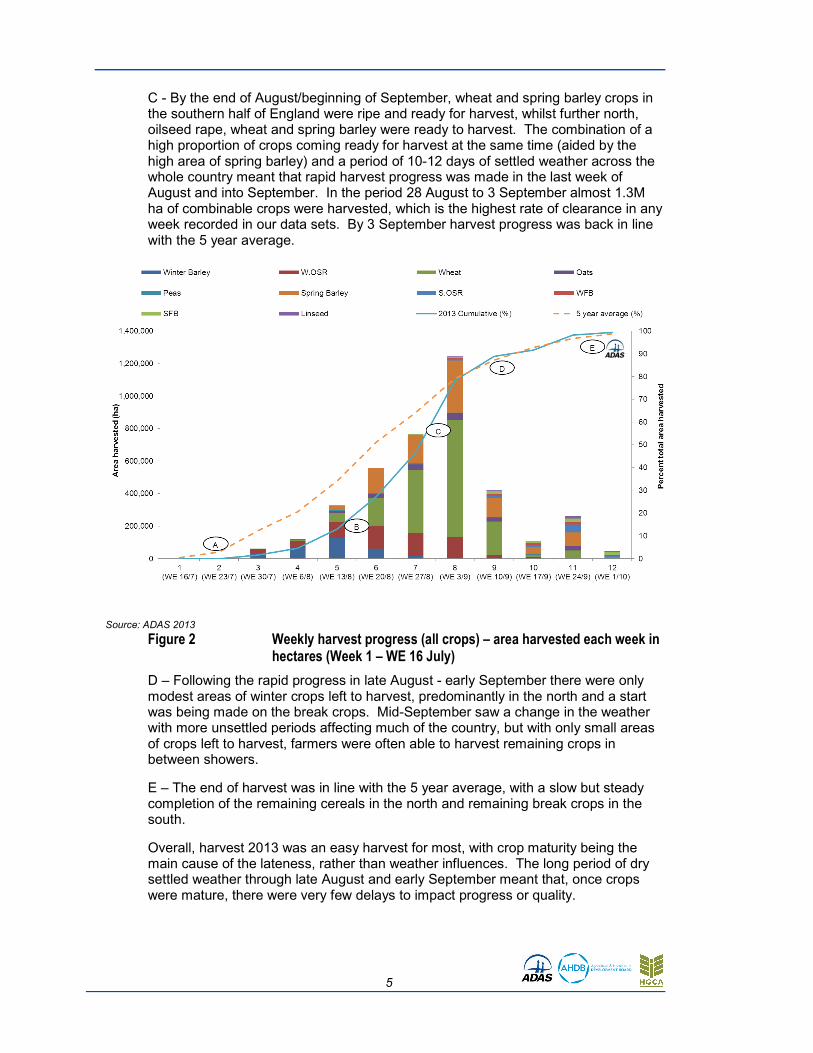
C - By the end of August/beginning of September, wheat and spring barley crops in the southern half of England were ripe and ready for harvest, whilst further north, oilseed rape, wheat and spring barley were ready to harvest. The combination of a high proportion of crops coming ready for harvest at the same time (aided by the high area of spring barley) and a period of 10-12 days of settled weather across the whole country meant that rapid harvest progress was made in the last week of August and into September. In the period 28 August to 3 September almost 1.3M ha of combinable crops were harvested, which is the highest rate of clearance in any week recorded in our data sets. By 3 September harvest progress was back in line with the 5 year average.
Source: ADAS 2013 Figure 2 Weekly harvest progress (all crops) – area harvested each week in
hectares (Week 1 – WE 16 July)
D – Following the rapid progress in late August - early September there were only modest areas of winter crops left to harvest, predominantly in the north and a start was being made on the break crops. Mid-September saw a change in the weather with more unsettled periods affecting much of the country, but with only small areas of crops left to harvest, farmers were often able to harvest remaining crops in between showers.
E – The end of harvest was in line with the 5 year average, with a slow but steady completion of the remaining cereals in the north and remaining break crops in the south.
Overall, harvest 2013 was an easy harvest for most, with crop maturity being the main cause of the lateness, rather than weather influences. The long period of dry settled weather through late August and early September meant that, once crops were mature, there were very few delays to impact progress or quality.

6
Harvest yield, quality and progress summary
Winter wheat
Area harvested to date 99 % GB area
Estimated average UK yield to date 7.6-7.7 t/ha
Yield range 2.5-13.0 t/ha
UK 5 year average yield 7.7 t/ha
Quality - national average – group 1
SpWt 78.1 kg/hl
Hagberg falling number 347 secs
Protein 12.9 %
Moisture at harvest 16 %
Yield
Overall, it is estimated that the national yield will be just slightly down on the 5-year average, at 7.6-7.7 t/ha. In many regions, yields were judged to be close to farm averages, with exceptions in the South West and Yorkshire where yields were 5-10% better than average and the East Midlands, West Midlands and Scotland where yields were 5-10% lower than average. An estimated 15% of the wheat area was badly affected by the poor weather and there is some uncertainty over yield reports from affected fields.
Crops that were established early on well drained soils performed particularly well with some very high yields, but there are some poor yields from later drilled crops that suffered from poor plant populations, poor rooting and weed problems. Reported field yields ranged from 2.5 t/ha to 13.0 t/ha.
Spring wheat yields where good this season, with yields of 4.5-9.3 t/ha recorded, averaging about 6.4-6.8 t/ha. Red wheat crops have yielded less at 3.7-4.0 t/ha. The higher proportion of spring wheat this season will be a factor in the lower average wheat yield.
Quality
The AHDB/HGCA provisional quality report1 for wheat based on 17,720 samples of grain analysed up to 6 September gives the best quality data available at present. The results from this survey are given in Table 1.
• Specific weights are much higher than in 2012. In 2013, specific weights for group 1 wheats averaged 78.2 kg/hl compared to 71.6 kg/hl in 2012. On group 4 wheats the specific weights averaged 76.9 kg/hl. Across all varieties the survey reports a range of 71.3-83.9 kg/hl. In the last week we have had reports of occasional crops of poor second wheats with specific weights down to less than 66 kg/hl.
1 http://www.hgca.com/document.aspx?fn=load&media_id=9063&publicationId=100

7
• Hagberg falling numbers for all groups of milling wheat are good, with the group 1 milling wheats averaging 347 seconds, whilst the group 3 wheats are still a respectable 298 seconds. This is significantly better than during last year’s wet harvest and is well above the 5-year average for each group. Across all varieties the survey reports a range of 220-443 seconds. Hagberg falling numbers were maintained throughout harvest.
• Protein content is lower than for last year at 12.9% for group 1, vs 13.2% in 2012. Across all samples, the HGCA survey reports variations of 10.0-14.7%. This is the most variable quality parameter this season. Gallant averaged 12.8%, Solstice performed better, averaging 13.0%, Crusoe averaged 13.1%.
Table 1 Summary of AHDB/HGCA Wheat Quality Survey data
provisional
Group 1 - Milling Wheat 2009 2010 2011 2012 2013
Specific weight Kg/hl 77.8 77.9 79.8 70.7 78.2
Hagberg falling number Sec 288 307 308 245 347
Protein % 12.7 12.9 13.0 13.3 12.9
Group 2 - Wheat 2009 2010 2011 2012 2013
Specific weight Kg/hl 77.3 78.0 79.4 71.3 78.9
Hagberg falling number Sec 303 306 304 276 352
Protein % 12.0 12.3 12.6 13.0 12.5
Group 3 2009 2010 2011 2012 2013
Specific weight Kg/hl 76.3 76.2 78.4 68.9 76.7
Hagberg falling number Sec 240 244 246 225 298
Protein % 10.9 11.3 11.5 12.4 11.6
Group 4 2009 2010 2011 2012 2013
Specific weight Kg/hl 76.4 76.0 77.7 69.0 76.9
Hagberg falling number Sec 235 223 230 221 310
Protein % 10.8 11.0 11.1 11.9 11.5
• Screenings – There are occasional reports of late harvested second wheat crops having high levels of screenings. This is potentially where there has been late secondary tillering in thin crops or where crops were put under water stress in July, both of which prevented grains from reaching full size. Occasionally, the 4% screening limit has been exceeded, resulting in occasional milling samples being downgraded to feed wheat. This problem is not wide spread.
• Mycotoxin – AIC and NABIM are both reporting that approximately 2% of samples received have been above 1,250 ppb and 3-4% of samples are above 1,000 ppb.
Progress
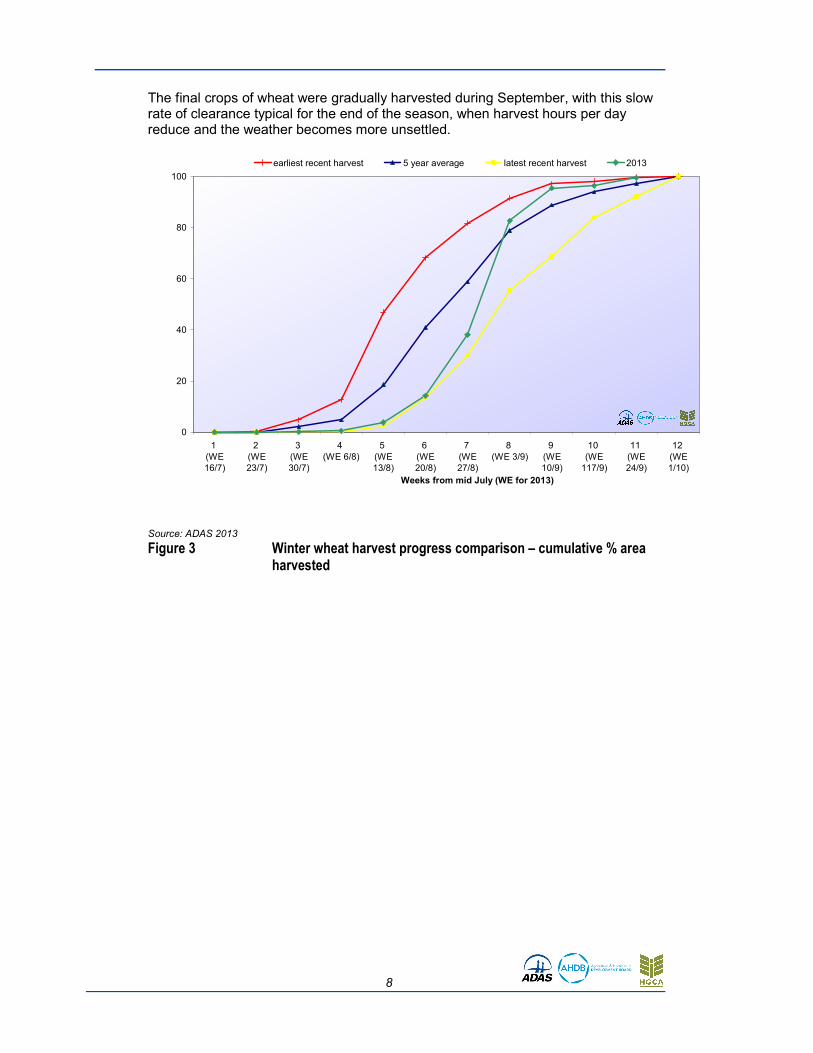
Harvest of winter wheat was late starting in 2013, with the first crops harvested in early August. There was slow early progress due to delayed maturity, but the rate of harvest increased during August, with very rapid clearance in week 7 in late August. The first crops in the north and later crops in the south were ready for harvest and the weather was perfect, with just over 40% of the area harvested in the period 28 August to 3 September. This rapid rate of clearance brought wheat harvest in line with many recent harvests and well ahead of the wet harvests of 2012 and 2008.
8
The final crops of wheat were gradually harvested during September, with this slow rate of clearance typical for the end of the season, when harvest hours per day reduce and the weather becomes more unsettled.
0
20
40
60
80
100
1
(WE
16/7)
2
(WE
23/7)
3
(WE
30/7)
4
(WE 6/8)
5
(WE
13/8)
6
(WE
20/8)
7
(WE
27/8)
8
(WE 3/9)
9
(WE
10/9)
10
(WE
117/9)
11
(WE
24/9)
12
(WE
1/10)
Weeks from mid July (WE for 2013)
earliest recent harvest 5 year average latest recent harvest 2013
Source: ADAS 2013
Figure 3 Winter wheat harvest progress comparison – cumulative % area harvested
9
Winter barley
Area harvested to date 100 % GB area
Estimated average UK yield to date 6.7-6.9 t/ha
Yield range 4.6-11.9 t/ha
UK 5 year average yield 6.4 t/ha
Quality - national average
SpWt 67.6 kg/hl
Grain N 1.7 %
Screenings 2 %
Moisture at harvest 13.6 %
Yield
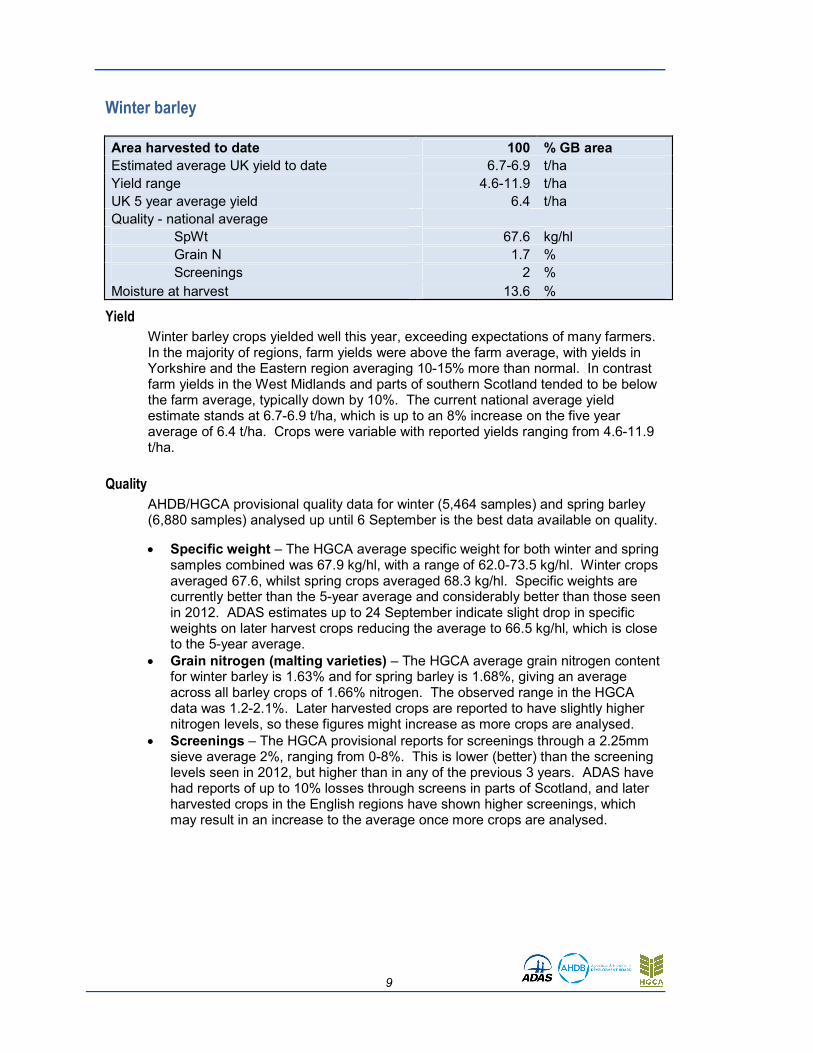
Winter barley crops yielded well this year, exceeding expectations of many farmers. In the majority of regions, farm yields were above the farm average, with yields in Yorkshire and the Eastern region averaging 10-15% more than normal. In contrast farm yields in the West Midlands and parts of southern Scotland tended to be below the farm average, typically down by 10%. The current national average yield estimate stands at 6.7-6.9 t/ha, which is up to an 8% increase on the five year average of 6.4 t/ha. Crops were variable with reported yields ranging from 4.6-11.9 t/ha.
Quality
AHDB/HGCA provisional quality data for winter (5,464 samples) and spring barley (6,880 samples) analysed up until 6 September is the best data available on quality.
• Specific weight – The HGCA average specific weight for both winter and spring samples combined was 67.9 kg/hl, with a range of 62.0-73.5 kg/hl. Winter crops averaged 67.6, whilst spring crops averaged 68.3 kg/hl. Specific weights are currently better than the 5-year average and considerably better than those seen in 2012. ADAS estimates up to 24 September indicate slight drop in specific weights on later harvest crops reducing the average to 66.5 kg/hl, which is close to the 5-year average.
• Grain nitrogen (malting varieties) – The HGCA average grain nitrogen content for winter barley is 1.63% and for spring barley is 1.68%, giving an average across all barley crops of 1.66% nitrogen. The observed range in the HGCA data was 1.2-2.1%. Later harvested crops are reported to have slightly higher nitrogen levels, so these figures might increase as more crops are analysed.
• Screenings – The HGCA provisional reports for screenings through a 2.25mm sieve average 2%, ranging from 0-8%. This is lower (better) than the screening levels seen in 2012, but higher than in any of the previous 3 years. ADAS have had reports of up to 10% losses through screens in parts of Scotland, and later harvested crops in the English regions have shown higher screenings, which may result in an increase to the average once more crops are analysed.

10
Table 2 Summary of AHDB HGCA Barley Quality Survey data
Barley total 2009 2010 2011 2012 2013 - provisional
Specific weight kg/hl 66.3 67 66.4 62.9 67.9
Nitrogen % 1.61 1.64 1.71 1.60 1.66
Screenings (2.25mm) % 1.5 1.9 1.4 3.6 2.0
Progress
Harvest of winter barley started in mid-July, but only got underway in earnest in the last week of July, 2-3 weeks later than normal (Figure 4). Progress in the first two weeks of harvest 24 July to 6 August was slow, especially when compared to the last five years where rapid early clearance was common. The late harvest and slow early progress was due to crop maturity, rather than weather delays. By the 13 August, more crops were ready for harvest and the rate of clearance increased significantly with an estimated 40% of the area harvested in the period 7-13 August. Once started, rate of harvest was similar to previous years, but overall harvest progress remained behind that seen in any of the last 5 years, with harvest not complete until 27 August. In the earliest recent harvest, winter barley harvest was complete by the 13 August.
0
20
40
60
80
100
0
(WE 9/7)
1
(WE 16/7)
2
(WE 23/7)
3
(WE 30/07)
4
(WE 6/8)
5
(WE 13/8)
6
(WE 20/8)
7
(WE 27/8)
8
(WE 3/9)
9
(WE 10/9)
Weeks from mid July (WE for 2013)
earliest recent harvest 5 year average latest recent harvest 2013
Source: ADAS 2013
Figure 4 Winter barley harvest progress comparison – cumulative % area harvested

11
Spring barley
Area harvested to date 99 % GB area
Estimated average UK yield to date 5.4-5.6 t/ha
Yield range 4.3-9.9 t/ha
UK 5 year average yield 5.3 t/ha
Quality - national average
SpWt 66 kg/hl
Grain N 1.6 %
Screenings 3.5 %
Moisture at harvest 16 %
Yield
The season national yield estimate is 5.4-5.6 t/ha (compared to the 5-year average of 5.3 t/ha). Spring barley in all regions performed better than average. Some of the best yields were in Yorkshire and the South West, where some yields were 20% up on the farm average. In the English regions field yields ranged from 4.7-9.9 t/ha. In Scotland yields ranged from 4.3-8.6 t/ha. The higher than average yields may, in part, be due to the increased area of crop grown on heavier soils originally intended for winter wheat.
Quality – See winter barley
Progress
Harvest of spring barley started in England in the period 7-13 August, although early progress was limited. Over the next two weeks, steady progress was made in the southern English regions to bring the area harvested up to 50% of the English and Welsh area. Spring barley crops were planted over a wide window from February through until late May and as a result the crops ripened over a period of weeks. By the end of August crops were ripe in both the north and south of England and as a result 35% of the area was harvested in the period 28 August to 3 September, bringing the English and Welsh harvest near to completion.
The early part of harvest in the English regions was in line with the latest recent harvest, but the rapid clearance midway through the harvest window brought the end of harvest more in with the 5 year average (Figure 5). It should be noted that the figures presented are percentage of total area, and in 2013 there was a lot more spring barley to harvest than in recent years.
In Scotland, spring barley harvest started in the period 14-20 August, which is in line with three of the last five harvests (Figure 6). Slow, but steady, progress was made through until the end of August. Good weather and an increase in the availability of ripe crops lead to rapid progress being made in the period 28 August to 3 September with 30% of the area harvested. This brought harvest progress in line with the 5-year average. Steady progress, throughout the remainder of September, resulted in spring barley harvest being complete by 24 September, one of the earliest completions in the last 5 years.

12
0
20
40
60
80
100
1
(WE
16/7)
2
(WE
23/7)
3
(WE
30/07)
4
(WE 6/8)
5
(WE
13/8)
6
(WE
20/8)
7
(WE
27/8)
8
(WE 3/9)
9
(WE
10/9)
10
(WE
17/9)
11
(WE
24/9)
12
(WE
1/10)
Weeks from mid July (WE for 2013)
earliest recent harvest 5 year average latest recent harvest 2013
Source: ADAS 2013
Figure 5 Spring barley harvest progress comparison England & Wales – cumulative % area harvested
0
20
40
60
80
100
1
(WE
16/7)
2
(WE
23/7)
3
(WE
30/07)
4
(WE 6/8)
5
(WE
13/8)
6
(WE
20/8)
7
(WE
27/8)
8
(WE 3/9)
9
(WE
10/9)
10
(WE
17/9)
11
(WE
24/9)
12
(WE
1/10)
Weeks from mid July (WE for 2013)
earliest recent harvest 5 year average latest recent harvest 2013
Source: ADAS 2013
Figure 6 Spring barley harvest progress comparison Scotland – cumulative % area harvested
13
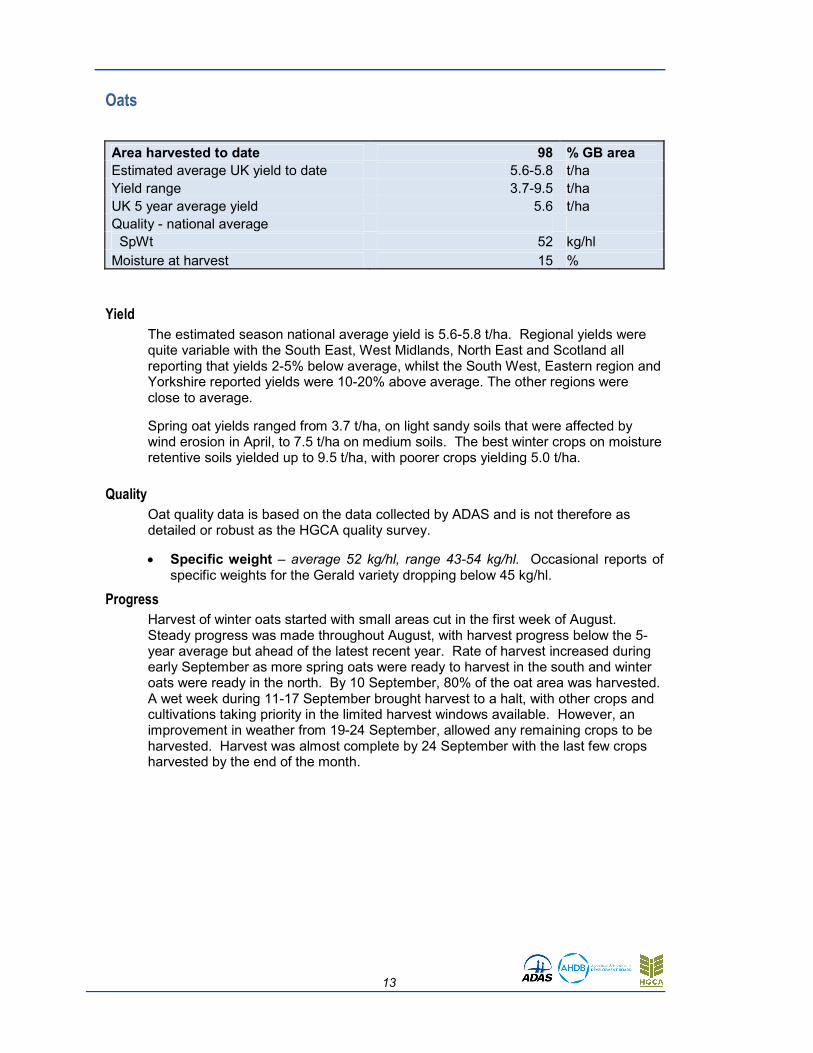
Oats
Area harvested to date 98 % GB area
Estimated average UK yield to date 5.6-5.8 t/ha
Yield range 3.7-9.5 t/ha
UK 5 year average yield 5.6 t/ha
Quality - national average
SpWt 52 kg/hl
Moisture at harvest 15 %
Yield
The estimated season national average yield is 5.6-5.8 t/ha. Regional yields were quite variable with the South East, West Midlands, North East and Scotland all reporting that yields 2-5% below average, whilst the South West, Eastern region and Yorkshire reported yields were 10-20% above average. The other regions were close to average.
Spring oat yields ranged from 3.7 t/ha, on light sandy soils that were affected by wind erosion in April, to 7.5 t/ha on medium soils. The best winter crops on moisture retentive soils yielded up to 9.5 t/ha, with poorer crops yielding 5.0 t/ha.
Quality
Oat quality data is based on the data collected by ADAS and is not therefore as detailed or robust as the HGCA quality survey.
• Specific weight – average 52 kg/hl, range 43-54 kg/hl. Occasional reports of specific weights for the Gerald variety dropping below 45 kg/hl.
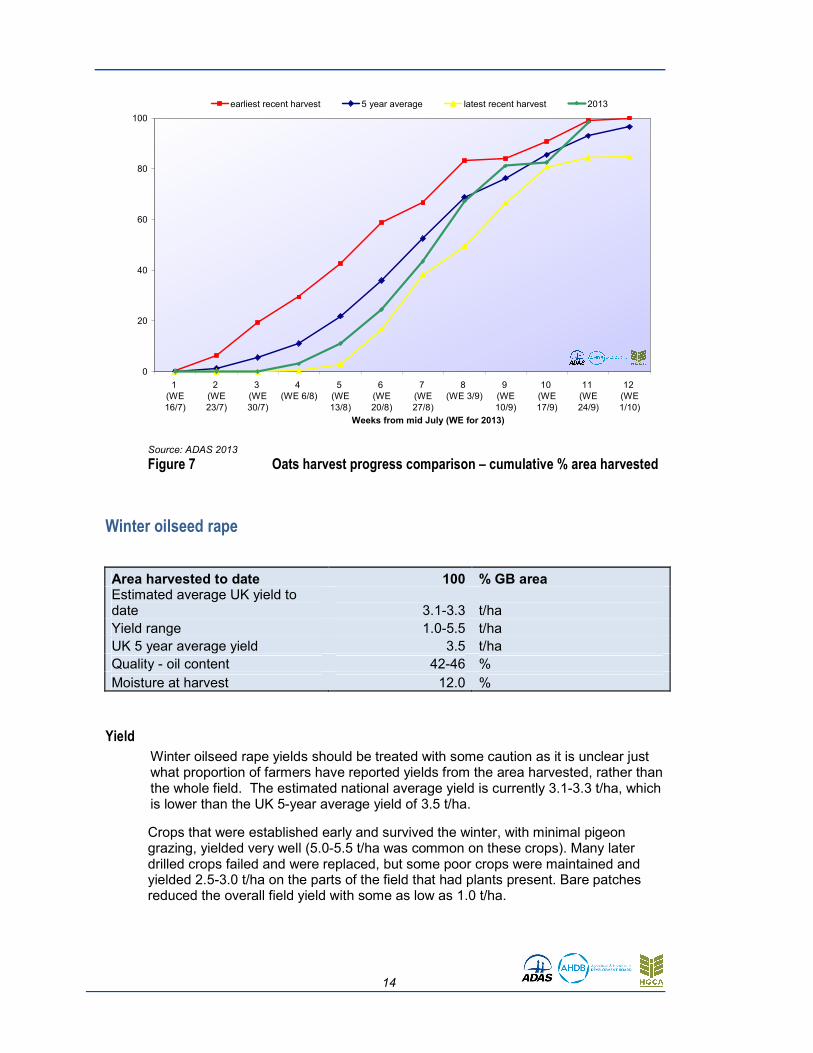
Progress
Harvest of winter oats started with small areas cut in the first week of August. Steady progress was made throughout August, with harvest progress below the 5-year average but ahead of the latest recent year. Rate of harvest increased during early September as more spring oats were ready to harvest in the south and winter oats were ready in the north. By 10 September, 80% of the oat area was harvested. A wet week during 11-17 September brought harvest to a halt, with other crops and cultivations taking priority in the limited harvest windows available. However, an improvement in weather from 19-24 September, allowed any remaining crops to be harvested. Harvest was almost complete by 24 September with the last few crops harvested by the end of the month.
14
0
20
40
60
80
100
1
(WE
16/7)
2
(WE
23/7)
3
(WE
30/7)
4
(WE 6/8)
5
(WE
13/8)
6
(WE
20/8)
7
(WE
27/8)
8
(WE 3/9)
9
(WE
10/9)
10
(WE
17/9)
11
(WE
24/9)
12
(WE
1/10)
Weeks from mid July (WE for 2013)
earliest recent harvest 5 year average latest recent harvest 2013
Source: ADAS 2013
Figure 7 Oats harvest progress comparison – cumulative % area harvested
Winter oilseed rape
Area harvested to date 100 % GB area Estimated average UK yield to date 3.1-3.3 t/ha
Yield range 1.0-5.5 t/ha
UK 5 year average yield 3.5 t/ha
Quality - oil content 42-46 %
Moisture at harvest 12.0 %
Yield
Winter oilseed rape yields should be treated with some caution as it is unclear just what proportion of farmers have reported yields from the area harvested, rather than the whole field. The estimated national average yield is currently 3.1-3.3 t/ha, which is lower than the UK 5-year average yield of 3.5 t/ha.
Crops that were established early and survived the winter, with minimal pigeon grazing, yielded very well (5.0-5.5 t/ha was common on these crops). Many later drilled crops failed and were replaced, but some poor crops were maintained and yielded 2.5-3.0 t/ha on the parts of the field that had plants present. Bare patches reduced the overall field yield with some as low as 1.0 t/ha.

15
Quality
Quality has been satisfactory with average oil levels between 42-46%. Occasionally oil content dropped as low as 41%, whilst other crops have had oil contents up to 47%. Admixture was a problem in some crops, with reports of the worst crops having up to 20% contamination with weed seed.
Progress
Harvest of winter oilseed rape in 2013 was later and slower than in any of the last five years. The start of harvest was 1-2 weeks later than is typical with the first crops not harvested until 24-30 July. Once harvest started, progress remained very slow due to a wide range in crop maturity. Many crops were thin and had suffered from pigeon grazing earlier in the season and these commonly had secondary branching at flowering which extended flowering period and delayed crop maturity. Many farms left their rape (particularly if crops were poor) to focus on wheat harvest, then returned and cleared the area. Harvest of winter oilseed rape was nearing completion by 3 September, whereas in all of the last 5 years harvest was near complete by 20 August. This season there were still odd fields harvested into the first half of September.
Despite the long drawn out harvest of winter oilseed rape there were few reported crop losses due to pod shatter.
0
20
40
60
80
100
1
(WE 16/7)
2
(WE 23/7)
3
(WE 30/8)
4
(WE 6/8)
5
(WE 13/8)
6
(WE 20/8)
7
(WE 27/8)
8
(WE 3/9)
9
(WE 10/9)
10
(WE 17/9)
11
(WE 24/9)
Weeks from mid July (WE for 2013)
earliest recent harvest 5 year average latest recent harvest 2013
Source: ADAS 2013
Figure 8 Winter oilseed rape harvest progress comparison – cumulative % area harvested

16
Spring oilseed rape
Area harvested to date 90% GB area Estimated average UK yield to date 2.3-2.5 t/ha
Yield range 1.0-4.0 t/ha
UK 5 year average yield 2.0 t/ha
Quality
Moisture at harvest 12 %
Yield
The average national yield is estimated at 2.3-2.5 t/ha. Field yields for many crops were better than expected, given how late some were drilled as replacements for winter oilseed rape. Field yields have ranged from 1.0 – 4.0 t/ha. The worst yields came from late drilled crops that went into heavy soils with insufficient moisture available at drilling.
Susan Twining Sarah Wynn Jack Watts
ADAS Boxworth ADAS Boxworth AHDB/HGCA Business line 01488 681321 Direct line 01954 268249 Office 02476 478760 Mobile 07831 266749 Mobile 07809 522560