hgs bulletin volume 46 no.4 (december 2003) · system with a young particpant at ... parrish n....
TRANSCRIPT
December 2003 Houston Geological Society Bulletin 1
The Houston Geological Society Bulletin (ISSN-018-6686) ispublished monthly except for July and August by the HoustonGeological Society, 10575 Katy Freeway, Suite 290, Houston TX77024. Subscription to this publication is included in the mem-bership dues ($20.00 annually). Subscription price for non-members within the contiguous U.S. is $30.00 per year. Forthose outside the contiguous U.S., the subscription price is$46.00 per year. Single-copy price is $3.00. Periodicalspostage paid in Houston, Texas.
POSTMASTER: Send address changes to Houston Geological SocietyBulletin, 10575 Katy Freeway, Suite 290, Houston TX 77024.
Volume 46, Number 4 December 2003
Houston Geological SocietyBulletinThe
In Every Issue5 From the President
by Craig Dingler
9 From the Editor by Diane Yeager
30 GeoEvents Calendar
56 HGA/GeoWives
57 Professional Directory
....
....
....
....
....
....
....
....
....
....
....
....
....
....
....
....
....
....
....
....
....
....
....
....
....
....
....
....
....
....
.contents
Technical Meetings11 HGS Engineering and Environmental
Dinner MeetingThe Selection of an Environmental Laboratory:What to Do and What Not to Doby Dr. William S. (Bill) Hancock
13 HGS N. American/InternationalExplorationists Joint Dinner MeetingStyles, Mechanisms, and HydrocarbonImplications of Syndepositional Folds inDeepwater Fold Belts: Examples from Angolaand the Gulf of Mexicoby Frank J. Peel
Other Features19 Book Review: The Sea Shell on the
Mountaintop: A Story of Science,Sainthood, and the Humble Geniusby George O. Chandlee
21 Eyes on Earth, from a HoustonPerspectiveby Craig M. Dingler
23 Eyes on Planet Earth: Monitoring OurChanging World Earth Science Week2003 A Huge Success Across Texasby Arthur E. Berman
35 HGS Purchases State-of-the-ArtProjectors by Arthur E. Berman
37 Global Climate Change—The ConflictingArguments by Ian G. Bryden and Peter K. J. Robertson
51 HGS Financial Summary for 2002–2003 by Carol Lucas and Parrish Erwin
55 Gemini Software Now Available from KGS by Rex Buchanan
about the cover: Earth Science Week, October 11-19was observed in Texas and the nation. A video wall atthe Wiess Energy Hall, Houston Museum of NaturalScience shows the creation of the Earth and solar system with a young particpant at Family Earth ScienceFestival, October 11, 2003. Photo by A.E. Berman
page 19
page 23
page 35
Houston Geological Society10575 Katy Freeway, Suite 290Houston, TX 77024Office Hours: 8 a.m.–5 p.m.Phone 713-463-9476Fax 713-463-9160Reservations 713-463-8920
Office Manager: Joan [email protected] your address changes to the Office Manager
HGS Web Pagehttp://www.hgs.org
GeoJob Bankhttp://www.hgs.org
December 2003 Houston Geological Society Bulletin 3
HG
SPh
one
ListBoard of Directors 2003–04
President (P) Craig Dingler Clean Harbors 281-930-2394 [email protected] (PE) Steve Levine ConocoPhillips 281-293-3896 [email protected] (VP) Paul Babcock Peoples Energy Production 713-890-3603 [email protected] (T) Parrish N. Erwin Subsurface Consultants 281-413-2065 [email protected] (TE) Chuck Sharpe 8223 Glencliff Lane 281-955-6752 [email protected] (S) Kevin McVey Noble Energy Inc. 281-874-6054 [email protected] (E) Diane Yeager Malcolm Pirnie Inc. 713-960-7429 [email protected]
[email protected] Art Berman Labyrinth Consulting Services 713-557-9076 [email protected] 03-05 (D1) Marsha Bourque Consultant 713-789-9525 [email protected] 03-05 (D2) Andrea Reynolds Shell International E&P 281-544-2481 [email protected] 02-04 (D3) Janet M. Combes ExxonMobil Production 713-431-1103 [email protected] 02-04 (D4) Michael A. Barnes Pride O&G 281-980-2771 [email protected]
Committee Chairperson Phone Email Board Rep.
AAPG Delegate Foreman George Klein 281-937-9436 [email protected] D1Academic Liaison Art Berman 713-557-9076 [email protected] D1Advertising Lilly Hargrave 713-463-9476 [email protected] EAdvisory Charles Sternbach 281-679-7333 [email protected] PArrangements Lee Boatner 713-586-5728 [email protected] VPAwards Sharie Sartain 713-668-2003 [email protected] D1Ballot Don Scherer 713-723-8484 [email protected] PCalvert Fund Carl Norman 713-461-7420 [email protected] PEContinuing Ed Kara Bennett 832-452-3747 [email protected] D3Directory Dean Gilbert 281-448-6188 [email protected] TEEarth Sc. Wk-ESW Gen. Elizabeth Fisher 281-597-1777 [email protected] D3Earth Sc. Wk-Logistics Jennifer Burton 832-636-8357 [email protected] D3Emerging Technology James Brenneke 713-789-2444 [email protected] VPEng. Council of Houston Claudia Ludwig 713-723-2511 [email protected] D1Eng. Council of Houston Richard Howe 713-467-2900 [email protected] D1Env. & Eng. Geology Glenn Lowenstein 713-467-2900 [email protected] VPExhibits Mac McKinney 281-353-0661 [email protected] D2Field Trips Howard White 281-618-6058 [email protected] D3Finance Ken Nemeth 281-654-7975 [email protected] TFishing Tournament Bobby Perez 281-240-1234 [email protected] D2Foundation John Adamick 713-860-2114 [email protected] PEFund RaisingGlobal Climate Change Jeffrey Lund D1Golf Tournament Allan Filipov 713-532-5006 [email protected] D4Government Affairs Randy Miller 281-292-4336 [email protected] D2Guest Night Linda Sternbach 713-953-7849 [email protected] D4HistoricalHouston Energy Council Sandi Barber 281-552-2792 [email protected] D1Houston Geol. Auxiliary Betty Alfred 713-772-3208 PEInternational Ex. Chair Al Danforth 713-780-8622 [email protected] VPInternational Ex. Co-Chair Scott Thornton 281 544 3914 [email protected] VPInternational Ex. Programs Linda Sternbach 832-567-7337 [email protected] VPLibrary Jim Becnel 281-353-0359 D3Membership Matt Bognar 832-351-8510 [email protected] SMuseum of Nat. Sc. Inda Immega 713-661-3494 [email protected] D3N. American Expl. Steve Earle 713-840-1980 [email protected] VPNeoGeos Natalie Uscher 713-513-2300 ext. 5923 [email protected] VPNew Publications Tom Fiorito 713-224-1877 [email protected] D4New Publications Bill Rizer 832-252-6141 [email protected] D4Nominations Denise Stone 281-497-4717 [email protected] PNorth Siders Sherrie Cronin 832-636-3113 [email protected] VPOffice Management Jim Ragsdale 713-780-4393 [email protected] PEPersonnel Placement Mike Cline 713-665-5449 [email protected] D2Public Relations Valdis Budrevics 281-543-6740 [email protected] D1Publication Sales Tom Mather 281-556-9539 [email protected] SRemembrances Bill Robbins 713-647-3506 [email protected] SScouting George Krapfel 713-989-7433 [email protected] D2Shrimp Peel Lee Shelton 832-351-8814 [email protected] D4Skeet Shoot Kenneth Mohn 713-369-5859 [email protected] D4State Registration Dave Rensink 713-296-6332 [email protected] D4Tennis Tournament Ross Davis 713-659-3131 [email protected] D3Vendor's Corner Joe Lynch 713-339-2626 [email protected] TEWebsite Bill Osten 281-293-3160 [email protected] D2
One of the more interesting aspects to being the HGS
President is the interaction I have with our umbrella organ-
izations, the Gulf Coast Association of Geological Societies
(GCAGS) and the American Association of Petroleum
Geologists (AAPG).
GCAGS NewsDuring the Gulf Coast Association of
Geological Societies (GCAGS) annual
convention in Baton Rouge last October,
several actions took place at the Board of
Directors meeting that affect the HGS.
First, GCAGS will keep its control center
in Austin. GCAGS had contracted to
lease space within the HGS office, but it
was unable to find any office staff who fit
with the pay scale offered and schedule
needed. GCAGS will locate at the Bureau
of Economic Geology complex, with free
office space. It was also reported they had
three candidates for office manager.
With the GCAGS located at the BEG,
there should be plenty of UT-Austin
student volunteers to help when needed.
We are sorry that the GCAGS headquarters will not be in
Houston, but we must recognize the Austin deal was too good to
pass up.
GCAGS also voted to drop its request for proportional represen-
tation on the AAPG Advisory Council, which it proposed several
years ago. This proposal had a snowball’s chance in Houston of
getting approved through the whole AAPG House of Delegates,
so GCAGS decided to rescind the proposal. Tim Rynott and
others will try to work up alternative means to ensure the Gulf
Coast societies have fair numbers of AAPG officer nominations
and member awards.
The GCAGS annual convention schedule is set for the next five
years. Next fall the meeting will be in
San Antonio (please see the call for
papers on page 24 of this Bulletin). The
following year it moves to New Orleans,
with the theme “Gulf Coast geological
gumbo—a recipe for success.” Then it’s
on to Lafayette in 2006, and Corpus
Christi in 2007. The next GCAGS con-
vention in Houston will be in the fall of
2008. This should give us a few months
to recuperate from the AAPG annual
meeting in Houston the spring of 2006!
Finally, it was my pleasure to be on hand
during the convention’s opening
ceremony as HGS members Dave
Rensink and Charles Sternbach were
awarded GCAGS Distinguished Service
awards. Dave graciously accepted the
award for Charles, who was unable to attend. (Something about
needing to be at the Jordan Oil and Gas headquarters in
California during the grape crush!) Congratulations to both;
your recognition was long overdue!
AAPG AwardsHGS members will receive awards at the AAPG annual meeting
that will be held in Dallas next April from the 18th through the
21st. Martha Lou Broussard
December 2003 Houston Geological Society Bulletin 5
President’sLetterby Craig M. Dingler
Talking Turkey Over Gumbo and Tex-MexSeasons Greetings!
President’s Letter continued on page 7
One of the more interesting
aspects to being the HGS
President is the interaction
I have with our umbrella
organizations, the Gulf Coast
Association of Geological
Societies (GCAGS) and the
American Association of
Petroleum Geologists (AAPG).
December 2003 Houston Geological Society Bulletin 7
President’s Letter continued from page 5 ————————-------
and Stewart Chuber will receive Honorary Membership awards.
Deborah Sacrey, Barry Katz, and Pete Gray will receive
Distinguished Service awards. Please join me in congratulating
these outstanding HGS members who give so much back to our
profession.
Member RecognitionSpeaking of awards, every spring the HGS Executive Board goes
through the process of selecting and nominating members for
awards. In addition to HGS awards, there are GCAGS and AAPG
award nominations that are considered. This process is one of
the more gratifying tasks that board members perform. It’s actu-
ally quite fun. However, with such a large society, the board
undoubtedly overlooks some HGS members that are due proper
recognition. If you know of someone who is deserving of an
honor, please do not hesitate in contacting either me or HGS
past-president Denise Stone, Nominations Committee
Chairwoman. I can’t think of a nicer gift that you could offer
during this season of giving!
To you and yours—Happy Holidays, everyone!
Consider Running forAAPG Delegate
Houston candidates are now needed to run for the office of
AAPG Delegate in the election to be held in early 2004. If you
are interested in having a leadership role in the business and future
course of AAPG, and contributing your ideas and your voice toward
AAPG’s business agenda, consider running for Delegate. This service
role offers opportunities for networking and making a meaningful
impact on the continuing efforts of AAPG. If you would enjoy repre-
senting your colleagues to AAPG, and representing AAPG to your
colleagues, this role is for you.
The House of Delegates is the legislative body of AAPG. Delegates
participate in the legislative process during the annual meeting of the
entire House of Delegates, which takes place at the AAPG Annual
Convention. During their three year term, Houston Delegates meet
during lunch monthly to process new member applications, network
and manage the business issues at hand. The group is fun and energetic,
representing many companies, geoscience roles and practices.
New members with fresh viewpoints are welcome. If you are interested
please contact Denise M. Stone ([email protected], 281-497-4717)
or Martha Lou Broussard ([email protected], or 713-665-4428) for
further information or to volunteer.

Have you ever wondered who works on the Bulletin and what
we do to get the Bulletin together? I thought this may be a
good time of the year to introduce the society to these people and
to simply thank them for their unwavering dedication in making
this publication possible.
Getting the Bulletin together starts with the committee chairs,
directors, and board members. Paul Babcock,
Linda Sternbach, Sherri Cronin, and Glenn
Lowenstein work diligently throughout the
year to line up speakers for their respective
dinner and lunch meetings. Once they
get their speakers to commit to a talk, they
work with them to develop abstracts and
biographies. They make certain that these
documents are on the editor’s desk 50 days
prior to the date of publication. I received this issue’s abstracts
and bibliographies by October 15. These individuals do an
exceptional job in keeping the deadlines to the editor, for which I
am very appreciative.
Art Berman, Editor Elect, has managed to do virtually everything
at times. In case you haven’t noticed, Art’s name is on almost
every photograph credit including the feature article on Earth
Science Week. Art has exceptional photographic talent and a long
history as the HGS’s photographer. Fortunately, his volunteer
duties as Editor Elect have not dissuaded him from continuing to
submit exemplary photographs. Your Bulletin will be in good
hands next year.
Once we have the articles, abstracts and other materials for
Bulletin publication, we transfer them to a CD. Copies are com-
piled in a three-ring binder in the order in which they will be
published. We give both the CD and the binder to Lisa Krueger of
Krueger Design. Lisa is the graphic designer for the Bulletin, and
she repeatedly goes beyond the call of duty. Lisa converts the files
to her layout software and sets up the pages with the advertise-
ments. Thankfully, Lisa’s efficiency affords us a little more time in
getting the initial contents and reviews to her. Lisa delivers drafts
to the editor, reviewers, and advertisement manager Lilly
Hargrave while maintaining constant communication with the
editor. Lisa understands the Bulletin layout and makes any neces-
sary changes. Thanks, Lisa!
The Bulletin offers more than technical articles
and speaker abstracts. The Bulletin contains
more than 50 advertisements each month. Lilly
Hargrave manages the advertisements and the
advertisement space allocation. In case you
haven’t had the opportunity to meet Lilly, she
works in the HGS office. Lilly compiles the
advertisements and provides them to Lisa. She reviews the draft
Bulletin to ensure that the advertisements are presented per the
advertisers’ expectations and that two competing firms are not
presented on adjacent pages. Lilly tracks the invoicing and sub-
mits a monthly report to the editor. This is Lilly’s first year with
the HGS, and she has proved to be a valuable asset to the Bulletin.
Once Lisa compiles the draft she distributes a copy to each
reviewer. Our primary grammarian is Elsa Kapitan-White, whom
I call the “Jewel of the Bulletin.” She has received drafts with only
a day to spare and without a complaint she manages to review
the document thoroughly and provide her comments by the next
day. I have submitted late articles to Elsa via e-mail after her draft
review and she still manages to fit the review into her busy
schedule. Elsa spoils us, and without her we would not be able to
push deadlines.
Review comments are submitted to the editor. The editor com-
piles the comments and provides
December 2003 Houston Geological Society Bulletin 9
Editor’sLetterby Diane Yeager
Inside The BulletinThe People Who Make it Happen
Editor’s Letter continued on page 53
My thanks go to
everyone involved
for making this effort
fun and rewarding.
December 2003 Houston Geological Society Bulletin 11
Successful laboratory programs depend heavily on the shared
understanding of the end data user’s needs. The person
responsible for selecting the laboratory must understand the data
user’s needs and communicate those needs to the laboratory.
Laboratory selection cannot be made until the data quality
objectives have been established.
The end data user’s needs determine the data quality objectives
(DQOs). The DQOs are used to select the level of required per-
formance (LORPs). The LORPs include methods, detection
limits, and quality control limits. Not all laboratories can meet
the levels that you may require, or even perform the analytical
methods you may require.
Determination of the qualifications of a laboratory is obtained
through a recent audit performed by a qualified chemist who has
a clear understanding of your DQOs. The audit(s) should be
augmented with performance evaluation samples, which are
samples of known concentration that are sent to the laboratory
for analysis and reporting. Their analysis provides a check of
both the laboratory’s equipment capabilities and its quality con-
trol program. The reporting process is also reviewed during this
test to see if the laboratory does indeed deliver all the required
data in a usable format, and in a timely manner.
The two most common causes for failure of an analytical pro-
gram are failure to clearly define DQOs and failure to clearly
communicate them to the laboratory. Expectations, such as
LORPs deliverables, schedules, and special quality control needs
,must be clearly communicated with the laboratory. Using a data
form that can serve as a checklist is highly recommended. Once
you have identified two or three labs that can and will do what
you need, then price can be considered. The saying “You get what
you pay for” generally applies at this point in an evaluation. If a
laboratory has substantially lower rates, the auditing chemist
might discover that is due to a cost-cutting practice that would
render the data results unsuitable for your use. However, under
some circumstances it is possible to lower prices by leveraging
other projects. ■
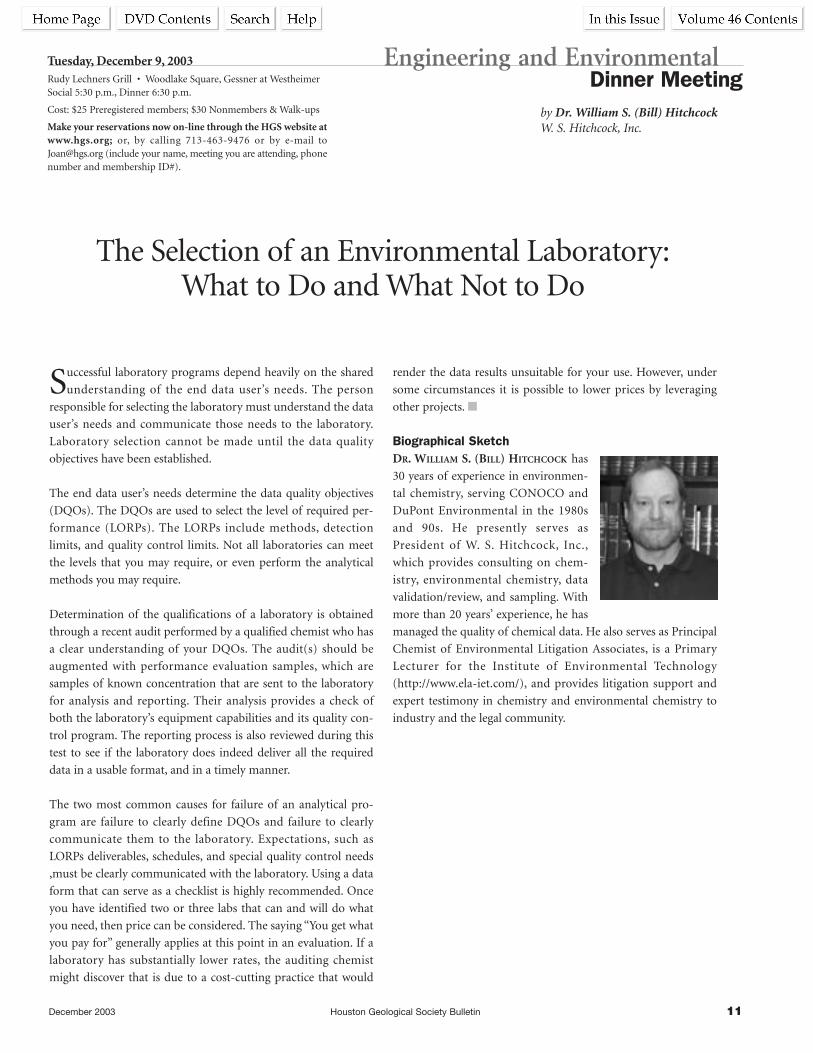
Biographical SketchDR. WILLIAM S. (BILL) HITCHCOCK has
30 years of experience in environmen-
tal chemistry, serving CONOCO and
DuPont Environmental in the 1980s
and 90s. He presently serves as
President of W. S. Hitchcock, Inc.,
which provides consulting on chem-
istry, environmental chemistry, data
validation/review, and sampling. With
more than 20 years’ experience, he has
managed the quality of chemical data. He also serves as Principal
Chemist of Environmental Litigation Associates, is a Primary
Lecturer for the Institute of Environmental Technology
(http://www.ela-iet.com/), and provides litigation support and
expert testimony in chemistry and environmental chemistry to
industry and the legal community.
by Dr. William S. (Bill) HitchcockW. S. Hitchcock, Inc.
Engineering and Environmental Dinner Meeting
Tuesday, December 9, 2003Rudy Lechners Grill • Woodlake Square, Gessner at WestheimerSocial 5:30 p.m., Dinner 6:30 p.m.
Cost: $25 Preregistered members; $30 Nonmembers & Walk-ups
Make your reservations now on-line through the HGS website atwww.hgs.org; or, by calling 713-463-9476 or by e-mail [email protected] (include your name, meeting you are attending, phonenumber and membership ID#).
The Selection of an Environmental Laboratory:What to Do and What Not to Do
This presentation combines recent published material
with new ideas to provide a review of how the structural
geology of deepwater fold belts influences the distribution of
hydrocarbons within them. How do deepwater fold belts differ
from orogenic fold belts? What factors control the location of the
fold belt? What is the significance of early-formed precursor
folds? Why are these factors important in
the exploration for hydrocarbons?
First, we consider the significant differences
between passive-margin and orogenic fold
belts, then, the application of Coulomb
wedge theory to passive margins (to explain
where and why fold belts form), and lastly,
explore a critical factor—whose significance
has only recently been recognized— namely
the influence of early-formed folds on the
later-formed large structures, and how
hydrocarbons are trapped within them.
Part 1: Comparison of passive margin fold belts withorogenic fold beltsFold and thrust belts occur primarily in two settings: either
linked to an orogenic belt forming due to plate convergence, or
in the compressional toe of a system of gravity-driven movement
on passive margins. While mixed-mode fold belts also exist, and
other scenarios for fold belt formation are also observed, it is
instructive to compare and contrast the two end members and
consider the implications of the differences for the hydrocarbon
systems, which can trap in either setting.
Orogenic fold belts
The ultimate driving mechanism of orogenic fold belts (including
accretionary prisms) is relative plate movement. The rate of
convergence is effectively fixed, and the main variable affecting
the rate of movement in the frontal thrust belt is the partitioning
of shortening between the frontal thrust system and contraction
within the body of the orogenic belt. Shortening occurs whether
or not there is a good décollement. The nature of the décolle-
ment does, however, have a strong influence on the structural
style. The total shortening in the orogenic fold belt can be
100s of kilometers, and, as a result, most of the thickening of the
orogenic wedge occurs by tectonic thickening
of the accreted mass.
Passive-margin fold belts
The ultimate driving force of passive-margin
fold belts is gravity. This may take the form
of gravity sliding, driven by the existing
slope of the margin, plus continued tilting
(as seen in the outer Kwanza Basin, and the
GOM Cretaceous/Paleogene strata), or of
gravity spreading of the sediment wedge
(like in the Niger Delta, Africa, and Neogene
GOM). The rate-limiting factors are the rheology of the wedge,
décollement level, and the rate of sediment input to the shelf and
upper slope. As a result, passive-margin fold belts are commonly
intimately linked to the pattern of depositional systems on the
margin.
While most passive-margin fold belts shorten at slower rates than
orogenic fold belts, there are no upper boundaries to the possible
rates of movement. If the conditions for mechanical failure of
the margin are not achieved, no movement will occur; passive-
margin fold belts may move continuously, episodically, or not at
all. A passive-margin fold belt can develop only where there is a
good décollement layer present. This commonly consists of salt
or overpressured mud. The total shortening in passive-margin
fold belts is limited by the dynamics of the system and is typically
5–50 km, more commonly toward the low end of that range. As a
result, the majority of the thickening of the transported wedge
occurs by
December 2003 Houston Geological Society Bulletin 13
by Frank J. Peel,BHP Billiton PetroleumHouston, Texas
HGS N. American & International Explorationists Joint Dinner Meeting
Monday, December 15, 2003Westchase Hilton • 9999 WestheimerSocial 5:30 p.m., Dinner 6:30 p.m.
Cost: $25 Preregistered members; $30 Nonmembers & Walk-ups
Make your reservations now on-line through the HGS website atwww.hgs.org; or, by calling 713-463-9476 or by e-mail [email protected] (include your name, meeting you are attending, phonenumber and membership ID#).
Styles, Mechanisms, and Hydrocarbon Implications ofSyndepositional Folds in Deepwater Fold Belts:Examples from Angola and the Gulf of Mexico
HGS N. American & International continued on page 15
Compressional fold belts
in deepwater settings
have been a major focus
of recent exploration and
appraisal activity
December 2003 Houston Geological Society Bulletin 15
deposition on top of the wedge, rather than by structural
thickening.
Part 2: Dynamics of “passive” margins—what controlsthe location of passive-margin fold beltsSimple Coulomb-wedge analysis can be applied to the whole
mass of a gravitationally active passive-margin system. This states
that the stability of a wedge is defined by 1) the top and bottom
slope of the wedge, 2) the internal strength of the wedge, and 3)
the resistance to movement of the basal décollement. Active
shortening of a wedge occurs where these factors vary in the
downdip direction. In passive-margin fold belt settings, the two
factors that commonly control wedge stability are the distribu-
tion of the décollement horizon and the surface bathymetry. The
locus of active shortening in the passive margin wedge, therefore,
tends to occur either at the slope toe (the transition from conti-
nental rise to continental slope) or at the downdip limit of the
décollement lithology. These will be referred to as FATBAST
(fold and thrust belt at slope toe) and FATBARDE (fold and
thrust belt at regional décollement edge) scenarios. Combination
scenarios are possible.
A discussion of likely hydrocarbon systems of orogenic fold
belts is found in the literature and will not be repeated here. The
systematic differences between orogenic and passive-margin
fold belts lead to characteristic differences in the hydrocarbon
systems. In a FATBAST scenario, the fold belt develops at the
location where the total sediment isopach is at a minimum.
Therefore, the maturity level of source rocks also tends to be at a
minimum, and such fold belts may therefore have a charge limi-
tation relative to structures in the updip slope. Charge timing is
also generally later in the fold belt than in the updip slope for
the same reason. In the FATBARDE scenario, the edge is most
commonly formed by the limit of a deep salt layer. In such cases,
migration from a subsalt source can occur only through syncli-
nal welds in the deep salt or around the frontal limit of the salt.
As a result, the frontal fold is exposed to different charge mech-
anisms from more updip folds. Migration from supra-salt
source kitchens is also possible, but owing to the relatively small
amount of shortening seen in FATBARDEs, the source kitchens
tend to consist of small isolated synclinal areas. This contrasts
with the orogenic setting, in which supra-décollement source
kitchens may be more extensiveowing to the presence of
multiple thrust repeats.
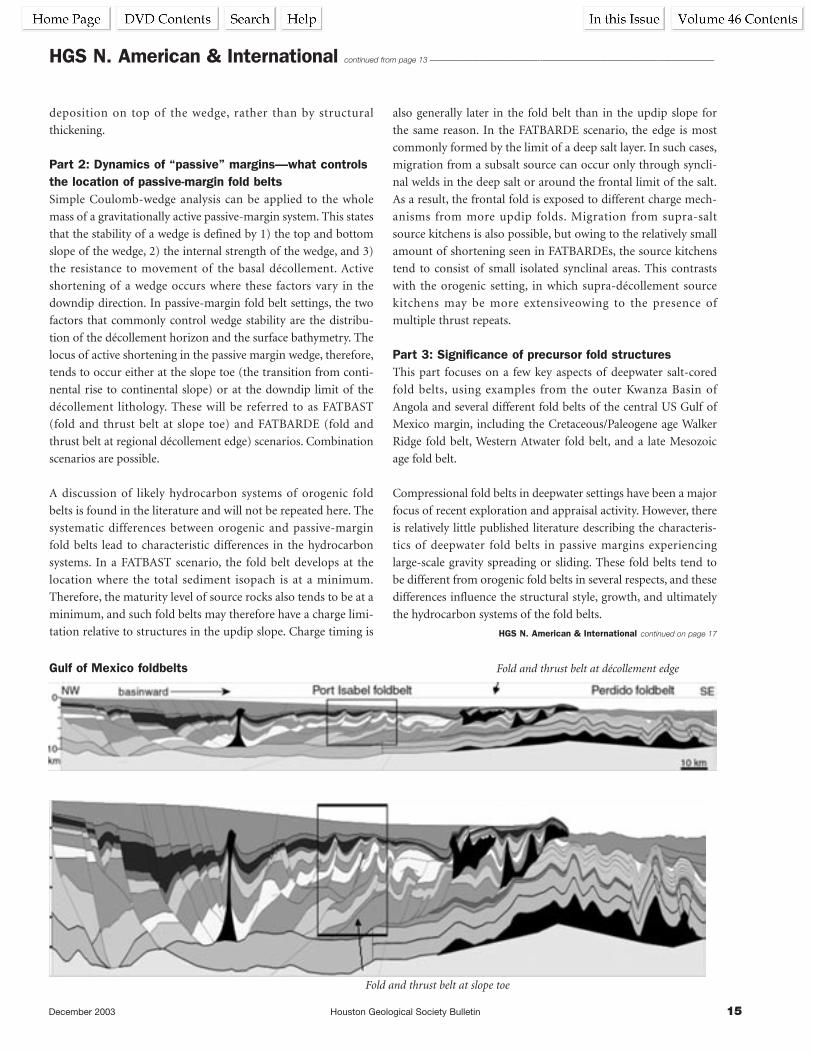
Part 3: Significance of precursor fold structuresThis part focuses on a few key aspects of deepwater salt-cored
fold belts, using examples from the outer Kwanza Basin of
Angola and several different fold belts of the central US Gulf of
Mexico margin, including the Cretaceous/Paleogene age Walker
Ridge fold belt, Western Atwater fold belt, and a late Mesozoic
age fold belt.
Compressional fold belts in deepwater settings have been a major
focus of recent exploration and appraisal activity. However, there
is relatively little published literature describing the characteris-
tics of deepwater fold belts in passive margins experiencing
large-scale gravity spreading or sliding. These fold belts tend to
be different from orogenic fold belts in several respects, and these
differences influence the structural style, growth, and ultimately
the hydrocarbon systems of the fold belts.
HGS N. American & International continued from page 13 ——————————————--———————————————-———————
HGS N. American & International continued on page 17
Fold and thrust belt at décollement edgeGulf of Mexico foldbelts
Fold and thrust belt at slope toe
December 2003 Houston Geological Society Bulletin 17
Shortening of the sediment cover sequence in passive-margin
fold belts commonly occurs very slowly and continuously
compared with the shortening in orogenic fold belts. Cover
shortening is usually accompanied by continuing deposition on
top of the growing fold. As a result, the sediment sequence is
much thinner at the onset of folding than it is at a late stage in
fold development. Where there is a long history of fold develop-
ment, early-formed, short-wavelength folds are deactivated and
overprinted by later, longer wavelength folds, commonly tripling
in wavelength.
Recognition of the precursory structures is important because
these control the structural style of the later folds. Reservoir
distribution in the lower part of the structure may be controlled
by the distribution of the early folds and not by the later, more
obvious structures. The early folds may also have a critical
influence on hydrocarbon migration paths. ■
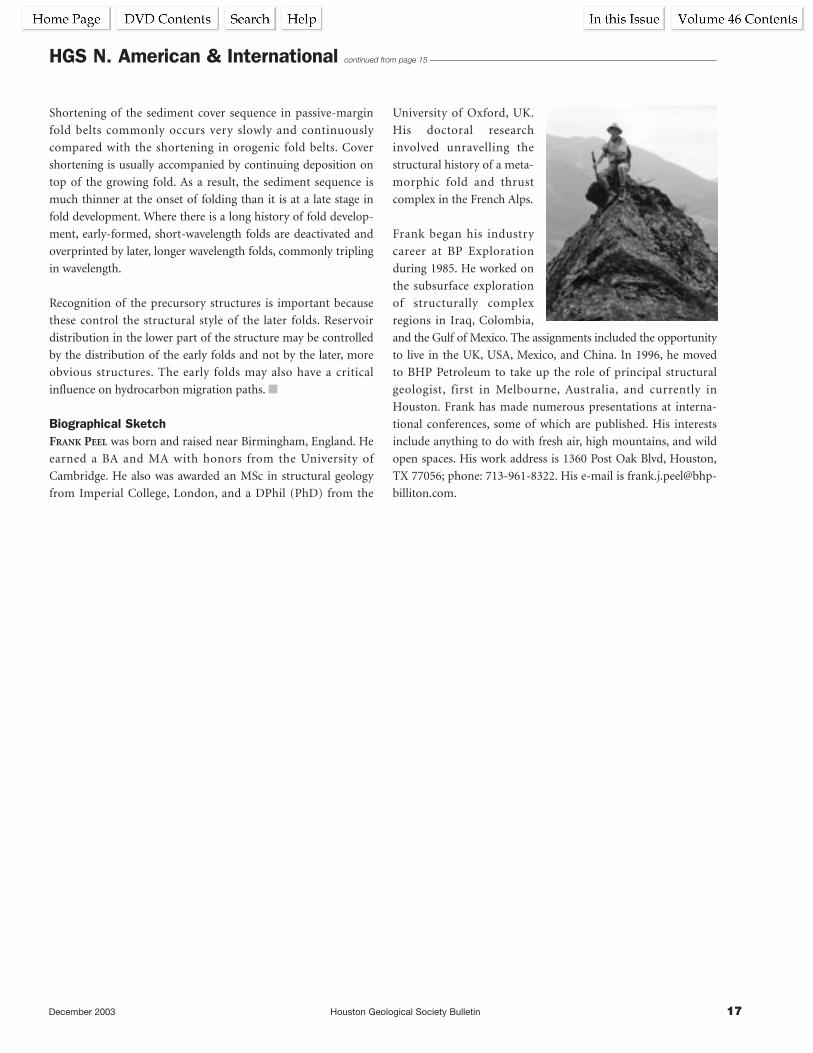
Biographical SketchFRANK PEEL was born and raised near Birmingham, England. He
earned a BA and MA with honors from the University of
Cambridge. He also was awarded an MSc in structural geology
from Imperial College, London, and a DPhil (PhD) from the
University of Oxford, UK.
His doctoral research
involved unravelling the
structural history of a meta-
morphic fold and thrust
complex in the French Alps.
Frank began his industry
career at BP Exploration
during 1985. He worked on
the subsurface exploration
of structurally complex
regions in Iraq, Colombia,
and the Gulf of Mexico. The assignments included the opportunity
to live in the UK, USA, Mexico, and China. In 1996, he moved
to BHP Petroleum to take up the role of principal structural
geologist, first in Melbourne, Australia, and currently in
Houston. Frank has made numerous presentations at interna-
tional conferences, some of which are published. His interests
include anything to do with fresh air, high mountains, and wild
open spaces. His work address is 1360 Post Oak Blvd, Houston,
TX 77056; phone: 713-961-8322. His e-mail is frank.j.peel@bhp-
billiton.com.
HGS N. American & International continued from page 15 —————————————-————————————————————————
December 2003 Houston Geological Society Bulletin 19
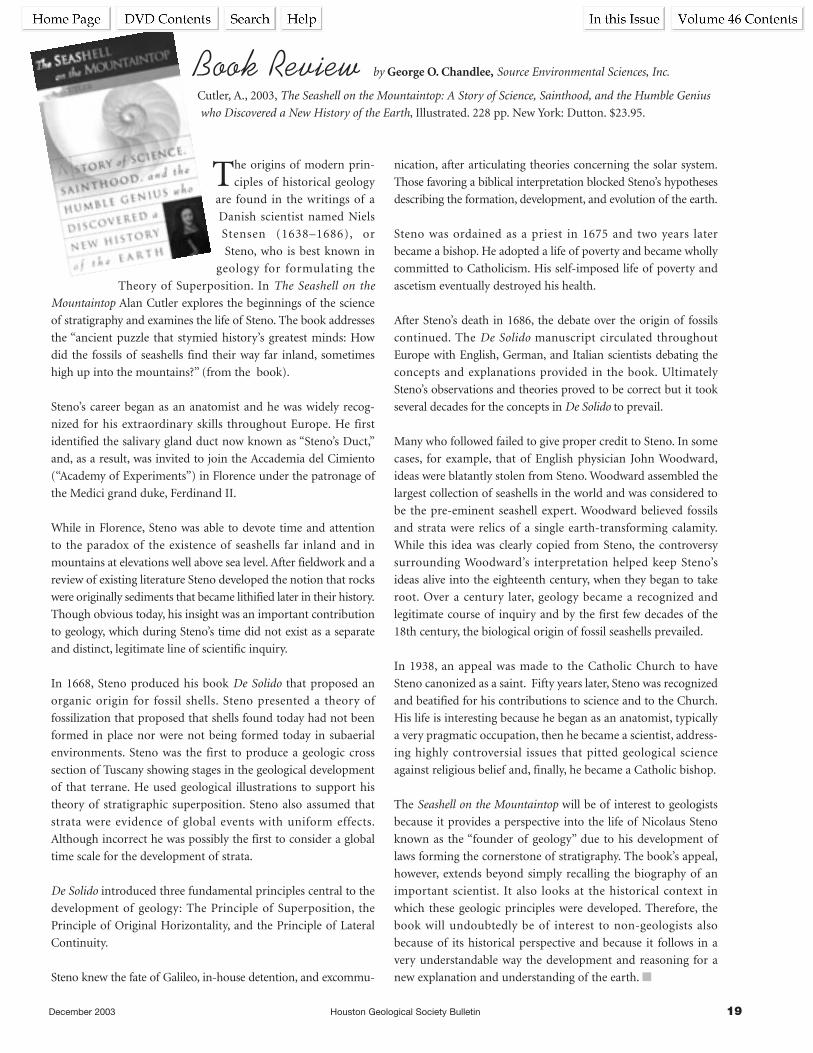
Book Review by George O. Chandlee, Source Environmental Sciences, Inc.
Cutler, A., 2003, The Seashell on the Mountaintop: A Story of Science, Sainthood, and the Humble Genius
who Discovered a New History of the Earth, Illustrated. 228 pp. New York: Dutton. $23.95.
The origins of modern prin-
ciples of historical geology
are found in the writings of a
Danish scientist named Niels
Stensen (1638–1686), or
Steno, who is best known in
geology for formulating the
Theory of Superposition. In The Seashell on the
Mountaintop Alan Cutler explores the beginnings of the science
of stratigraphy and examines the life of Steno. The book addresses
the “ancient puzzle that stymied history’s greatest minds: How
did the fossils of seashells find their way far inland, sometimes
high up into the mountains?” (from the book).
Steno’s career began as an anatomist and he was widely recog-
nized for his extraordinary skills throughout Europe. He first
identified the salivary gland duct now known as “Steno’s Duct,”
and, as a result, was invited to join the Accademia del Cimiento
(“Academy of Experiments”) in Florence under the patronage of
the Medici grand duke, Ferdinand II.
While in Florence, Steno was able to devote time and attention
to the paradox of the existence of seashells far inland and in
mountains at elevations well above sea level. After fieldwork and a
review of existing literature Steno developed the notion that rocks
were originally sediments that became lithified later in their history.
Though obvious today, his insight was an important contribution
to geology, which during Steno’s time did not exist as a separate
and distinct, legitimate line of scientific inquiry.
In 1668, Steno produced his book De Solido that proposed an
organic origin for fossil shells. Steno presented a theory of
fossilization that proposed that shells found today had not been
formed in place nor were not being formed today in subaerial
environments. Steno was the first to produce a geologic cross
section of Tuscany showing stages in the geological development
of that terrane. He used geological illustrations to support his
theory of stratigraphic superposition. Steno also assumed that
strata were evidence of global events with uniform effects.
Although incorrect he was possibly the first to consider a global
time scale for the development of strata.
De Solido introduced three fundamental principles central to the
development of geology: The Principle of Superposition, the
Principle of Original Horizontality, and the Principle of Lateral
Continuity.
Steno knew the fate of Galileo, in-house detention, and excommu-
nication, after articulating theories concerning the solar system.
Those favoring a biblical interpretation blocked Steno’s hypotheses
describing the formation, development, and evolution of the earth.
Steno was ordained as a priest in 1675 and two years later
became a bishop. He adopted a life of poverty and became wholly
committed to Catholicism. His self-imposed life of poverty and
ascetism eventually destroyed his health.
After Steno’s death in 1686, the debate over the origin of fossils
continued. The De Solido manuscript circulated throughout
Europe with English, German, and Italian scientists debating the
concepts and explanations provided in the book. Ultimately
Steno’s observations and theories proved to be correct but it took
several decades for the concepts in De Solido to prevail.
Many who followed failed to give proper credit to Steno. In some
cases, for example, that of English physician John Woodward,
ideas were blatantly stolen from Steno. Woodward assembled the
largest collection of seashells in the world and was considered to
be the pre-eminent seashell expert. Woodward believed fossils
and strata were relics of a single earth-transforming calamity.
While this idea was clearly copied from Steno, the controversy
surrounding Woodward’s interpretation helped keep Steno’s
ideas alive into the eighteenth century, when they began to take
root. Over a century later, geology became a recognized and
legitimate course of inquiry and by the first few decades of the
18th century, the biological origin of fossil seashells prevailed.
In 1938, an appeal was made to the Catholic Church to have
Steno canonized as a saint. Fifty years later, Steno was recognized
and beatified for his contributions to science and to the Church.
His life is interesting because he began as an anatomist, typically
a very pragmatic occupation, then he became a scientist, address-
ing highly controversial issues that pitted geological science
against religious belief and, finally, he became a Catholic bishop.
The Seashell on the Mountaintop will be of interest to geologists
because it provides a perspective into the life of Nicolaus Steno
known as the “founder of geology” due to his development of
laws forming the cornerstone of stratigraphy. The book’s appeal,
however, extends beyond simply recalling the biography of an
important scientist. It also looks at the historical context in
which these geologic principles were developed. Therefore, the
book will undoubtedly be of interest to non-geologists also
because of its historical perspective and because it follows in a
very understandable way the development and reasoning for a
new explanation and understanding of the earth. ■
December 2003 Houston Geological Society Bulletin 21
HGS President Craig Dingler submitted the following essay to the
Houston Chronicle to help highlight Earth Science Week in
Houston. It was published on the Chronicle’s Outlook page
Monday, October 13, 2003.
THE stereotypical image of the geologist is that of the lone
wanderer plinking rocks, looking for the mother lode or a
spot to drill the next Spindletop. That may be a historical repre-
sentation; nowadays, geoscientists throughout the world perform
important work helping to solve some of society's major prob-
lems. Using observations and measurements from instruments
in space, under water and on the ground, geoscientists constantly
evaluate the Earth’s present condition. The geologic processes
that work on our planet are dynamic, so that the state of the
Earth constantly changes. Collecting and assessing geological
data helps us predict change so that individuals and society can
prepare and respond to the effects.
Geologically, how will Earth’s changes affect
our future? Earth science research has applica-
tions and relevance to our daily lives, especially
here in Houston. Most geoscientists work in
the business of petroleum exploration to fulfill
our energy needs, but many others are
involved with sustaining natural resources and
mitigating natural disasters. Regionally, these
problems include flooding, subsidence, inade-
quate water supplies and property damage
from beach erosion.
Since Tropical Storm Allison, recent advancements in radar tech-
nology have enabled the rapid mapping of Houston’s flood
plains from low-flying aircraft. The maps delineate areas most
susceptible to flooding, but also allow geoscientists and others to
look in the fourth dimension, time, and see changes in elevation
that have taken place on the surface from erosion, development
and subsidence. In Houston, where we are so close to sea level,
even small differences may have a big effect on flooding.
Subsidence is a geological phenomenon that takes place due to
the rapid removal of ground water. It has a direct effect on
flooding in the Houston area. Geoscientists monitor changes in
elevations using satellite global positioning systems, or GPS,
much like the ones found for navigation in automobiles and
boats. They can take measurements frequently, cheaply and
more accurately than using traditional surveying techniques
that were state of the art only a few years ago. These data allow
geoscientists and others to see where subsidence is taking place,
and at what rate the land is sinking.
Because of subsidence, Houston and other municipalities in
southeast Texas use surface water for their citizens’ needs. The
problem is these water supplies are almost fully allocated
between industrial, agricultural and municipal interests. This
lack of available water will have a direct effect on urbanization
and growth in the Houston area. I can envision a time—soon—
when we will have to find political and technological solutions to
subsidence in order to tap our prolific Gulf Coast aquifers, the
subsurface layers of water-saturated sand. The resource is there,
and it is safer from terrorism than our open surface water
supplies. However, development must be sustainable and must
pay heed to societal and environmental concerns. Geoscientists
are already taking geophysical techniques used to find oil and gas
deposits and modifying their methods to locate and delineate
adequate ground water resources.
Geoscientists monitor climate change and assess its affect on our
changing coastlines. About 12,000 years ago, as humans migrated
across the Bering land bridge to inhabit the
North and South American continents, the
Earth was just ending its latest major glacial
period. Much water was incorporated in the
polar ice caps, and ocean levels were about 400
feet lower than today. Imagine! A trip to the
beach would be an extra hour’s drive from
Galveston!
Where is our present coastline moving?
Geoscientists want to know. Most indicators
show that between the processes of sedimentation and erosion,
erosion is winning out. The Earth’s climate is in a constant state of
change, and we are still coming out of our last ice age. As icepacks
and glaciers continue to melt, the oceans water volume increases
and the coastline moves up onto land. The effect may seem glacial
in terms of time, also, until we stop to realize the loss in recent
history of beach along western Galveston Island and near shore
wetlands in south Louisiana.
Funding for monitoring these changes on Earth is largely from
federal grants. The president’s budget proposals call for cutbacks
in federal agencies that provide these funds to geoscientists
employed by universities, state agencies and private contractors.
Good programs like the state Water Resources Research Institute
at Texas A&M University could lose all of their funding. We are
all for financial responsibility, but these cutbacks seem short-
sighted when considering the lack of water resources and a
growing population in Texas and other Western states. Congress
has seen fit to restore some funding in its preliminary budgets,
much to its credit, but these agencies are an easy mark when
trying to balance the budget.
Eyes on Earth, from a Houston Perspectiveby Craig M. Dingler
Earth science research
has applications and
relevance to our daily
lives, especially here
in Houston
Eyes on Earth continued on page 22

22 Houston Geological Society Bulletin December 2003
Houston is still the energy capital of the world. We have the
world’s largest concentration of geoscientists. They search the
globe for oil and gas to supply society’s energy needs. That search
has led to technical, economic and political advances both at
home and abroad, and contributed to the spread of American
ideals to every conceivable remote area on our planet. As the
Earth’s population depletes petroleum resources in the coming
decades, the price will escalate beyond what the normal popula-
tion will consider reasonable. These geoscientists will be on the
forefront of technological innovation and creative development
of alternative and renewable energy resources.
Look at your planet with open eyes to learn a little about the
world around you. Earth stewardship through monitoring and
understanding is essential for evaluating its present state and
making predictions about how it will change. Only by fully
understanding our problems will we be able to conceive practical
solutions. Houston’s geoscientists are eager to share their knowl-
edge and enthusiasm about the Earth. ■
Eyes on Earth continued from page 21 ——————————————--——————————————————————------------------------------------------------——————

Earth Science Week 2003
officially began in
Houston Saturday, October
11, in Pendulum Hall at the
Houston Museum of Natural
Science. Craig Dingler, Houston Geological Society President,
welcomed the hundreds of children and their families who came
to celebrate at the Museum. Dingler spoke from a podium in
front of the giant Foucault’s Pendulum at the entrance to the
Weiss Energy Center as he began this year’s Family Earth Science
Festival.
At the opening ceremony Craig welcomed the excited attendees,
spoke about earth science and the meaning of Earth Science
Week, and mentioned the many events planned in the Houston
area for the coming week. He then mentioned the many sponsor-
ing organizations and their representatives present at the
opening. These organizations included the Houston Geological
Society, Houston Museum of Natural Science, Houston Gem and
Mineral Society, Gulf Coast Section of SEPM, National
Association of Black Geologists and Geophysicists, Engineering
Science and Technology Council of Houston, Association of
Women Geoscientists, Houston chapters of SIPES, SPE TESTA,
Rice Student Chapter of AAPG and AAPG
Houston House of Delegates. Representatives of these organiza-
tions who were present at the opening ceremony with Dingler
included Jory Pacht, Robert Johnson, Jim Cartwright, Martha
McRae, Jim Allen, Karen Stocco, Deanna Borchers, and Inda
Immega.
Dingler then
introduced the Houston Earth Science Week art and
essay contest winners and presented them with their awards. All
winners were from Mr. Kevin Robedee’s 6th grade science classes
(an HISD Middle School. The winners were Errolain Swasey,
Darian Coleman, Rose Nguyen, and Gilberto Morales. They were
each awarded family four packs to the museum (museum
entrance, IMAX, butterfly exhibit, and planetarium for 4 people),
a $50 gift certificate to the museum bookstore, a sample of petri-
fied wood and a fossil shark’s tooth.
Then the children, their parents, and scoutmasters proceeded to
visit the many booths and exhibits staffed by earth science volun-
teers. Kids got to look into microscopes to see microfossils and
then to see these fossils displayed on a screen in real time. There
was a workstation booth where the kids were introduced to basic
seismic concepts and were able to experiment with interpreta-
tions of Gulf Coast geology
December 2003 Houston Geological Society Bulletin 23
Eyes on Planet Earth:Monitoring Our Changing World
Earth Science Week 2003A Huge Success Across Texas
Article and photography by Art Berman
Eyes on Planet Earth continued on page 25
ESW award recipients (left to right): Darian Coleman, Kevin Robedee(teacher), Errolain Swasey, Craig Dingler (HGS president), Rose Nguyen.

December 2003 Houston Geological Society Bulletin 25
including salt masses. There were booths where geologists and
geophysicists explained maps and charts that are used in earth
science as well as exhibits where the children could get “hands-
on” experience with dinosaur bones and teeth as well as petrified
wood. Everything that was seen and touched was from the State
of Texas and was explained by working geoscientist volunteers.
At the center of the fun was the Passport Center, where volun-
teers issued “passports” to the exhibits as well as bags of samples
and other stimulating earth science souvenirs. In addition to the
earth science exhibits the kids
enjoyed the many regular
museum exhibits and interac-
tive information stations of
the Weiss Energy Center.
Craig Dingler commented,
“Saturday's program at the
HMNS could not be consid-
ered anything less than a
fabulous success! What a
great event! What a crowd!
It was very easy to get excit-
ed about the science,
because the kids were so
excited.”
Inda Immega said, “As I
was leaving, one of the
guards stopped me. She
said to pass along a bit of
feedback from a departing
mother with two daughters
in tow who had told the
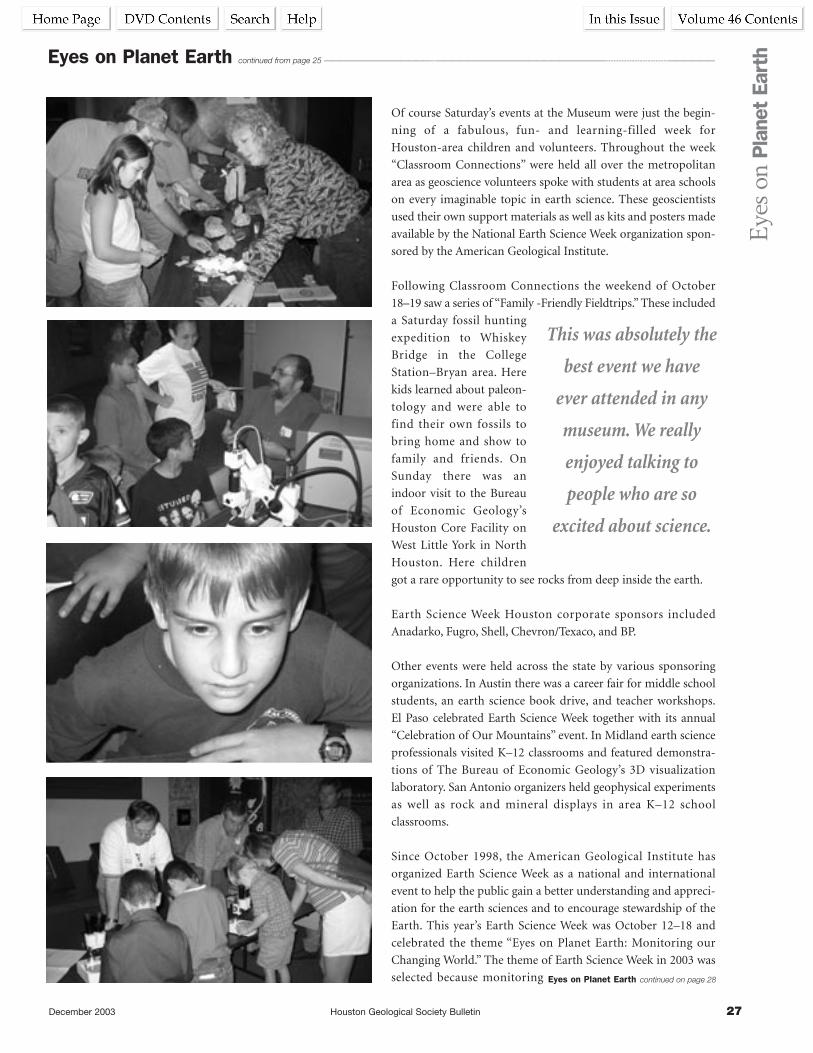
guard, ‘This was absolutely the best event we have ever attended
in any museum. We really enjoyed talking to people who are so
excited about science.”
Dingler participated as a volunteer at the microfossil exhibit and
said later, “It was really fun working at the microfossil table and
seeing the kids amazed at the ‘very small fossils.’ For most, it was
their first time looking through a microscope!
“You know that look kids get when they suddenly realize or
understand something? Or, as I like to think of it, as their brain
suddenly gets a new crease? I can’t tell you how many times I saw
that look Saturday.”
Apparently something was working incredibly well at the
Houston Museum of Natural Science on Saturday morning as
Earth Science Week began in
Houston.
Eyes on Planet Earth continued from page 23 ——————————————--——————————————————————------------------------——————
Eye
s on
Pla
net
Eart
h
Eyes on Planet Earth continued on page 27
December 2003 Houston Geological Society Bulletin 27
Of course Saturday’s events at the Museum were just the begin-
ning of a fabulous, fun- and learning-filled week for
Houston-area children and volunteers. Throughout the week
“Classroom Connections” were held all over the metropolitan
area as geoscience volunteers spoke with students at area schools
on every imaginable topic in earth science. These geoscientists
used their own support materials as well as kits and posters made
available by the National Earth Science Week organization spon-
sored by the American Geological Institute.
Following Classroom Connections the weekend of October
18–19 saw a series of “Family -Friendly Fieldtrips.” These included
a Saturday fossil hunting
expedition to Whiskey
Bridge in the College
Station–Bryan area. Here
kids learned about paleon-
tology and were able to
find their own fossils to
bring home and show to
family and friends. On
Sunday there was an
indoor visit to the Bureau
of Economic Geology’s
Houston Core Facility on
West Little York in North
Houston. Here children
got a rare opportunity to see rocks from deep inside the earth.
Earth Science Week Houston corporate sponsors included
Anadarko, Fugro, Shell, Chevron/Texaco, and BP.
Other events were held across the state by various sponsoring
organizations. In Austin there was a career fair for middle school
students, an earth science book drive, and teacher workshops.
El Paso celebrated Earth Science Week together with its annual
“Celebration of Our Mountains” event. In Midland earth science
professionals visited K–12 classrooms and featured demonstra-
tions of The Bureau of Economic Geology’s 3D visualization
laboratory. San Antonio organizers held geophysical experiments
as well as rock and mineral displays in area K–12 school
classrooms.
Since October 1998, the American Geological Institute has
organized Earth Science Week as a national and international
event to help the public gain a better understanding and appreci-
ation for the earth sciences and to encourage stewardship of the
Earth. This year’s Earth Science Week was October 12–18 and
celebrated the theme “Eyes on Planet Earth: Monitoring our
Changing World.” The theme of Earth Science Week in 2003 was
selected because monitoring
Eyes on Planet Earth continued from page 25 ——————————————--——————————————————————------------------------——————
Eye
s on
Pla
net
Eart
h
Eyes on Planet Earth continued on page 28
This was absolutely the
best event we have
ever attended in any
museum. We really
enjoyed talking to
people who are so
excited about science.

28 Houston Geological Society Bulletin December 2003
the Earth is essential for evaluating its present state and making
predictions.
Earth Science Week, observed annually in the United States,
Canada, and, increasingly, in other countries, is an opportunity
to understand the impact of the earth sciences in our daily lives.
The Houston Geological Society is was pleased to join in the cel-
ebration for its sixth consecutive year.
Earth Science Week focuses on the Earth and its resources,
processes, and hazards. The intent of Earth Science Week is to
promote understanding and appreciation of the value of earth
science research and its application and relevance to our daily
lives.
Specifically this translates into the goals of the Week:
• To engage students in discovering the earth sciences.
• To remind people that earth science is all around us.
• To encourage Earth stewardship through understanding.
Above all Earth Science Week is about pro-
viding geoscientists an
opportunity
to share their
knowledge and
e n t h u s i a s m
about the Earth
w i t h m o s t l y
elementary and
m i d d l e s c h o o l
children.
In addition to the
AGI national sponsors
of Earth Science week
i n c l u d e t h e U. S .
Geological Survey,
many state geological
surveys, the National
Park Service, NASA,
and the Geological Society of America.
Dr. Adena Williams Loston, NASA’s Associate Administrator
for Education, said, “We seek through our celebration of
Earth Science Week another valuable opportunity to inspire and
motivate the next generation of explorers to learn more about
our home planet.”
USGS Director Dr. Charles Groat commented, “The science of
the USGS and NASA benefits lives in countless ways. Earth
Science Week is a great opportunity to increase public awareness
of the diversity of scientific
Eyes on Planet Earth continued from page 27 ——————————————--——————————————————————------------------------——————E
yes
on P
lane
t Ea
rth
Eyes on Planet Earth continued on page 33
(left to right) Robert Johnson, National Association for Black Geologistsand Geophysicists; Karen Stocco, TESTA; Martha McRae, Association forWomen Geoscientists; Craig Dingler, HGS President; Deanna Borchers,Rice Student Chapter of AAPG; Inda Immega, AAPG Houston ofDelegates; Jory Pacht, Gulf Coast Section of SEPM showing Mayor’sProclamation of Earth Science Week.

December 2003 Houston Geological Society Bulletin 35
The HGS Executive Board authorized purchase of two multi-
media projectors at its October meeting. One of the new
projectors will be kept at the HGS Office for use principally at
Westchase Hilton events, and the other will be downtown mainly
for Petroleum Club events. Previously the Society has had to
depend on the generosity of sponsoring companies and individ-
uals for its projection needs.
Technology has changed the paradigm of
technical presentations. A decade ago most
geoscience talks were supported by 35mm
slides or overhead displays. Now most talks
are given from PowerPoint presentations and
projected directly from a laptop computer
onto the screen. Initially the cost of these pro-
jection systems was very high and required
permanent hardware. In recent years portable
projection systems have been developed and
their cost, though initially high, has come
down significantly.
The HGS now owns two Mitsubishi XD300U Colorview
Projectors at a cost of about $3000 apiece. Until recently most
multi-media projectors employed “flat-panel” technology, essen-
tially the same concept used in viewing a laptop computer screen
except projected onto a remote screen via reflected light. The
result was good at short screen distance and relatively small
image size; with longer throw and greater image size considerable
fading and blurring was common.
All projection technology involves an interface or “video card”
between the computer and its corresponding monitor. Video
cards were designed to view a computer image on a monitor
using LCD or “liquid crystal digital” visual elements. Most pro-
jection systems attempt to simulate LCD visual affects on a
projection screen using reflected light. The simplest video cards
are called VGA or “video graphics array” cards and are defined by
a resolution range from 320 × 200 to 640 × 480 pixels (a pixel is a
“picture cell,” literally the smallest, two-dimensional element of a
monitor display, similar to a “dot” in graphic terminology) and
employ from a few to 256 colors. This results in an image of
307,200 pixels. When projected onto a large monitor or screen
the resulting image is limited by this basic element size and tends
to look fragmented or “pixelated.”
A later modification of video array technology resulted in SVGA
or “super” VGA cards that were capable of 800 x 600 pixel resolu-
tion (480,000 pixels). Still higher resolution was achieved with
the development of TFT or “thin film transistor” arrays that
involve resolutions of up to 1024 × 768 pixels (786,434 pixels).
TFT is also called an “active matrix” screen in monitor terminol-
ogy. VGA, SVGA, and TFT are not really distinct array card types
but rather the resolution level the video card is capable of resolv-
ing. A still higher resolution is called SXGA or “super extended
graphics array” that permits 1280 × 1024 pixel resolution (about
1.3 million pixels).
Our new HGS projectors use a new projec-
tion technology called DLP or “digital light
projection” specifically developed to address
remote projection rather than simulation of
an LCD display. This technology was devel-
oped by Texas Instruments to avoid blurring
and fading. DLP is a fundamentally different
technology than earlier video cards that takes
a monochrome signal from the computer
and distributes it to a DMD or “digital micro
mirror device,” a special board that contains
tiny mirrors on a special microchip. Each
micro-mirror cluster has a rotating color
wheel that divides the monochrome signal
into its spectral components as it is projected to the screen. The
result is a new level of clarity and color fidelity that eliminates
the fading and blurring that resulted from older flat-panel pro-
jection systems.
Image brightness is yet
another criterion of
image appearance and is
measured in lumens. A
lumen is the measure of
a unit area of illumina-
tion. While illumination is
somewhat more subjective than
resolution a threshold generally considered
acceptable illumination for projection screens is about
1000 ANSI (American National Standards Institute) lumens.
The new HGS projectors have SXGA 1280×1024 resolution (1.3
million pixels), 2100 ANSI lumens of brightness, and use DLP
projection technology. DLP permits use of 65,000 colors rather
than the standard 256. Color balance and fidelity are therefore at
the highest level. By any and all measures our organization now
owns two of the most advanced image projectors available. Each
projector weighs only 6 pounds and is portable in a laptop soft
case. Their operation is simple, and they require only 2 minutes
to cool after use. The new projectors were first used October 13,
2003, at the October HGS General Dinner Meeting, where Ann
Grau and Bob Kidney talked about the Rose and North Shafter
fields in California. ■
Technology has changed
the paradigm of technical
presentations. A decade
ago most geoscience
talks were supported by
35mm slides or overhead
displays.
HGS Purchases State-of-the-Art Projectorsby Art Berman
Pho
to b
y A
rt B
erm
an
December 2003 Houston Geological Society Bulletin 37
Global Climate Change—The Conflicting Argumentsby Ian G. Bryden and Peter K. J. Robertson
Centre for Environmental Engineering and Sustainable Energy, The Robert Gordon University, Schoolhill, Aberdeen, AB10 1FR.
The Global Climate Change Committee was formed in 2000 with
the following Mission Statement: “To disseminate information
which will facilitate balanced dialog on the topic of ‘Global Climate
Change’ in a scientific framework.” This article was solicited by Jeff
Lund, Global Climate Change Committee Chair and is the latest
attempt to fulfill that mission by providing HGS members and
other readers of the HGS Bulletin a current, objective status report
on the evidence from an authoritative source. Hopefully, HGS
members will be able to use this information to engage and stimu-
late discussions with the general public.
Global Climate Change has been a sub-
ject of emotive debate over the past two
decades. Although there is little disagree-
ment that temperatures in the Northern
Hemisphere have been rising rapidly since
the 1970s, there are exceptionally
polarised opinions over the precise caus-
es of this phenomenon. In this paper we
discuss the basic processes involved in
the green house effect and critically
assess the principal conflicting arguments over what the poten-
tial causes of the observed temperature rises may be. In addition
potential long term effects of climate change will be considered.
1. Introduction and Background.Global climate change is with little doubt the highest profile envi-
ronmental challenge facing the planet this century. Although few
people are informed of problems that water availability will pres-
ent the globe in the 21st Century, nearly everyone is aware of
global warming. The perceived seriousness of the potential global
warming problem at an international level resulted in the estab-
lishment of the Intergovernmental Panel on Climate Change
(IPCC) in 1988. This body was set up to assess anthropogenic
causes of climate change and any potential impacts that would
result. IPCC has engaged scientists from a range of appropriate
disciplines from the international community. To date, IPCC has
prepared three assessment reports in 1990, 1995 and most recently
in 2001 (1), that have been used to advise the international com-
munity through the United Nations Framework Convention on
Climate Change. The Kyoto Protocol to the United Nations
Framework Convention on Climate Change of 1997 committed
developed countries to reducing their emissions of six greenhouse
gases by 5.2% of 1990 levels by 2012. Hence global warming has
also been one of the main driving forces behind recent govern-
ment energy and environmental legislation in the European Union
and the United Kingdom. Not all countries, however, signed up to
this commitment; most significantly the United States refused to
ratify the agreement. Australia has refused to ratify the protocol
unless the US and developing countries became fully involved.
Russia indicated in September 2002 that it would ratify the Kyoto
Protocol but has yet to do so. The United States initially indicated
that its unwillingness to comply with the Kyoto protocol is due to
a lack of convincing evidence that an enhanced global warming
effect is taking place. In June 2002, however, the United States
Environmental Protection Agency submitted a report to the
United Nations which concluded climate change resulted from
human activities (2). The report also recognized that global warm-
ing would continue and, in addition, total
United States greenhouse gas emissions
would increase by 43% over the next 20
years. The US and Russia have indicated
that their opposition to ratifying the
Kyoto agreement results from concerns
that the implementation would result in a
serious impact on their economies.
There has been much research carried
out on what temperature changes have occurred over the past
millennium, together with changes in greenhouse gases and other
factors that influence global warming. Geological evidence has
shown that, over the planet’s lifetime, the climate has changed
significantly, as have the concentrations of greenhouse gases such
as carbon dioxide and methane. This information provides an
important background for the comparison of the effects that have
been observed in the past 150 years. Many have argued that
the current warming that has been observed is due to the Earth
moving into a warmer phase, which has not been influenced by
the change in greenhouse gas concentrations. Others claim there
is a direct causal link between these two factors. This paper will
attempt to look at the evidence presented and discuss the various
arguments for and against the case of global climate change.
2. The Greenhouse Effect2.1 Natural and Enhanced Greenhouse Effect
It should be appreciated that there is nothing unnatural about
the greenhouse effect. It is a well-understood phenomenon,
which acts to regulate the temperature of the earth’s surface,
oceans, and lower atmosphere. The only controversy is whether
or not emissions of gas resulting from human activities, especially
industrially related activities, have already or will, in the future,
appreciably influence the global climate. It is this human
enhanced greenhouse effect which is the cause of so much
debate.
Global climate change is with
little doubt the highest profile
environmental challenge
facing the planet this century.
Global Climate Change continued on page 39
December 2003 Houston Geological Society Bulletin 39
Global Climate Change continued from page 37——————————————--————————————————————------------------------——————
Glo
bal C
limat
e C
hang
e
2.2 Physics of the Greenhouse Effect
2.2.1 Atmospheric Characterisation
Prior to describing the nature of the greenhouse phenomenon, it
is important to appreciate the meaning of the terms stratosphere
and troposphere. The troposphere is the lower atmosphere,
which extends from the surface to an altitude of some 11 km.
This is the layer of atmosphere in which our weather occurs,
which represents an appropriate phenomenological definition of
the troposphere. The stratosphere is the upper atmosphere above
the troposphere and is characterised by a positive temperature
gradient with altitude.
2.2.2 Energy Exchanges
The earth and its atmosphere are exposed to a mean global solar
radiation flux equivalent to approximately 342Wm-2 (3). It is
acknowledged now that the annual global flux does change with
time and this figure should be taken as representative only. The
radiation frequency of this flux ranges from the ultraviolet to near
infrared, which represents wavelengths between 0.1 and 4µm. The
short wavelength ultraviolet is largely absorbed by ozone in the
stratosphere and, to a lesser extent, in the troposphere.
A proportion of the visible and near infrared radiation is reflected
back into space by clouds or atmospheric aerosols. A smaller
proportion is absorbed. Overall some 77Wm-2 of the incident
flux is directly reflected from clouds and other atmospheric
material. Some 30Wm-2 is reflected directly from the surface and
approximately 67Wm-2 is absorbed directly by the atmosphere.
The remaining 163Wm-2 is absorbed by the surface of the Earth.
The land surface, oceans and clouds, which have absorbed the
relatively short wavelength solar radiation, subsequentially emit
long wavelength infrared radiation, with wavelengths in the
range 4 to 50µm. This radiation is prone to absorption in the tro-
posphere and, therefore, contributes to the warming of the lower
atmosphere and, consequentially, the surface.
The proportion of the infrared radiation, which is absorbed
rather than escaping into space, is affected by the composition of
the troposphere. Gases, which make a particular contribution to
infrared absorption include, in order of significance: water
vapour (H2O), carbon dioxide (CO2), ozone (O3), methane
(CH4) and nitrous oxide (N2O).
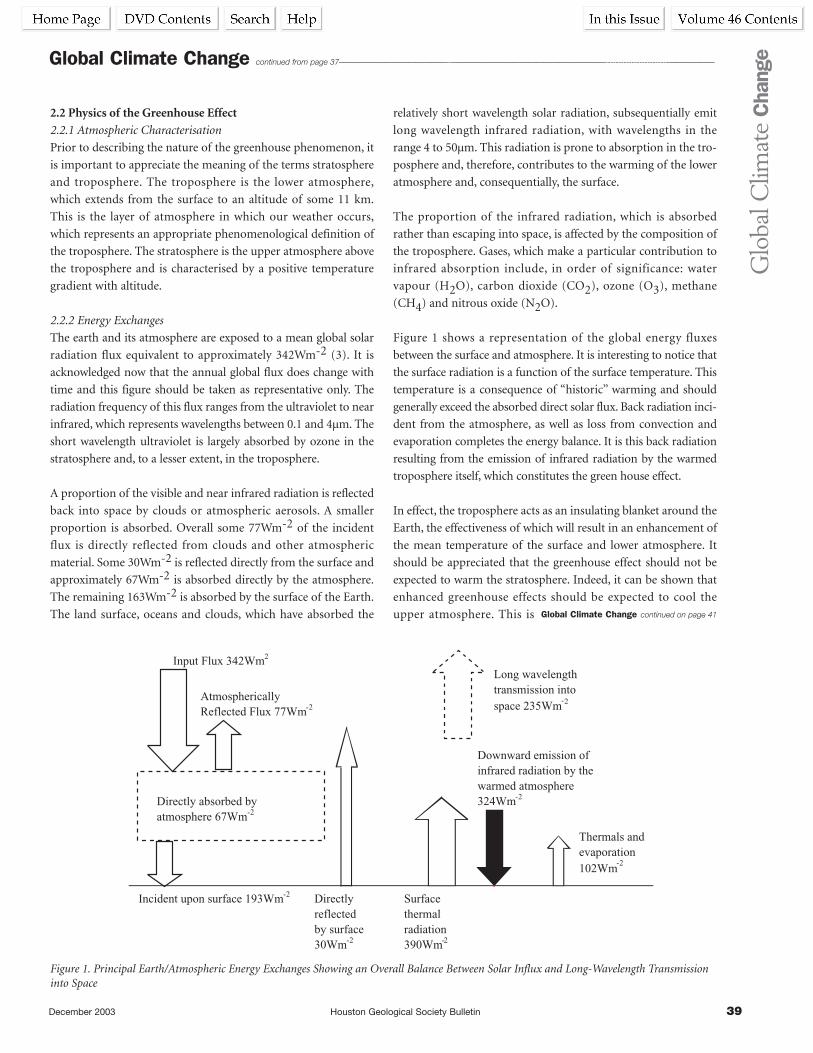
Figure 1 shows a representation of the global energy fluxes
between the surface and atmosphere. It is interesting to notice that
the surface radiation is a function of the surface temperature. This
temperature is a consequence of “historic” warming and should
generally exceed the absorbed direct solar flux. Back radiation inci-
dent from the atmosphere, as well as loss from convection and
evaporation completes the energy balance. It is this back radiation
resulting from the emission of infrared radiation by the warmed
troposphere itself, which constitutes the green house effect.
In effect, the troposphere acts as an insulating blanket around the
Earth, the effectiveness of which will result in an enhancement of
the mean temperature of the surface and lower atmosphere. It
should be appreciated that the greenhouse effect should not be
expected to warm the stratosphere. Indeed, it can be shown that
enhanced greenhouse effects should be expected to cool the
upper atmosphere. This is Global Climate Change continued on page 41
Figure 1. Principal Earth/Atmospheric Energy Exchanges Showing an Overall Balance Between Solar Influx and Long-Wavelength Transmissioninto Space
Input Flux 342Wm2
Atmospherically Reflected Flux 77Wm-2
Incident upon surface 193Wm-2
Directly absorbed by atmosphere 67Wm-2
Surface thermal radiation 390Wm-2
Downward emission of infrared radiation by the warmed atmosphere 324Wm-2
Thermals and evaporation102Wm-2
Directly reflected by surface 30Wm-2
Long wavelength transmission into space 235Wm
-2
December 2003 Houston Geological Society Bulletin 41
Global Climate Change continued from page 39——————————————--————————————————————------------------------——————
Glo
bal C
limat
e C
hang
e
because the insulating properties of the lower atmosphere
reduces the heating of the stratosphere, which results in a cooler
outer atmospheric layer and the emission of less long wavelength
infrared radiation to space. There is an analogy here with the
effect of insulating a house loft. During snow falls, insulated
homes are obvious by the presence of snow lying on the roof,
indicating low roof temperatures, while snow will melt rapidly
from the roofs of poorly insulated homes.
When considering the influence of the energy balance between
the surface and the atmosphere, it is beneficial to consider the
overall net radiation flux into the earth atmosphere system
because of the very high level of thermal coupling between the
surface and the troposphere.
The greenhouse effect maintains the habitability of the Earth. In
the absence of the back radiation from the atmosphere, present
surface temperatures would induce a substantial imbalance in
the input/output fluxes. This would result in rapid surface cooling
until a balance was achieved with a considerably reduced surface
temperature. This would be substantially below the freezing
point of water and insufficient to support life.
As long as the total energy input and output from the
earth/atmosphere systems remains in balance, there will be not
be any change in the temperature of either the earth surface or
atmosphere. There will, of course, be wide short term variations,
which are, in effect, manifestations of our short term weather
and longer term annual variations.
Modern concerns about the enhanced greenhouse effect relate to
changes in the tropospheric absorption of long wavelength
infrared radiation emitted by the Earth surface, resulting from
changes in atmospheric composition. Water vapour and carbon
dioxide occur naturally within the atmosphere and form the pri-
mary chemical drivers of the natural greenhouse effect. We now
know, however, that the proportion of carbon dioxide, ozone,
methane and nitrous oxide have risen substantially as a result of
human activity since the industrial revolution.
Radiative Forcing
The term radiative forcing is generally taken as referring to the net
change in energy flux into the atmosphere/earth system resulting
from a perturbation from a stable state. This makes it a key indi-
cator of changes resulting from modifications in the atmospheric
composition, solar radiation or other potential variables. It is a
particularly useful concept in assessing the influence of anthro-
pogenic changes in CO2 levels and other greenhouse gasses.
Somewhat confusingly there are two related representations of
radiative forcing. These are:
Instantaneous Radiative Forcing
This refers to the change in net energy flux into the atmos-
phere/Earth system resulting from a change in state and before
any readjustment in temperature within the system.
Adjusted Radiative Forcing
Stratospheric temperatures respond rapidly to any changes in the
tropospheric state or the solar energy incidence. An increase in
energy absorption in the troposphere, which would result in an
instantaneous increase in the overall net energy flux into the
earth/atmosphere system, will cause a reduction in stratospheric
temperatures. This would then result in a compensating reduc-
tion in the overall net flux.
2.3 Factors Influencing the Magnitude of the Greenhouse
Effect
The net energy flux into the Earth/Atmosphere system is influenced
by a wide range of, frequently interdependent factors, most of which
have been discussed in section 3.2. The reflectivity of the atmos-
phere to the incident short wave radiation is obviously significant, as
is the solar intensity. The reflectivity of the surface and clouds is also
of direct importance. Much has, for example, been written about the
implications of a highly reflective snow covered planet.
The effectiveness of the troposphere as an insulating layer
depends upon the concentration of the principal greenhouse
active gases and the effectiveness of each of these gases.
Changes in the greenhouse equilibrium of the atmosphere are
driven by changes in concentration of greenhouse active gases
and the radiative properties of each gas. Similarly, microscopic
airborne particles or droplets (aerosols) in the troposphere can
reflect solar radiation, which can lead to a cooling in the climate.
Changes in aerosol concentrations can also alter quantity of
clouds and cloud reflectivity also resulting in cooling.
Volcanic activity can inject sulphur oxides into the stratosphere,
which are converted to sulphate aerosols (1). This results in cool-
ing but the effects are usually transitory affecting temperatures
for only a few years. Solar activity changes roughly every 11 years
(about 0.1% energy change). This may have either a warming or
a cooling effect. In addition, over tens to thousands of years, slow
variations in the Earth’s orbit have led to changes in the seasonal
and latitudinal distribution of solar radiation (1).
All of these mechanisms have had a significant influence on
climatic variations in the past, for example the glacial and inter-
glacial cycles. When radiative changes occur, the climate
responds on a variety of time-scales. The longest of these are
due to the large heat capacity of the deep ocean and dynamic
adjustment of the ice Global Climate Change continued on page 43
December 2003 Houston Geological Society Bulletin 43
sheets. Consequently the climate response to such changes
(either positive or negative) may last thousands of years.
Any changes in the radiative balance of the Earth will alter the
hydrological cycles and atmospheric and oceanic circulation.
This will affect weather patterns and regional temperatures and
precipitation. Any human-induced climate changes will be
embedded in a background of natural climatic variations that
occur on a range of time- and space-scales. The question to be
addressed is, are the observed climate change affects a result of
human or natural phenomena?
3. Data on Temperature Rise and Atmospheric GasContent Since the late 19th century the global surface temperature has
increased by around 0.6C°. The 1990s has been the warmest
decade, while 2002 was the warmest year since 1861, when
instrumental records began. Global warming has been most
pronounced in the Northern Hemisphere, where the tempera-
ture increase has accelerated to around 0.1°C per decade since
the 1950s. This temperature rise has accelerated further since
1979 with a rise of 0.15 °C per decade recorded (1). While these
temperature rises have been observed in the lower troposphere,
there have been no significant temperature increases in the
upper troposphere while significant cooling has been observed
in the stratosphere. As discussed in an earlier section, this apparent
paradox is a predicted feature of an enhanced greenhouse effect!
It is difficult to draw any significant conclusions on climate
change using data recorded over a relatively short (150 year)
period. It is therefore important to consider temperature
changes prior to those observed since records began in 1861.
Over the past twenty years there has been a significant improve-
ment in the knowledge of temperature trends during the
previous millennium. Data have been obtained from a number
of sources, primarily gas bubbles trapped in ice cores taken in
Greenland and Antarctica (3). From this research it is apparent
that temperature in the Northern Hemisphere has been far from
stable over this period. In particular the “Medieval Warm
Period” occurred between the 11th to 14th centuries. This was
followed by what is often referred to as the “Little Ice Age”
between the 15th and 19th centuries. Consequently some
researchers have argued that the temperature increase observed
over the past 150 years is a recovery from the cool period
between the 15th and 19th Centuries. What appears to be signif-
icant is the fact the rate of temperature increase over this period
is significantly greater than any other temperature fluctuations
observed over the past millennium.
There would, therefore, appear to be little argument that tem-
peratures have increased since 1861 and the rate of increase is
accelerating. The cause of this effect is, however, the subject of
this great debate. One of the main arguments presented is the
increase in greenhouse gasses over the same period as the
temperature rise. The concentrations of greenhouse gases over
the millennium were generally stable. Since the 1850s there has
been a clear increase in the atmospheric concentration of each
greenhouse gas.
The concentration of carbon dioxide (CO2) has increased from
280 parts per million (ppm) in 1750 to 370 ppm in 2002 (1).
This increase in concentration of CO2 together with the associated
radiative forcing contributes around 60% of the effect of all the
greenhouse gases. There has also been a significant acceleration
in the rate of increase in CO2 concentration during the 20th
century. The increase of CO2 has resulted from a combination
of factors including combustion of carbonous materials such as
fossil fuels (1,3). Different fuels output different quantities of
CO2 when combusted, ranging from coal which releases up to
26.6 kg of carbon per GJ of energy released, while natural gas
releases around 14 kg of carbon per GJ of energy (3).
Deforestation is also associated with the increase in CO2. This is
through a combination of CO2 released from decaying material,
combustion of the forests and the reduction in foliage available
to absorb CO2 through photosynthesis (3).
The atmospheric concentration of methane has also significantly
increased over the same period from 700ppb in 1750 to a current
level of 1745 ppb (1). This is still increasing; however the rate
has started to decrease. Methane is approximately equally
produced from natural and anthropogenic sources. The anthro-
pogenic sources include combustion of fossil fuels, biomass
combustion, landfill and sewage plant operations and totals up
to 615 Tg per year. Farm animals also generate a not insignificant
quantity of methane (up to 100 Tg per year) (3) but good taste
prevents us from discussing the production mechanism!
The direct radiative forcing from methane has been estimated
to be in the order of 20% of the total for greenhouse gasses at
0.48 Wm-2.
Nitrous oxide also results from both natural and anthropogenic
sources, in particular nitrogenous fertilisers. Over the period
1980 to 1998 the atmospheric concentration of nitrous oxide
has increased at around 0.25% per year and the concentration in
the atmosphere in 1998 is 16% greater than in 1750 (314 and
270 ppb, respectively) (1). The radiative forcing of nitrous oxide
is around 0.15 Wm-2 or 6% of the total greenhouse gas radiative
forcing.
Halocarbons present a particular problem, as some are extremely
effective infra red absorbers (up to 22,000 times that of CO2)
and are exceptionally
Global Climate Change continued from page 41——————————————--————————————————————------------------------——————
Glo
bal C
limat
e C
hang
e
Global Climate Change continued on page 45
December 2003 Houston Geological Society Bulletin 45
persistent, remaining in the atmosphere for 100 years or, in the
case of perfluoromethane, 50,000 years (1). Action taken by
many governments as a result of the Montreal Protocol has
resulted in a decrease in many of these compounds, in particular
chlorofluorocarbons, which have been associated with the
depletion of the stratospheric ozone layer. The rate of increase
of other compounds has started to decrease. These compounds
are almost entirely produced from anthropogenic sources such
as refrigerants or cleaning and degreasing fluids. The total radia-
tive forcing of halocarbons has been estimated to be of the order
of 0.34 Wm-2, (14% of the radiative forcing from all greenhouse
gases) (1).
Ozone is generated indirectly in the atmosphere via photochem-
ical processes involving oxygen with high energy ultraviolet (UV)
light. The residence time of ozone in the atmosphere is relatively
short (weeks to months). In the past twenty years the reduction
of the ozone layer in the stratosphere has resulted in a cooling of
the surface troposphere. This cooling is believed to have offset
the warming effects of the other greenhouse gases. In addition
the thinning in the ozone layer also allows the transmission of
more UV light. This UV light can promote the photochemical
degradation of species such as methane and halocarbons in the
atmosphere (1).
Over the longer term, geological data have indicated that the cur-
rent concentrations of these gases, with the exception of ozone,
are currently at their highest level for 420,000 years (1).
Data on changes in water vapour are more difficult to obtain.
The water vapour in the lower atmosphere will increase with
increasing temperature. This in-turn will have an additional
warming effect (4). Water vapour can also condense forming
clouds. Clouds may have either a warming or a cooling effect.
The cloud cover will keep heat within the lower atmosphere
through reflection. Conversely it can also prevent heat from
reaching the surface of the planet by blocking solar radiation.
Data on water vapour changes is available only for the past three
decades. These data indicates an increase in water vapour of
between 3 and 10% per decade (3).
The atmospheric concentrations of aerosols in the troposphere
have also increased due to particulate emissions from anthro-
pogenic sources such as combustion, energy generation
or vehicle emissions. These aerosols are composed of a
combination of particles including sulphate, fossil fuel organic
carbon and fossil fuel black carbon, which may have either a
warming or cooling effect. The physical/chemical characteristics
and spatial distribution of the aerosols will influence the
magnitude of the radiative forcing, which will have an overall
cooling effect (1).
4. The Arguments Whether or Not AnthropogenicSources influence the Greenhouse EffectThe consensus among many scientists and policy makers is that
the observed temperature rise over the past 150 years is a direct
consequence of the rise in greenhouse gas concentration (1,4)
There have been other groups that have forcefully expressed
their doubts that the enhanced warming is due to these factors
and is a natural phenomenon.
A common argument used by sceptics is that the planet is a
dynamic environment and that changes in temperature over the
past 150 years are insignificant when observed over the lifetime
of the planet. Although it is agreed that the planet has gone
through phases of significant temperature change, what is
significant about the recent observed warming is the rate
of temperature increase, rather than just the magnitude of
increase.
A criticism that has been used against the argument for human
influence in climate change is that the temperature change has
coincided with the increase in greenhouse gas emission. It has
been argued that there should be a lag between the build up in
greenhouse gas concentrations in the atmosphere and the
increase in temperature. In addition, it is also claimed that the
greenhouse gas emissions have been too small to account for the
observed temperature changes. If this argument holds any truth,
then the long term consequences could be even more worrying
for us, as it implies that we have not yet experienced the full
impact of changes in the atmosphere!
The way in which, and the locations where, the data have
been gathered have also been criticised. Regrettably, research
into global phenomena will always depend on a variety of
measurements, many of them indirect by nature. There should
now, as a matter of urgency, be an international effort to improve
the quality of data measurement. The United States and other
developed nations would appear to be the best prepared to fund
and implement such a programme. In particular as the energy
industry has much of the infrastructure to resource such a
programme, this sector should take a leading role in these
activities.
Another argument against global warming is the influence of
solar activity. It has been claimed that the warming is due to
increased solar activity and some models have been presented
that match the increase in warming with higher solar activity
and this has resulted in a 0.3 °C increase in temperature
observed over the past 20 years.
Frohlich and Lean (5) compared the composite total solar
irradiance (TSI) record
Global Climate Change continued from page 43——————————————--————————————————————------------------------——————
Glo
bal C
limat
e C
hang
e
Global Climate Change continued on page 47
December 2003 Houston Geological Society Bulletin 47
Global Climate Change continued from page 45——————————————--————————————————————------------------------——————
Glo
bal C
limat
e C
hang
e
measured by space craft over a 23 year period with an empirical
model of TSI variations. The authors discussed how, using these
records to extrapolate back to around 1650, it could be demon-
strated that solar change has resulted in up to a 0.4 °C increase
in temperature. This would suggest that the observed warming
is a result of changes in solar activity and post industrial green-
house gas emission would have little effect on climate change.
The way in which much of the solar variability data was gathered
has recently been criticised. It has been claimed the drifts in
instrument sensitivities were not accounted for when making
measurements (6).
5. Potential Long-Term Effects of Climate ChangeThere are a number of potential effects which may have either a
negative or in some cases a positive impact. The predicted effects
will vary over different latitudes in the planet and include
changes in sea level, precipitation, water availability and food
production. It is important to consider that whether or not the
temperature increase results from human influence, these
changes may result from the warmer climate that we are experi-
encing. The argument over the magnitude of the anthropogenic
influence on climate change is therefore of little consequence
when considering such effects.
The major potential consequence is a rise in sea level. This has
been predicted to result from a combination of melting glaciers
and polar ice caps or more significantly thermal expansion of
the sea due to the increased surface temperature. A reduction of
Arctic sea ice has been observed in the spring and summer of
between 10 and 15%. The annual loss of ice from glaciers in the
central Asian state of Kazakhstan has been reported to be nearly
two cubic kilometres in the latter part of 20th Century (7). In
contrast, no reduction of Antarctic ice has been observed with
even a slight increase being reported (1). The rate of global
mean sea level increase was reported to be in the range 1.0 to 2.0
mm per annum during the 20th century (1). It should be noted
that the increase in sea level is unlikely to be affected by the
melting of the Artic ice, since this is floating no net water level
rise should result. The rise in sea level may have a number of
effects including increase coastal erosion, and flooding of low
lying lands and islands. An example would be Bangladesh,
where flooding could result in loss of 10% of land. (1,8). In par-
ticular, the rice fields could be reduced by 50% affecting the
livelihood of over 5 million people (9). Coastal aquifers may be
damaged by saline intrusion as salty groundwater rises. The
movement of the salt-front up estuaries would affect freshwater
pumping plants upriver.
Ironically, large scale climatic change could severely modify the
nature of the North Atlantic drift pattern and plunge North West
Europe into an extended period of very severe winters similar to
those of the equivalent latitudes on the Canadian east coast. The
impact of such changes on the heavily populated European
Atlantic margin could be regrettable.
An increase in rainfall has also been predicted for several regions
in the Northern Hemisphere. As the temperature increases there
is an increase in evaporation and the warmer air can hold more
moisture. This subsequently leads to an increase in rainfall. The
hydrological cycle is however exceptionally complex and how the
change in rainfall will affect surface water and vegetation is diffi-
cult to predict. During the 20th century an increase in annual
land rainfall of around 0.5 to 1% per decade was observed in the
middle and high latitudes of the Northern Hemisphere (1).
As a consequence of the changes in precipitation, water availability
will be another consequence of climate change. Some models
predict that rainfall will be significantly more torrential, leading to
more flooding. This may in turn result in less water being taken up
by soil which will alter ground and surface water supplies. In addi-
tion, while some areas will experience more rainfall others will have
less. While there will be increased availability in high latitudes of the
Northern Hemisphere, decreases are predicted for southern Europe,
the Middle East, central Asia and Africa (1,9). Arid and semi-arid
areas, deltas, low-lying coasts, and small islands will be particularly
vulnerable. The water availability problems will particularly affect
developing countries and add to the demand for water resulting
from economic development and population growth. Many of these
areas already experience serious difficulties from water shortage so
the problems are likely to be exacerbated. The Middle East, for
example, currently has 1% of the Worlds available water and 5% of
the population (10). The problems with water availability in this
region may potentially lead to further political instability in this
already very unsettled region of the globe. It has even been suggested
that areas such as Ireland may experience water shortages as a result
of climate change (10). The Irish Environmental Protection Agency
has warned that, although rainfall in the winter may increase by
10%, there may be a summer rainfall reduction of up to 40% in the
south and east coast of Ireland (11).
The increase in CO2 concentration coupled with the warmer
climate may increase cereal crop yields in the middle and high
latitudes of the Northern Hemisphere (4). Unfortunately in the
Middle East, India and Africa crop yields would be reduced.
Reduced rainfall and water runoff would cause a reduction in
soil moisture which will affect crop growth. The change in water
temperature resulting from climate change will affect the ecology
of water systems. Nutrient and dissolved oxygen levels may also
be affected. A recent report in Nature (12) has also reported a
potential link between climate warming and fish harvests in
Africa. The sardine harvest Global Climate Change continued on page 49

December 2003 Houston Geological Society Bulletin 49
Global Climate Change continued from page 47——————————————--————————————————————------------------------——————
Glo
bal C
limat
e C
hang
e
in Lake Tanganyika has reduced by around 50% since the 1970s
and has been associated with an increase in air temperatures
over the lake of 1.5 °C (12). This has resulted in a reduction in
the algal growth which is the main source of food for the fish.
6. ConclusionsThere is clearly no overall consensus on the human contribution
to the greenhouse effect and the relationship between
the observed temperature increases over the past century. Much
of the disagreements concern the nature of data and the way
in which they are gathered and presented by both sides in
the debate. A criticism that could be levelled at both sides is
that interested parties have a specific bias based on their own
viewpoint and, consequentially, interpret data to support their
view and criticise data which does not support their position.
Environmentalists frequently attempt to use the greenhouse
argument to justify the creation of a non-industrial society.
Irrespective of whether or not there is an irrefutable link between
greenhouse gas emission and global temperature rise, technology
has to be the solution to problems created by global climate
change. Equally it is not safe to take the attitude that there is no
link between atmospheric emissions and climate change.
The evidence that is available at present does suggest a link
between anthropogenic gas emission and global warming. What
is not known yet is the magnitude of this relationship. It is clear
that the potential association between gas emission and climate
change can not just be ignored and underlying physics suggests
there is a connection. It is vital that society takes steps to
implement a comprehensive monitoring programme to establish
the extent of the link and any potential future impacts. This will
aid governments to undertake any associated planning that might
be necessary to accommodate any climatic reaction and subsequent
global consequences. This may have a two fold impact to industry.
New opportunities for development of technology to address the
impacts of climate change may be required, opening up a whole
new prospective market. Unfortunately there may be additional
financial burdens in terms of more stringent emission control
requirements and higher insurance costs. Irrespective of whether
there is a proven detrimental consequence of artificial greenhouse
gas emissions the energy production industries are not responsible
for this. It is the consumers who should be considered culpable;
the energy industries only meet their demands. ■
References1. “Climate Change 2001: The Scientific Basis. Contribution of Working Group
I to the Third Assessment Report of the Intergovernmental Panel on Climate
Change”, Eds. J.T. Houghton, Y. Ding, D.J. Griggs, M. Noguer, P.J. van der
Linden, X. Dai, K. Maskell & C.A. Johnson, Cambridge University Press, 2001.
2. BBC News Report, http://news.bbc.co.uk/1/hi/world/americas/
2023835.stm
3. L. D. Danny Harvey, “Climate and Global Environmental Change”, Prentice
Hall, 1999.
4. The Royal Commission on Environmental Pollution Twenty Second
Report, “Energy-The Changing Climate”, 2000.
5. C. Frohlich, and J Lean, “ Solar irradiance variability and climate”,
Astronomische Nachrichten 2002, 323: 203-212.
6. BBC News Report, http://news.bbc.co.uk/1/hi/sci/tech/2925155.stm
7. Stephan Harrison, David Passmore, Igor Severskiy and Nina Pimankina,
“Glacier fluctuations, climate change and water supply in the Zailiiskiy
Alatau mountains, Kazakhstan”, paper presented at Royal Geographical
Society International Annual Conference 2003 London, 3-5 September 2003.
8. Energy White Paper, “Our energy future- creating low carbon economy”,
2003, The Stationery Office, Norwich, UK.
9. Climate change: what we know and what we need to know”, The Royal
Society Policy Document 22/02, The Royal Society, 2002.
10. BBC News Report, http://news.bbc.co.uk/1/hi/sci/tech/2859937.stm
11. John Sweeney, Tony Brereton, Clare Byrne, Rosemary Charlton, Chris
Emblow, Rowan Fealy, Nicholas Holden, Mike Jones, Alison Donnelly, Sonja
Moore, Patrick Purser, Ken Byrne, Edward Farrell, Eleanor Mayes, Dan
Minchin, Jim Wilson and John Wilson,” CLIMATE CHANGE: Scenarions &
Impacts for Ireland (2000-LS-5.2.1-M1)”, Environmental Protection Agency ,
Ireland, 2003.
12. Catherine M. O'Reilly, Simone R. Alin, Pierre-Denis Plisnier, Andrew S.
Cohen, Brent A. McKee, “Climate change decreases aquatic ecosystem pro-
ductivity of Lake Tanganyika, Africa”, Nature 2003, 424, 766 – 768.
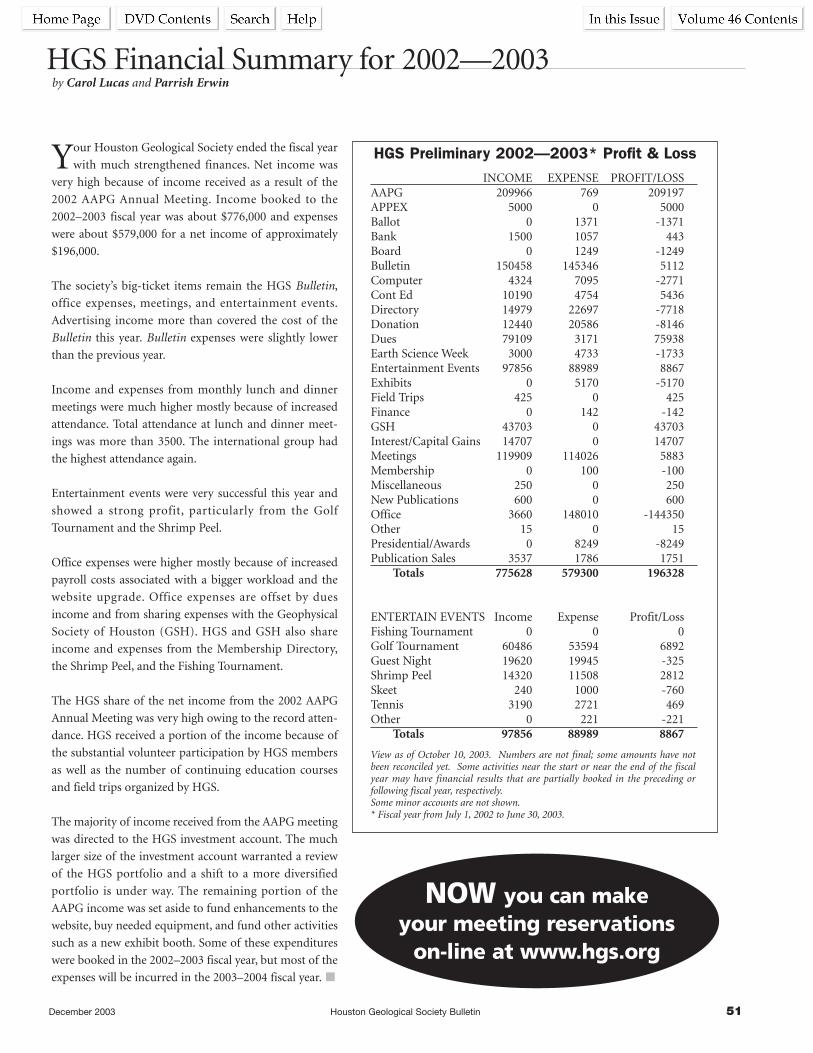
December 2003 Houston Geological Society Bulletin 51
by Carol Lucas and Parrish Erwin
HGS Financial Summary for 2002—2003
Your Houston Geological Society ended the fiscal year
with much strengthened finances. Net income was
very high because of income received as a result of the
2002 AAPG Annual Meeting. Income booked to the
2002–2003 fiscal year was about $776,000 and expenses
were about $579,000 for a net income of approximately
$196,000.
The society’s big-ticket items remain the HGS Bulletin,
office expenses, meetings, and entertainment events.
Advertising income more than covered the cost of the
Bulletin this year. Bulletin expenses were slightly lower
than the previous year.
Income and expenses from monthly lunch and dinner
meetings were much higher mostly because of increased
attendance. Total attendance at lunch and dinner meet-
ings was more than 3500. The international group had
the highest attendance again.
Entertainment events were very successful this year and
showed a strong profit, particularly from the Golf
Tournament and the Shrimp Peel.
Office expenses were higher mostly because of increased
payroll costs associated with a bigger workload and the
website upgrade. Office expenses are offset by dues
income and from sharing expenses with the Geophysical
Society of Houston (GSH). HGS and GSH also share
income and expenses from the Membership Directory,
the Shrimp Peel, and the Fishing Tournament.
The HGS share of the net income from the 2002 AAPG
Annual Meeting was very high owing to the record atten-
dance. HGS received a portion of the income because of
the substantial volunteer participation by HGS members
as well as the number of continuing education courses
and field trips organized by HGS.
The majority of income received from the AAPG meeting
was directed to the HGS investment account. The much
larger size of the investment account warranted a review
of the HGS portfolio and a shift to a more diversified
portfolio is under way. The remaining portion of the
AAPG income was set aside to fund enhancements to the
website, buy needed equipment, and fund other activities
such as a new exhibit booth. Some of these expenditures
were booked in the 2002–2003 fiscal year, but most of the
expenses will be incurred in the 2003–2004 fiscal year. ■
HGS Preliminary 2002—2003* Profit & LossINCOME EXPENSE PROFIT/LOSS
AAPG 209966 769 209197APPEX 5000 0 5000Ballot 0 1371 -1371Bank 1500 1057 443Board 0 1249 -1249Bulletin 150458 145346 5112Computer 4324 7095 -2771Cont Ed 10190 4754 5436Directory 14979 22697 -7718Donation 12440 20586 -8146Dues 79109 3171 75938Earth Science Week 3000 4733 -1733Entertainment Events 97856 88989 8867Exhibits 0 5170 -5170Field Trips 425 0 425Finance 0 142 -142GSH 43703 0 43703Interest/Capital Gains 14707 0 14707Meetings 119909 114026 5883Membership 0 100 -100Miscellaneous 250 0 250New Publications 600 0 600Office 3660 148010 -144350Other 15 0 15Presidential/Awards 0 8249 -8249Publication Sales 3537 1786 1751
Totals 775628 579300 196328
ENTERTAIN EVENTS Income Expense Profit/LossFishing Tournament 0 0 0Golf Tournament 60486 53594 6892Guest Night 19620 19945 -325Shrimp Peel 14320 11508 2812Skeet 240 1000 -760Tennis 3190 2721 469Other 0 221 -221
Totals 97856 88989 8867
View as of October 10, 2003. Numbers are not final; some amounts have notbeen reconciled yet. Some activities near the start or near the end of the fiscalyear may have financial results that are partially booked in the preceding or following fiscal year, respectively.Some minor accounts are not shown.* Fiscal year from July 1, 2002 to June 30, 2003.
NOW you can make your meeting reservations
on-line at www.hgs.org

December 2003 Houston Geological Society Bulletin 53
additional edits where needed. The compiled edits are then sent
back to Lisa, who incorporates the edits and develops a second
draft. Many times the edits have resulted in additional pages. The
printing process requires that the total number of pages in the
Bulletin is a multiple of four. When the pages are not divisible by
four we put our heads together and find interesting pieces of
information that will fill the additional space.
The final Bulletin layout is delivered to Prime Source with a
deadline of the first week of the preceding month of publication.
The printing process takes 10 working days and includes bind-
ing. Pages are printed on 17- by 11-inch sheets, both front and
back (this is where the four-page multiple originates). The sheets
are collated and bound into the Bulletin. Once all 4,000+ copies
are printed and bound, Prime Source submits them to the mail
house. Your name is inkjetted on the Bulletin at the mail house.
The mail house has five days to address and submit copies sorted
for delivery to the US Post Office.
My thanks go to everyone involved for making this effort fun and
rewarding. As a society we have an outstanding membership and
a very talented and enthusiastic Bulletin staff. Without these
people I would be lost. So thanks, everyone. I also want to wish
each and every one of you a very happy holiday season and
remind you that this is your Bulletin, so please let me hear from
you—good or bad, it’s all good! Happy Holidays. ■
A Missing Credit – Allyson K. Anderson, ExxonMobil Exploration
Company, submitted last month’s article entitled “Association for
Women Geoscientists—Re-establish a Local Chapter.”
Editor’s Letter continued from page 9——————————————--————————————————————------------------------——————--——————————

56 Houston Geological Society Bulletin December 2003
You are invited to become a member ofHouston Geological Auxiliary
2003–2004 dues are $20.00make check payable to Houston Geological Auxiliary and mail to:
Audrey Tomkins • 3007 Stalley • Houston, Texas 77092
HGA YEARBOOK INFORMATION
Last Name First Name Name Tag
Spouse Name Name Tag HGS Members Company
Home Phone Business Phone Business Fax( ) ( ) ( )
Street Address City Zip
Birthday, Month, Day ONLY Email Address Home Fax( )
As a member of HGA you are invited to join
GeoWives2003–2004 dues are $7.50
make check payable to GeoWives and mail to:Dene Grove
12715 PebblebrookHouston, Texas 77024
Please provide the following
Name: ______________________________________________
Sreet Address: ________________________________________
__________________________________________________
City/State/Zip: ______________________________________
__________________________________________________
Telephone: __________________________________________
email: ______________________________________________
by Anne Rogers, Third Vice President
This year HGA will be enjoying its holiday program at the
Great Caruso Dinner theatre on December 4. We can be sure
of an amusing and festive musical entertainment and lunch. The
doors will open at 11 a.m. Tickets are $27 for members of HGA
and HGS and $30 for other guests. Spouses and friends are wel-
come. Suzanne Howell is the Chairperson for this event,
713-467-2140.
With the dark days of winter upon us, the New Year would be a
good time to join one of our two bridge groups which meet reg-
ularly. The Petroleum Club Bridge Group is run by Daisy Wood
and meets on the 3rd Wednesday monthly, 10 a.m.– 2:30 p.m.
For reservations call Daisy at 713-977-7319. The “Cinco Mas”
Group plays on the second Thursday of the month at the Junior
League. Call Audrey Tompkins at 713-686-0005 for reservations.
Save the Day: Bridge/Game Day on Monday, February 16, 2004
GeoWivesWe are celebrating the holidays in two ways this year. Monday,
December 8, following a 10.30 a.m. Brunch at Memorial Drive
Presbyterian Church, 11612 Memorial Drive, we will car pool to
Tremont Retirement Community to sing carols to the residents at
noon. Betty Frost will be accompanying us on the piano. Guests
who enjoy singing carols will be very welcome!
Monday, December 15 at 7 p.m., you are invited to enjoy an
evening at Daisy Woods’. Call Daisy at 713 977-7319 for more
details.
The Boards of HGA and GeoWives wish you all happy and safe
holidays.
HGA and GeoWives News