hh135/hh136-a luminous h2 outflow towards a high-mass protostar
TRANSCRIPT
arX
iv:a
stro
-ph/
0606
472v
1 2
0 Ju
n 20
06
Astronomy & Astrophysicsmanuscript no. hh135 c© ESO 2008February 3, 2008
HH135/HH136 - a luminous H 2 outflow towards a high-massprotostar
R. Gredel1
Max-Planck Institut fur Astronomie, Konigstuhl 17, D-69117 Heidelberg, Germanye-mail:[email protected] ⋆
Received; accepted
ABSTRACT
Context. Molecular hydrogen observations towards Herbig-Haro objects provide the possibility of studying physical processesrelated to starformation.Aims. Observations towards the luminous IRAS source IRAS11101-5928 and the associated Herbig-Haro objects HH135/HH136 are obtainedto understand whether high-mass stars form via the same physical processes as their low-mass counterparts.Methods. Near-infrared imaging and spectroscopy are used to infer H2 excitation characteristics. A theoretical H2 spectrum is constructed froma thermal ro-vibrational population distribution and compared to the observations.Results. The observations reveal the presence of a well-collimated,parsec-sized H2 outflow with a total H2 luminosity of about 2L⊙. The bulkof the molecular gas is characterized by a ro-vibrational excitation temperature of 2000± 200 K. A small fraction (0.3%) of the molecular gasis very hot, with excitation temperatures around 5500 K. Themolecular emission is associated with strong [FeII] emission. The H2 and [FeII]emission characteristics indicate the presence of fast, dissociative J-shocks at speeds ofvs ≈ 100 km s−1. Electron densities ofne = 3500-4000cm−3 are inferred from the [FeII] line ratios.Conclusions. The large H2 luminosity combined with the very large source luminosity suggests that the high-mass protostar that powers theHH135/HH136 flow forms via accretion, but with a significantly increased accretion rate compared to that of low-mass protostars.
Key words. ISM:individual objects: HH135/HH136 - ISM: Herbig-Haro objects - ISM: jets and outflows
1. Introduction
Near-infrared studies of molecular hydrogen emission inHerbig-Haro (HH) objects provide a powerful tool to gaininsight in the physical processes that occur during the earlyphases of low-mass star formation. The total H2 luminositiesare proportional to the accretion rates in the early phases of theprotostellar evolution (Stanke 2000; Froebrich et al. 2003), andthe H2 ro-vibrational population distribution allows us to deter-mine the physical scenarios that are at work in the supersonicjets that form during the accretion phase (McCoey 2004, andreferences therein). A complementary tool to study such re-gions is available via the near-infrared emission lines of [FeII]and other atomic emission lines, that allow us to measure elec-tron densities in the shocked material (e.g., Nisini et al. 2002).
In a number of HH objects, and most prominently in HHobjects that show pronounced [FeII] emission, a temperaturestratification is inferred from the H2 observations, where part ofthe molecular gas reach temperatures above 5000 K (Giannini
Send offprint requests to: R. Gredel⋆ Based on observations collected at the European Southern
Observatory, La Silla, Chile. Figures .1–.4 and Tables .1–.9 are onlyavailable in electronic form via http://www.edpsciences.org
et al. 2004). The combined H2 and [FeII] emission has beenexplained in terms of fast J-type shocks, where the [FeII] emis-sion is produced in dissociative parts of the shocks, and whereH2 arises in the slower, non-dissociative regions (e.g., Gredel1994). Detailed model calculations of J-type shocks with mag-netic precursors confirm such a model, and produce popula-tion distributions where the rotational excitation temperaturesincrease with increasing vibrational state of H2 (e.g., Floweret al. 2003). C-type shocks at largely different physical con-ditions produce similar H2 population distributions, however,and the H2 population distribution alone does not allow us todistinguish between both scenarios (Flower et al. 2003). Thepresence of [FeII] emission is generally interpreted in terms ofdissociative J-type shocks, although it is conceivable that C-type shocks produce [FeII] as well (Le Bourlot et al. 2002).
Near-infrared studies of outflows from intermediate- andhigh-mass star forming regions are rare, either because suchoutflows are not very frequentper se or because high-massstar-forming regions are deeply embedded in general. Someoutflows that are observed from high-luminous sources suchas Orion (105L⊙) lack the high degree of collimation thatis typical for outflows from low-mass star-forming regions.

2 R. Gredel: HH135/HH136 - a luminous H2 outflow towards a high-mass protostar
Other flows that emerge from luminous IRAS sources, such asHH80/81 (2104L⊙, Marti, Rodriguez, & Reipurth 1995), IRAS16547-4247 (6104L⊙, Brooks et al. 2003), or IRAS 18151-1208(2104L⊙, Davis et al. 2004), are highly collimated. It is not clearwhether intermediate- and high-mass stars form in a similarway to low-mass stars, but with enhanced accretion rates, orwhether different processes, such as the merging of low-massprotostars, are at work. Enlarging the sample of near-infraredobservations of regions of intermediate- and high-mass star for-mation and comparing the general properties of their H2 and[FeII] emission with those of low-mass star-forming regions istherefore desirable.
In the following, a study of the molecular outflowHH135/HH136, which is powered by the cold and very lu-minous (104L⊙) IRAS source IRAS11101-5928, is presented.The pair of Herbig-Haro objects HH135/HH136 was discov-ered by Ogura & Walsh (1992) in an objective prism surveyand is located in the bright rimmed cloud No. 64 of Sugitani& Ogura (1994) in the Eastern Carina region. The HII re-gion, also known as Gum 36, is believed to be excited by theopen cluster Stock 13, for which photometric distances of 2.7kpc are available (Steppe 1977). The general morphology ofHH135/HH136 indicates that the two objects are formed at theopposite flow directions of a bipolar flow, which is driven byIRAS11101-5829. The velocity field of the HH135/HH136 re-gion is complex, however, and the fact that the main part ofthe emission from both HH135 and HH136 is blue shifted ledOgura & Walsh (1992) to conclude that HH135 and HH136form two different, independent flows. Near-infrared JHK po-larimetric observations of the associated reflection nebula car-ried out by Tamura et al. (1997) showed that IRAS11101–5829is the only illuminating source of the nebula that is associ-ated with HH135/HH136. A more recent millimetre study byOgura et al. (1998) presented a model that explains the ob-served velocity features and where HH135 and HH136 formpart of a single, bipolar flow driven by IRAS11101-5829. Thisview is supported by the very recent polarimetric observationsby Chrysostomou et al. (2005), who proposed that a strong he-lical magnetic field threading though HH135/HH136 maintainsthe strong collimation of the flow.
The purpose of this paper is to investigate the molecularhydrogen emission of HH135/HH136, and to study how theemission characteristics differ from those of low-mass star-forming regions. The observations are presented in Sect. 2,which also includes a more detailed discussion of the data re-duction method and errors. The imaging results are given inSect. 3.1 and the spectroscopy in Sect. 3.2. Section 3.3 con-tains an analysis of the global properties of the molecular hy-drogen emission, and Sect. 3.4 summarises the results of ananalysis derived from the [FeII] lines, which are observed to-wards HH135/HH136. The main conclusions of this study aresummarized in Sect. 4.
2. Observations and reduction
Near-infrared imaging and spectroscopy of the HH135/HH136complex was carried out in March 1999 and February 2004 atthe La Silla Observatory, using SOFI at the New Technology
Fig. 1. [SII] image of HH135/HH136 and part of the G 36region in Carina. Optical knots in HH136 are labeled fol-lowing the notation by Ogura & Walsh (1992). The crossedsquare south of knot J marks the position of the IRAS sourceIRAS11101-5829. North is up and east is left.
Fig. 2. Gunn z image of HH135/HH136.
Telescope (NTT). Images were obtained at both epochs in threenarrow-band filters NB164, NB212, and NB228, using a pixelscale of 0.′′144/px. Central wavelengths are 1.644µm, 2.124µm, and 2.280µm, respectively, and widths are 0.025µm,0.028µm, and 0.030µm, respectively, for the NB164, NB212,and NB228 filters, according to the information given in theESO web pages. Dithered images were used to construct back-ground subtracted images, including corrections for sky, dark-current, and bias. This method assumes that the background is

R. Gredel: HH135/HH136 - a luminous H2 outflow towards a high-mass protostar 3
constant and does not vary across an image, which is not thecase in the H-band. All images were re-centered to a commonreference, but no effort was made to correct for field distortionacross the image.
In March 1999, spectroscopic observations were obtainedalong three slit positions using the red grism GR in order 1,covering the 1.52–2.52µ wavelength region. The slit was setto a width of 0.′′6, and measurements of the width of individualspectral lines showed that an effective spectral resolution of R= λ/∆λ = 550 was achieved. Spectroscopic observations werealso carried out in February 2004, using the blue grism GB inorder 1 and a slit of 0.′′6, covering the 0.94–1.60µm wavelengthregion at a spectral resolution of R=850. Additional spectrawere gathered using the HR grism in orders 3 and 4, coveringthe 2.0–2.3µm and 1.5–1.8µm wavelength regions, respec-tively. The K- and H-band observations obtained with the HRgrism were carried out with a slit width of 0.′′6 as well. Spectralresolutions, as obtained from the width of the emission lines,were R=1066 and R=1600, respectively. Explicitsky frameswere obtained by moving the object along the slit. This is pos-sible because the infrared emission of HH135/HH136 is ex-tended over about 1 arcmin, compared to the total slit lengthof5 arcmin.
The spectroscopic observations were reduced using theMIDAS long package. The long-slit spectra suffer from a pro-nounced curvature of the spectral lines perpendicular to thedispersion direction, and the distorted 2-D frames were recti-fied by use of a second-order polynomial. Pixel units along thedispersion direction were then transformed into a linear wave-length scale by the use of Xenon-Argon calibration frames.A first-order background subtraction was obtained by build-ing (object - sky) difference frames. Short-term temporaland spatial variations at scales comparable to the length ofthe slit result in residuals in the background in a large num-ber of the difference frames. A second-order sky subtractionwas achieved via the standard technique of extracting the posi-tive and negative spectra from the difference frames and addingthem in the correct sense. Extraction windows to obtain the 1-Dspectra from the 2-D difference frames were typically 12 pix-els along the slit. On the spatial scale of 0.′′29/px, the extractionwindows correspond to solid anglesΩ of about 2 arcsec2 on thesky orΩ = 510−11 sr. The atmospheric transmission was deter-mined via observations of standard stars at slit widths of 0.′′6.Stellar fluxes were measured with a second integration, but slitsopened to 2′′ to minimise slit losses. During the observations,the seeing varied from 0.′′5 to 1.′′5. In phases of poor seeing,the flux conversion factors determined from the stellar obser-vations varied by up to 30%. The highly peaked nature of theline emission in some of the knots, combined with positionalerrors in the slit position for the various grism settings and thenarrow slit of 0.′′6 adopted here, causes differences in the re-ported fluxes towards some of the knots that reach, in the worstcases, a factor of about three (cf. Tables .3 and .4). This is wellillustrated in Fig. 8, which shows that an error of less than 0.′′5in the position of the slit would cause the loss of most of theflux in knot B1. The consequences of these kinds of flux un-certainties for the analysis of the H2 and atomic emission linesin HH135/HH136 are discussed in detail in Sects. 3.2 and 3.4.
Fig. 3. Narrow-band image of the HH135/HH136 region ob-tained in the NB212 filter, which is centered on the (1,0) S(1)H2 emission line near 2.12µm. The three double lines indi-cate slit locations and slit widths for the February 2004 spec-troscopic observations, with position angles of PA= 33, 43,and 45. North is up and east is left.
The tables of Pickles (1998) were used to convert the counts ofthe standard stars to flux units.
In addition to the near-infrared observations, optical im-ages in the [SII] (λcenter = 673nm, FWHM = 6nm) andGunn z(λcut−on = 840 nm) were obtained in April 1993, usingEFOSC2 at the 2.2m telescope and CCD#19. Integration timeswere 300 sec in [SII] and 2100 sec in Gunn z.
3. Results and discussion
The narrow-band [SII] image of the HH135/HH136 region andthe Gunn z image are shown in Figs. 1 and 2. The observationswere obtained during an atmospheric seeing of about 1.′′3. Theimage was re-binned to a pixel scale of 0.′′144 to allow for acomparison with the near-infrared images described below.Theoptical knots in the [SII]-image are labeled following the nota-tion of Ogura & Walsh (1992). A continuum subtracted imageconstructed by use of the Gunn z image shows that the opticalknots HH136-E (IRS9 in the notation of Tamura et al. 1997),HH136-I, and HH136-J are continuum sources with weak ifany [SII] emission. Strong but featureless [SII]-emissionoc-curs towards HH135. The [SII] emission at the southern bound-ary of the imaged region traces the bright rim of Sugitani 64.
3.1. Near-infrared imaging of HH135/HH136
Narrow-band images obtained in the NB212, NB164, andNB228 filters are shown in Figs. 3, 4, and 5, respectively. Theslit locations shown in Fig. 3 are those adopted during theFebruary 2004 observations and correspond to position angles
4 R. Gredel: HH135/HH136 - a luminous H2 outflow towards a high-mass protostar
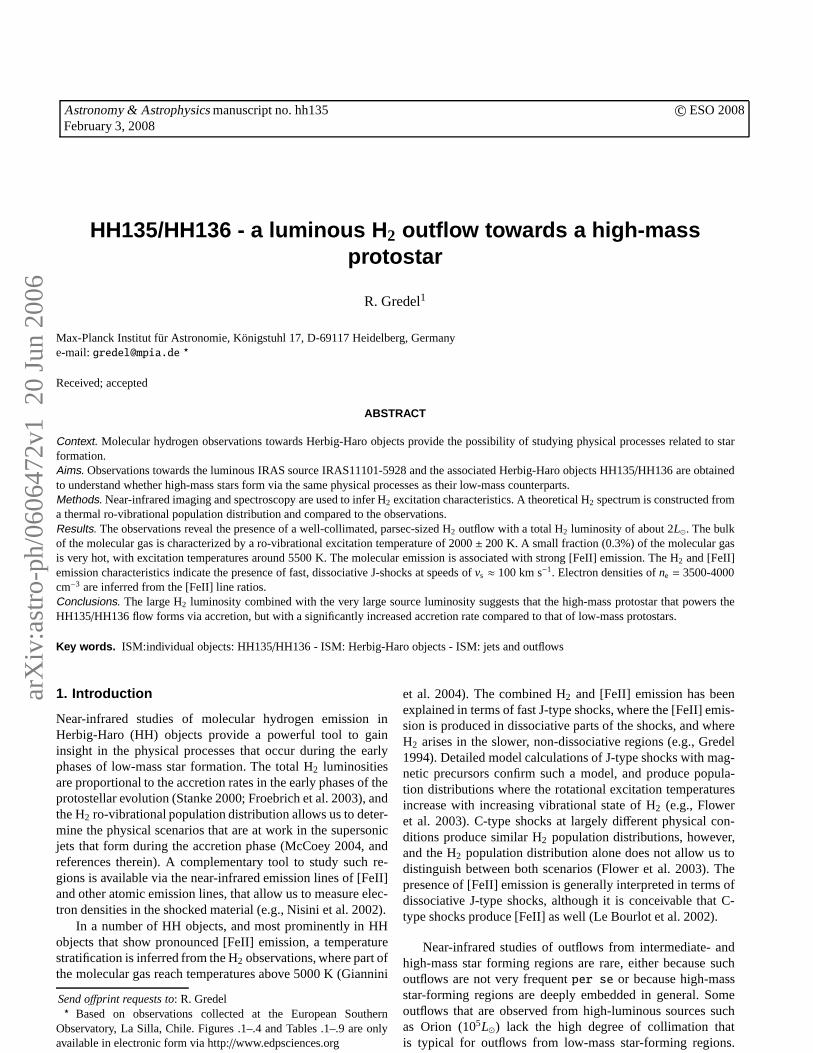
Fig. 4. Narrow-band image of the HH135/HH136 region ob-tained in the NB164 filter, which is centered on the wavelengthof the [FeII]a4D7/2− a4F9/2 emission line near 1.644µm. Thethree double lines indicate slit locations and slit widths for theMarch 1999 spectroscopic observations, with position anglesof PA = 34.5, 38, and 45. North is up and east is left.
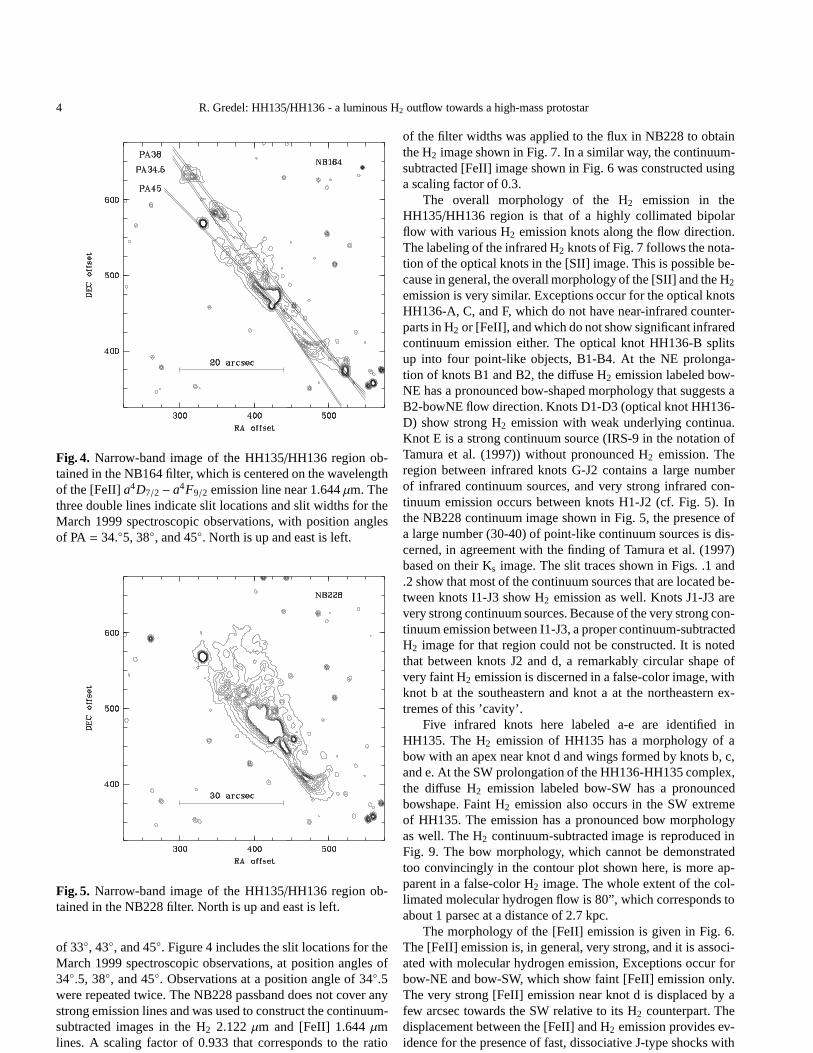
Fig. 5. Narrow-band image of the HH135/HH136 region ob-tained in the NB228 filter. North is up and east is left.
of 33, 43, and 45. Figure 4 includes the slit locations for theMarch 1999 spectroscopic observations, at position anglesof34.5, 38, and 45. Observations at a position angle of 34.5were repeated twice. The NB228 passband does not cover anystrong emission lines and was used to construct the continuum-subtracted images in the H2 2.122µm and [FeII] 1.644µmlines. A scaling factor of 0.933 that corresponds to the ratio
of the filter widths was applied to the flux in NB228 to obtainthe H2 image shown in Fig. 7. In a similar way, the continuum-subtracted [FeII] image shown in Fig. 6 was constructed usinga scaling factor of 0.3.
The overall morphology of the H2 emission in theHH135/HH136 region is that of a highly collimated bipolarflow with various H2 emission knots along the flow direction.The labeling of the infrared H2 knots of Fig. 7 follows the nota-tion of the optical knots in the [SII] image. This is possiblebe-cause in general, the overall morphology of the [SII] and theH2
emission is very similar. Exceptions occur for the optical knotsHH136-A, C, and F, which do not have near-infrared counter-parts in H2 or [FeII], and which do not show significant infraredcontinuum emission either. The optical knot HH136-B splitsup into four point-like objects, B1-B4. At the NE prolonga-tion of knots B1 and B2, the diffuse H2 emission labeled bow-NE has a pronounced bow-shaped morphology that suggests aB2-bowNE flow direction. Knots D1-D3 (optical knot HH136-D) show strong H2 emission with weak underlying continua.Knot E is a strong continuum source (IRS-9 in the notation ofTamura et al. (1997)) without pronounced H2 emission. Theregion between infrared knots G-J2 contains a large numberof infrared continuum sources, and very strong infrared con-tinuum emission occurs between knots H1-J2 (cf. Fig. 5). Inthe NB228 continuum image shown in Fig. 5, the presence ofa large number (30-40) of point-like continuum sources is dis-cerned, in agreement with the finding of Tamura et al. (1997)based on their Ks image. The slit traces shown in Figs. .1 and.2 show that most of the continuum sources that are located be-tween knots I1-J3 show H2 emission as well. Knots J1-J3 arevery strong continuum sources. Because of the very strong con-tinuum emission between I1-J3, a proper continuum-subtractedH2 image for that region could not be constructed. It is notedthat between knots J2 and d, a remarkably circular shape ofvery faint H2 emission is discerned in a false-color image, withknot b at the southeastern and knot a at the northeastern ex-tremes of this ’cavity’.
Five infrared knots here labeled a-e are identified inHH135. The H2 emission of HH135 has a morphology of abow with an apex near knot d and wings formed by knots b, c,and e. At the SW prolongation of the HH136-HH135 complex,the diffuse H2 emission labeled bow-SW has a pronouncedbowshape. Faint H2 emission also occurs in the SW extremeof HH135. The emission has a pronounced bow morphologyas well. The H2 continuum-subtracted image is reproduced inFig. 9. The bow morphology, which cannot be demonstratedtoo convincingly in the contour plot shown here, is more ap-parent in a false-color H2 image. The whole extent of the col-limated molecular hydrogen flow is 80”, which corresponds toabout 1 parsec at a distance of 2.7 kpc.
The morphology of the [FeII] emission is given in Fig. 6.The [FeII] emission is, in general, very strong, and it is associ-ated with molecular hydrogen emission, Exceptions occur forbow-NE and bow-SW, which show faint [FeII] emission only.The very strong [FeII] emission near knot d is displaced by afew arcsec towards the SW relative to its H2 counterpart. Thedisplacement between the [FeII] and H2 emission provides ev-idence for the presence of fast, dissociative J-type shockswith

R. Gredel: HH135/HH136 - a luminous H2 outflow towards a high-mass protostar 5
Fig. 6. Continuum-subtracted image showing the [FeII] 1.64µm emission towards HH135/HH136.
a NE-SW flow direction, where the [FeII] emission arises inthe fast, dissociative parts of the shocks, such as the apex of abow shock, and where H2 arises in slower regions or in obliqueshocks, such as those in the wings of a bowshock.
The NE-extreme of the HH135/HH136 flow is shown inFig. 8, together with the location of a slit at position anglePA=65, which was used in February 2004 to obtain spectraof objects bowNE and knots B1 and B2. The image showsthe continuum-subtracted H2 emission. Object bowNE has apronounced bow shape with knots B1 and B2 located alonga possible SW-NE flow direction. The alignment of bowNE-B2 differs by some 20 from the large-scale alignment of theHH135/HH136 complex, which suggests the presence of a sec-ond flow, that is not powered by IRAS 11101-5829.
The images shown in Figs. 4–7 were obtained in February2004 at a seeing of 0.′′55. Seeing during the March 1999 imag-ing campaign was significantly worse and generally above 1arcsec. A comparison of the images obtained at both epochsdoes not show any spatial displacement of the various knots,which supports the assumption that HH135/HH136 is locatedat the large distance of 2.7 kpc. Thus, no effort was madeto obtain proper motions and displacement vectors from bothepochs.
Fig. 7. Continuum-subtracted image showing the H2 2.122µmemission towards HH135/HH136. The strongest knots are la-beled.
Fig. 8. Morphology of the molecular hydrogen emission at theNE extreme of the HH135/HH136 flow. The double lines in-dicate the position of a slit and its width placed at a positionangle of PA=65.

6 R. Gredel: HH135/HH136 - a luminous H2 outflow towards a high-mass protostar
Fig. 9. Morphology of the molecular hydrogen emission at theSW extreme of the HH135/HH136 flow.
3.2. Molecular hydrogen excitation across theHH135/HH136 flow
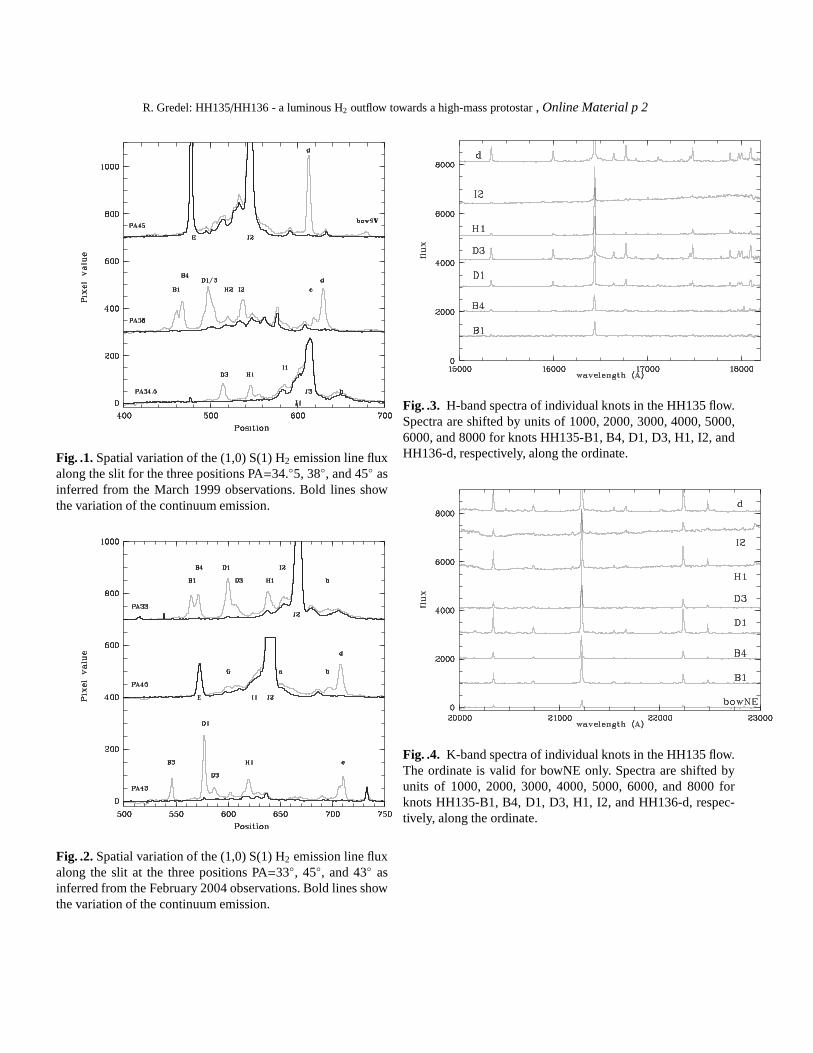
During the March 1999 and February 2004 observing cam-paigns, spectra of the HH135/HH136 complex were obtainedusing a total of 7 slit positions at various position angles acrossthe region. The relatively large number of slit positions wasadopted to investigate possible changes in the H2 excitationacross the HH135/HH136 flow. The variation of the flux in the(1,0) S(1) line of H2 along the various slit positions is shownin Figs. .1–.2. The individual emission knots, as identifiedinFig. 7, are marked in these slit traces. The bold lines repre-sent the flux variation in the continuum along the slit. It canbe seen that many of the H2 emission line knots coincide withfaint, underlying continuum sources. The H- and Ks-band spec-tra are shown in Figs. .3 and .4. Note the very strong continuumemission that is associated with knots H1 and I2.
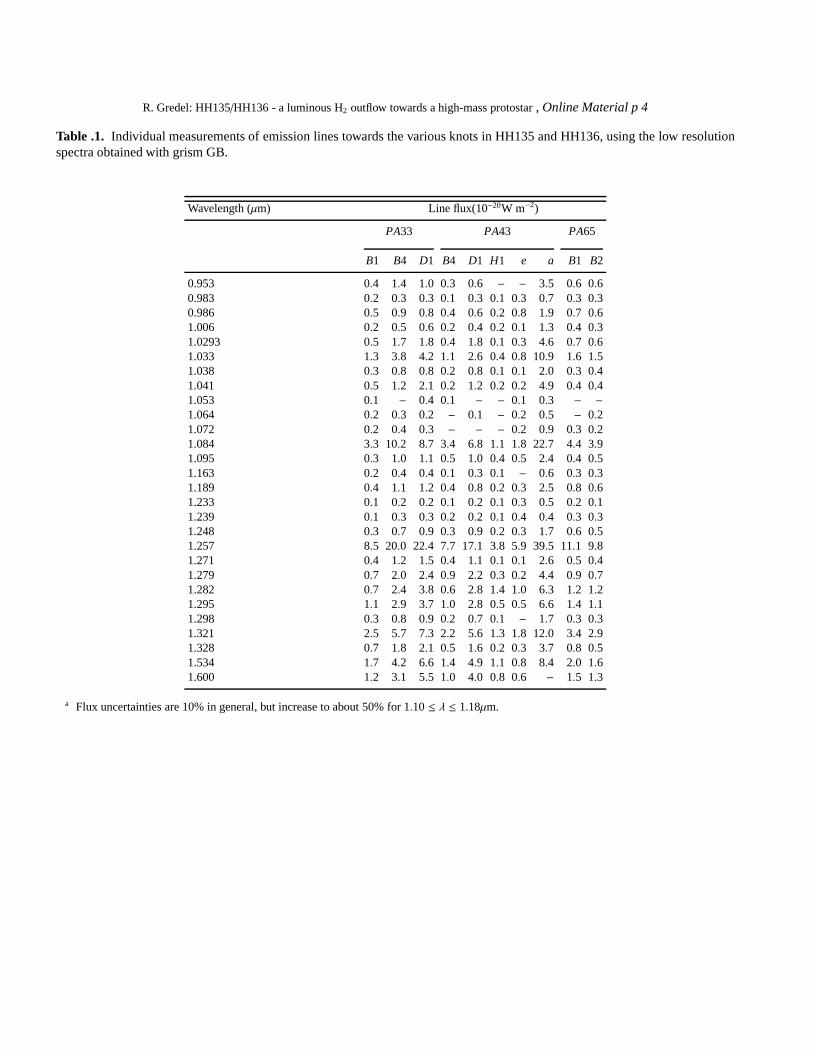
Tables .1 - .4 contain the unreddened line fluxes measuredtowards the various knots. From the analysis of the [FeII] emis-sion lines, a visual extinction ofAV = 2.7 mag is inferred(cf. Sect. 3.4) and was used to obtain the population densi-ties N(v′J′) in the ro-vibrational levels v′J′. A(v′J′v′′J′′) andνare the transition probabilities and wave numbers, respectively.The visual extinction obtained from the [FeII] lines is in excel-lent agreement with the values ofAV = 2.8− 3.1 mag obtainedby Ogura & Walsh (1992) from their optical spectroscopy. Thepopulation densities were used to construct excitation diagramsfor the various knots, where values ofln(N(v′J′)/g are plottedversus excitation energiesE(v′J′) of the ro-vibrational levels.Statistical weights are g= gs(2J′ + 1), where the nuclear-spinstatistical weights gs are 1 and 3 for even and odd rotationallevels J’, respectively. The above analysis implies that the H2
ortho/para ratio is 3, which in J-type shocks is attained at shock
velocities abovevs ≈ 15 km s−1, or vs > 40 km s−1 for C-typeshocks (Wilgenbus et al. 2000).
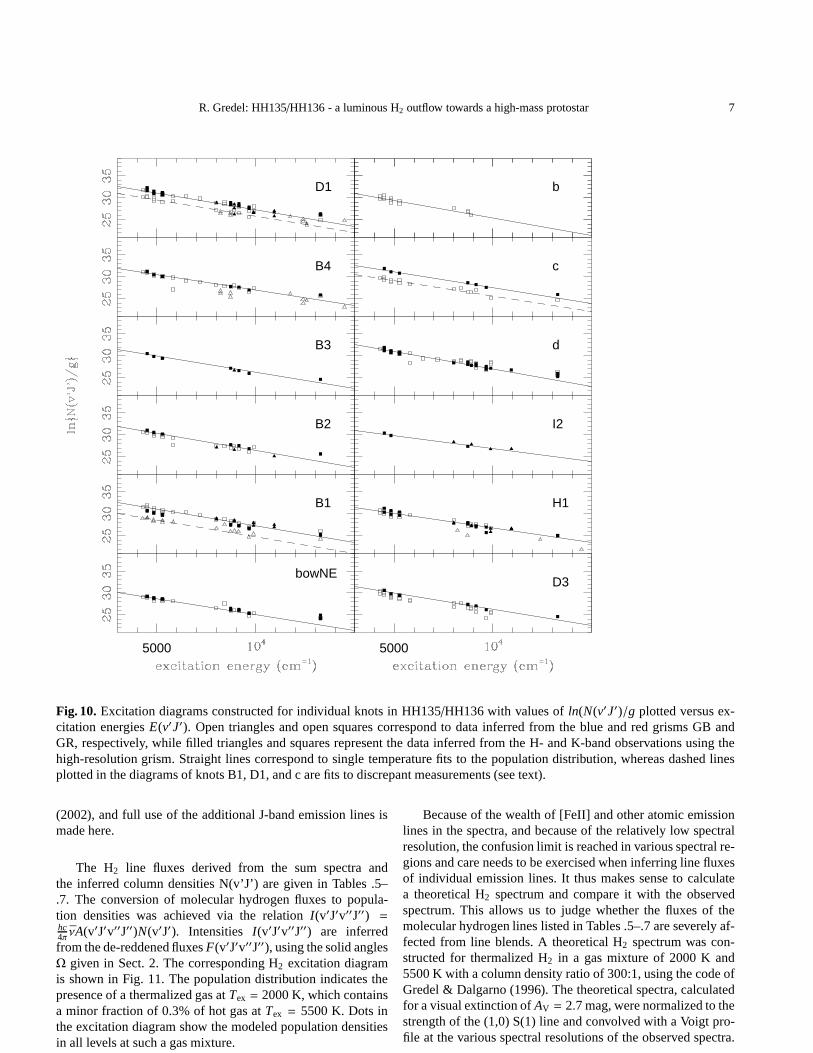
The excitation diagrams for the various knots are shown inFig. 10. Open triangles and open squares correspond to data in-ferred from the blue and red grisms GB and GR, respectively,while filled triangles and squares represent data inferred fromthe H- and K-band observations carried out at the higher spec-tral resolution, respectively. Straight lines fitted to thevariouspopulation distributions show single temperature fits, with val-ues of 1650K for knot c, 1815K for knots b and B2, 1855Kfor knot B4, 1920K for knots B1, B3, D1, D3 and H1, 2030Kfor knot d and bowNE, and 2160K for knot I2. Uncertainties inthe derived excitation temperatures are about 200 K. The tem-perature range among the various knots is extremely narrow,and except for knot c, all data are consistent with a constantexcitation temperature of 2000± 200K.
In a few cases, the population densities inferred from thevarious grism settings for a given knot are not consistent witheach other. This is seen in the excitation diagrams of Fig. 10,where most pronounced discrepancies occur for knots B1, D1,and c. For knot B1, population densities derived from the GBobservations are lower by factors of a few compared to pop-ulation densities derived from GR and the H and Ks grisms.For knots D1 and c, population densities derived from the ob-servations with the GR grism are too low, if compared withthe population densities derived from the GB, H, and Ks obser-vations. The discrepancies do not arise from a larger than as-sumed reddening towards these knots, which would explain thedifferences in knot B1, but not those in D1 and c. They resultfrom relatively severe slit losses during phases of poor seeingand from positional differences in the various grism settings,most pronounced for the GB and GR observations that weretaken several years apart. However, the temperatures derivedfrom the discrepant population densities agree with tempera-tures derived from the remaining data, for a given knot. Thisis illustrated by the dashed lines shown for knots B1, D1, andc, which are temperature fits to the discrepant population den-sities. Thus, discrepancies do not in any way affect the con-clusions derived here concerning the H2 excitation, but theyseverely hamper a more detailed analysis of the [FeII] emis-sion as discussed below.
3.3. Global properties of the H2 emission inHH135/HH136
As demonstrated in Fig. 10, the ro-vibrational population dis-tribution of H2 among the various knots is remarkably similar.It thus makes sense to sum up the individual spectra to increasethe signal-to-noise ratio, to search for fainter H2 emission linesthat are not apparent in the individual spectra. This methodsimulates spectroscopic observations of HH135/HH136 witha very large aperture, and is thus physically meaningful. Thesum spectra, shown in Figs. 12–16, show a wealth of addi-tional, faint emission lines, particularly in the J-band. Some H2
emission lines are identified explicitly in the figures. The im-portance of J-band observations for a proper characterizationof the H2 excitation has been emphasized by Giannini et al.
R. Gredel: HH135/HH136 - a luminous H2 outflow towards a high-mass protostar 7
5000
bowNE
B1
B2
B3
B4
D1
5000
D3
H1
I2
d
c
b
Fig. 10. Excitation diagrams constructed for individual knots in HH135/HH136 with values ofln(N(v′J′)/g plotted versus ex-citation energiesE(v′J′). Open triangles and open squares correspond to data inferred from the blue and red grisms GB andGR, respectively, while filled triangles and squares represent the data inferred from the H- and K-band observations using thehigh-resolution grism. Straight lines correspond to single temperature fits to the population distribution, whereas dashed linesplotted in the diagrams of knots B1, D1, and c are fits to discrepant measurements (see text).
(2002), and full use of the additional J-band emission linesismade here.
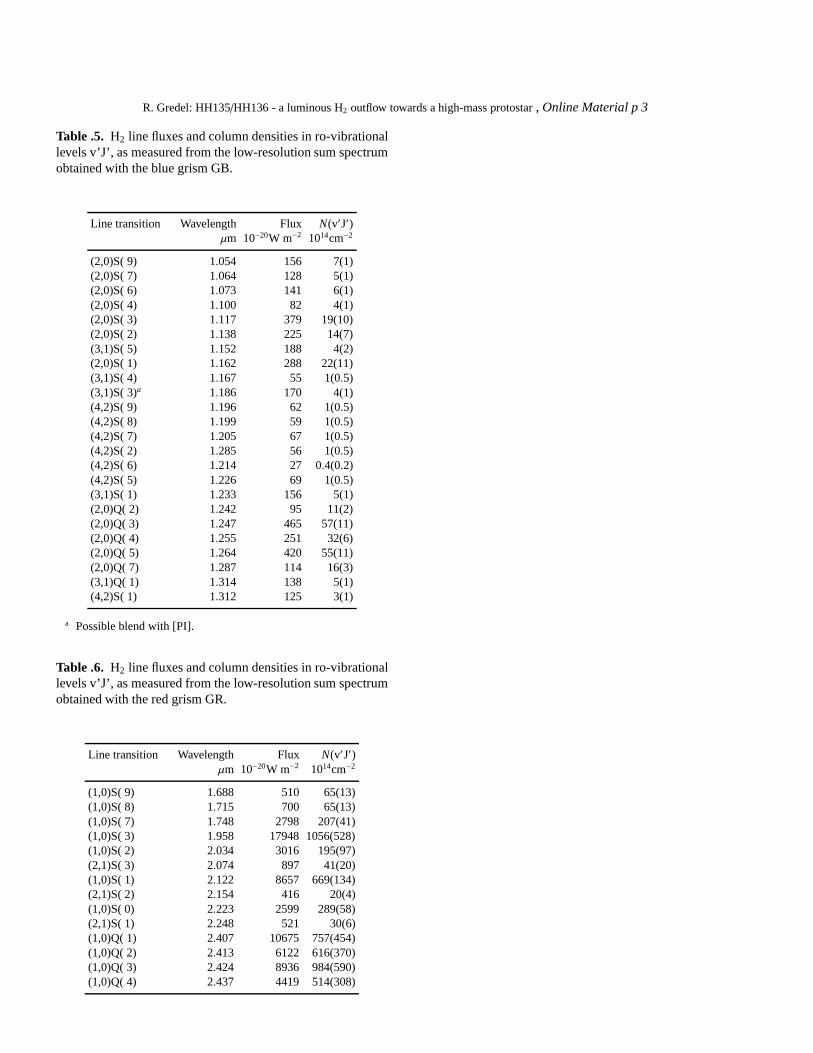
The H2 line fluxes derived from the sum spectra andthe inferred column densities N(v’J’) are given in Tables .5–.7. The conversion of molecular hydrogen fluxes to popula-tion densities was achieved via the relationI(v′J′v′′J′′) =hc4π νA(v′J′v′′J′′)N(v′J′). Intensities I(v′J′v′′J′′) are inferredfrom the de-reddened fluxesF(v′J′v′′J′′), using the solid anglesΩ given in Sect. 2. The corresponding H2 excitation diagramis shown in Fig. 11. The population distribution indicates thepresence of a thermalized gas atTex = 2000 K, which containsa minor fraction of 0.3% of hot gas atTex = 5500 K. Dots inthe excitation diagram show the modeled population densitiesin all levels at such a gas mixture.
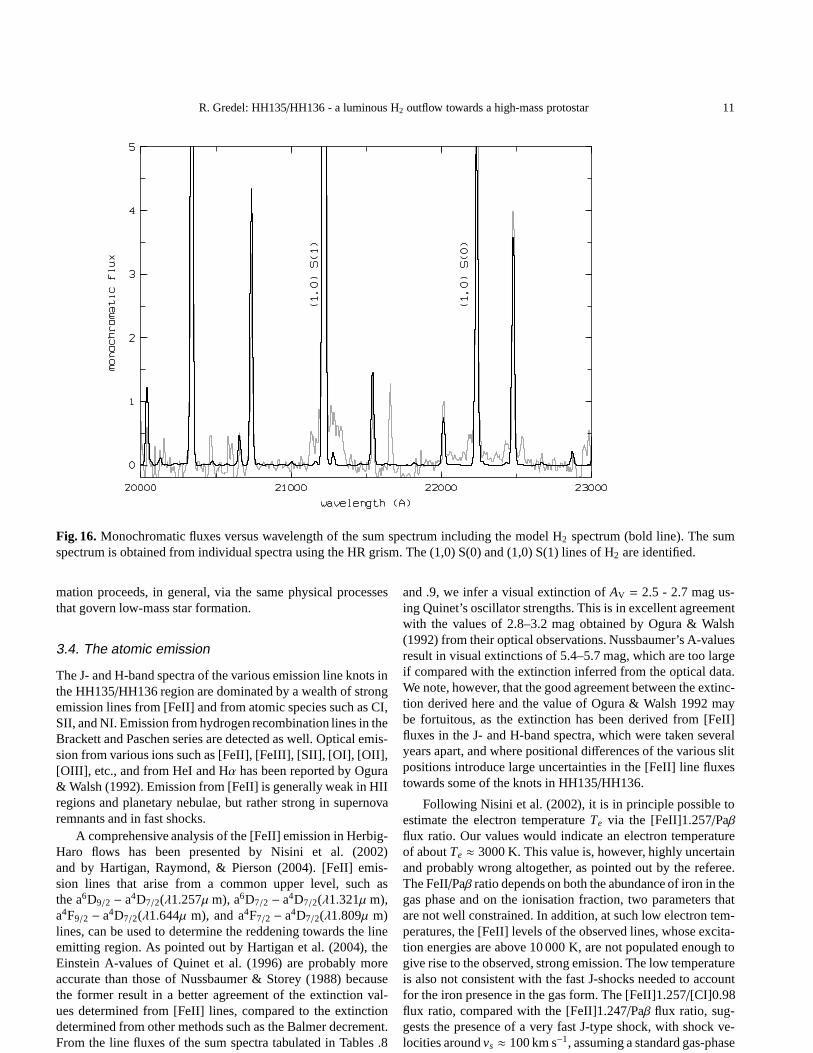
Because of the wealth of [FeII] and other atomic emissionlines in the spectra, and because of the relatively low spectralresolution, the confusion limit is reached in various spectral re-gions and care needs to be exercised when inferring line fluxesof individual emission lines. It thus makes sense to calculatea theoretical H2 spectrum and compare it with the observedspectrum. This allows us to judge whether the fluxes of themolecular hydrogen lines listed in Tables .5–.7 are severely af-fected from line blends. A theoretical H2 spectrum was con-structed for thermalized H2 in a gas mixture of 2000 K and5500 K with a column density ratio of 300:1, using the code ofGredel & Dalgarno (1996). The theoretical spectra, calculatedfor a visual extinction ofAV = 2.7 mag, were normalized to thestrength of the (1,0) S(1) line and convolved with a Voigt pro-file at the various spectral resolutions of the observed spectra.

8 R. Gredel: HH135/HH136 - a luminous H2 outflow towards a high-mass protostar
5000
28
30
32
34
36
38
Fig. 11. Excitation diagram constructed from the H2 sum spec-tra. Triangles, squares, and hexagrams, respectively, representpopulation distribution among rotational levels of v’=1, 2, 3,and 4. Dots represent a theoretical population distribution con-structed for a thermalized gas at a temperature of 2000K, witha second component added at a temperature of 5500K and acolumn density 300 times less than the first.
The theoretical spectra are reproduced in Figs. 12– 16 as boldlines.
The comparison of the observations with the model spec-tra show that for single lines that appear unaffected by blendswith atomic lines, the fit is excellent. The H2 line fluxes in theH- and K-band atmospheric windows are generally very wellreproduced (cf. Figs. 15 and 16). Note that the (1,0) S(1) linenear 2.121µm, as well as the a4D7/2 − a4F9/2 [FeII] line near1.644µm, show broad emission wings. In the heavily crowdedJ-band spectra, individual H2 lines that are free of blends arevery well reproduced as well. Examples are the (2,0) S(1) and(3,1) S(4) pair near 1.164µm (Fig. 12) and the (4,2) S(5), (4,2)S(6), and (2,0) Q(1)-Q(4) lines at 1.21–1.25µm (Fig. 13). Thevery good fit of emission lines from v’=2 to v’=4 shows that thetwo-temperature fit to the H2 population distribution (Fig. 11)is accurate, despite the flux uncertainties in many of the H2 linefluxes that result from line blends.
Re-forming molecular hydrogen in the cooling, post-shockregions causes a pronounced variation in the population den-sities of ro-vibrational levels with similar excitation tempera-tures, but different vibrational quantum numbers (e.g., Floweret al. 2003, their Fig. 6). The effect leads to a pronounced over-population of rotational levels in v’=0, relative to levels in v’=1of similar excitation energy. Emission lines that arise fromv’=0 are not available in the present study. The rotational pop-ulation densities in v’=0 are very sensitive to C-type shocks,which produce very large column densities in these levels. C-
type shocks have been used to explain the observed H2 in var-ious outflow sources, such as HH 99 and VLA 1623A (Daviset al. 1999) or in IRAS18151-1208 (Davis et al. 2004). Othershave used C-type shocks with magnetic precursors (McCoey etal. 2004; Flower et al. 2003). The lack of kinematical data andthe lack of observations of H2 emission fromv = 0 makes itdifficult to judge whether C-type shocks are relevant for the H2
excitation in HH135/HH136, although they must not be ruledout.
For a gas mixture of warm molecular gas at 2000K plusa fraction of 0.3% at 5500 K, the model calculation producesa total H2 flux of Ftot(H2) = Σv′J′v′′J′′F(v′J′v′′J′′) = 14.2 ×F(1301), whereF(1301) is the flux in the (1,0) S(1) line andwhere the summation is carried out over all possible emissionlines that arise from the E2 cascade in the X1Σ+g electronicground state of H2. The various slit positions employed heresample a total H2 flux of Ftot (H2) = 1.210−15 W m−2, whichcorresponds to a total measured luminosity of L(H2) = 0.8 L⊙.From a comparison of the H2 emission regions sampled by thevarious slit positions with the overall morphology of the H2
emission in HH135/HH136, it is estimated that the total H2 lu-minosity in HH135/HH136 reaches at least 2L⊙, but possiblyexceeds this number by factors of a few. The total H2 popu-lation density, for the two-component mixture assumed above,is Ntot(H2) = Σv′J′N(v′J′) = 77N(1, 3), or Ntot(H2) = 5.21018
cm−2. The scaling factors (14.2 and 77 in the present case) aredependent on the actual ro-vibrational population distributionand show a pronounced dependence on the H2 excitation tem-perature (e.g., Gredel 1994).
Low-mass stars that power molecular outflows such asHH111 and HH212 have bolometric luminosities of a few tensof solar luminosities (Froebrich 2005), whereas the H2 lumi-nosities associated with such flows are of the order of 0.1L⊙.The accretion rates of Class 0 and Class I objects are, pur-portedly, proportional to the flow luminosities (Stanke 2000;Froebrich et al. 2003), and the H2 luminosities L(H2) seem toincrease with increasing source luminosities L(bol). The verylarge luminosity of IRAS11101-5928 suggests the presence ofa deeply embedded, intermediate- or high-mass star in forma-tion. Its luminosity and the luminosity of its H2 outflow definea data point that is consistent with the regression of L(H2) withL(bol) from the low-mass protostars. This result may be in-terpreted in terms of a significantly increased accretion rate inIRAS11101-5829, that is, that the intermediate- to high-massstar formation witnessed by HH135/HH136 proceeds via ac-cretion as well, but with significantly increased accretionrates,relative to the accretion rates of low-mass protostars. Thisinterpretation is in agreement with Brooks et al. 2003, whosuggested that accretion in the luminous IRAS source IRAS16547-4247 drives the observed, well-collimated outflow thatextends over 1.5 pc. Similarly, Davis et al. 2004 observed acollimated, parsec-scale molecular outflow from IRAS 18151-1208 and concluded that massive protostars drive collimatedjets while in their earliest stages of evolution. More studiesof intermediate- to high-mass protostars and their outflowsareneeded to understand if the outflow properties are scaled-upversions of the low-mass counterparts and if high-mass starfor-

R. Gredel: HH135/HH136 - a luminous H2 outflow towards a high-mass protostar 9
Fig. 12. Monochromatic fluxes versus wavelength of the sum spectrum including the model H2 spectrum (bold line). The sumspectrum is obtained from individual spectra using grism GB. A few H2 lines are identified.
Fig. 13. Monochromatic fluxes versus wavelength of the sum spectrum including the model H2 spectrum (bold line). The sumspectrum is obtained from individual spectra using grism GB. The (4,2) S(6) transition of H2 is identified.

10 R. Gredel: HH135/HH136 - a luminous H2 outflow towards a high-mass protostar
Fig. 14. Monochromatic fluxes versus wavelength of the sum spectrum including the model H2 spectrum (bold line). The sumspectrum is obtained from individual spectra using grism GR. The (1,0) S(1) and (1,0) S(3) lines of H2 are identified.
Fig. 15. Monochromatic fluxes versus wavelength of the sum spectrum including the model H2 spectrum (bold line). The sumspectrum is obtained from individual spectra using the HR grism. The (1,0) S(6) and (1,0) S(7) lines of H2 are identified.
R. Gredel: HH135/HH136 - a luminous H2 outflow towards a high-mass protostar 11
Fig. 16. Monochromatic fluxes versus wavelength of the sum spectrum including the model H2 spectrum (bold line). The sumspectrum is obtained from individual spectra using the HR grism. The (1,0) S(0) and (1,0) S(1) lines of H2 are identified.
mation proceeds, in general, via the same physical processesthat govern low-mass star formation.
3.4. The atomic emission
The J- and H-band spectra of the various emission line knots inthe HH135/HH136 region are dominated by a wealth of strongemission lines from [FeII] and from atomic species such as CI,SII, and NI. Emission from hydrogen recombination lines in theBrackett and Paschen series are detected as well. Optical emis-sion from various ions such as [FeII], [FeIII], [SII], [OI],[OII],[OIII], etc., and from HeI and Hα has been reported by Ogura& Walsh (1992). Emission from [FeII] is generally weak in HIIregions and planetary nebulae, but rather strong in supernovaremnants and in fast shocks.
A comprehensive analysis of the [FeII] emission in Herbig-Haro flows has been presented by Nisini et al. (2002)and by Hartigan, Raymond, & Pierson (2004). [FeII] emis-sion lines that arise from a common upper level, such asthe a6D9/2 − a4D7/2(λ1.257µm), a6D7/2 − a4D7/2(λ1.321µ m),a4F9/2 − a4D7/2(λ1.644µ m), and a4F7/2 − a4D7/2(λ1.809µ m)lines, can be used to determine the reddening towards the lineemitting region. As pointed out by Hartigan et al. (2004), theEinstein A-values of Quinet et al. (1996) are probably moreaccurate than those of Nussbaumer & Storey (1988) becausethe former result in a better agreement of the extinction val-ues determined from [FeII] lines, compared to the extinctiondetermined from other methods such as the Balmer decrement.From the line fluxes of the sum spectra tabulated in Tables .8
and .9, we infer a visual extinction ofAV = 2.5 - 2.7 mag us-ing Quinet’s oscillator strengths. This is in excellent agreementwith the values of 2.8–3.2 mag obtained by Ogura & Walsh(1992) from their optical observations. Nussbaumer’s A-valuesresult in visual extinctions of 5.4–5.7 mag, which are too largeif compared with the extinction inferred from the optical data.We note, however, that the good agreement between the extinc-tion derived here and the value of Ogura & Walsh 1992 maybe fortuitous, as the extinction has been derived from [FeII]fluxes in the J- and H-band spectra, which were taken severalyears apart, and where positional differences of the various slitpositions introduce large uncertainties in the [FeII] linefluxestowards some of the knots in HH135/HH136.
Following Nisini et al. (2002), it is in principle possible toestimate the electron temperatureTe via the [FeII]1.257/Paβflux ratio. Our values would indicate an electron temperatureof aboutTe ≈ 3000 K. This value is, however, highly uncertainand probably wrong altogether, as pointed out by the referee.The FeII/Paβ ratio depends on both the abundance of iron in thegas phase and on the ionisation fraction, two parameters thatare not well constrained. In addition, at such low electron tem-peratures, the [FeII] levels of the observed lines, whose excita-tion energies are above 10 000 K, are not populated enough togive rise to the observed, strong emission. The low temperatureis also not consistent with the fast J-shocks needed to accountfor the iron presence in the gas form. The [FeII]1.257/[CI]0.98flux ratio, compared with the [FeII]1.247/Paβ flux ratio, sug-gests the presence of a very fast J-type shock, with shock ve-locities aroundvs ≈ 100 km s−1, assuming a standard gas-phase

12 R. Gredel: HH135/HH136 - a luminous H2 outflow towards a high-mass protostar
Fe abundance of Fe/H = 10−6. The [FeII]1.644/1.600 ratios aresimilar to line ratios observed in other HH objects with [FeII]emission. Ratios of 10–15 prevail towards most of the knots inHH135 and HH136 (cf. Tables .3 and .4) and indicate electrondensities aroundne = 4000 cm−3 or somewhat below (cf. Fig. 7of Nisini et al. (2002)). Larger ratios of 20–30 are inferredforknots c and D3, and corresponding electron densities are some-what belowne = 3000 cm−3. Flux ratios of [FeII]1.644/1.533and [FeII]1.644/1.677 of about 10 for all the knots indicateelectron densities of the order ofne = 3500 cm−3. The man-ifold atomic emission lines towards HH135/HH136, togetherwith the low spectral resolution available here, causes a largenumber of line blends (cf. Figs. 12 - 16), which prohibits amore comprehensive analysis of the atomic emission.
4. Conclusions
The observations presented above and the main conclusions aresummarized as follows:
1. The images obtained in the (1,0) S(1) line of molecular hy-drogen reveal the presence of a well-collimated molecularoutflow that extents over a scale of about 1 pc.
2. A number of the H2 emission line knots are associated withfaint, underlying continuum emission.
3. The ro-vibrational excitation temperatures of H2 of thevarious knots in the HH135/HH136 flow are remarkablyconstant, and are well characterized by a narrow range ofTex = 2000± 200K.
4. The molecular part of the shocked gas contains a small frac-tion of some 0.3% of hot H2 at a ro-vibrational excitationtemperature ofTex = 5500± 200K.
5. Very strong emission lines from [FeII] occur towards var-ious knots in HH135/HH136, and emission from HeI,hydrogen recombination lines, [CI], [SII], and [NII] arepresent as well. The [FeII] line ratios indicate the pres-ence of a fast J-type shock at a speed ofvs ≈ 100 km s−1.Electron densities are of the order ofne = 3500− 4000cm−3 and electron temperatures areTe ≈ 3000 K. A morecomprehensive analysis of the atomic emission is hamperedby the low spectral resolution and the occurrence of a verylarge number of line blends.
6. The ro-vibrational population distribution of H2, togetherwith the presence of strong [FeII] emission, which is spa-tially displaced from the H2 emission, indicate that theemission lines arise form in the cooling regions of fast, dis-sociative J-type shocks, where the [FeII] emission tracesthe fast, dissociative parts of the shocks and where the H2
emission emerges from regions of oblique shocks where theshock speeds are lower. The presence of emission from re-forming H2 molecules in the cooling post-shock region isnot ruled out.
7. The large H2 luminosity of 2 L⊙ suggests that theintermediate- to high-mass protostar that powers theHH135/HH136 outflow forms via a significantly increasedaccretion rate, compared to the accretion rates of low-massprotostars.
Acknowledgements. It is a great pleasure to thank Drs. Ogura andSugitani for enlightening discussions about HH135/HH136 and aninvitation to Nagoya City University. The useful comments of theanonymous referee regarding a better presentation of the results andan error in the [FeII] analysis are very much appreciated.
References
Brooks, K.J., Garay, G., Mardones, D., & Bronfman, L. 2003, ApJL,594, L131
Chrysostomou, A., Lucas, P.W., & Hough, J.H. 2005, in Protostars andPlanets V, ed. B. Reipurth, D. Jewitt, K. Keil, 8147
Davis, C.J., Smith, M.D., Eisloeffel, J., & Davies, J.K, 1999, MNRAS,308, 539
Davis, C.J., Varricatt, W.P., Todd, S.P., & Ramsay Howat, S.K. 2004,A&A, 425, 981
Flower, D.R., Le Bourlot, J., Pineau des Forets, G., & Cabrit, S. 2003,MNRAS, 341, 70
Froebrich, D., 2005, ApJS, 156, 169Froebrich, D., Smith, M.D., Hodapp, K.-W., & Eisloffel, J. 2003,
MNRAS, 436, 163Giannini, T., Nisini, B., Caratti o Garatti, A., & Lorenzetti, D. 2002,
ApJL, 570, L33Giannini, T., McCoey, C., Caratti o Garatti, et al. 2004, A&A, 419,
999Gredel, R. 1994, A&A, 292, 580Gredel, R. 1996, A&A, 305, 582Gredel, R., & Dalgarno, A. 1995, ApJ, 446, 852Hartigan, P., Raymond, J., & Pierson, R. 2004, ApJ, 614, L69Le Bourlot, J., Pineau des Forets, G., Flower, D.R., & Cabrit, S. 2002,
MNRAS, 332, 985Marti, J., Rodriguez, L.F., & Reipurth, B. 1995, ApJ, 449, 184McCoey, C., Giannini, T., Flower, D.R., & Caratti o Garatti,A. 2004,
MNRAS, 353, 813Nisini, B., C., Caratti o Garatti, A., Giannini, T., & Lorenzetti, D.
2002, A&A, 393, 1035Nussbaumer, H., & Storey, P.J. 1988, A&A, 193, 327Ogura, K., & Walsh, J.R. 1992, ApJ, 400, 248Ogura, K., Nakano, M., & Sugitani, K., Liljestrom, T. 1998,A&A,
338, 576Pickles, A.J. 1998, PASP, 110, 863Quinet, P., Le Dourneuf, M., & Zeippen, C.J. 1996, A&AS, 120,361Stanke, T. 2000, PhD Thesis, Univ. PotsdamSteppe, H. 1977, A&AS, 27, 415Sugitani, K., & Ogura, K. 1994, 1994, ApJS, 92, 163Tamura, M., Hough, J.H., Chrysostomou, A., Itoh, Y., Murakawa, K.,
& Bailey, J.A. 1997, MNRAS, 287, 894Wilgenbus, D., Cabrit, S., Pineau des Forets, G., & Flower,D.R. 2000,
A&A, 356, 1010Wolniewicz, L., Simbotin, I., & Dalgarno, A. 1998, APJS, 115, 293

R. Gredel: HH135/HH136 - a luminous H2 outflow towards a high-mass protostar, Online Material p 1
Online Material
R. Gredel: HH135/HH136 - a luminous H2 outflow towards a high-mass protostar, Online Material p 2
Fig. .1. Spatial variation of the (1,0) S(1) H2 emission line fluxalong the slit for the three positions PA=34.5, 38, and 45 asinferred from the March 1999 observations. Bold lines showthe variation of the continuum emission.
Fig. .2. Spatial variation of the (1,0) S(1) H2 emission line fluxalong the slit at the three positions PA=33, 45, and 43 asinferred from the February 2004 observations. Bold lines showthe variation of the continuum emission.
Fig. .3. H-band spectra of individual knots in the HH135 flow.Spectra are shifted by units of 1000, 2000, 3000, 4000, 5000,6000, and 8000 for knots HH135-B1, B4, D1, D3, H1, I2, andHH136-d, respectively, along the ordinate.
Fig. .4. K-band spectra of individual knots in the HH135 flow.The ordinate is valid for bowNE only. Spectra are shifted byunits of 1000, 2000, 3000, 4000, 5000, 6000, and 8000 forknots HH135-B1, B4, D1, D3, H1, I2, and HH136-d, respec-tively, along the ordinate.
R. Gredel: HH135/HH136 - a luminous H2 outflow towards a high-mass protostar, Online Material p 3
Table .5. H2 line fluxes and column densities in ro-vibrationallevels v’J’, as measured from the low-resolution sum spectrumobtained with the blue grism GB.
Line transition Wavelength Flux N(v′J′)µm 10−20W m−2 1014cm−2
(2,0)S( 9) 1.054 156 7(1)(2,0)S( 7) 1.064 128 5(1)(2,0)S( 6) 1.073 141 6(1)(2,0)S( 4) 1.100 82 4(1)(2,0)S( 3) 1.117 379 19(10)(2,0)S( 2) 1.138 225 14(7)(3,1)S( 5) 1.152 188 4(2)(2,0)S( 1) 1.162 288 22(11)(3,1)S( 4) 1.167 55 1(0.5)(3,1)S( 3)a 1.186 170 4(1)(4,2)S( 9) 1.196 62 1(0.5)(4,2)S( 8) 1.199 59 1(0.5)(4,2)S( 7) 1.205 67 1(0.5)(4,2)S( 2) 1.285 56 1(0.5)(4,2)S( 6) 1.214 27 0.4(0.2)(4,2)S( 5) 1.226 69 1(0.5)(3,1)S( 1) 1.233 156 5(1)(2,0)Q( 2) 1.242 95 11(2)(2,0)Q( 3) 1.247 465 57(11)(2,0)Q( 4) 1.255 251 32(6)(2,0)Q( 5) 1.264 420 55(11)(2,0)Q( 7) 1.287 114 16(3)(3,1)Q( 1) 1.314 138 5(1)(4,2)S( 1) 1.312 125 3(1)
a Possible blend with [PI].
Table .6. H2 line fluxes and column densities in ro-vibrationallevels v’J’, as measured from the low-resolution sum spectrumobtained with the red grism GR.
Line transition Wavelength Flux N(v′J′)µm 10−20W m−2 1014cm−2
(1,0)S( 9) 1.688 510 65(13)(1,0)S( 8) 1.715 700 65(13)(1,0)S( 7) 1.748 2798 207(41)(1,0)S( 3) 1.958 17948 1056(528)(1,0)S( 2) 2.034 3016 195(97)(2,1)S( 3) 2.074 897 41(20)(1,0)S( 1) 2.122 8657 669(134)(2,1)S( 2) 2.154 416 20(4)(1,0)S( 0) 2.223 2599 289(58)(2,1)S( 1) 2.248 521 30(6)(1,0)Q( 1) 2.407 10675 757(454)(1,0)Q( 2) 2.413 6122 616(370)(1,0)Q( 3) 2.424 8936 984(590)(1,0)Q( 4) 2.437 4419 514(308)
R. Gredel: HH135/HH136 - a luminous H2 outflow towards a high-mass protostar, Online Material p 4
Table .1. Individual measurements of emission lines towards the various knots in HH135 and HH136, using the low resolutionspectra obtained with grism GB.
Wavelength (µm) Line flux(10−20W m−2)
PA33 PA43 PA65
B1 B4 D1 B4 D1 H1 e a B1 B2
0.953 0.4 1.4 1.0 0.3 0.6 − − 3.5 0.6 0.60.983 0.2 0.3 0.3 0.1 0.3 0.1 0.3 0.7 0.3 0.30.986 0.5 0.9 0.8 0.4 0.6 0.2 0.8 1.9 0.7 0.61.006 0.2 0.5 0.6 0.2 0.4 0.2 0.1 1.3 0.4 0.31.0293 0.5 1.7 1.8 0.4 1.8 0.1 0.3 4.6 0.7 0.61.033 1.3 3.8 4.2 1.1 2.6 0.4 0.8 10.9 1.6 1.51.038 0.3 0.8 0.8 0.2 0.8 0.1 0.1 2.0 0.3 0.41.041 0.5 1.2 2.1 0.2 1.2 0.2 0.2 4.9 0.4 0.41.053 0.1 − 0.4 0.1 − − 0.1 0.3 − −
1.064 0.2 0.3 0.2 − 0.1 − 0.2 0.5 − 0.21.072 0.2 0.4 0.3 − − − 0.2 0.9 0.3 0.21.084 3.3 10.2 8.7 3.4 6.8 1.1 1.8 22.7 4.4 3.91.095 0.3 1.0 1.1 0.5 1.0 0.4 0.5 2.4 0.4 0.51.163 0.2 0.4 0.4 0.1 0.3 0.1 − 0.6 0.3 0.31.189 0.4 1.1 1.2 0.4 0.8 0.2 0.3 2.5 0.8 0.61.233 0.1 0.2 0.2 0.1 0.2 0.1 0.3 0.5 0.2 0.11.239 0.1 0.3 0.3 0.2 0.2 0.1 0.4 0.4 0.3 0.31.248 0.3 0.7 0.9 0.3 0.9 0.2 0.3 1.7 0.6 0.51.257 8.5 20.0 22.4 7.7 17.1 3.8 5.9 39.5 11.1 9.81.271 0.4 1.2 1.5 0.4 1.1 0.1 0.1 2.6 0.5 0.41.279 0.7 2.0 2.4 0.9 2.2 0.3 0.2 4.4 0.9 0.71.282 0.7 2.4 3.8 0.6 2.8 1.4 1.0 6.3 1.2 1.21.295 1.1 2.9 3.7 1.0 2.8 0.5 0.5 6.6 1.4 1.11.298 0.3 0.8 0.9 0.2 0.7 0.1 − 1.7 0.3 0.31.321 2.5 5.7 7.3 2.2 5.6 1.3 1.8 12.0 3.4 2.91.328 0.7 1.8 2.1 0.5 1.6 0.2 0.3 3.7 0.8 0.51.534 1.7 4.2 6.6 1.4 4.9 1.1 0.8 8.4 2.0 1.61.600 1.2 3.1 5.5 1.0 4.0 0.8 0.6 − 1.5 1.3
a Flux uncertainties are 10% in general, but increase to about50% for 1.10≤ λ ≤ 1.18µm.

R. Gredel: HH135/HH136 - a luminous H2 outflow towards a high-mass protostar, Online Material p 5
Table .2. Individual K-band measurements of emission lines towards the various knots in HH135 and HH136, using the mediumresolution spectra obtained with grism HR.
Wavelength (µm) Line flux(10−20W m−2)
PA65 PA45 PA43 PA33
B2 B1 bowNE d c D1 D3 B3 bowNE b H1 I2 D1 B4 B1
2.034 14.2 8.4 2.9 17.0 8.4 21.3 6.6 6.5 2.9 7.6 17.9 − 37.1 12.5 10.72.046 0.9 − − 1.0 0.2 3.6 − 0.3 − − − − 7.8 1.4 −
2.074 2.6 2.1 0.6 2.9 0.8 5.2 1.4 1.1 0.6 1.6 2.9 − 7.3 2.9 2.32.122 39.5 26.3 6.8 47.9 21.0 59.2 19.0 19.5 7.3 22.7 48.4 19.6 103.3 36.3 29.92.154 1.4 1.0 0.4 1.7 0.8 2.5 0.8 0.5 0.3 1.7 1.0 − 4.0 1.5 1.12.166 0.6 0.4 − 0.2 0.5 3.6 1.4 0.7 − 1.2 − 1.5 7.1 1.6 −
2.201 0.7 0.5 0.2 0.5 0.4 1.2 0.3 0.3 0.4 − 0.4 − 1.5 0.9 0.62.223 11.1 7.4 1.7 12.5 5.7 20.8 6.6 6.5 1.6 6.6 13.8 5.7 37.7 12.4 8.02.247 3.4 2.4 0.6 4.5 3.1 6.6 2.4 1.9 1.0 2.1 4.2 2.3 10.5 3.5 2.9
a Flux uncertainties are 10% in general, but increase to about50% forλ ≤ 2.05µm.
Table .3. Individual H-band measurements of emission lines towards the various knots in HH135 and HH136, using the mediumresolution spectra obtained with grism HR.
Wavelength (µm) Line flux(10−20W m−2)
PA33 PA43 PA33 PA45 PA65
B1B4 D1D3 H1 B3 D1 H1 e B4 D1 H1 c d B1 B2
1.534 12.5 18.7 1.9 3.6 9.8 3.4 1.9 3.0 8.3 3.1 2.8 23.5 2.0 6.21.600 9.3 12.7 1.1 2.3 7.4 1.9 1.2 1.4 5.3 2.1 1.5 15.7 1.7 4.81.644 99.3 159.4 24.4 32.2 71.0 30.7 20.9 29.2 64.9 29.5 26.7 155.4 23.4 65.31.664 6.4 7.8 0.9 1.9 5.3 1.4 0.7 0.6 3.1 1.3 1.3 10.9 1.2 4.31.677 10.5 17.3 2.0 3.2 8.9 2.8 1.5 2.0 7.3 2.6 2.0 19.7 2.1 6.81.688 2.0 1.5 1.3 − 2.0 1.5 1.1 0.5 0.6 1.3 1.6 3.5 0.3 1.71.712 2.8 3.5 0.7 − 2.2 1.0 0.1 0.2 1.6 0.6 0.6 6.1 0.4 1.31.715 1.2 0.6 − − 0.6 0.6 0.7 − 0.3 0.5 1.0 2.2 − 0.71.736 − − − − − − − − − − − 2.4 − −
1.745 2.3 4.5 − − 2.5 0.6 0.3 − 2.4 0.8 − 6.9 0.6 2.11.748 11.0 12.6 3.6 2.2 5.4 5.5 5.6 1.3 4.3 5.5 6.5 14.2 2.0 6.91.788 5.9 6.8 − − 2.8 3.6 3.8 − 2.3 6.0 4.1 7.2 1.2 4.21.798 4.8 5.5 − − 3.8 − − − 3.2 3.3 0.5 5.7 − 3.41.800 1.8 0.6 − − 3.8 − − − 0.8 − − 4.1 − 2.61.810 5.6 9.5 − − 5.6 − − − 4.2 − − 8.1 − 4.3
a Flux uncertainties are 10% in general.

R. Gredel: HH135/HH136 - a luminous H2 outflow towards a high-mass protostar, Online Material p 6
Table .4. Individual H-band measurements of emission lines towards the various knots in HH135 and HH136, using the lowresolution spectra obtained with grism GR.
Wavelength (µm) Line flux(10−20W m−2)
PA38 PA45 PA65 PA34.5 PA34.5
D1 B1 B4 D1 d c d bowNE B2 D3 H1 b D3 H1 b
1.534 4.3 2.8 8.0 11.6 20.2 0.5 15.0 0.2 4.5 0.9 − − 1.2 3.0 0.11.600 3.0 1.8 5.5 8.7 14.2 0.3 11.1 − 3.6 0.5 − − 0.4 1.9 −
1.644 27.3 18.6 54.0 91.7 112.2 8.4 82.8 2.4 36.7 9.3 6.8 3.3 12.1 25.0 2.21.664 1.6 0.8 3.5 5.0 7.4 − 6.1 − 1.7 0.3 − − 0.4 0.9 −
1.678 3.3 1.8 6.1 10.7 15.2 0.6 11.4 0.2 3.8 − − − 0.7 2.3 −
1.712 0.8 0.4 1.4 2.3 4.3 0.1 3.0 0.2 1.0 0.2 − − 0.2 0.7 −
1.748 3.7 3.3 7.9 12.1 18.3 2.0 14.9 1.2 4.7 1.9 − − 1.6 6.4 1.21.789 1.4 1.7 3.2 5.8 5.3 1.4 6.3 0.7 1.8 0.8 − − 2.2 5.1 1.91.798 3.1 1.5 4.8 13.2 13.2 1.4 9.4 0.4 3.9 2.5 − − 5.6 5.2 −
1.810 21.0 14.9 34.8 76.9 85.7 6.0 72.3 2.2 26.7 10.8 − − 15.5 17.5 −
1.958 22.0 24.3 37.8 74.6 84.3 8.4 81.9 7.4 22.5 7.7 − − 8.6 36.6 −
2.034 4.7 5.5 10.3 19.8 18.4 2.8 17.2 1.7 7.2 2.9 5.7 2.9 6.4 14.2 5.82.047 0.7 − − − − − 5.6 − 0.4 − − − 0.7 − −
2.074 0.7 0.9 2.0 2.8 2.6 − 3.4 0.3 1.3 0.2 − − − 5.5 −
2.122 12.1 14.5 29.9 53.0 48.5 7.2 47.1 3.8 19.1 7.1 10.4 7.3 12.4 27.7 12.72.155 0.5 0.6 1.2 1.9 3.2 0.7 1.0 0.3 0.6 0.2 − − 0.5 1.7 −
2.167 1.1 − 0.8 3.3 4.1 0.3 1.4 − − 0.4 − − 0.7 2.9 −
2.202 0.3 0.3 0.7 1.1 1.3 0.3 0.8 0.2 − − − − − − −
2.224 4.3 4.5 9.7 18.4 17.6 2.1 14.9 1.2 5.8 2.4 4.0 3.2 4.9 8.5 3.72.248 1.3 1.6 3.0 5.6 6.0 1.0 4.9 0.6 1.5 1.0 1.9 1.6 2.0 3.7 1.32.355 1.3 0.5 0.7 1.9 2.2 0.4 1.7 0.5 0.5 0.6 − − − − −
2.406 13.5 15.4 31.1 58.9 50.9 7.7 53.3 4.1 21.6 8.9 13.1 7.9 16.4 26.7 15.32.413 5.8 8.7 15.2 36.5 25.8 4.0 26.8 2.0 10.0 4.1 6.3 4.3 7.9 12.3 7.62.423 14.0 15.4 31.6 59.2 50.9 7.2 53.1 4.1 21.0 7.2 12.4 9.1 13.8 29.2 16.72.437 − 5.0 9.0 16.9 15.3 3.3 17.6 1.5 6.2 2.4 − − − − −
2.453 − − 1.3 − − − 4.5 − 2.3 − − − − − −
2.475 − 2.1 3.8 12.9 4.9 − 4.9 − − − − − − − −
2.498 − 3.7 9.7 25.4 12.5 − 12.5 − − − − − − − −
a Flux uncertainties are 10% in general, but increase to about50% for 1.9 ≤ λ ≤ 2.05µm and forλ ≥ 2.43µm.

R. Gredel: HH135/HH136 - a luminous H2 outflow towards a high-mass protostar, Online Material p 7
List of Objects
‘HH135’ on page 2‘HH136’ on page 2‘IRAS11101-5928’ on page 2
Table .7. H2 line fluxes measured from the medium-resolutionH- and K-band sum spectra obtained with the HR grism in or-ders 4 and 3, respectively.
Line transition Wavelength Flux N(v′J′)µm 10−20W m−2 1014cm−2
(1,0)S( 9) 1.688 652 83(17)(1,0)S( 8) 1.715 278 26(5)(1,0)S( 7) 1.748 2328 172(34)(1,0)S( 6) 1.788 1504 96(19)
(1,0)S( 2) 2.034 2977 192(96)(3,2)S( 5) 2.066 198 11(6)(2,1)S( 3) 2.074 623 28(14)(1,0)S( 1) 2.122 8763 677(135)(2,1)S( 2) 2.154 371 18(4)(3,2)S( 3) 2.201 159 8(2)(1,0)S( 0) 2.223 2901 323(65)(2,1)S( 1) 2.248 970 55(11)

R. Gredel: HH135/HH136 - a luminous H2 outflow towards a high-mass protostar, Online Material p 8
Table .8. Line fluxes measured for atomic transitions using thelow-resolution spectrum obtained with grism GB.
Transition Wavelength Fluxµm 10−20W m−2
1D2 −3 P2 SIII 0.953 839
FeII? 0.955 1771D2 −
3 P1 CI 0.983 1791D2 −
3 P2 CI 0.985 678H 7–3 1.005 340? 1.019 622P3/2 −
2 D3/2 SII 1.029 10192P3/2 −
2 D5/2 SII 1.033 24972P1/2 −
2 D5/2 SII 1.038 4132P1/2 −
2 D5/2 NI 1.041 1019HeI 1.083 5516H 6–3 1.094 6165P−5 S0 OI 1.130 195? 1.134 192? 1.144 59PII 1.147 116? 1.149 39? 1.176 58a6D9/2 − a4D5/2
FeII1.191 143
a6D9/2 − a4D7/2
FeII1.257 11134
a6D1/2 − a4D1/2
FeII1.271 684
a6D3/2 − a4D3/2
FeII1.279 1132
H 5–3 1.282 1645a6D5/2 − a4D5/2
FeII1.294 1650
a6D7/2 − a4D7/2
FeII1.321 3595
a6D3/2 − a4D5/2
FeII1.328 1083
a4F9/2 − a4D5/2
FeII1.533 2439
a4F7/2 − a4D3/2
FeII1.600 1866
Table .9. Wavelengths and line fluxes of atomic transitions, de-rived from spectra obtained with grisms GR and HR in orders4 and 3, respectively
Transition Wavelength fluxµm 10−20W m−2
a4F9/2 − a4D5/2
FeII1.534 2459
a4F7/2 − a4D3/2
FeII1.600 1380
H 12–4 1.641 200a4F9/2 − a4D7/2
FeII1.644 13521
a4F5/2 − a4D1/2
FeII1.664 563
a4F7/2 − a4D5/2
FeII1.677 1512
H 11–4 1.681 5683P0 −
3 D HeI 1.700 176H 10–4 1.737 972H 7–4 2.166 1191
a4F9/2 − a4D5/2
FeII1.533 2637
a4F7/2 − a4D3/2
FeII1.600 2130
a4F9/2 − a4D7/2
FeII1.644 13830
a4F5/2 − a4D1/2
FeII1.664 1356
a4F5/2 − a4D5/2
FeII1.677 2597
H 10–4 1.736 620a4F3/2 − a4D1/2
FeII1.745 1295
a4F3/2 − a4D3/2
FeII1.797 1017
a4F5/2 − a4D5/2
FeII1.800 1301
a4F7/2 − a4D7/2
FeII1.809 2173
H 7–4 2.166 613