hhd influenza surveillance report (04/14/2018, week 15) · hhd influenza surveillance report...
TRANSCRIPT
HHD Influenza Surveillance Report (04/14/2018, Week 15)
Houston/ Harris County: Week 15
Texas: Week 15
CDC: Week 15
Minimal Minimal Normal
Highlights
• In Week 15, flu activity is declining, and this is the last Influenza Surveillance Report for
2017-2018 flu season published by the Houston Health Department (HHD). The flu vaccine is still recommended.
• The Bureau of Epidemiology has followed-up with 10 facilities during this flu season to detect,
control, and prevent the spread of influenza A.
• Two pediatric and two adults** flu-related deaths have occurred in Houston during this flu
season.
Influenza Like Illness • The percentage of reported influenza-like illness (ILI) detected from emergency centers in
Houston/Harris County slightly increased from 5.4% in week 14 to 6.1% in week 15.
• The percentage of Athena ILI reports decreased from 0.18% to 0.13%. • The count of Flu Near You users reporting ILI decreased from 2 to 0. • The lab confirmed ILI cases among HISD students decreased from Feb (n=171) to Mar (n=20).
Virology
• In week 15, the percentage of positive flu tests from sentinel providers in Houston remained at 0%‡ from week 14.
• Cumulatively in the year of 2017, the City of Houston Bureau of Laboratory Services has
tested 517 surveillance specimens. Among the positive influenza tests (n=191), Influenza A/H3 accounts for 56.5% (n=108).
• HHD receives electronic lab reports from clinical labs. In week 15, there was a increase in positive flu tests (n=198). Flu A activity accounts for 96% of the flu positives this season so far. Week 52 of 2017 has the highest count (n=869) of flu positives this season.
• HHD received non-electronic lab reports from clinical labs. During this flu season, January showed the highest flu activity (n=6).
National • At the national level during week 15, 2.08% of specimens tested and reported to the CDC by
clinical labs were positive for influenza. The proportion of outpatient visits for ILI (3.58%) was
below the baseline (6.41%) and 7,081† pneumonia and influenza deaths were reported in
Texas during this flu season.
Division of Disease Prevention and Control
Program of Public Health Informatics
Influenza Surveillance Weekly Report
CDC MMWR Week 15: Apr 08, 2018 to Apr 14, 2018
Influenza Activity by County, State, and National Levels
Page 1 of 10
HHD Influenza Surveillance Report (04/14/2018, Week 15)
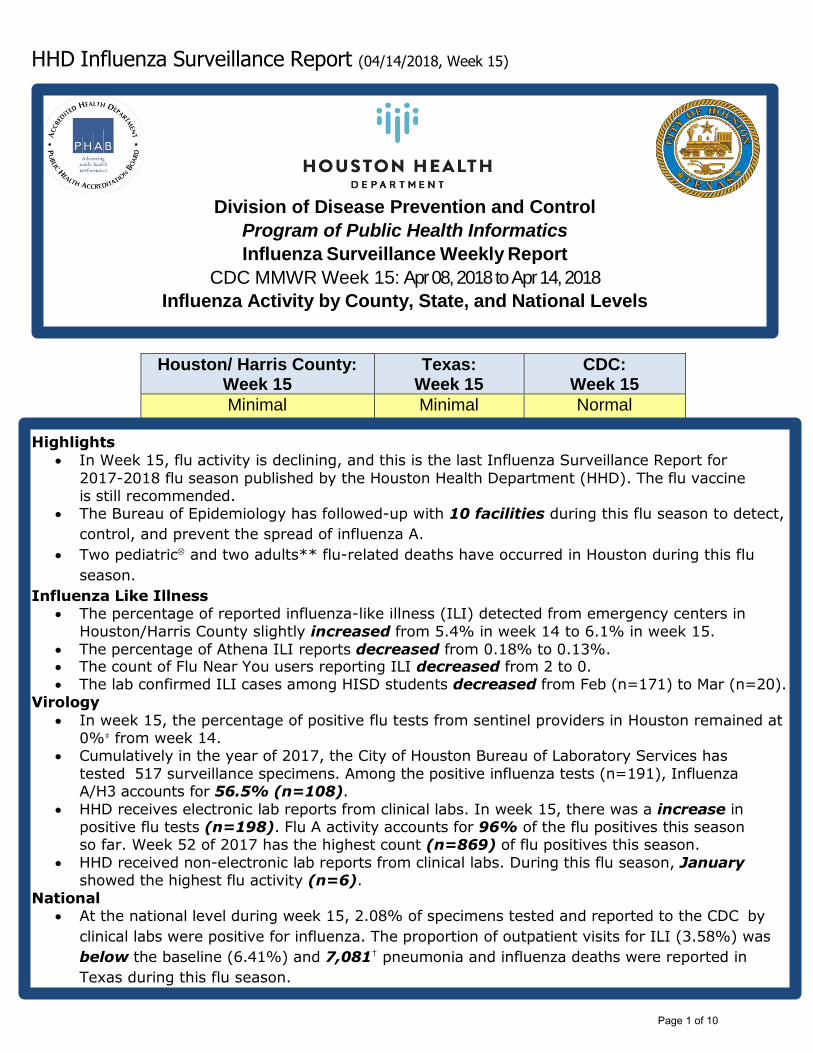
In week 15, 6.1% of emergency center (EC) visits were due to influenza-like illness (ILI)
complaints. Of the 1,127 patients presenting with ILI, the age group that recorded the most EC visits was the 00 to 04 year old (42%). Females accounted for 55% of patients
presenting with ILI.
Syndromic Surveillance: 2011-2018
Syndromic Surveillance: 2017-2018 Influenza Season Age and Gender Distribution
NOTE: Houston/Harris County ILI activity is assessed using information provided by surveillance participants in the Real-time Out-
break Disease Surveillance System (RODS). For week 15, 36 surveillance participants reported ILI information to Houston Health
Department. Influenza-like illness (ILI) is defined as the mention of fever AND cough, OR fever AND sore throat, OR flu in the
patient’s Emergency Department (ED) chief complaint. These data do not represent laboratory confirmed cases of influenza nor do
they represent all ED visits in Houston/Harris County. The algorithm for ILI-related ED visit has been updated to meet the
national standard in December 2017. The changes were applied to all previous data points. The new algorithm is more inclusive
and when applied to previously reported data it resulted in an increase in percentages of ED visits classified as ILI. As the result
of the changes, the overall percentage has been changed, but the overall trend remained the same. As the criteria changes, the
health department tends to be more inclusive for catching flu activity.
Page 2 of 10
HHD Influenza Surveillance Report (04/14/2018, Week 15)
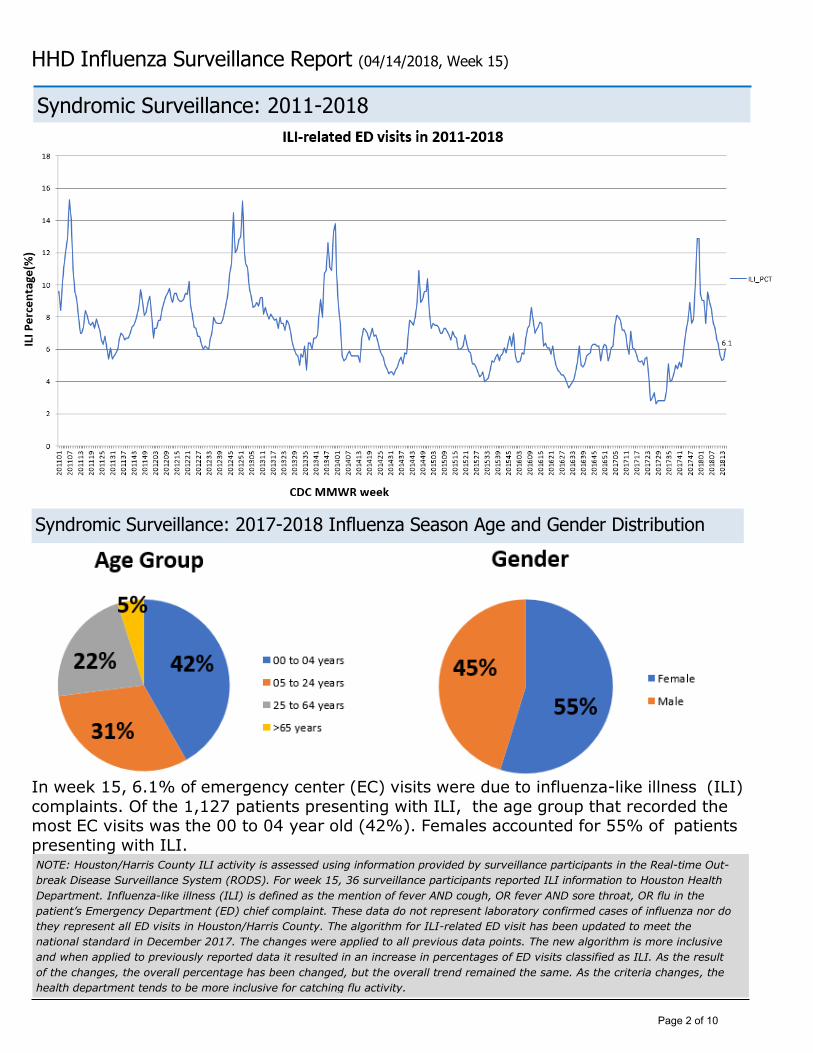
During week 15, the ZIP codes that have the greatest percentage of ED visits related
to ILI (15.56% or greater) are: 77003, 77011, 77017, 77217, 77233, 77372, 77440,
77480, 77485, 77508, 77519, 77522, 77542, 77569, and 77587.
Syndromic Surveillance: Geographic Distribution Map of ILI
NOTE: Houston/Harris County ILI distribution map was created using data provided by 36 hospitals that voluntarily
provide data based on chief complaints in the Real-time Outbreak Disease Surveillance System (RODS). This map
reflects the percentage of ILI cases from each residential zip code during the current week of reporting. Influenza-like
illness (ILI) is defined as the mention of fever AND cough, OR fever AND sore throat, OR flu in the patient’s ED chief
complaint. These data do not represent laboratory confirmed cases of influenza nor do they represent all ED visits in
Houston/Harris County.
Page 3 of 10
HHD Influenza Surveillance Report (04/14/2018, Week 15)
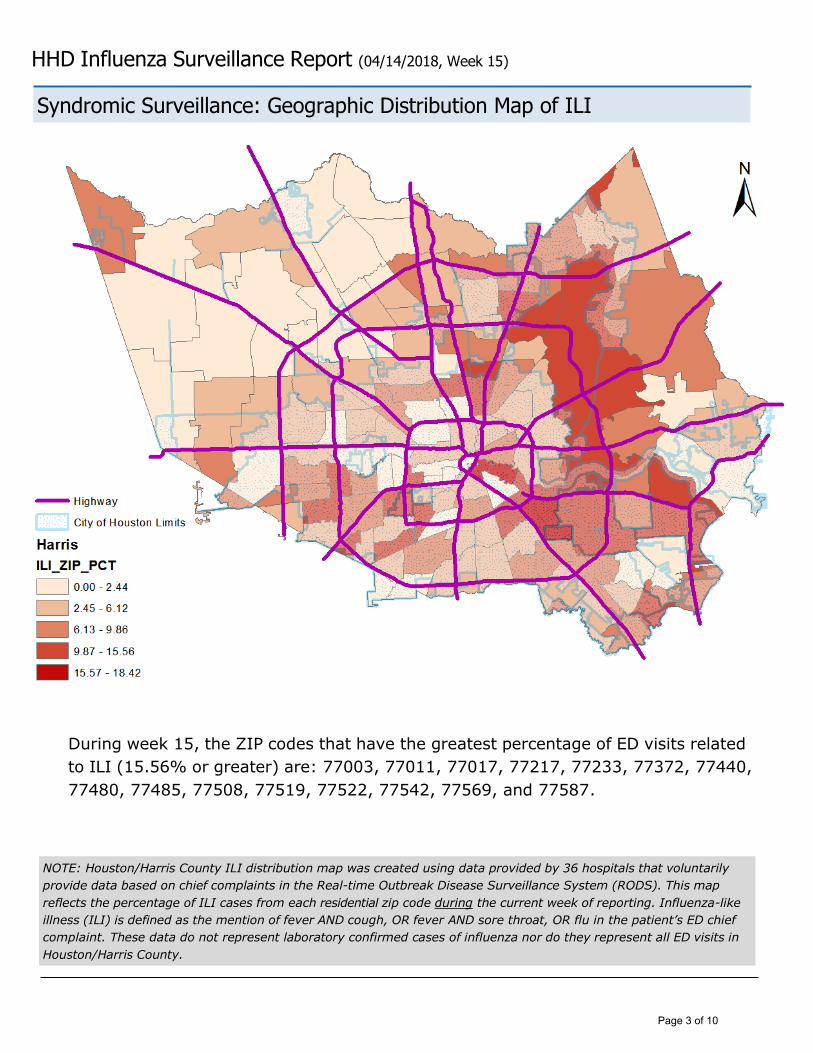
In week 15, ILI accounted for 0.13% of outpatient visits in the Athena network. The count of ILI visits
decreased from 20 in the week of 04/01/2018 to 14 in the week of 04/08/2018. The age group that
accounted for the highest counts of ILI outpatient visits was age 18-49 (n=8).
Athena: ILI percentage per week
Athena: ILI per week by age group
Page 4 of 10
HHD Influenza Surveillance Report (04/14/2018, Week 15)
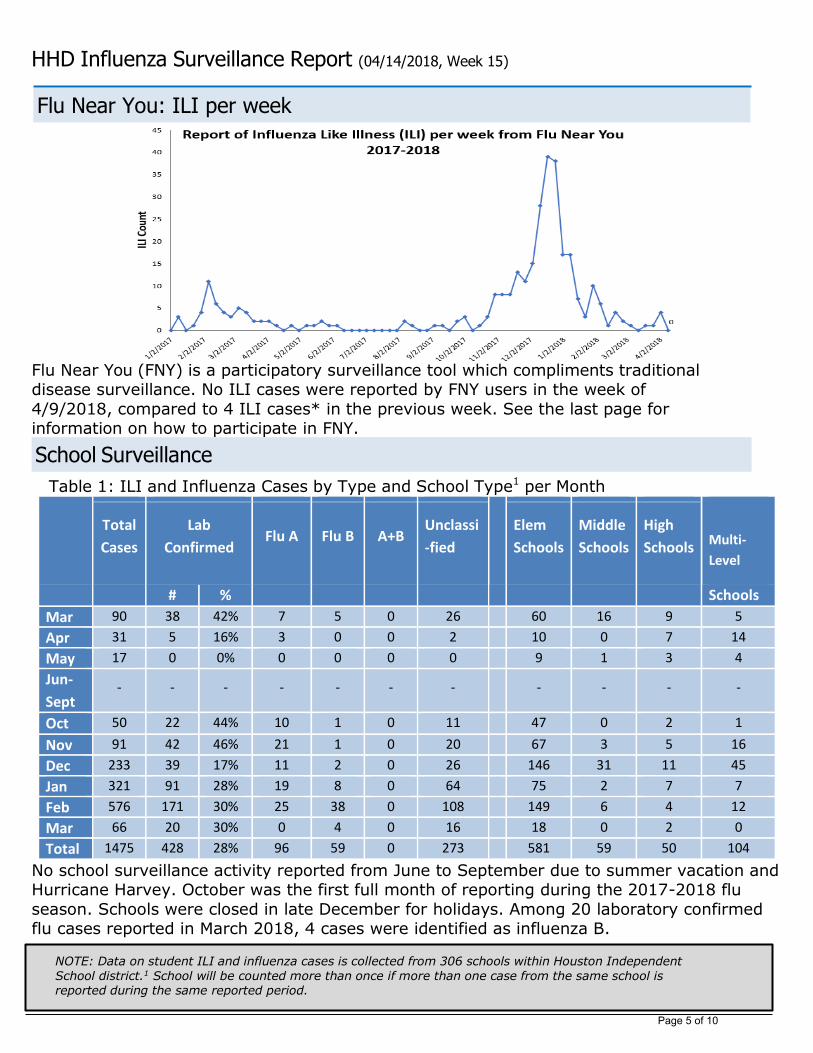
Flu Near You (FNY) is a participatory surveillance tool which compliments traditional disease surveillance. No ILI cases were reported by FNY users in the week of
4/9/2018, compared to 4 ILI cases* in the previous week. See the last page for information on how to participate in FNY.
Table 1: ILI and Influenza Cases by Type and School Type1 per Month
Multi-
Level
Total
Cases
Lab
Confirmed Flu A Flu B A+B
Unclassi
-fied
Elem
Schools
Middle
Schools
High
Schools
# % Schools
Mar 90 38 42% 7 5 0 26 60 16 9 5
Apr 31 5 16% 3 0 0 2 10 0 7 14
May 17 0 0% 0 0 0 0 9 1 3 4
Jun-
Sept - - - - - - -
- - - -
Oct 50 22 44% 10 1 0 11 47 0 2 1
Nov 91 42 46% 21 1 0 20 67 3 5 16
Dec 233 39 17% 11 2 0 26 146 31 11 45
Jan 321 91 28% 19 8 0 64 75 2 7 7
Feb 576 171 30% 25 38 0 108 149 6 4 12
Mar 66 20 30% 0 4 0 16 18 0 2 0
Total 1475 428 28% 96 59 0 273
581 59 50 104
No school surveillance activity reported from June to September due to summer vacation and Hurricane Harvey. October was the first full month of reporting during the 2017-2018 flu
season. Schools were closed in late December for holidays. Among 20 laboratory confirmed flu cases reported in March 2018, 4 cases were identified as influenza B.
NOTE: Data on student ILI and influenza cases is collected from 306 schools within Houston Independent
School district.1 School will be counted more than once if more than one case from the same school is reported during the same reported period.
Flu Near You: ILI per week
School Surveillance
Page 5 of 10
HHD Influenza Surveillance Report (04/14/2018, Week 15)
CDC Week Number 13
(Mar 25-31)
14
(Apr 01-07)
15
(Apr 08-14)
# of Influenza Tests Performed‡ 0 0 0
% Influenza Positive 0% 0% 0%
# Influenza A Positive 0 0 0
% Influenza A Positive 0% 0% 0%
# Influenza B Positive 0 0 0
% Influenza B Positive 0% 0% 0%
# Non-differentiated Positive 0 0 0
% Non-differentiated Positive 0% 0% 0%
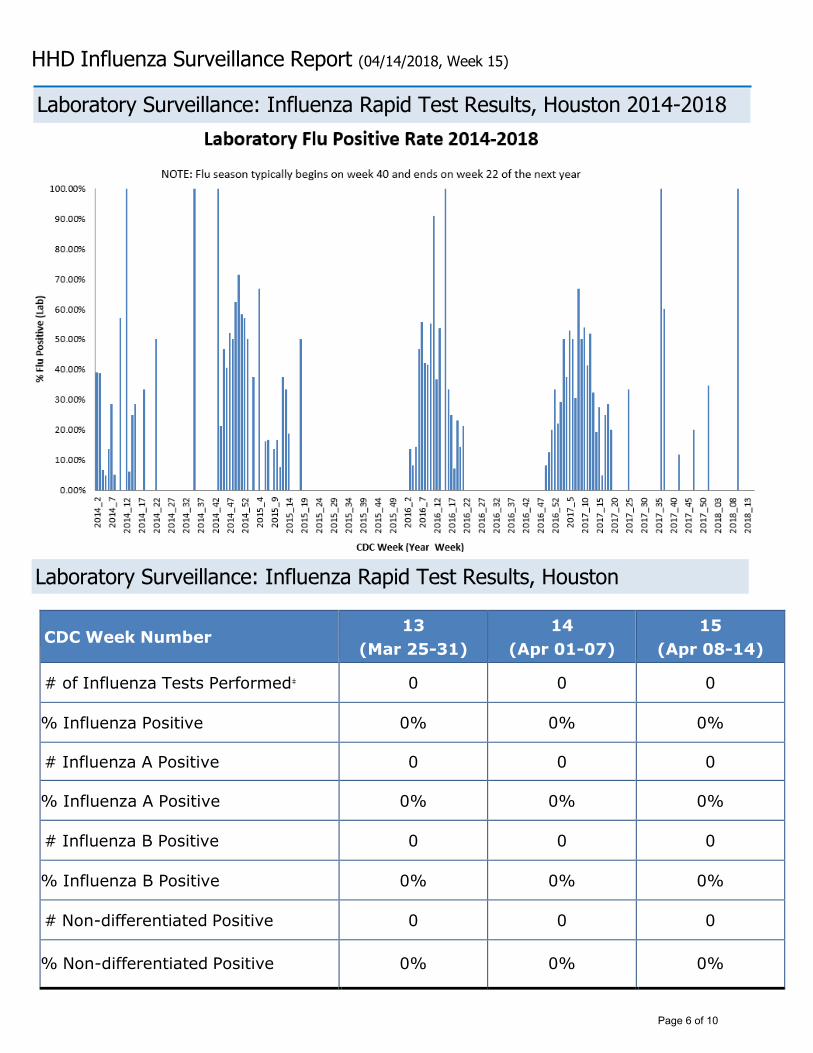
Laboratory Surveillance: Influenza Rapid Test Results, Houston 2014-2018
Laboratory Surveillance: Influenza Rapid Test Results, Houston
Page 6 of 10
HHD Influenza Surveillance Report (04/14/2018, Week 15)
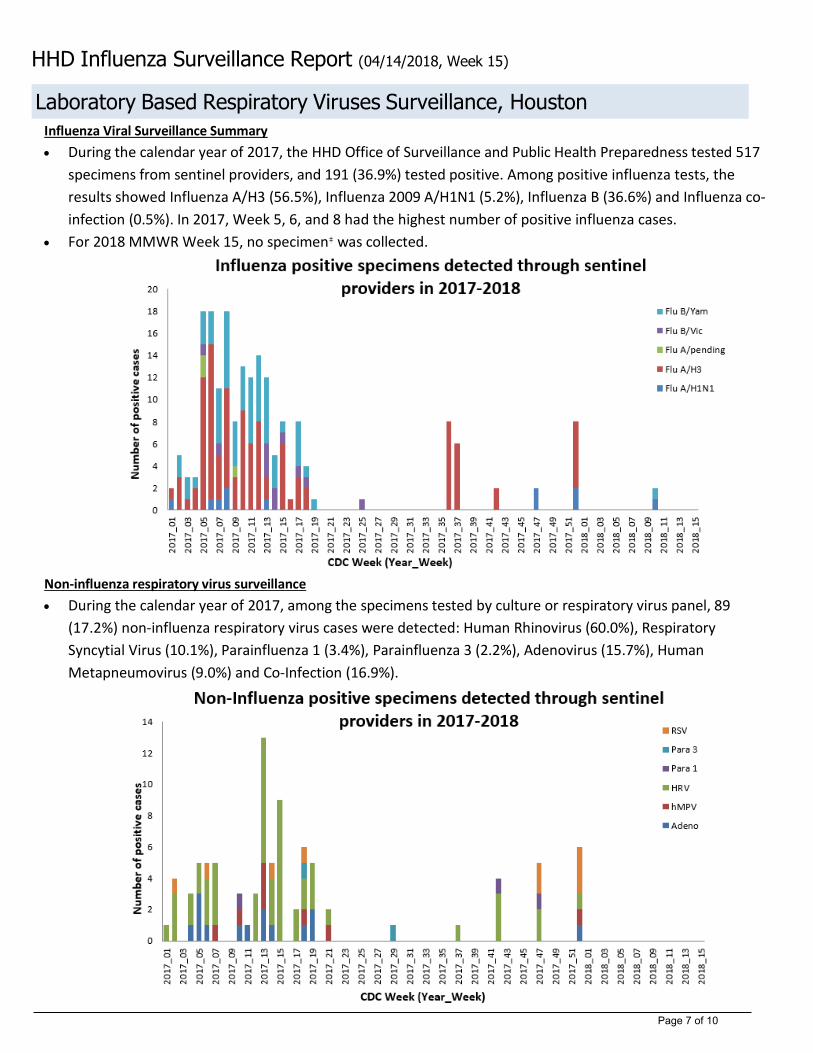
I nfluenz a Vir al Surv eillance Summary
• During the calendar year of 2017, the HHD Office of Surveillance and Public Health Preparedness tested 517
specimens from sentinel providers, and 191 (36.9%) tested positive. Among positive influenza tests, the
results showed Influenza A/H3 (56.5%), Influenza 2009 A/H1N1 (5.2%), Influenza B (36.6%) and Influenza co-
infection (0.5%). In 2017, Week 5, 6, and 8 had the highest number of positive influenza cases.
• For 2018 MMWR Week 15, no specimen‡ was collected.
Non-influenz a r espiratory v irus s urv eillanc e
• During the calendar year of 2017, among the specimens tested by culture or respiratory virus panel, 89
(17.2%) non-influenza respiratory virus cases were detected: Human Rhinovirus (60.0%), Respiratory
Syncytial Virus (10.1%), Parainfluenza 1 (3.4%), Parainfluenza 3 (2.2%), Adenovirus (15.7%), Human
Metapneumovirus (9.0%) and Co-Infection (16.9%).
Laboratory Based Respiratory Viruses Surveillance, Houston
Page 7 of 10
HHD Influenza Surveillance Report (04/14/2018, Week 15)
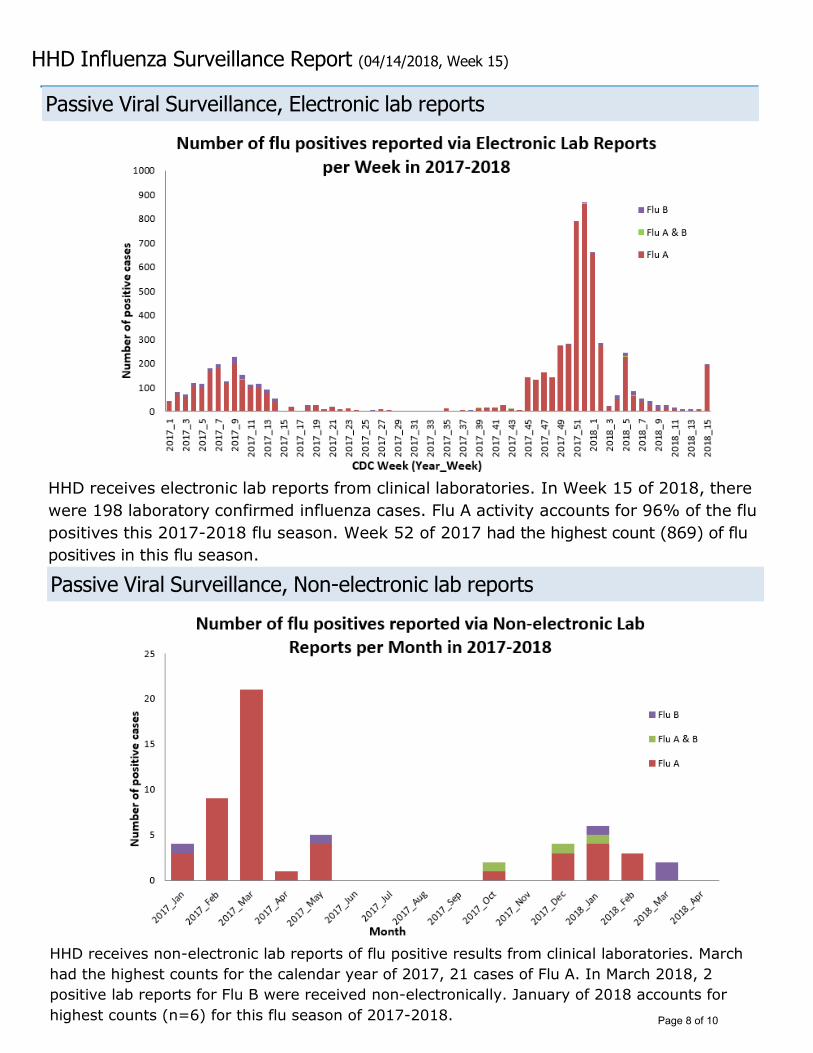
HHD receives electronic lab reports from clinical laboratories. In Week 15 of 2018, there
were 198 laboratory confirmed influenza cases. Flu A activity accounts for 96% of the flu
positives this 2017-2018 flu season. Week 52 of 2017 had the highest count (869) of flu
positives in this flu season.
HHD receives non-electronic lab reports of flu positive results from clinical laboratories. March
had the highest counts for the calendar year of 2017, 21 cases of Flu A. In March 2018, 2
positive lab reports for Flu B were received non-electronically. January of 2018 accounts for
highest counts (n=6) for this flu season of 2017-2018.
Passive Viral Surveillance, Electronic lab reports
Passive Viral Surveillance, Non-electronic lab reports
Page 8 of 10
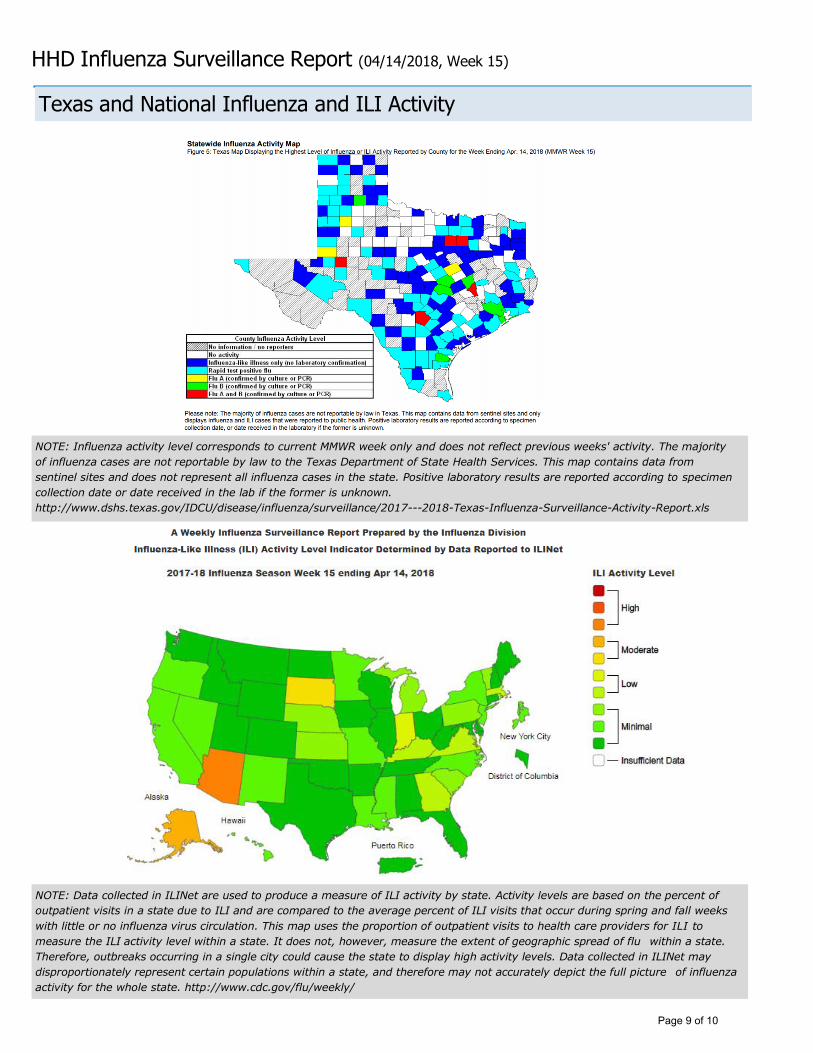
HHD Influenza Surveillance Report (04/14/2018, Week 15)
Texas and National Influenza and ILI Activity
NOTE: Influenza activity level corresponds to current MMWR week only and does not reflect previous weeks' activity. The majority
of influenza cases are not reportable by law to the Texas Department of State Health Services. This map contains data from
sentinel sites and does not represent all influenza cases in the state. Positive laboratory results are reported according to specimen
collection date or date received in the lab if the former is unknown.
http://www.dshs.texas.gov/IDCU/disease/influenza/surveillance/2017---2018-Texas-Influenza-Surveillance-Activity-Report.xls
NOTE: Data collected in ILINet are used to produce a measure of ILI activity by state. Activity levels are based on the percent of
outpatient visits in a state due to ILI and are compared to the average percent of ILI visits that occur during spring and fall weeks
with little or no influenza virus circulation. This map uses the proportion of outpatient visits to health care providers for ILI to
measure the ILI activity level within a state. It does not, however, measure the extent of geographic spread of flu within a state.
Therefore, outbreaks occurring in a single city could cause the state to display high activity levels. Data collected in ILINet may
disproportionately represent certain populations within a state, and therefore may not accurately depict the full picture of influenza
activity for the whole state. http://www.cdc.gov/flu/weekly/
Page 9 of 10
HHD Influenza Surveillance Report (04/14/2018, Week 15)
The Houston Influenza Surveillance Weekly Report is available on the
Houston Health Department web site at:
http://www.houstontx.gov/health/weekly-flu-report
Flu Near You is a participatory surveillance (crowd sourcing) tool which complements traditional disease surveillance activities. Registered users can obtain real-time information on flu activity and influenza vaccines in the Greater Houston Metropolitan Area. Flu Near You features include:
MAP CASES
Report symptoms Find vaccines
Map flu cases in the Greater Houston Metropolitan area
Get flu news
Share on social media This season HHD invites you to register for Flu Near You at https://flunearyou.org
NOTE: Influenza-like Illness (ILI) is defined as fever (temperature ≥ 100°F) plus a cough OR a sore throat, in the absence of a known cause other than influenza.
Houston ILI baselines were determined using the same method as the Centers for Disease Control and Prevention Regional ILI baselines. The baseline is developed by calculating the mean percentage ILI of ED visits during non-influenza weeks for the previous three seasons and adding two standard deviations. A non-influenza week is defined as periods of two or more consecutive weeks in which each week accounted for less than 2% of the season’s total number of specimens that tested positive for influenza. Additional information regarding Houston, Texas and national ILI activity can be accessed at: http://www.houstontx.gov/health/ http://www.dshs.texas.gov/IDCU/disease/influenza/surveillance/2017---2018-Texas-Influenza-Surveillance-Activity-Report.xls http://www.cdc.gov/flu/weekly/ http://www.who.int/csr/don/en/
The numbers for pediatric flu-related deaths may change as information becomes available.
** Flu-related deaths in adults are not required to be reported to health department. Numbers for flu-related deaths may change as information becomes available.
‡ The number of samples collected for influenza test was lower than expected due to the delay of availability of new rapid flu test kits from the manufacturer. † Inherent delays in death reporting and coding practices may cause the number of reported Pneumonia and Influenza deaths to vary considerably each week. * Information may change as the data becomes available.
Houston Health Department
Office of Surveillance and Public Health Preparedness
Program of Public Health Informatics
8000 N. Stadium Dr., 4th Floor
Houston, TX 77054
Main Phone Number: (832) 393-5080
Disease Reporting Fax Number: (832) 393-5232
24-Hour Disease Reporting Number: (832) 393-5080
Page 10 of 10