hhe report no. heta-2003-0016-2959, owens-illinois, lapel
TRANSCRIPT

NIOSH HEALTH HAZARD EVALUATION REPORT HETA #2003-0016-2959 Owens-Illinois Lapel, Indiana April 2005 DEPARTMENT OF HEALTH AND HUMAN SERVICES
Centers for Disease Control and Prevention National Institute for Occupational Safety and Health
This Health Hazard Evaluation (HHE) report and any recommendations made herein are for the specific facility evaluated and may not be universally applicable. Any recommendations made are not to be considered as final statements of NIOSH policy or of any agency or individual involved. Additional HHE reports are available at http://www.cdc.gov/niosh/hhe/reports
This Health Hazard Evaluation (HHE) report and any recommendations made herein are for the specific facility evaluated and may not be universally applicable. Any recommendations made are not to be considered as final statements of NIOSH policy or of any agency or individual involved. Additional HHE reports are available at http://www.cdc.gov/niosh/hhe/reports
This Health Hazard Evaluation (HHE) report and any recommendations made herein are for the specific facility evaluated and may not be universally applicable. Any recommendations made are not to be considered as final statements of NIOSH policy or of any agency or individual involved. Additional HHE reports are available at http://www.cdc.gov/niosh/hhe/reports
Additional HHE reports are available at http://www.cdc.gov/niosh/hhe/reports

ii
PREFACE The Hazard Evaluation and Technical Assistance Branch (HETAB) of the National Institute for Occupational Safety and Health (NIOSH) conducts field investigations of possible health hazards in the workplace. These investigations are conducted under the authority of Section 20(a)(6) of the Occupational Safety and Health (OSHA) Act of 1970, 29 U.S.C. 669(a)(6) which authorizes the Secretary of Health and Human Services, following a written request from any employers or authorized representative of employees, to determine whether any substance normally found in the place of employment has potentially toxic effects in such concentrations as used or found. HETAB also provides, upon request, technical and consultative assistance to federal, state, and local agencies; labor; industry; and other groups or individuals to control occupational health hazards and to prevent related trauma and disease. Mention of company names or products does not constitute endorsement by NIOSH.
ACKNOWLEDGMENTS AND AVAILABILITY OF REPORT This report was prepared by Chad H. Dowell, Elena H. Page, Charles Mueller, and Vincent Mortimer, of HETAB, Division of Surveillance, Hazard Evaluations and Field Studies (DSHEFS); and John Snawder of Biomonitoring and Health Assessment Branch (BHAB), Division of Applied Research and Technology (DART). Field assistance was provided by Chandran Achutan, Acacia Bledsoe, Donnie Booher, Melissa Finley, and Brad King from HETAB, DSHEFS; and Barbara MacKenzie, Debbie Sammons, and Shirley Robertson of BHAB, DART. Analytical support was provided by DataChem Laboratory and Ronnee Andrews of Chemical Exposure and Monitoring Branch, DART. Desktop publishing was performed by Shawna Watts. Editorial assistance was provided by Ellen Galloway. Copies of this report have been sent to the Glass, Molders, Pottery, Plastics and Allied Workers International Union and management representatives at Owens-Illinois and the OSHA Regional Office. This report is not copyrighted and may be freely reproduced. The report may be viewed and printed from the following Internet address: http://www.cdc.gov/niosh/hhe/. Single copies of this report will be available for a period of 3 years from the date of this report. To expedite your request, include a self-addressed mailing label along with your written request to:
NIOSH Publications Office 4676 Columbia Parkway Cincinnati, Ohio 45226
800-356-4674 After this time, copies may be purchased from the National Technical Information Service (NTIS) at 5825 Port Royal Road, Springfield, Virginia 22161. Information regarding the NTIS stock number may be obtained from the NIOSH Publications Office at the Cincinnati address.
For the purpose of informing affected employees, copies of this report shall be posted by the employer in a prominent place accessible to the employees for a period of 30 calendar days.

iii
HIGHLIGHTS OF THE NIOSH HEALTH HAZARD EVALUATION
Evaluation of monobutyltin trichloride exposure among glass workers.
The National Institute for Occupational Safety and Health (NIOSH) received a request for a health hazard evaluation (HHE) at the Owens-Illinois (OI) plant in Lapel, Indiana. The HHE request was submitted by the Glass, Molders, Pottery, Plastics and Allied Workers International Union because a worker at the plant had become ill, and it was perceived that the illness was secondary to the recent introduction of monobutyltin trichloride (MBTC) into the plant as a hot end coating agent.
What NIOSH Did
# We talked with workers about symptoms related to the hot end coating agent
# We reviewed medical records for individuals who reported symptoms
# We measured worker exposure to MBTC, tin, and organic tin
# We looked at the ventilation on the vapor deposition hoods (VDHs)
What NIOSH Found
# Hot end and maintenance workers are exposed to and absorbing MBTC
# Surfaces in the hot end are contaminated with MBTC
# Maintenance workers are over occupational exposure limits for tin and organic tin when cleaning the VDHs or baghouse
What Owens-Illinois Managers Can Do
# Implement local exhaust ventilation for work conducted inside the VDHs and baghouse
# Have workers use a high efficiency particulate air filter vacuum when cleaning the VDHs
# Provide new cotton gloves to workers when old become contaminated with MBTC
# Install a hand wash facility for workers exiting the hot end
What the Owens-Illinois Employees Can Do
# Use high efficiency particulate air filter vacuum when cleaning the VDHs
# Use PPE correctly when working on the VDHs or baghouse
# Replace cotton gloves after working with MBTC
# Wash hands, forearms, and face with soap and water when leaving the hot end
# Do not eat, drink, or use tobacco products in the hot end
What To Do For More Information: We encourage you to read the full report. If you
would like a copy, either ask your health and safety representative to make you a copy or call
1-513-841-4252 and ask for HETA Report #2003-0016-2959
iv
Health Hazard Evaluation Report 2003-0016-2959 Owens-Illinois Lapel, Indiana
April 2005
Chad H. Dowell, MS Elena H. Page, MD, MPH
Charles Mueller, MS Vince Mortimer, MS, PE
SUMMARY The National Institute for Occupational Safety and Health (NIOSH) received a request for a health hazard evaluation (HHE) at the Owens-Illinois (OI) plant in Lapel, Indiana. The HHE request was submitted by the Glass, Molders, Pottery, Plastics and Allied Workers International Union (GMP) because a worker at the plant had become ill, and it was perceived that the illness was due to exposure to the recently introduced compound monobutyltin trichloride (MBTC), brought into the plant as a hot end coating agent. Between February and June 2003, NIOSH personnel made three site visits to the OI facility. On February 3, 2003, an opening conference was held between NIOSH, OI management, GMP Local 207, and GMP International representatives. The opening conference was followed by a walk-through, confidential employee interviews, and industrial hygiene sampling of surfaces for tin and MBTC. Medical records were reviewed for three individuals who reported symptoms possibly related to MBTC exposure. On March 27, 2003, additional wipe samples were collected for MBTC and a ventilation survey of the vapor deposition hoods (VDHs) was conducted. Between June 23–30, 2003, environmental sampling for tin, MBTC, and hydrochloric acid (HCl) and biological monitoring for tin and MBTC in urine was conducted with two groups of workers: hot end and maintenance workers who have the highest potential for exposure and the office and shipping workers who have the lowest potential for exposures to tin and MBTC. Several employees reported that MBTC has a strong odor, will “take your breath away,” and irritates or burns the skin upon contact. NIOSH review of the medical records failed to document an association of those three employees’ symptoms with MBTC exposure. Two were not consistent with reported health effects of organotins. One had medical problems that could have been associated with occupational exposures; this individual also had alternative explanations for the symptoms and lack of objective evidence to distinguish the etiology. All (5/5) surfaces sampled for tin were positive. MBTC was detected in 13/13 surfaces sampled in the hot end, in 1/5 from the office, and 0/10 in the cold end, maintenance department, and shipping. Personal breathing zone (PBZ) HCL concentrations ranged from non-detect (ND) to 0.17 milligram per cubic meter (mg/m3) while general area concentrations ranged from ND to 1.8 mg/m3. The ventilation survey and observations of work practices identified a deficiency in controls during the cleaning and maintenance of the VDH and baghouse. PBZ air concentrations of tin and MBTC for office and shipping personnel were all ND or trace while concentrations for the hot end and maintenance workers ranged from trace to 4.6 mg/m3 for tin and ND to

v
1.5 mg/m3 for MBTC. Hand wipe concentrations of MBTC from the office and shipping workers ranged from ND to 0.13 milligram per wipe (mg/wipe), while hot end and maintenance workers ranged from ND to 4.0 mg/wipe. Hot end and maintenance workers’ urinary tin concentrations ranged from ND to 76 micrograms per gram creatinine (µg/g creatinine) while office and shipping workers’ concentrations ranged from ND to 8.0 µg/g creatinine. Hot end and maintenance workers’ urinary MBTC concentrations ranged from ND to 51 µg/g creatinine, while office and shipping workers’ concentrations were all below the detection limit.
Based on surface wipes and PBZ air sampling, MBTC and tin are present in the work environment from the hot end coating process despite the use of a VDH. One tin and two MBTC air samples exceeded the NIOSH Recommended Exposure Limit (REL), the Occupational Safety and Health Administration’s (OSHA) Permissible Exposure Limit (PEL), and the American Conference of Governmental Industrial Hygienist (ACGIH®) Threshold Limit Value (TLV®) for both tin and organic tin, 2 and 0.1 mg/m3 (as Sn) respectively. All three samples were collected on days work was performed in the baghouse. Forty-five percent of hot end and maintenance workers had at least one urinary tin concentration above levels typically found in the general population. Hot end and maintenance workers are exposed to MBTC and tin at work and absorb and excrete them in their urine. Recommendations are provided in this report to control and decrease worker exposure until more is known about the health effects of MBTC.
Keywords: SIC 3221 (Beverage containers, glass, manufacturing), NAICS 327213 (Other Pressed and Blown Glass and Glassware Manufacturing), monobutyltin trichloride, tin, vapor deposition hood, glass containers, hot end coating

Table of Contents Preface..........................................................................................................................................................ii Acknowledgments and Availability of Report..........................................................................................ii Highlights of the NIOSH Health Hazard Evaluation .............................................................................iii Summary.....................................................................................................................................................iv Introduction.................................................................................................................................................1 Background .................................................................................................................................................1 Methods........................................................................................................................................................2
Medical..................................................................................................................................................... 2 Confidential Interviews ...................................................................................................................... 2 Medical Records Review .................................................................................................................... 2 Biological Monitoring ......................................................................................................................... 2
Tin Urine Analysis .......................................................................................................................... 3 MBTC Urine Analysis .................................................................................................................... 3
Industrial Hygiene .................................................................................................................................. 3 MBTC Hand and Surface Samples ................................................................................................... 3 Tin Surface Samples ........................................................................................................................... 4 MBTC Cotton Glove Samples............................................................................................................ 4 MBTC Air Samples............................................................................................................................. 4 Tin Air Samples................................................................................................................................... 4 Hydrochloric Acid Air Samples......................................................................................................... 4
Ventilation ............................................................................................................................................... 5 Statistical Analysis .................................................................................................................................. 5
Evaluation Criteria .....................................................................................................................................5 Tin ............................................................................................................................................................ 6
Monobutyltin Trichloride .................................................................................................................. 6 Toxicokinetics of MBTC................................................................................................................. 6 Effects in Animals or Laboratory Studies .................................................................................... 7
Biomarkers .......................................................................................................................................... 7 Occupational Exposure Limits .......................................................................................................... 7
Hydrochloric Acid................................................................................................................................... 8 Results ..........................................................................................................................................................8
Surface Sampling .................................................................................................................................... 8 Confidential Interviews and Medical Records Review........................................................................ 8

2
Biologic and Environmental Monitoring Evaluation........................................................................... 8 Tin ........................................................................................................................................................ 8 Hydrochloric Acid............................................................................................................................. 10 Pre- and Post-Hand Wash Monobutyltin Trichloride Samples.................................................... 10 Cotton Glove...................................................................................................................................... 10
Ventilation ............................................................................................................................................. 10 Discussion and Conclusions .....................................................................................................................11 Recommendations .....................................................................................................................................12 References..................................................................................................................................................13 Appendix A................................................................................................................................................24 Appendix B ................................................................................................................................................28 Appendix C................................................................................................................................................32
Toxicokinetics of Organotins ........................................................................................................... 32 Absorption after Inhalation ......................................................................................................... 32 Percutaneous Absorption ............................................................................................................. 32 Gastrointestinal Absorption......................................................................................................... 32 Distribution.................................................................................................................................... 32 Biotransformation and Excretion................................................................................................ 32
Toxicity .............................................................................................................................................. 32 Human Health Effects of Organotins.......................................................................................... 33
References.......................................................................................................................................... 34 Appendix D................................................................................................................................................36
Example of Ventilation Designees ....................................................................................................... 36 Vapor Deposition Hood .................................................................................................................... 36 Hopper Door...................................................................................................................................... 37 References.......................................................................................................................................... 38

Health Hazard Evaluation Report No. 2003-0016-2959 Page 1
INTRODUCTION The National Institute for Occupational Safety and Health (NIOSH) received a request for a health hazard evaluation (HHE) at the Owens-Illinois (OI) plant in Lapel, Indiana. The HHE request was submitted by the Glass, Molders, Pottery, Plastics and Allied Workers International Union (GMP) because a worker at the plant had become ill, and it was perceived that the illness was due to exposure to the recently introduced compound monobutyltin trichloride (MBTC) into the plant as a hot end coating agent. The Occupational Safety and Health Administration (OSHA) had previously investigated this issue, conducting air sampling for total organic tin and tin during the cleaning out process, following NIOSH Method 7300 and 5504. OI industrial hygiene personnel performed side-by-side sampling during the OSHA inspection. All samples were below the OSHA permissible exposure limit (PEL) of 0.1 milligrams per cubic meter (mg/m3) for organic tin compounds as tin (Sn) and no citation was issued. Between February and June 2003, NIOSH personnel made three visits to the facility. An opening conference was held between NIOSH, OI management, GMP Local 207 and International representatives on February 3, 2003. The opening conference was followed by a facility walk-through, confidential employee interviews, and industrial hygiene sampling of surfaces for tin and MBTC. Medical records were reviewed for three individuals who reported symptoms possibly related to MBTC exposure. On March 27, 2003, additional wipe samples were collected for MBTC and a ventilation survey of the vapor deposition hoods (VDHs) was conducted. Between June 23–30, 2003, environmental sampling for tin, MBTC, and hydrochloric acid (HCl) and biological monitoring for tin and MBTC in urine was conducted with two groups of workers: hot end and maintenance workers who have the highest potential for exposure and the office and shipping workers who have the lowest potential for exposures to tin and MBTC.
BACKGROUND According to company literature, OI is the largest manufacturer of glass containers in North America. Glass containers for the beer, spirit, juice, and tea industries are manufactured at the Lapel, Indiana facility. This plant is 100 years old, and employs 188 production, packing, and shipping workers. Four office workers are located in a building separate from production. Operations are continuous, with four crews (A, B, C, and D) that rotate weekly, and a Z crew that works straight days. A, B, C, and D crews each have three maintenance workers. These maintenance workers do not routinely work on the hot end coating machines or VDHs. The Z crew has approximately 20 maintenance workers, one of whom is primarily responsible for maintaining and cleaning the VDHs, and another who serves as his backup. In the hot end of the glass-making process, raw materials including cullet (recycled glass), sand, soda ash, and limestone are melted together in a gas furnace at temperatures of 2,300°F to 2,800°F. The molten glass is cut into uniform gobs and sent to one of four forming machines that force the molten gobs into a mold. The molded container then enters the VDH where MBTC is applied to the exterior. After the hot end coating, the glass containers are conditioned in an annealing lehr. As the glass containers leave the annealing lehr, a cold end coating (polyethylene) is applied. The glass containers are then inspected and packaged for shipment to the customer. About 500 bottles are manufactured per minute on each of the four lines. MBTC decomposes within the VDH in the hot end coating process. The temperature within the VDH (200°F to 300°F) and the temperature of the hot glass (400°F to 900°F) allows the MBTC to decompose to form a thin layer of tin oxide on the glass surface. Other products of the decomposition include hydrochloric acid gas (HCl), carbon dioxide, and water. It is possible that not all MBTC is decomposed. The VDH is designed to prevent MBTC from being dispensed when the temperature in the hood is

Page 2 Health Hazard Evaluation Report No. 2003-0016-2959
too low to produce good evaporation, so that liquid cannot accumulate. Maintenance personnel are responsible for cleaning and maintaining the VDHs. These workers, along with the hot end workers, have the greatest potential for exposure to MBTC. Normal cleaning for the VDHs is performed when the bottle machine is stopped for a job change out or maintenance, and yearly to prevent the exhaust from clogging. Cleaning includes opening both sides of the VDHs to collect the excess tin oxide and MBTC. Tools used to clean the VDHs include a variety of putty knives, screwdrivers, and metal rods. The residual powder is swept with a shop vacuum. At each end of the hood, square-tubular columns, with exhaust ventilation openings, rise on both sides of the line openings through which the bottles enter and exit the VDH enclosure. Additional exhaust ventilation is positioned above the stream of newly coated bottles being conveyed out of the enclosure. The ducts exhausting the hoods that enclose the glass-bottle coating operation for each of the two production lines in the south half of the plant initially join into a single duct. This single duct is then joined sequentially by a duct exhausting each of the two production lines in the north half of the plant. The combined duct is exhausted by a fan that pulls the particle-laden air through a pulse-jet, bag-filter hopper. Before entering the hopper, a bypass duct branches off and connects to the intake of a second fan that operates when the main fan becomes ineffective due to a clog or malfunction. The inlet to the hopper is controlled by a large butterfly valve that can be closed to seal the hopper inlet during a clog or malfunction. Prior to the butterfly valve, but after the bypass branching, an ammonia supply line connects to the main duct. Ammonia is released into the duct to form a slurry with the stream of particulate dust. The slurry falls to the bottom of the hopper, and any remaining particles are collected on the surface of the fabric bags by the pull of the air being drawn from the hopper through the bag fabric by the main exhaust fan. This air filtered
through the fabric bags is discharged through a stack rising through and above the roof of the building. The caked build-up of particles on the fabric filter is periodically dislodged by blasts of air, causing chunks of caked particles to fall to the bottom of the hopper and returning uncaked particles into the swirling air inside the hopper to form the ammonia-reaction slurry or to collect again on the bag filter surface. The slurry is assisted in its gravity-propelled exit from the hopper by a motor-driven rotary valve, which moves the slurry down into a vertical pipe connected to the top of a 55-gallon drum. Through a supply line connected to the vertical pipe, more ammonia is added to the slurry, creating a more fluid slurry that can be easily moved through a drain line to storage totes for transport to a recycling facility.
METHODS Medical
Confidential Interviews During the initial site visit, 27 employees were interviewed onsite, including 5 reported by the union either to have symptoms or to work with the hoods regularly. The others were randomly selected from the roster of hot end and maintenance employees. Two additional individuals reported by the union to have symptoms were interviewed by telephone.
Medical Records Review Personal medical records were reviewed for three current or former employees who had received medical care for illness perceived by them to be related to MBTC exposure.
Biological Monitoring During the third site visit, two groups of workers, those with the highest potential for exposure to tin and MBTC, and those with the lowest potential for exposure, participated in a biologic and environmental monitoring evaluation. The purpose of this evaluation was to determine whether MBTC was being

Health Hazard Evaluation Report No. 2003-0016-2959 Page 3
absorbed by workers, and if possible to determine the route of exposure. Hot end workers and maintenance personnel whose duties involve cleaning and maintaining the VDHs were considered to have the highest exposure potential. Office and shipping workers were considered to have the lowest exposure potential. All workers in these areas with the schedules outlined in the next section were invited to participate. Informed consent was obtained from all participants. Occupational exposure to MBTC was assessed by measuring tin and MBTC in the urine. Spot urine samples were collected throughout the workweek from all study participants. Initial samples were collected prior to the start of the first workweek. For shipping, day maintenance, and office workers, this was on Monday morning. For hot end workers this was after their long weekend, which is 4 days off. This was on Tuesday at 4 p.m., with the last day of work having been the previous Friday from 8 a.m. to 4 p.m. This approach provided the greatest opportunity for determining baseline levels. Specimens were also collected at the end of each shift for the entire workweek (7 days for hot end and 5 for shipping, maintenance, and office workers). The end of the workweek was Friday at 4 p.m. for shipping, office, and day maintenance workers, and the following Monday at midnight for the hot end workers. Subjects in both groups provided daily spot urine samples for the interval between the end of the workweek and the beginning of the next workweek (off days). Subjects received written and oral instructions for the proper collection of urine samples. Each urine sample was collected in a sterile, 250 milliliter (mL) plastic cup. Subjects providing samples for the period between the end of the workweek and the start of a new workweek got collection cups to submit one spot urine for each day away from work. Subjects refrigerated their specimens at home and brought them to the NIOSH investigators when they returned to work after their days off. A brief questionnaire was administered at the beginning of the study to determine other sources of tin exposure and document job history.
Tin Urine Analysis Urine collected from subjects was shaken and a 30 mL aliquot was removed to separately labeled containers for analysis. Urine collected for tin determination was frozen and provided to DataChem Laboratories for analysis. Samples were analyzed by a Milton Roy Spectronic 20D spectrophotometer following preparation with a Sigma Diagnostics test kit for creatinine content. Tin was analyzed using inductively coupled plasma mass spectrometry (ICP-MS) following the NIOSH Manual of Analytical Methods (NMAM) Method 8310 for Metals in Urine.1 Analytical limits are presented in Table 1.
MBTC Urine Analysis Urine collected from subjects was shaken and a 30 mL aliquot was removed to separately labeled containers for analysis. Urine collected for MBTC determination was frozen and provided to DataChem Laboratories for analysis. Samples were analyzed by a Milton Roy Spectronic 20D spectrophotometer following preparation with a Sigma Diagnostics test kit for creatinine content. MBTC was analyzed using ICP-MS following the draft NMAM Method 8320 for Butyltin Chlorides in Urine.2 Analytical limits are presented in Table 1. The complete draft NMAM Method 8320 for Butyltin Chlorides in Urine is presented in Appendix A.
Industrial Hygiene
MBTC Hand and Surface Samples Surface wipe samples were collected for MBTC analysis during the first and second site visits. Sampling sites included workstations in the hot end of the plant, a table in both the cold and hot end cafeterias, tables in the front office, an undisturbed pole next to the VDH, and the outside of the drums containing MBTC. In addition, wipe samples for MBTC were collected from the hands of three hot end workers and one maintenance worker on the way to lunch, after washing their hands, and as they returned from lunch. The maintenance worker’s hands, inside of gloves, respirator, and tools

Page 4 Health Hazard Evaluation Report No. 2003-0016-2959
used during the clean out of a VDH were also sampled for MBTC. Wipe samples for MBTC were collected on work days from the hands of all workers who submitted urine specimens during the final site visit. Workers were asked to wipe the front and back of both hands outward from the wrist for 1 minute before their lunch break. Additional wipe samples were collected from the surfaces (workstations and tables) of their work areas and again from the hands of two maintenance workers and six hot end workers at three consecutive times, before and after washing their hands. Surface and hand samples were collected on GhostWipes® during the first and second site visits. It was determined that AlphaWipe® polyester cleanroom wipes (with 4 mL of deionized water) had a higher recovery so they were used during the final site visit. The GhostWipes and AlphaWipes were analyzed according to the draft NMAM Method 9108 for MBTC3 on wipes using liquid chromatography inductively coupled plasma atomic emission spectroscopy (LC-ICP-AES). Analytical limits are presented in Table 2. The complete draft NMAM Method 9108 for MBTC on Wipes is presented in Appendix B.
Tin Surface Samples Wipe samples were collected for tin analysis during the first site visit. Sampling sites included workstations in the hot end of the plant, a table in each cafeteria, and the outside of drums containing MBTC. Samples were collected on GhostWipes and analyzed for tin according to NMAM Method 7300 for Elements by ICP.1 Analytical limits are presented in Table 2.
MBTC Cotton Glove Samples Samples from the index finger and palm of three cotton gloves (a new, a used, and a laundered glove) from hot end workers were analyzed for MBTC. The glove samples were analyzed according to the draft NMAM Method 9108 for MBTC3 on wipes. Results are reported as qualitative because neither the limit of detection (LOD) nor the limits of quantitation (LOQ) for
MBTC on the cotton gloves were determined. All samples positive for MBTC were above the LOQ calculated for MBTC on AlphaWipe samples (0.033 mg/sample).4
MBTC Air Samples During the third site visit, full shift personal breathing zone (PBZ) air samples for MBTC were collected on each worker who submitted a urine specimen on all workdays that urine specimens were collected. Samples were collected on OSHA versatile samplers (OVS), with XAD-2 resin and a glass fiber filter, at a calibrated flow rate of 1 liter per minute (Lpm). The samples were analyzed according to the NMAM Method 5526 for methyltin chlorides1 modified for MBTC following a method developed by the Organotin Environmental Program (ORTEP) Association for Butyltin Chlorides in Air.5 Sample concentrations were calculated based on the actual monitoring time (time-weighted average [TWA-actual] concentrations) instead of an 8-hour TWA concentration so that the sampling data could be compared between days. Analytical limits are presented in Table 2.
Tin Air Samples During the third site visit, full shift PBZ air samples for tin were collected on each worker who submitted a urine specimen on all workdays that urine specimens were collected. Air samples for tin were collected on 37-mm diameter, (0.8-µm pore-size) mixed cellulose ester (MCE) filters at a calibrated flow rate of 2 Lpm. The filters were analyzed for tin according to the NMAM Method 7300 for Elements by ICP1 modified for hotblock digestion. Sample concentrations were calculated based on the actual monitoring time (time-weighted average [TWA-actual] concentrations) instead of an 8-hour TWA concentration so that the sampling data could be compared between days. Analytical limits are presented in Table 2.
Hydrochloric Acid Air Samples During the third site visit, general area (GA) and PBZ air samples for HCl were collected from hot end workers not submitting a urine specimen

Health Hazard Evaluation Report No. 2003-0016-2959 Page 5
(another crew). Air samples for HCl were collected on silica gel tubes at a calibrated flow rate of 100 cubic centimeters per minute (cc/min). The tubes were analyzed for HCl according to NMAM Method 7903 for Inorganic Acids.1 Sample concentrations were calculated based on the actual monitoring time (time-weighted average [TWA-actual] concentrations) instead of an 8-hour TWA concentration so that the sampling data could be compared between days. Analytical limits are presented in Table 2.
Ventilation The flow of air around and into the openings at each end of the bottle coating enclosures was observed using “smoke tubes” (MSA #458481, Mine Safety Appliances Company, Pittsburgh, Pennsylvania) which are 5-inch lengths of ½-inch diameter, clear plastic tubing containing two axially aligned glass ampules, each filled with a different granulated chemical substance. After the ampules have been broken inside the tubing, a thin trail of an aerosol resembling smoke is produced by a chemical reaction involving the granules each time air is forced through the tube by squeezing an attached rubber bulb. The “smoke” was released at many points outside the entrance and exit openings of the bottle coating enclosures and observed to note whether it flowed into or out of the opening. Other selected points around the enclosures and the dust transport, collection, and filtering system were similarly evaluated.
Statistical Analysis SAS Version 9.1.2 software (SAS Institute, Cary, North Carolina) was used for the statistical analyses. Results with p values < 0.05 were considered statistically significant. The Mixed procedure in SAS was used to construct models that compared air, hand, and urine measures for the two exposure groups. To examine possible relationships between the continuous urine measures and the continuous air and hand measures, regression models were developed using the Mixed procedure. The models accounted for potential correlations between repeat measurements taken on subjects. The distribution of some of the continuous
variables was skewed to the right. A log transformation was applied to these variables when it helped satisfy statistical model assumptions. Paired t tests were used to determine if urinary measures of tin and MBTC differed from the beginning of the workweek to the end of the workweek. Any possible change in these urine measures from the end of the subjects’ workweek to the end of the subjects’ time off was also examined using paired t tests. MBTC was first converted to tin by multiplying the result by 0.42 (the ratio of atomic weight of tin to the atomic weight of MBTC) to compare MBTC results to the organic tin (as tin) results.
EVALUATION CRITERIA As a guide to the evaluation of the hazards posed by workplace exposures, NIOSH field staff employ environmental evaluation criteria for the assessment of a number of chemical and physical agents. These criteria are intended to suggest levels of exposure to which most workers may be exposed up to 10 hours per day, 40 hours per week for a working lifetime without experiencing adverse health effects. It is, however, important to note that not all workers will be protected from adverse health effects even though their exposures are maintained below these levels. A small percentage may experience adverse health effects because of individual susceptibility, a pre-existing medical condition, and/or a hypersensitivity (allergy). In addition, some hazardous substances may act in combination with other workplace exposures, the general environment, or with medications or personal habits of the worker to produce health effects even if the occupational exposures are controlled at the level set by the criterion. These combined effects are often not considered in the evaluation criteria. Also, some substances are absorbed by direct contact with the skin and mucous membranes, which potentially increases the overall exposure. Finally, evaluation criteria may change over the years as new information on the toxic effects of an agent become available.

Page 6 Health Hazard Evaluation Report No. 2003-0016-2959
The primary sources of environmental evaluation criteria for the workplace are: (1) NIOSH Recommended Exposure Limits (RELs),6 (2) the American Conference of Governmental Industrial Hygienists’ (ACGIH®) Threshold Limit Values (TLVs®),7 and (3) the U.S. Department of Labor, OSHA Permissible Exposure Limits (PELs).8 Employers are encouraged to follow the OSHA limits, the NIOSH RELs, the ACGIH TLVs, or whichever are the more protective criteria. OSHA requires an employer to furnish employees a place of employment free from recognized hazards that are causing or are likely to cause death or serious physical harm [Occupational Safety and Health Act of 1970, Public Law 91-596, sec. 5(a)(1)]. Thus, employers should understand that not all hazardous chemicals have specific OSHA exposure limits such as PELs and short-term exposure limits (STELs). An employer is still required by OSHA to protect its employees from hazards, even in the absence of a specific OSHA PEL. A TWA exposure refers to the average airborne concentration of a substance during a normal 8- to 10-hour workday. Some substances have recommended STEL or ceiling values that supplement the TWA where there are recognized toxic effects from higher exposures over the short-term.
Tin Tin is a soft, silvery metal that is a naturally occurring element. Tin occurs naturally in food, and is also present in foods stored in tin cans. Tin is present in air, water, and soil, and is found in humans at low levels. Tin combined with a substance like chlorine or sulfur is called an inorganic tin compound, and tin combined with substances containing carbon is called an organic tin compound, or organotin. Inorganic tin compounds are in toothpaste, soaps, and dyes. The inorganic tins are not very toxic due to poor absorption by all routes of exposure.9 Organotins are used to make pesticides, plastics, and food packaging, among other things. A
detailed discussion of the toxicity of organotins can be found in Appendix C.
Monobutyltin Trichloride MBTC is a monoalkyl organotin with one side chain that contains four carbon atoms and three side chains of chloride. It is not volatile at room temperature. Mists or aerosols of the compound could be inhaled. Eating seafood is the primary source of butyltin exposure in humans because tributyltin (TBT) was used for decades as an antifouling agent for ships. While its use is now limited to larger vessels, TBT and its metabolites, dibutyltin (DBT) and monobutyltin (MBT), are still widely present in marine food chains, with TBT dominating.10 Over 50% of current global use of MBT and DBT is for stabilizing polyvinyl chloride (PVC).11 This leads to widespread household exposure in the general population. For example, diaper covers made of polyester fabric contained 33.7 µg/g DBT. Silicone baking parchments contained 130 µg/g MBT. MBT, DBT, and TBT were detected in 53%, 81%, and 70%, respectively, of 32 blood samples of central Michigan blood donors in 1998.11
Toxicokinetics of MBTC There are no reports regarding percutaneous absorption of MBTC, however the Robinson mathematical model for skin permeation indicates it can contribute to systemic toxicity.12 Ueno et al. fed mice 180 micromole per kilogram (µmol/kg) MBTC, dibutyltin dichloride (DBTC), and tributyltin chloride (TBTC) and examined urinary excretion of total tin.13 Excretion was highest for mice fed TBTC, followed by DBTC, with much lower excretion of tin in mice fed MBTC. Of the tin that was excreted from the mice fed MBTC, most was within 24 hours after dosing. Mice fed DBTC excreted tin over 96 hours, with peak excretion between 24 and 72 hours. Mice fed TBTC excreted tin over 96 hours, with peak excretion between 24 and 48 hours. In addition, there was significant deposition of TBTC and DBTC in the liver, with resulting hepatotoxicity, although MBTC had minimal deposition in the liver and no hepatotoxicity. Overall, this suggests low GI absorption of MBTC.

Health Hazard Evaluation Report No. 2003-0016-2959 Page 7
Effects in Animals or Laboratory Studies There are very little animal data and no human data on the health effects of MBTC. What information does exist suggests a low level of toxicity. The oral lethal dose for 50% of animals (LD50) for MBTC is 2200–2300 milligrams per kilogram body weight (mg/kg) in the rat, compared to 122–349 mg/kg for TBT chloride, which demonstrates the relatively lesser degree of toxicity of monosubstituted organotins noted above.14 Mice given a single oral dose of 4 grams per kilogram body weight (g/kg) of MBTC were found to have grossly hemorrhagic stomachs and intestines, but no hepatic or renal steatosis (fatty infiltration).15 Mice given the same dose of MBT acid, monobutylthiotin acid, and MBT tris had hepatic and renal steatosis as well as hemorrhagic stomachs and intestines. Certain organotins (TBT oxide, DBT dichloride, and dioctyltin dichloride) produce thymus atrophy in animals, thus perturbing T-cell production. Thymic atrophy was completely reversible after cessation of exposure.16 This was noted only in rats, not in mice or other species.14,16 MBT did not induce thymus atrophy in any species.14 In vitro exposure of human natural killer (NK) lymphocytes to mono-, di-, and tributyltin chlorides revealed that the ability to inhibit NK function was greatest for TBTC and least for MBTC.17 MBTC inhibited NK function by 40% after a 24-hour exposure to 5 micro moles (µM), but not at 1 or 3 µM, nor after a 1-hour exposure to any concentration.
Biomarkers There are three types of biomarkers: biomarkers of exposure, effect, or susceptibility. Biologic monitoring employs biomarkers of exposure, or the measurement of a substance, a metabolite of that substance, or a nonadverse health effect in a biological specimen to determine exposure.18 Examples include blood lead levels, or urinary arsenic levels. Biologic monitoring can be used to augment environmental monitoring and the occupational history. Biological monitoring assesses the exposure of workers regardless of the route of exposure, but does not provide
direct evidence of adverse health effects. Biomarkers of exposure must be demonstrated to be related to the pharmacokinetics of the substance in question to be validated. Workplace exposure to more than 100 substances can be estimated by biological monitoring techniques. Tin has been measured in humans by several researchers. Paschal, et al. analyzed 496 urine specimens from the third National Health and Nutrition Examination Survey (NHANES III) for 13 metals, including tin, using ICP-MS.19 The upper 95th percentile for urinary tin was 20.1 µg/L or 16.2 µg per gram of creatinine (µg/g Cr). There is little information available, however, about the relationship between urinary tin levels and airborne concentrations in workplaces. In addition, the contribution of nonoccupational exposures such as toothpaste, seafood, and canned food is not well described. There are no suitable biomarkers for organotins available for routine use.22,20 This is because absorption, metabolism, and excretion varies by compound, and correlation with exposures from the various routes and sources (such as seafood ingestion) have not been described. However, methods do exist for measuring certain organotins in biological media, for example, dimethyltin and trimethyltin have been measured in the urine of persons poisoned with dimethyltin contaminated lard in an incident in China on New Year’s Day, 1999.21
Occupational Exposure Limits The NIOSH REL, OSHA PEL, and ACGIH TLV for tin (as Sn) in air is 2 mg/m3. The NIOSH REL, OSHA PEL, ACGIH TLV for organic tin compounds (as Sn) in air, including MBTC, is 0.1 mg/m3. Organic tin compounds are listed with a skin notation by NIOSH and ACGIH. ACGIH considers organic tin as an agent that causes concern as a potential human carcinogen but for which conclusions cannot be made because of lack of data. An occupational exposure limit has not been established for MBTC on surfaces. Also, a biological exposure index does not exist for tin or MBTC in urine.

Page 8 Health Hazard Evaluation Report No. 2003-0016-2959
Hydrochloric Acid HCl, the aqueous form of hydrogen chloride, is irritating and corrosive to any tissue it contacts. Brief inhalation exposure to low concentrations can cause throat irritation. Long-term exposure to low levels can cause respiratory problems, eye and skin irritation, and discoloration of the teeth.22 Exposure to relatively high concentrations can result in rapid breathing, narrowing of the bronchioles (airways in the lungs), and accumulation of fluid in the lungs. The NIOSH REL, OSHA PEL, and ACGIH TLV for HCl are 7 mg/m3, 7 mg/m3, and 2 mg/m3, respectively, as ceiling values.
RESULTS Surface Sampling Tin was found in all (5/5) surface samples analyzed for tin; concentrations ranged from 0.0067 to 1.8 milligrams per wipe (mg/wipe). MBTC was found in 50 percent (14/28) of the surface samples analyzed for MBTC. Twenty percent (1/5) of the office samples were positive for MBTC. The positive sample for MBTC was in the office from the desk of an individual who reported entering the hot end on occasion. No MBTC was found on the two wipe samples from the cold end. Eighty-one percent (13/16) of the surfaces sampled in the hot end were positive for MBTC; concentrations ranged from trace to 3.2 mg/wipe. Individual results are presented in Table 3 and 4 for tin and MBTC, respectively.
Confidential Interviews and Medical Records Review Twelve of the twenty-nine interviewed employees reported they had no symptoms that might be related to MBTC exposure. Eleven reported that the organotin had a strong odor and would “take your breath away” if inhaled. None reported eye, nose, or throat irritation. Four reported skin irritation or burns upon contact with MBTC. One individual reported a constellation of symptoms; the most prominent were severe muscular pain and spasms, fatigue, and memory loss. NIOSH review of the
extensive medical evaluations, including toxicology, neurology, and rheumatology, failed to document an association with MBTC exposure. The medical information, including both subjective complaints and objective testing, was not consistent with what has been reported in the scientific literature concerning other organotins. One individual reported onset of breathing difficulty after an acute exposure to fumes from the VDH. Medical records were reviewed for this individual and documented a partially reversible obstructive deficit; however, this individual was a long-term smoker, and no pre-exposure spirometry was performed that could be used as a comparison. One individual reported a self-limited illness that began with fever and muscular and joint pain but that ultimately resolved. This employee was removed from work with the VDH. Medical records did not reveal any association with MBTC exposure.
Biologic and Environmental Monitoring Evaluation
Tin All workers present during the HHE participated in the evaluation, including four office workers, six shipping workers, two day maintenance workers, and nine hot end workers. The length of the workweek varied by department, therefore workers participated for varying numbers of days. PBZ air concentrations of tin were significantly lower among office and shipping personnel compared to hot end and maintenance workers (p<0.01). Sixty-five percent (30/46) of PBZ air concentrations of tin among office and shipping personnel were below the minimum detectable concentration (MDC [<0.0004 mg/m3]), which is considered non-detected (ND). The remaining 35% (16/46) of samples were between the MDC and the minimum quantifiable concentration (MQC), which is considered a trace concentration (between 0.0004 and 0.0009 mg/m3). For hot end and maintenance workers, the geometric mean tin concentration was 0.010 mg/m3 (range: trace to 4.6 mg/m3). Two of seventy samples were trace. The

Health Hazard Evaluation Report No. 2003-0016-2959 Page 9
measurement of 4.6 mg/m3 is an outlier, with the next highest concentration being 0.062 mg/m3. Individual sample results are presented in Table 5. PBZ air concentrations of MBTC were ND (<0.003 mg/m3) for all office and shipping workers on all days sampled, but ranged from ND to 1.5 mg/m3, with a geometric mean of 0.011 mg/m3, for hot end and maintenance workers. Twenty-nine percent (20/70) of PBZ air samples on hot end and maintenance workers were ND. Individual sample results are presented in Table 6. The results are reported as MBTC. The highest exposures to tin and MBTC occurred when workers entered the baghouse on day 1 and day 5 of the NIOSH visit. PBZ air MBTC concentrations from the worker whose duties required baghouse entry on those days were 0.94 and 1.5 mg/m3, respectively. The PBZ air tin concentrations from this worker on those days were 0.049 and 4.6 mg/m3, respectively. In contrast, the highest PBZ air MBTC level among the remaining hot end and maintenance workers was 0.19 mg/m3, with the remainder at or below 0.076 mg/m3. The PBZ tin concentrations among the remaining hot end and maintenance workers were at or below 0.044 mg/m3. Eighty-eight percent (42/48) of hand wipes from office and shipping workers had no detectable MBTC (<0.010 mg/wipe). Of the six (12%) where MBTC was detected, concentrations ranged from trace (between 0.010 and 0.033 mg/wipe) to 0.13 mg/wipe. Ninety-nine percent (69/70) of hand wipes from hot end and maintenance workers had detectable MBTC, with concentrations ranging from 0.046 to 4.0 mg/wipe, and a geometric mean of 0.22 mg/wipe. The value of 4.0 mg/wipe, taken on day 1, and the next highest value of 1.3 mg/wipe, taken on day 5, was for the worker who was required to enter the baghouse on both days. Individual sample results are presented in Table 7. The results are reported as MBTC. Geometric mean urinary tin concentrations were significantly higher among hot end and
maintenance workers than among office and shipping workers (p<0.01), 7.8 µg/g creatinine (range: ND [<0.5 µg/g creatinine] to 76 µg/g creatinine) and 0.68 µg/g creatinine (range: ND to 8.0 µg/g creatinine), respectively. The geometric mean urinary MBTC concentration among hot end and maintenance workers was 8.0 µg/g creatinine (range: ND [<0.6 µg/g creatinine] to 51 µg/g creatinine). Urinary MBTC concentrations among office and shipping workers were all ND. The relationship between airborne measures of tin and MBTC and urinary excretion of tin and MBTC was examined among hot end workers. Office and shipping workers were not included because they had no detectable exposure to, nor urinary excretion of, MBTC, and minimal exposure to tin. Day maintenance workers were also excluded because they wore respiratory protection while servicing the VDH and entering the baghouse, thus their airborne MBTC and tin concentrations might not reflect actual PBZ air concentrations. There was a significant positive relationship between the log transformed PBZ air concentrations of tin and the log of the urinary excretion of MBTC (as tin) (p<0.01) and between the log transformed PBZ air MBTC and the log of the urinary excretion of MBTC (p<0.01). However, there was not a significant relationship between log transformed PBZ air tin and the log of the urinary excretion of tin (p=0.88). It was postulated that nonoccupational factors such as ingestion of canned food might be modifying the relationship between airborne tin exposure and urinary excretion of tin among hot end workers. Therefore, nine observations where the individual reported eating canned food or seafood in the previous 24 hours were removed, and a positive relationship between the log of the urinary excretion of tin and the log transformed PBZ air tin concentrations was found (p=0.06). There was no significant difference between beginning of workweek urinary excretion of tin or MBTC and end of the workweek (p=0.60 and 0.78, respectively), nor between end of the workweek and at the end of the time off (p=0.19 and 0.40, respectively), for hot end and maintenance workers. There was considerable

Page 10 Health Hazard Evaluation Report No. 2003-0016-2959
variation in levels among certain workers however, with some increasing during the HHE and others decreasing. No statistically significant relationship existed between hand wipe results for MBTC and urinary excretion of MBTC among hot end and maintenance workers. It was postulated that persons who smoked in the workplace might be ingesting tin and MBTC from hand contamination. Hot end and day maintenance workers who smoked at work did not have significantly higher geometric mean urinary tin excretion than nonsmokers (7.9 µg/gCr vs. 7.8 µg/gCr, p=0.98), or geometric mean urinary MBTC excretion than nonsmokers (10. µg/gCr vs. 7.3 µg/gCr, p=0.56). This relationship was not explored for office and shipping workers because hand contamination with MBTC was so rare among them and none excreted MBTC in their urine.
Hydrochloric Acid PBZ air HCl concentrations ranged from ND (<0.002 mg/m3) to 0.17 mg/m3 while general area (GA) concentrations ranged from ND to 1.8 mg/m3. The GA outlier, 1.8 mg/m3, was collected as an 8-hour sample while all other GA samples were 15-minute short-term samples. The next highest concentration was 0.43 mg/m3. Individual sample results are presented in Tables 8 and 9. Sampling was conducted over the full shift in addition to 15-minute short-term samples. Although no standard for an 8-hour TWA for HCl exists, this sampling was conducted to represent the worst case scenario. Since exposure is only expected for a few minutes at a time during a bottle jam in a VDH, the actual exposure would be even lower throughout the day. The low HCl concentrations measured over the full shift are consistent with the low level of HCl detected on the 15-minute short-term samples.
Pre- and Post-Hand Wash Monobutyltin Trichloride Samples All 12 of the wipe samples collected from employees before washing hands were positive for MBTC. Pre-wash concentrations ranged from 0.055 to 4.0 mg/wipe with a geometric mean of 0.28 mg/wipe. Eighty-three percent (10/12) of samples collected from employees after washing their hands were positive for MBTC, however, the levels were lower. The samples ranged from ND (<0.010 mg/wipe) to 2.2 mg/wipe with a geometric mean of 0.052 mg/wipe. All four samples collected after lunch was positive for MBTC, similar to concentrations following washing hands before lunch. Individual sample results are presented in Table 10.
Cotton Glove Washed and used cotton gloves from the hot end, were positive for MBTC. MBTC was not detected on the new cotton glove. Individual sample results are presented in Table 11.
Ventilation At all tested points around the bottle entrance and exit openings of the coating process enclosures, air flow, visualized with "smoke tubes,” was observed to be moving into the openings. Similarly, no leakage of air that might contain contaminants was observed at any other tested point around the enclosures and the dust transport, collection, and filtering system. However, the observation of tasks that involved working inside the enclosures or handling access panels removed from the enclosures for cleaning, unclogging or maintenance, showed areas where additional local exhaust ventilation might be needed. Although not observed, the process of unclogging the hopper feed to the rotary valve would also be a potential exposure that could be helped by local exhaust ventilation and/or other emission/exposure controls.

Health Hazard Evaluation Report No. 2003-0016-2959 Page 11
DISCUSSION AND CONCLUSIONS
One tin and two MBTC air samples yielded concentrations that exceeded the NIOSH REL, the OSHA PEL, and the ACGIH TLV for both tin and organic tin, 2 and 0.1 mg/m3 (as Sn) respectively. All three samples were collected on days work was performed in the baghouse. Respiratory protection is currently used during maintenance activities on the VDHs and baghouse, and should continue to be required until changes can be made to reduce or eliminate the exposure. Hot end and day maintenance workers are being exposed to and absorbing tin and MBTC in the course of their normal duties. There is skin and respiratory exposure, as well as the potential for ingestion of tin and MBTC through hand contamination. There was a significant positive association between airborne measures of tin and MBTC and urinary excretion of tin and MBTC. However, no significant relationship between hand wipe results for MBTC and urinary excretion of MBTC existed, and hot end and day maintenance workers who smoked at work did not have significantly higher mean urinary tin excretion than nonsmokers, nor did they have higher mean urinary MBTC excretion. Therefore, it appears that absorption occurs primarily through the respiratory system, with minimal absorption either through the skin or via ingestion. The probable lack of gastrointestinal absorption is consistent with the animal studies described earlier. Animal studies utilizing respiratory or dermal exposure were not found. However, this evaluation had a small number of participants and cannot rule out the possibility of dermal or gastrointestinal absorption. The levels of urinary tin and MBTC excretion remained relatively constant regardless of whether the urine was taken at the beginning of the workweek, throughout the workweek, or on the 2 days off following the workweek. There was no significant difference between the beginning of workweek urinary excretion of tin or MBTC and the end of workweek, or between
end of the workweek and at the end of the time off. Overall, this suggests that the half-life of tin and MBTC is measured in days, not hours. It is important to note that airborne levels of MBTC in this plant were very low, as was urinary excretion. There is no information concerning “normal” levels of urinary MBTC, although the fact that none of the office and shipping workers had detectable MBTC in their urine suggests that it would also be ND in the general population. In addition, no toxicologic information is available regarding health effects of MBTC. The very sparse animal literature suggests it is nontoxic or of minimal toxicity, but this HHE did not address health effects associated with exposure. We made the decision to determine whether MBTC could be absorbed prior to conducting any studies on health effects. None of the air samples collected by NIOSH for HCl exceeded any occupational exposure limit (OEL). However, at low concentrations HCl can cause mucous membrane irritation in sensitive individuals. The work environment, including the cafeteria, is contaminated with MBTC. This is due, at least in part, to airborne MBTC since wipe samples were positive even on surfaces that workers would not contact with their hands. This indicates that the VDH is not 100% efficient in capturing the MBTC. The local exhaust ventilation is designed to capture and exhaust contaminants in the air that might escape from the bottle entrance and/or exit openings during normal operation. No local exhaust ventilation is provided to control exposure when the side access panels are removed and the unit is cleaned or repaired. One approach to controlling exposures during tasks performed with the enclosure access panels removed would be to provide exhaust ventilation around the side opening. The baghouse filtration system does not provide exposure protection to workers who must access the inside of the hopper for unclogging the area above the rotary valve or performing other maintenance or repair procedures. Using local

Page 12 Health Hazard Evaluation Report No. 2003-0016-2959
exhaust ventilation could help control exposures to dust when working through the opened access above the rotary valve while standing outside the hopper. The baghouse seems to effectively filter the air discharged from the building through the exhaust stack. The eventual conveyance of a slurry through a drain line to a tote for transport to a recycling facility does not seem to create exposures undesirable or hazardous to worker health. If the inside of the hopper would be considered a confined space, any entry by a worker would be subject to federal, state, and local regulations on confined space entry. Unclogging the feed to the rotary valve with the access panel removed should be performed with effective local exhaust ventilation and personal protection. Although the appropriate respiratory protection was available, day maintenance employees were observed wearing inappropriate respiratory protection (disposable filtering face pieces). They were also observed wearing the respiratory protection incorrectly. Until engineering controls can be established to eliminate or reduce exposures to below the organic tin PEL, workers performing maintenance inside the VDHs and baghouse should be required to wear full-face respirators with organic vapor/N95 cartridges. In addition to the inappropriate respiratory protection, day maintenance workers were observed with tyvek hoods and the frame of corrective glasses protruding through the respirator seal. This breaks the seal of the respirator, potentially exposing the worker. Although a respiratory protection program is in place at OI, employees do not adhere to the program or have not been adequately trained on what type of respirator to use or on how to wear them properly. The cotton gloves used in the hot end are currently laundered and reused until the time they do not protect the works from heat burns. Sampling of the dirty and laundered gloves indicated the presence of MBTC. Modification of the process by which gloves are laundered and the reuse policy may eliminate unnecessary exposure. Maintenance workers wore disposable
nitrile gloves during maintenance on the VDHs and baghouse. Hand wipe samples indicated MBTC exposure even with the use of the gloves. This is believed to be due to contamination of the tools and to the glove doffing method used following cleaning of the VDH. The use of gloves should be continued to eliminate unnecessary exposure and employees should be aware of the order in which they remove the gloves to prevent exposure to contamination on the tools.
RECOMMENDATIONS Since workers are being exposed to and absorbing tin and MBTC in the course of their normal duties, these recommendations are provided to decrease worker exposure until more is known about the health effects of MBTC. 1. Provide local exhaust ventilation (LEV)
while work is conducted inside the VDHs and when tasks are performed on the removed access panels. The LEV should control workers exposure and prevent contamination of the surrounding work area. An example design, with specifications, is provided in Appendix D.
2. Provide LEV when work is conducted
inside the baghouse. The LEV should control workers exposure and prevent contamination of the work area around the baghouse. An example design, with specifications, is provided in Appendix D.
3. Use a high efficiency particulate air filter
vacuum or hose connected to the local exhaust system when vacuuming the inside of the VDH and other residual powder in the facility. This will minimize dispersal of the tin oxide powder and any residual MBTC.
4. Evaluate the baghouse filter hopper to
determine if it is a permit-required confined space based on OSHA’s Permit-Required Confined Space Standard (29 CFR 1910.146). If the baghouse, or other space in the plant, is identified as a

Health Hazard Evaluation Report No. 2003-0016-2959 Page 13
confined space, a written confined space program should be implemented.
5. Instruct workers to remove cotton gloves
immediately if they become contaminated with MBTC. Cotton gloves known to be contaminated with MBTC, i.e. following work with the MBTC supply bottle or VDH, should not be reused until effectively laundered.
6. Update the written respiratory program
based on OSHA’s Respiratory Protection Standard (29 CFR 1910.134). The program should outline the appropriate respirator based on the hazard, change-out schedules, and employee training on how to wear a respirator and store it safely.
7. Use the engineering controls mentioned in
recommendations 1 through 3; such controls are the preferred method to protect workers from exposure. Until controls are implemented, maintenance workers in the hot end should wear a full-face respirator equipped with an organic vapor/N95 combination cartridge during maintenance on the VDHs and baghouse.
8. Install a hand-washing facility workers can
use when leaving the hot end before using toilet facilities or the cafeteria/break room. Hot end and maintenance workers should thoroughly wash hands, forearms, and face with soap and water before eating, using tobacco products, or using toilet facilities. Workers should not eat, drink, or use tobacco products in the hot end area of the plant.
REFERENCES
1. NIOSH [2003]. NIOSH manual of analytical methods. 4th ed. Cincinnati, OH: U. S. Department of Health and Human Services, Centers for Disease Control and Prevention, National Institute for Occupational Safety and Health, DHHS (NIOSH) Publication No. 03-154.
2. NIOSH [2003]. Butyltin chlorides in urine method 8320 (Draft, issued 03/2004). In: NIOSH manual of analytical methods. 4th ed. Cincinnati, OH: U. S. Department of Health and Human Services, Centers for Disease Control and Prevention, National Institute for Occupational Safety and Health, DHHS (NIOSH) Publication No. 03-154.
3. NIOSH [2003]. Monobutyltin trichloride on wipes method 9108 (Draft, Issued 07/2003). In: NIOSH manual of analytical methods. 4th ed. Cincinnati, OH: U. S. Department of Health and Human Services, Centers for Disease Control and Prevention, National Institute for Occupational Safety and Health, DHHS (NIOSH) Publication No. 03-154.
4. Andrews R [2003]. CEMB Analytical Report, Determination of Monobutyltin trichloride by LC-ICP. Sequence number 10060-AL. HETA 2003-0016. August 6, 2003.
5. ORTEP Association. Method-Butyltin Chlorides in Air. <http://ortepa.org/stabilizers/pages/Butyltinsinair.pdf> (accessed Sept 2003).
6. NIOSH [1992]. Recommendations for occupational safety and health: compendium of policy documents and statements. Cincinnati, OH: U.S. Department of Health and Human Services, Public Health Service, Centers for Disease Control and Prevention, National Institute for Occupational Safety and Health, DHHS (NIOSH) Publication No. 92-100.
7. ACGIH [2004]. 2004 TLVs® and BEIs®: threshold limit values for chemical substances and physical agents. Cincinnati, OH: American Conference of Governmental Industrial Hygienists.
8. CFR [2003]. 29 CFR 1910.1000. Code of Federal Regulations. Washington, DC: U.S. Government Printing Office, Office of the Federal Register.
Page 14 Health Hazard Evaluation Report No. 2003-0016-2959
9. Winship KA [1988]. Toxicity of tin and its compounds. Adv Drug React Ac Pois Rev. 1:19-38.
10. Nielson JB, Strand J [2002]. Butyltin compounds in human liver. Environmental Reserach Section A. 88:129-133.
11. Kannan K, Senthilkumar K, Giesy JP [1999]. Occurrence of butyltin compounds in human blood. Environmental Science and Technology. 33(10):1776-1779.
12. Wilschut A, ten Berge W, Robinson P, McKone T [1995]. Estimating Skin Permeation, The Calidation of Five Mathematical Skin Permeation Models.Chemosphere. 30: 1275-1296.
13. Ueno S, Susa F, Furukawa Y, Sugiyama M [1994]. Comparison of hepatotoxicity caused by mono-, di-, and tributyltin compounds in mice. Arch Toxicol. 69(1):30-34.
14. Snoeij NJ, Penninks AH, Seinen W [1987]. Biological activity of organotin compounds. Environ Res. 44:335-353.
15. Pelikan Z, Cerny E [1970]. Toxic effects of some “mono-n-butyl-tin compounds” on white mice. Arch Toxicol. 27:79-84.
16. ACGIH [2001]. Tin, organic compounds. In: TLV Documentation.
17. Whalen MM, Laganathan BG, Kannan K [1999]. Immunotoxicity of environmentally relevant concentrations of butyltins on human natural killer cells in vitro. Environmental Research Section A. 81: 108-116.
18. Rosenberg J, Harrison RJ [1997]. Biological monitoring. Chapter 38. In: LaDou J, ed. Occupational and environmental medicine. 2nd rev. ed. Stamford, CT: Appleton and Lange, pp. 637-646.
19. Paschal DC, Ting BG, Morrow JC, Pirkle JL, Jackson RJ, Sampson EJ, et al. [1998]. Trace metals in urine of United States Residents:
reference range concentrations. Environ Res. 76:53-59.
20. Fait A, Ferioli A, Barbieri F [1994]. Organotin compounds. Toxicology. 91:77-82.
21. Gui-bin J, Qun-fang Z, Bin H [2000]. Tin compounds and major trace metal elements in organotin-poisoned patient’s urine and blood measured by gas chromatography-flame photometric detector and inductively coupled plasma-mass spectrometry. Bull Environ Contam Toxicol. 65:277-284.
22. ATSDR [2003]. ATSDR Tox Profiles; Atlanta, GA: U.S. Department of Health and Human Services, Public Health Service, Agency for Toxic Substances and Disease Registry. Website accessed 6/12/2003: <http://www.atsdr.cdc.gov/tfacts173.html>.
Health Hazard Evaluation Report No. 2003-0016-2959 Page 15
Table 1 Analytical Limits for Biological Sample Analysis
Owens-Illinois HETA 2003-0016
Analyte LOD (µg/L)
LOQ (µg/L)
Average Creatinine
(g/L)
MDC (µg/g)
MQC (µg/g)
Tin 0.8 3 1.7 0.5 2
MBTC 1 3 1.7 0.6 2
Creatinine 100000 300000
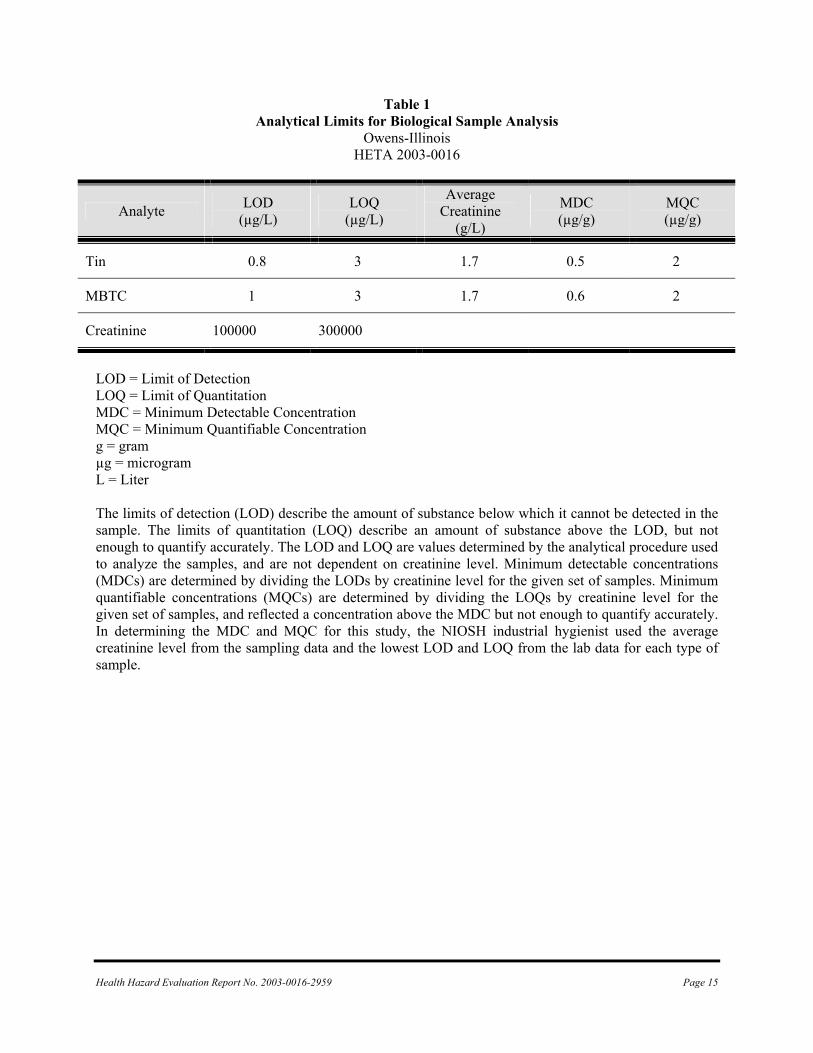
LOD = Limit of Detection LOQ = Limit of Quantitation MDC = Minimum Detectable Concentration MQC = Minimum Quantifiable Concentration g = gram µg = microgram L = Liter The limits of detection (LOD) describe the amount of substance below which it cannot be detected in the sample. The limits of quantitation (LOQ) describe an amount of substance above the LOD, but not enough to quantify accurately. The LOD and LOQ are values determined by the analytical procedure used to analyze the samples, and are not dependent on creatinine level. Minimum detectable concentrations (MDCs) are determined by dividing the LODs by creatinine level for the given set of samples. Minimum quantifiable concentrations (MQCs) are determined by dividing the LOQs by creatinine level for the given set of samples, and reflected a concentration above the MDC but not enough to quantify accurately. In determining the MDC and MQC for this study, the NIOSH industrial hygienist used the average creatinine level from the sampling data and the lowest LOD and LOQ from the lab data for each type of sample.

Page 16 Health Hazard Evaluation Report No. 2003-0016-2959
Table 2 Analytical Limits for Industrial Hygiene Sample Analysis
Owens-Illinois HETA 2003-0016
Analyte LOD (µg/sample)
LOQ (µg/sample)
Maximum Volume (L)
MDC (mg/m3)
MQC (mg/m3)
Airborne tin 0.4 1 1094 0.0004 0.0009
Airborne MBTC 2 6 677 0.003 0.009
Airborne HCl 0.1 0.3 45 0.002 0.007
MBTC surface 10 33
Tin surface 1 4
LOD = Limit of Detection LOQ = Limit of Quantitation MDC = Minimum Detectable Concentration MQC = Minimum Quantifiable Concentration mg = milligram µg = microgram L = Liter m3 = cubic meter The limits of detection (LOD) describe the amount of substance below which it cannot be detected in the sample. The limits of quantitation (LOQ) describe an amount of substance above the LOD, but not enough to quantify accurately. The LOD and LOQ are values determined by the analytical procedure used to analyze the samples, and are not dependent on sample volume. Minimum detectable concentrations (MDCs) are determined by dividing the LODs by air sample volumes for the given set of samples. Minimum quantifiable concentrations (MQCs) are determined by dividing the LOQs by air sample volumes for the given set of samples, and reflected a concentration above the MDC but not enough to quantify accurately. In determining the MDC and MQC for this study, the NIOSH industrial hygienist used the highest sample volumes from the sampling data and the lowest LOD and LOQ from the lab data for each type of sample.

Health Hazard Evaluation Report No. 2003-0016-2959 Page 17
Table 3 Results of Total Tin Surface Sampling
Owens-Illinois HETA 2003-0016
Department Location Result (mg/wipe)
Cold end Cafeteria table top 0.0067 Hot end Cafeteria table top 0.019 Hot end Surface of work station on B2 line 1.8 Hot end Surface of work station on B1 line 1.1 Hot end Side of MBTC container on B2 line 1.2
Results reported in milligram per wipe (mg/wipe) of total tin.

Page 18 Health Hazard Evaluation Report No. 2003-0016-2959
Table 4 Results of Monobutyltin Trichloride Surface Sampling
Owens-Illinois HETA 2003-0016
Department Location Result (mg/wipe)
Office Desk top ND Office Desk top ND Office Desk top ND Office Desk top Trace † Office Conference room table top ND † Cold end Cafeteria table top ND † Cold end Cafeteria table top ND Shipping Receiving break room table top ND Shipping Chair in break area of shipping department
entrance ND
Shipping Desk top in shipping office ND Shipping Steering wheel of fork lift ND Shipping Steering wheel of fork lift ND Maintenance Surface of respirator 0.30 † Maintenance Inside of glove after VDH maintenance 0.13 † Maintenance Tools used to clean VDH 0.78 † Hot end Cafeteria table top ND Hot end Cafeteria table top Trace † Hot end Control room table top (location where hand
wipe samples were collected) ND
Hot end Control room table top (location where hand wipe samples were collected)
ND
Hot end Control room table top (location where wipe samples were collected)
0.051
Hot end Surface of work station on B1 line 0.30 Hot end Surface of work station on B2 line 0.31 † Hot end Surface of work station on B2 line 0.26 Hot end Work surface on B2 line 0.54 † Hot end Support column near B2 line 3.2 †
Hot end Top of MBTC container on B2 line 1.8 Hot end Top of MBTC container on B2 line 0.94 † Hot end Side of MBTC container on B2 line 1.7 †
Results reported in milligram per wipe (mg/wipe) of monobutyltin trichloride. “Trace” values are results detected between the LOD and LOQ, 0.01 and 0.033 mg/wipe respectively. “ND” values are results below the LOD. †Sample collected on initial site visit as analytical method was under development; LOD and LOQ were 0.04 and 0.13 mg/sample respectively.

Health Hazard Evaluation Report No. 2003-0016-2959 Page 19
Table 5 Results of PBZ Tin Air Sampling
Owens-Illinois HETA 2003-0016
Tin Concentration (mg/m3) Location
June 23 June 24 June 25 June 26 June 27 June 28 June 29 June 30
Office Trace Trace Trace ND ND Office Trace ND ND ND ND Office Trace Trace ND ND Trace Office ND Trace ND ND ND Shipping ND Trace ND ND ND Shipping ND ND Trace ND ND Shipping Trace ND Trace ¿ ¿ Shipping ¿ Trace ND ND ND Shipping ND ¿ ND ND Trace Shipping ND ND Trace Trace ND Maintenance Trace Trace 0.0012 0.0011 0.0084 Maintenance 0.049 ¿ 0.061 0.062 4.6 Hot end 0.0045 0.0035 0.0033 0.0098 0.0061 0.0058 0.0032Hot end 0.0074 0.0063 0.0063 0.0041 0.0051 0.0054 0.0033Hot end 0.0050 0.0075 0.0073 0.0025 0.0061 0.0069 0.0048Hot end 0.015 0.026 0.012 0.0078 0.0073 0.011 0.0072Hot end 0.012 0.011 0.018 0.024 0.044 0.013 0.041 Hot end 0.0077 0.0085 0.010 0.0056 0.0065 0.0069 0.0054Hot end 0.012 0.013 0.027 0.018 0.020 0.019 0.025 Hot end 0.0065 0.0043 0.0068 0.014 0.0080 ¿ ¿ Hot end 0.0091 0.016 0.014 0.017 0.0087 0.0065 0.011
PBZ sample results reported as a time-weighted average (TWA-actual) in milligram per cubic meter (mg/m3) of tin. “Trace” values are results detected between the MDC and MQC, 0.0004 and 0.0009 mg/m3 respectively. “ND” values are results below the MDC. ¿ Sample not collected.

Page 20 Health Hazard Evaluation Report No. 2003-0016-2959
Table 6 Results of PBZ Monobutyltin Trichloride Air Sampling
Owens-Illinois HETA 2003-0016
MBTC Concentration (mg/m3) Location
June 23 June 24 June 25 June 26 June 27 June 28 June 29 June 30
Office ND ND ND ND ND Office ND ND ND ND ND Office ND ND ND ND ND Office ND ND ND ND ND Shipping ND ND ND ND ND Shipping ND ND ND ND ND Shipping ND ND ND ¿ ¿ Shipping ND ND ND ND ND Shipping ND ND ND ND ND Shipping ND ND ND ND ND Maintenance ND ND ND ND ND Maintenance 0.94 ¿ 0.058 0.097 1.5 Hot end ND ND Trace 0.017 0.0091 ND ND Hot end Trace 0.014 Trace ND ND ND ND Hot end 0.010 0.016 0.0094 ND ND ND ND Hot end 0.019 0.076 Trace ND Trace 0.019 Trace Hot end 0.015 0.018 0.026 0.054 0.19 0.023 0.057 Hot end 0.011 0.018 0.012 0.014 0.0097 0.012 ND Hot end 0.02 0.021 0.040 0.047 0.046 0.032 0.057 Hot end ND 0.011 Trace 0.022 Trace ¿ ¿ Hot end Trace 0.023 0.019 0.019 0.017 0.016 0.014
PBZ sample results reported as a time-weighted average (TWA-actual) in milligram per cubic meter (mg/m3) of monobutyltin trichloride. “Trace” values are results detected between the MDC and MQC, 0.003 and 0.009 mg/m3 respectively. “ND” values are results below the MDC. ¿ Sample not collected.

Health Hazard Evaluation Report No. 2003-0016-2959 Page 21
Table 7 Results of Monobutyltin Trichloride Hand Sampling
Owens-Illinois HETA 2003-0016
Result (mg/wipe) Location
June 23 June 24 June 25 June 26 June 27 June 28 June 29 June 30
Office ND ND Trace 0.10 ND Office ND ND ND ND ND Office ND ND ND 0.10 0.13 Office ND ND ND ND 0.062 Shipping ND ND ND ND ND Shipping ND ND ND 0.10 ND Shipping ND ND ND ¿ ¿ Shipping ND ND ND ND ND Shipping ND ND ND ND ND Shipping ND ND ND ND ND Maintenance 0.12 ND 0.23 0.046 0.24 Maintenance 4.0 ¿ 0.23 1.1 1.3 Hot End 0.16 0.26 0.20 0.10 0.19 0.17 0.16 Hot End 0.17 0.33 0.20 0.26 0.29 0.14 0.13 Hot End 0.18 0.25 0.10 0.13 0.31 0.093 0.15 Hot End 0.49 0.45 0.27 0.55 0.51 0.32 0.25 Hot End 0.21 0.23 0.25 0.21 0.32 Present * 0.20 Hot End 0.17 0.21 0.20 0.30 0.16 0.14 0.16 Hot End 0.28 0.18 0.19 0.27 0.14 0.26 0.15 Hot End 0.29 0.27 0.20 0.40 0.23 ¿ ¿ Hot End 0.15 0.17 0.19 0.17 0.16 0.14 0.15
Hand wipe sample results reported in milligram per wipe (mg/wipe) of monobutyltin trichloride. “Trace” values are results detected between the LOD and LOQ, 0.010 and 0.033 mg/wipe respectively. “ND” values are results below the LOD. * Due to container lab error, sample was only qualitatively analyzed. ¿ Sample not collected.

Page 22 Health Hazard Evaluation Report No. 2003-0016-2959
Table 8 Results of PBZ Hydrochloric Acid Air Sampling
Owens-Illinois HETA 2003-0016
Concentration (mg/m3) Line Operator
June 24 June 25 June 26 June 27 June 28
1 ND Trace Trace Trace 0.018 A1 2 ¿ 0.0089 ND Trace 0.017 1 ND Trace 0.17 Trace 0.013 A2 2 ¿ ¿ 0.015 ¿ 0.019 1 Trace ND ¿ Trace 0.018 B1 2 ND Trace ND Trace 0.011 1 Trace 0.016 ND Trace 0.016 B2 2 ND 0.0089 ND Trace ¿
PBZ sample results reported as a time-weighted average (TWA-actual) in milligram per cubic meter (mg/m3) of hydrochloric acid. “Trace” values are results detected between the MDC and MQC, 0.002 and 0.007 mg/m3 respectively. “ND” values are results below the MDC. ¿ Sample not collected.
Table 9 Results of Area Hydrochloric Acid Air Sampling
Owens-Illinois HETA 2003-0016
Date Line Activity Concentration (mg/m3)
June 24 A1 Bottle jam in VDH 0.43 June 23 A2 Normal operation of VDH ND June 24 A2 Bottle jam in VDH 0.40 June 25 B1 Bottle jam in VDH ND June 23 B2 Normal operation, down the line from VDH 1.8 * June 23 B2 Bottle jam in VDH ND June 25 B2 Bottle jam in VDH ND June 26 B2 Cleaning of VDH during down time of bottle
machine ND
Area sample results reported as a 15 minute time-weighted average, unless noted, in milligram per cubic meter (mg/m3) of hydrochloric acid. “ND” values are results below the MDC, 0.002 mg/m3. * Full shift sample.

Health Hazard Evaluation Report No. 2003-0016-2959 Page 23
Table 10 Results of Monobutyltin Trichloride Hand Sampling
Pre- and Post-Hand Wash Owens-Illinois
HETA 2003-0016
Results (mg/wipe) Location Pre-Hand Wash Post-Hand Wash Post-Lunch
Maintenance 4.0 2.2 ¿ Maintenance 1.2 0.35 ¿
Hot end 0.12 ND ¿ Hot end 0.35 0.053 ¿ Hot end 0.13 Trace ¿ Hot end 0.055 Trace ¿ Hot end 0.20 ND ¿ Hot end 0.17 Trace ¿ Hot end 0.18 † Trace † Trace † Hot end 0.23 † Trace † Trace † Hot end 0.23 † Trace † Trace †
Maintenance 0.48 † 0.17 † 0.16 † Results reported in milligram per wipe (mg/wipe) of monobutyltin trichloride. “Trace” values are results detected between the LOD and LOQ, 0.010 and 0.033 mg/wipe respectively. “ND” values are results below the LOD. †Sample collected on initial site visit as analytical method was under development; LOD and LOQ were 0.04 and 0.13 mg/wipe respectively. ¿ Sample not collected.
Table 11 Results of Monobutyltin Trichloride Cotton Glove Sampling
Owens-Illinois HETA 2003-0016
Result Sample Location
New Glove Used Glove Laundered Glove
Index finger Negative Positive Positive Palm Negative Positive Positive
Results are reported as qualitative. Neither the limit of detection (LOD) nor the limit of quantitation (LOQ) for MBT on the cotton gloves were determined. All samples positive for MBTC were above the LOQ calculated for MBTC on AlphaWipe samples (0.033 mg/sample).

Page 24 Health Hazard Evaluation Report No. 2003-0016-2959
APPENDIX A Butyltin Chlorides in Urine 8320 Formula: Table 1 MW: Table 1 CAS: Table 1 RTECS: Butyltin trichloride: WH6780000 Dibutyltin dichloride: WH7100000 Tributyltin chloride : WH6820000
METHOD: 8320, Issue 1 EVALUATION: FULL Issue 1: DDMMYY
OSHA: NIOSH: ACGIH:
PROPERTIES: Table 1
COMPOUNDS: Butyltin trichloride, Dibutyltin dichloride, Tributyltin chloride
SYNONYMS: Table 1
SAMPLING MEASUREMENT
SPECIMAN: Spot urine samples (before and after exposure)
VOLUME: 15 mL minimum PRESERVATIVE: None SHIPMENT: Freeze urine: ship in dry ice in an
insulated container SAMPLE STABILITY: Stable at least 30 days at -17 ºC
[1]
ACCURACY
RANGE STUDIED: Butyltin trichloride: 0.12-4.0 µg/5-mL sample Dibutyltin dichloride: 0.18-6.0 µg/5-mL sample Tributyltin chloride: 0.15-5.0 µg/5-mL sample ACCURACY: Butyltin trichloride: ± 12.5% Dibutyltin dichloride: ± 13% Tributyltin chloride: ± 8.5% BIAS: Butyltin trichloride: 0.06251 Dibutyltin dichloride: -0.09102 Tributyltin chloride: -0.05078 OVERALL PRECISION (Srt): Butyltin trichloride: 0.04114 Dibutyltin dichloride: 0.02653 Tributyltin chloride: 0.02153
TECHNIQUE: GAS CHROMATOGRAPHY/ MASS SPECTROMETRY IN SIM MODE
ANALYTES: Compounds above INJECTION VOLUME: 2 µL TEMPERATURE -INJECTION: 230 ºC splitless for 0.75 minute -DETECTOR: 285 ºC -OVEN: 75 ºC (1 min); 75 ºC to 225 ºC@
12 ºC/min; hold 5 minutes MASS SELECTIVE DETECTOR PARAMETERS: -SIM IONS (m/z): 4-9.6 min; 178.9, 234.9, 262.9,
290.9/9.6 min. to end of run; 234.9, 262.9, 290.9
-DWELL TIME: 200 milliseconds per m/z CARRIER GAS: Helium at 1.3 mL/minute COLUMN: DB-5ms (30m x 0.32mm ID, 0.5
µm film) fused silica capillary column or equivalent
CALIBRATION: Derivatized analyte spikes of
known concentrations prepared in pooled urine with samples.
ESTIMATED LOD: Butyltin trichloride: 0.01 µg/5-mL sample Dibutyltin dichloride: 0.02 µg/5-mL sample Tributyltin chloride: 0.01 µg/5-mL sample
APPLICABILITY: For determination of butyltin chlorides in urine samples.

Health Hazard Evaluation Report No. 2003-0016-2959 Page 25
INTERFERENCES: Because of the mass-selective capabilities of GC/MS, interferences are not anticipated to have any impact on the analysis.
OTHER METHODS: None.
REAGENTS: 1. Butyltin trichloride 2. Dibutyltin dichloride 3. Tributyltin chloride 4. Ethylmagnesium bromide, 1.0 M solution in
tetrahydrofuran. 5. Helium, purified (carrier gas for GC-MS). 6. Sulfuric acid, 1 M: Dilute 5.6 mL conc.
sulfuric acid to 100 mL deionized water. 7. Citric acid/sodium citrate buffer (~pH 2.3):
Dissolve 20.554 g citric acid monohydrate and 0.652 g sodium citrate dihydrate in 1 L deionized water.
8. Toluene. 9. Tropolone extraction solution: 0.1% in
toluene: Dissolve 100 mg tropolone (2-hydroxy-2,4,6-cycloheptatrienone, CAS# [533-75-5]) in 100 mL toluene.
10. Alumina, acid, brockman activity 1, 80-200 mesh.
11. Sodium sulfate, granular, anhydrous.
EQUIPMENT: 1. 15-mL Polypropylene centrifuge tubes with
screw cap. 2. Centrifuge. 3. Disposable pasteur pipettes, 6" & 9". 4. ~8-mL (13mm x 100 mm) test or culture
tubes, screw tops with Teflon® caps. 5. GC-MS capable of single ion monitoring with
autosampler and data collection system. 6. Microliter syringes for making standard
solutions and GC injections. 7. 5-mL glass volumetric flasks. 8. 1-5-mL adjustable pipettor 9. Vortex mixer. 10. Tumbler for centrifuge tubes, approximately
20 RPM.
SPECIAL PRECAUTIONS: Wear gloves, lab coat, and safety glasses while handling urine and all chemicals. All work should be performed in a fume hood.
SAMPLING: 1. Collect urine in a ~30-mL polyethylene bottle. NOTE: Collect two urine samples for each worker, one prior to exposure and one after exposure.
Also, collect and pool urine from unexposed subjects for use as a standard and quality control sample matrix.
2. Freeze the urine and ship in dry ice in an insulated container.
SAMPLE PREPARATION: 3. Thaw urine samples. 4. Place five mL of the urine sample in a 15-mL polypropylene centrifuge tube. 5. Add:
a. three mL ~pH 2.3 citric acid /sodium citrate buffer b. about 350 mg anhydrous sodium sulfate (to break up emulsions) c. 1.5 mL 0.1% tropolone in toluene solution
6. Tumble for one hour. 7. Centrifuge for at least 15 minutes at 2400 RPM (1050 G). 8. The upper toluene layer is transferred to an 8-mL glass culture tube with a Teflon® septa cap. 9. An additional tropolone extraction procedure is conducted by repeating steps 5c through 8 combining
the extracts. 10. To the combined extracts, about 350 mg anhydrous sodium sulfate is added to remove any of the
aqueous phase that may have been inadvertently transferred.
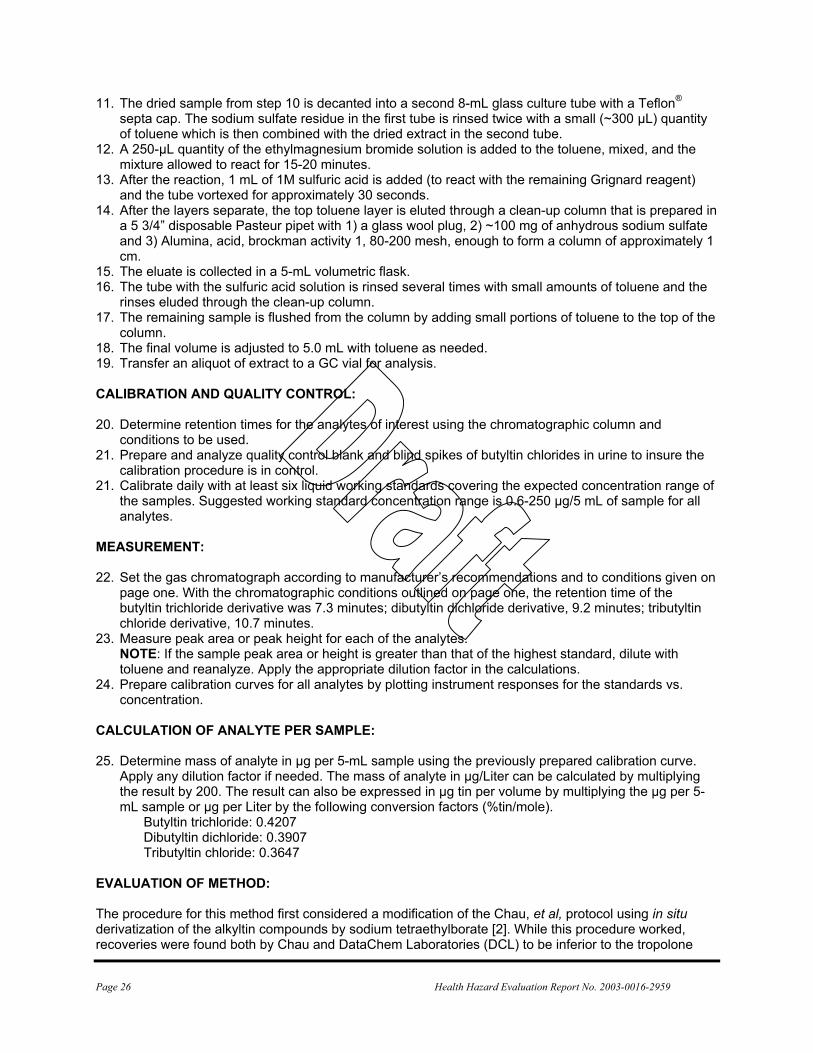
Page 26 Health Hazard Evaluation Report No. 2003-0016-2959
11. The dried sample from step 10 is decanted into a second 8-mL glass culture tube with a Teflon® septa cap. The sodium sulfate residue in the first tube is rinsed twice with a small (~300 µL) quantity of toluene which is then combined with the dried extract in the second tube.
12. A 250-µL quantity of the ethylmagnesium bromide solution is added to the toluene, mixed, and the mixture allowed to react for 15-20 minutes.
13. After the reaction, 1 mL of 1M sulfuric acid is added (to react with the remaining Grignard reagent) and the tube vortexed for approximately 30 seconds.
14. After the layers separate, the top toluene layer is eluted through a clean-up column that is prepared in a 5 3/4” disposable Pasteur pipet with 1) a glass wool plug, 2) ~100 mg of anhydrous sodium sulfate and 3) Alumina, acid, brockman activity 1, 80-200 mesh, enough to form a column of approximately 1 cm.
15. The eluate is collected in a 5-mL volumetric flask. 16. The tube with the sulfuric acid solution is rinsed several times with small amounts of toluene and the
rinses eluded through the clean-up column. 17. The remaining sample is flushed from the column by adding small portions of toluene to the top of the
column. 18. The final volume is adjusted to 5.0 mL with toluene as needed. 19. Transfer an aliquot of extract to a GC vial for analysis. CALIBRATION AND QUALITY CONTROL: 20. Determine retention times for the analytes of interest using the chromatographic column and
conditions to be used. 21. Prepare and analyze quality control blank and blind spikes of butyltin chlorides in urine to insure the
calibration procedure is in control. 21. Calibrate daily with at least six liquid working standards covering the expected concentration range of
the samples. Suggested working standard concentration range is 0.6-250 µg/5 mL of sample for all analytes.
MEASUREMENT: 22. Set the gas chromatograph according to manufacturer’s recommendations and to conditions given on
page one. With the chromatographic conditions outlined on page one, the retention time of the butyltin trichloride derivative was 7.3 minutes; dibutyltin dichloride derivative, 9.2 minutes; tributyltin chloride derivative, 10.7 minutes.
23. Measure peak area or peak height for each of the analytes. NOTE: If the sample peak area or height is greater than that of the highest standard, dilute with
toluene and reanalyze. Apply the appropriate dilution factor in the calculations. 24. Prepare calibration curves for all analytes by plotting instrument responses for the standards vs.
concentration. CALCULATION OF ANALYTE PER SAMPLE: 25. Determine mass of analyte in µg per 5-mL sample using the previously prepared calibration curve.
Apply any dilution factor if needed. The mass of analyte in µg/Liter can be calculated by multiplying the result by 200. The result can also be expressed in µg tin per volume by multiplying the µg per 5-mL sample or µg per Liter by the following conversion factors (%tin/mole).
Butyltin trichloride: 0.4207 Dibutyltin dichloride: 0.3907 Tributyltin chloride: 0.3647 EVALUATION OF METHOD: The procedure for this method first considered a modification of the Chau, et al, protocol using in situ derivatization of the alkyltin compounds by sodium tetraethylborate [2]. While this procedure worked, recoveries were found both by Chau and DataChem Laboratories (DCL) to be inferior to the tropolone
Health Hazard Evaluation Report No. 2003-0016-2959 Page 27
extraction/Grignard derivatization. A composite procedure made up of modifications of elements of both Chau’s protocol and a procedure used by Meinema [3] was used at DCL. Since tin concentrations were expected to be low, a GC-MS SIM analysis was chosen over the GC-FPD procedure. This method was evaluated over the following ranges: Butyltin trichloride: 0.12-4.0 µg/5-mL sample; Dibutyltin dichloride: 0.18-6.0 µg/5-mL sample; and Tributyltin chloride: 0.15-5.0 µg/5-mL sample. These ranges represent from 3X estimated Limit of Quantitation (LOQ) to 100X estimated LOQ. Six replicates were analyzed at each level. The average recovery at the various levels ranged from 102.8% at 3X LOQ to 109.6% at 30X LOQ as for butyltin trichloride; from 88.1% at 30X LOQ to 93.9% at 10X LOQ for dibutyltin dichloride and from 94.2% at 10X LOQ to 95.9% at 100X LOQ for tributyltin chloride. Recoveries were determined by quantitating against spiked and derivatized standards in urine. The Limit of Detection (LOD) and LOQ were determined by analyzing a series of derivatized spiked standards with the data fitted to a quadratic or linear curve, then estimated according to the Burkart Method [4]. A long-term storage study was carried out at the 10X LOQ level. Urine spiked with the analytes was stored at -17 ºC for 1, 7, and 32 days and then analyzed. No significant losses were observed over the thirty- two days. REFERENCES: [1] Wickman, D.C., Perkins, J.B., (2004), Backup data report for Butyltin chlorides in urine method
development, DataChem Laboratories, Inc. under NIOSH contract CDC-200-2001-08000. [2] Chau, Y.K., Yang, F., Brown, M.,(1997), Evaluation of derivatization techniques for the analysis of
organotin compounds in biological tissue, Anal. Chim. Acta, 338, 51-55. [3] Meinema, H.A., Burger-Wiersma, T., Versluis-de Haan, G., Gevers, E.C., (1978), Determination of
trace amounts of butyltin compounds in aqueous systems by gas chromatography/mass spectrometry, Environ. Sci. Tech., 12, 288-293.
[4] Burkart, J.A., (1986), General Procedures for Limit of Detection Calculations in the Industrial
Hygiene Chemistry Laboratory, Appl. Ind. Hyg., 1(3):153-155. METHOD WRITTEN BY: Don C. Wickman and James B. Perkins, DataChem Laboratories, Inc., Salt Lake City, Utah under NIOSH Contract CDC-200-2001-08000.

Page 28 Health Hazard Evaluation Report No. 2003-0016-2959
APPENDIX B MONOBUTYLTIN TRICHLORIDE ON WIPES USING LC-ICP-AES 9108 Formula: C4H9Cl3Sn MW: 282.184 CAS: 1118-46-3 RTECS: WH6780000
METHOD: 9108, Issue 1 EVALUATION: Partial Issue 1: Nov 2003
OSHA : 0.1 mg Sn/m3 (in air) NIOSH: 0.1 mg Sn/m3 (in air) ACGIH: 0.1 mg Sn/m3 (in air)
PROPERTIES: Colorless to light brown liquid; bp 98EC; Flashpoint 178EF; Specific gravity 1.693; mp -63EC
NAMES & SYNONYMS: Butylstannium chloride, Butyltin trichloride, n-Butyltin trichloride, MBTC, MBT, BTTC
SAMPLING MEASUREMENT
SAMPLER: Polyester cleanroom wipe (4" x 4") FLOW RATE: N/A VOL-MIN: -MAX: N/A SHIPMENT: room temp SAMPLE STABILITY: At least 28 days at room temperature BLANKS: 2 to 10 field blanks per set
ACCURACY
RANGE STUDIED: Not determined BIAS: Not determined OVERALL PRECISION (ÖrT): Not determined ACCURACY: Not determined
TECHNIQUE: LC-ICP-AES ANALYTE: Monobutyltin trichloride EXTRACTION: 15 mL 78% MeOH/22% deionized
water/0.02% tropolone INJECTION VOLUME: 50 FL MOBILE PHASE: 72% MeOH/22% deionized water/6%
acetic acid/0.02% tropolone; 1 mL/min COLUMN: Reversed Phase C18(2) 5F, 250 x 4.6
mm WAVELENGTH: 189.989 nm CALIBRATION: Monobutyltin trichloride in extraction
solvent RANGE: 0.059-3.54 mg/wipe ESTIMATED LOD: 0.02 mg/wipe PRECISION (þr): 0.025
APPLICABILITY: This method was developed for the analysis of monobutyltin trichloride on a wipe from glass bottle manufacturers.
INTERFERENCES: The potential interferences include other tin compounds that have the same retention time on a C18 column. No ICP instrumental interferences due to the presence of other metals (besides tin) were found.
OTHER METHODS: This method used instrumental setup as described in NMAM 55271 (Triphenyl tin chloride (as Sn)). Other organotin compounds have been analyzed using NMAM 5504 (using HPLC-AAS) and NMAM 5526 (using GC-FPD)2-3. OSHA has a primary air sampling/analytical method (ID217SG) using AAS-GF4, and ORTEP Association has an air sampling method using GC-FPD5.

Health Hazard Evaluation Report No. 2003-0016-2959 Page 29
REAGENTS: 1. Methanol, HPLC pesticide grade*. 2. Acetic acid, glacial, trace metal grade*. 3. Tropolone, minimum 99%*. 4. Distilled, deionized water. 5. Extraction Solvent: 78% (v/v) methanol/22% (v/v) deionized water/0.02% (w/v) tropolone. 6. Monobutyltin trichloride* stock solution, 3.2 mg/mL. Prepare in methanol and store in freezer. 7. Mobile phase: 72% (v/v) methanol/22% (v/v) deionized water/6% (v/v) acetic acid/0.02% (w/v) tropolone. Degas prior to use. 8. Liquid Argon. 9. Oxygen*. 10. Monobutyltin trichloride, 95%*. * See SPECIAL PRECAUTIONS
EQUIPMENT: 1. Sampler: Texwipe™ AlphaWipe® polyester cleanroom wipe (4" x 4"). The wipe is commercially available (TX1004). 2. Liquid Chromatograph (LC). 3. Autosampler capable of 50 FL injections. 4. Analytical column: Phenomenex® Luna® C18(2) 5F (250 x 4.6 mm) with SecurityGuard™ C18 column guard filter (4.0 x 3.0 mm) or equivalent 5. Vials: 2 mL with PTFE-lined septum caps. 6. Inductively-coupled plasma atomic emission spectrometer (ICP-AES) capable of measuring Sn and equipped for analysis of organic compounds. 7. Volumetric flasks: 1 L, 10 mL. 8. Scintillation vials: 20 mL, glass with PTFE-lined caps or equivalent. 9. PTFE syringe filter: 0.45 Fm, 4 mm. 10. Large vial rotator. 11. Graduated cylinders: 250 mL, 100 mL. 12. Syringes: 5mL, disposable. 13. Pipettes: glass, disposable and automatic. 14. Regulators for argon and oxygen. **Clean all glassware with conc. Nitric acid and rinse throughly with distilled, deionized water.
SPECIAL PRECAUTIONS: Use solutions and samples in fume hood. Avoid contact with skin, eyes, and clothing and ingestion or inhalation. Wear gloves and suitable clothing when handling. Eye protection should be worn. Methanol, MBT & oxygen: Avoid open flame.
SAMPLING:
# ...Remove a pre-moistened (with deionized water) wipe from sample vial and sample a designated area. Note: Do not moisten the wipe with more than 4 mL of deionized water. If a moistened wipe is not needed for sampling, a dry wipe may be used6.
# ...Roll the wipe and place back into sample vial. # ...Label and pack the tubes securely for shipment. # ...Samples should be stored at room temperature until analysis.
SAMPLE PREPARATION:
# ...Add 15 mL of extraction solvent to each vial and recap. # ...Mix by rotating the vials end-over for at least one hour. # ...Filter an aliquot into a 2 mL autosampler vial through a 4 mm 0.45 Fm PTFE filter.
CALIBRATION AND QUALITY CONTROL:
# ...Determine retention time for monobutyltin trichloride using the column and chromatographic conditions as outlined on pages 1 & 2. The approximate retention time of monobutyltin trichloride is 5 minutes. (See Figure 1.)
# ...Calibrate with at least six working standards covering the analytical range.
MEASUREMENT:
# ...Set LC according to manufacturer’s recommendations. Set the flow rate at 1.00 mL/min. Set ICP-AES for analysis of organic compounds and measurement of transient scan at 189.989 nm (or similar Sn line).

Page 30 Health Hazard Evaluation Report No. 2003-0016-2959
# ...Inject 50 FL sample aliquot with autosampler. NOTE:If peak area of a sample is greater than the area of the highest standard, dilute with extraction solvent and reanalyze.
# ...Measure peak area of the analyte. CALCULATIONS: # ...Perform a separate regression analysis of the peak areas vs. quantity of standard. Determine the
amount of the analyte in each sample from the regression curve. # ...Calculate the concentration adjusting for the volume of extraction solvent. Report the results in
Fg/wipe or mg/wipe. EVALUATION OF METHOD: This method was evaluated with a recovery study at room temperature over the range of 0.151-3.54 mg/wipe using spiked laboratory samples with average recoveries in the range of 69.5-80.3% using liquid calibration standards. The storage study at room temperature was completed at 1.71 mg/wipe with an average recovery on Day 1 of 79.9% and 70.9% on the final day of the study using liquid calibration standards. The samples are, therefore, stable at least to 28 days when stored at room temperature. Due to the nature of the sampling media and the recoveries obtained, the results are to be considered as semi-quantitative. It is important that the concentration of tropolone in the final solution be twice the concentration of MBT. If not, peak shape is distorted and a shoulder is present. The upper limit of the method accounts for this requirement. REFERENCES: [1] .NIOSH [2003]. Method 5527: Triphenyl tin chloride (as Sn). In: Schlecht, PC, O’Connor, PF, Eds. NIOSH Manual of Analytical Methods (NMAM), 4th ed., 3rd supplement, Cincinnati, OH: National Institute for Occupational Safety and Health, DHHS (NIOSH) Publ 2003-154. [2] .NIOSH [1994]. Method 5504: Organotin Compounds (as Sn). In: Cassinelli ME, Ed. NIOSH Manual of Analytical Methods (NMAM), 4th ed. Cincinnati, OH: National Institute for Occupational Safety and Health, DHHS (NIOSH) Publ 94-113. [3] .NIOSH [1994]. Method 5526: Methyltin chlorides. In: Cassinelli ME, Ed. NIOSH Manual of Analytical Methods (NMAM), 4th ed. Cincinnati, OH: National Institute for Occupational Safety and Health, DHHS (NIOSH) Publ 94-113. [4] OSHA. Method ID217SG: Butyltin trichloride. In: OSHA Analytical Methods Manual, Salt Lake City, UT: Department of Labor/Occupational Safety and Health Administration. [5] ORTEP Association. Method-Butyltin Chlorides in Air. http://www.ortepa.org/stabilizers/pages/Butyltinsinair.pdf (accessed Sept 2003). [6]Andrews, RN, Hopkins, BM [2003]. Monobutyltin trichloride on Wipes Using LC-ICP-AES Backup Data Report. Cincinnati, OH: National Institute for Occupational Safety and Health, Division of Applied Research and Technology (unpublished, November). METHOD WRITTEN BY: Ronnee N. Andrews and Barbara M. Hopkins, Ph.D.

Health Hazard Evaluation Report No. 2003-0016-2959 Page 31
TABLES, FIGURES, APPENDICES
Figure 1. Chromatogram of MBT media standard with concentration of 1.80 mg/wipe.
0 1.0 2.0 3.0 4.0 5.0 6.0 7.0 8.0 9.0Minutes
31.00x10
32.00x10
33.00x10
34.00x10
35.00x10
36.00x10
CPS
10060st5

Page 32 Health Hazard Evaluation Report No. 2003-0016-2959
APPENDIX C
Toxicokinetics of Organotins The large number of organotins differ in terms of metabolism and toxicity; 23,24,25 no one organotin can be thought of as typical of the entire organotin family. In addition, there are differences in effects between animal species in both uptake and toxicity of any specific organotin.24,25 For example, triphenyltin is poorly absorbed by sheep and cows, but well absorbed by guinea pigs and mice.24
Absorption after Inhalation The vast majority of information on the biokinetics of organotins and their toxicity comes from animal studies, and most of those studies utilized the oral or intraperitoneal (IP) routes of exposure. Information on the absorption of inhaled organotins is sparse, although the case reports of human poisonings described below are consistent with inhalation exposure.
Percutaneous Absorption Short chain trialkyltins like trimethyltin are easily absorbed through the skin of rats and mice, but triphenyltin (TPT) does not penetrate skin well.25 However, there is a case report of a human poisoning via cutaneous absorption of TPT, which is described later. Tributyltin (TBT) is sufficiently absorbed through the skin of rabbits and rats to cause liver damage.26
Gastrointestinal Absorption Gastrointestinal (GI) absorption increases with the number of organic side chains and decreases with the number of carbons in the side chain.27 For example, tetra- and trialkyltins of low molecular weight (i.e., trimethyl- and triethyltin) have significant GI absorption after an oral dose, but very little of other organotins are absorbed by this route.28 Estimated GI absorption of monoethyltin is less than 10%, since over 90% of an oral dose given to rats was excreted in the feces. But an IP dose of monoethyltin was almost entirely excreted unchanged in the urine, suggesting high levels of absorption by the IP route.29
Distribution Organotins are distributed to the brain, liver, kidneys, blood, spleen, and heart of rats. In rats, half-lives of organotins vary depending on the compound. Triethyltin has about a 4-day half-life, trimethyltin 16 days and triphenyltin 3–4 days.25
Biotransformation and Excretion Dealkylation is the primary metabolic pathway for organotins. Tetraethyl and tetramethyl tins are converted to the tri form, but further conversion is minimal.27 Bridges et al. demonstrated that when radiolabelled diethyltin is injected into rats, about 50% is converted to monoethyltin and excreted in the urine and feces.30 Monoethyltin injected into rats is excreted intact. Hydroxylated TBT is converted to dibutyltin (DBT) which is then converted to monobutyltin (MBT) and excreted. Thus, organotins are at least partially excreted in the urine.25 Biliary and urinary excretions of 15 metals were evaluated in three Japanese individuals, and urinary tin concentrations were higher than biliary tin concentrations.31
Toxicity In general, the monosubstituted organotins are the least toxic, with toxicity increasing with the number of substitutions.23,25,32,33 Increasing chain length also confers decreasing toxicity, with trimethyltin (one carbon) and triethyltin (two carbons) among the most toxic.23,24,32 There is no evidence that organotins are mutagenic or carcinogenic.24

Health Hazard Evaluation Report No. 2003-0016-2959 Page 33
The tetra- and trimethyl- and ethyltins have very specific neurologic effects after oral exposure, but the others do not appear to be neurotoxic.25,26,32 Triethyltin causes spongy degeneration of the white matter of the brain and central intramyelin edema, while trimethyltin causes neuronal degeneration25 especially in the hippocampus.34 No signs of neurologic damage were found in animal studies of dimethyltin, diethyltin, or any higher trialkyltin compounds.32
Human Health Effects of Organotins The data on human toxicity of organotins are limited to a few case reports or series. The most notorious poisoning occurred in France in the 1950s. Stalinon was a medicine used for treating acne, anthrax, and staphylococcal skin infections. It contained linoleic acid and diethyltin dioxide, but was contaminated with triethyltin iodide. Over 200 persons were poisoned and over 100 died. Symptoms and signs were unrelenting headache, nausea, vomiting, urinary retention, weight loss, and psychiatric disturbances. Death from respiratory depression, coma, and seizures occurred. Survivors often had permanent neurologic impairment such as blindness or paraplegia. Cerebral edema was noted at autopsy, and surgical decompression of the brain was the only successful treatment.35,36
Most organotins cause skin irritation, although this has not been specifically demonstrated for MBTC. Lyle noted that workers who manufactured di- and tributyltin compounds for over 3 years had two types of skin lesions.37 The acute lesion showed some redness, but was primarily a folliculitis. Subacute lesions consisted of slightly red, itchy skin, without folliculitis. He also noted that workers had reported sore throat, cough, and retching after several hours exposure to vapors or fumes, but that no chronic symptoms or physical or radiographic signs developed. A case of triphenyltin acetate poisoning occurred when an individual spilled a powdered pesticide containing 18.95% TPTA on his arms.38 He washed immediately but hours later developed genital edema and rash on his trunk. He was hospitalized 2 days later with nausea and abdominal pain and had evidence of hepatic injury, which eventually resolved. He had no clinical signs of neurologic impairment, but his electroencephalogram (EEG) showed some generalized slowing. Peak urinary excretion of tin at 96 micrograms per liter of urine (µg/L) was between days 5 and 6, and decreased to 28 µg/L by day 29. Tin disappeared from the plasma between days two and four, immediately preceding the peak urinary excretion. In another instance, a woman drenched in a solution of triphenyltin died of renal failure, but there were no respiratory or neurological effects.24 Fortemps et al. reported two cases of di- and trimethyltin poisoning.39 Two chemists had been producing a mixture of di- and trimethyltin chloride, using monochloromethane and tin. Dimethyltin was produced in much larger quantities. Two months into the project one of them fell suddenly, and then had a seizure and lost consciousness. He recovered and went back to work, but 6 months later had three more seizures. The other also apparently suffered a seizure about 5 months after beginning the production. When questioned, they reported spending 6–10 hours daily in the production room without any respirator. They noted they had headache, abdominal pain, insomnia, and memory deficits prior to the abrupt onset of severe mental confusion and seizures. Both recovered completely within 1 month. The authors attributed the poisoning to trimethyltin. In 1981, six chemical workers were exposed to a solution of 75% di- and 25% trimethyltin chloride while cleaning a cauldron.40 The vapor phase was about 50% of each compound. They wore protective clothing and gas masks. Over the course of 3 days, the maximum exposure among the six workers was nine 10-minute periods. One to three days later, headache, tinnitus, memory deficits, disorientation, aggressiveness, and syncope occurred. Three patients required artificial ventilation. These three had the highest urinary tin concentrations (1300–1600 parts per billion [ppb]). EEGs were abnormal. The worker with the highest urinary tin concentrations died, and autopsy revealed mass fatty degeneration of the liver,

Page 34 Health Hazard Evaluation Report No. 2003-0016-2959
kidney damage, and cerebral edema. The worker with the second highest urinary tin concentrations had permanent neurological deficits, and the worker with the third highest urinary tin concentration had persistent memory dysfunction and aggressive behavior. The other three (urinary tin concentrations from 555–660 parts per billion [ppb]) recovered and returned to work, although they reported memory problems for at least 6 months. The timing of the urinary tin measurements was not given.
References 23. Agency for Toxic Substances and Disease Registry [1993]. Toxicological profile for tin.
24. Fait A, Ferioli A, Barbieri F [1994]. Organotin compounds. Toxicology. 91:77-82.
25. Winship KA [1988]. Toxicity of tin and its compounds. Adv Drug React Ac Pois Rev. 1:19-38.
26. Krigman MR, Silverman AP [1984]. General toxicology of tin and its organic compounds. Neurotoxicology. 5(2):129-140.
27. Elinder CG, Gerhardsson L, Oberdoerster G. [1988]. Biological monitoring of toxic metals - overview. Chapter 1. In: Clarkson TW, Friberg L, Nordberg GF, Sager PR. Eds. Biological Monitoring of Toxic Metals., New York, NY: Plenum Press, pp. 1-72.
28. Wada O, Manabe S, Iwai H, Arakawa Y [1982]. Recent progress in the study of analytical methods, toxicity, metabolism, and health effects of organotin compounds. Sangyo Igaku 24(1):24-54.
29. Rose MS [1971]. The toxicity of organotin fungicides. Proceedings of the International Symposium on Pesticide Terminal Residues. pp. 281-288.
30. Bridges JW, Davies DS, Williams RT [1967]. The fate of ethyltin and diethyltin derivatives in the rat. Biochem J. 105:1261-1267.
31. Ishihara N, Matsurshiro T [1986]. Biliary and urinary excretion of metals in humans. Arch Environ Health 41(5):324-330.
32. Snoeij NJ, Penninks AH, Seinen W [1987]. Biological activity of organotin compounds. Environ Res. 44:335-353.
33. Kimbrough RD [1976]. Toxicity and health effects of selected organotin compounds: a review. Environ Health Perspect. 14:51-56.
34. Koczyk D [1996]. How does trimethyltin affect the brain: facts and hypotheses. Acta Neurobiol Exp. 56: 587-596.
35. ACGIH [2001]. Tin, organic compounds. In: TLV Documentation.
36. Barnes JM, Stoner HB [1959]. The toxicology of tin compounds. Pharmacol Rev. 11:211-232.
37. Lyle WH [1958]. Lesions of the skin in process workers caused by contact with butyl tin compounds. Brit J Indust Med. 15:193-196.
Health Hazard Evaluation Report No. 2003-0016-2959 Page 35
38. Colosio C, Tomasini M Carioli S, Foa V, Minoia C, Marinovich M, et al. [1991]. Occupational triphenyltin acetate poisoning: a case report. Br J Indust Med. 48(2): 136-139.
39. Fortemps E, Amand G, Bomboir A, Lauwerys R, Laterre EC [1978]. Trimethyltin poisoning - report of two cases. Int Arch Occup Environ Health. 41:1-6.
40. Rey CH, Reinecke HJ, Besser R [1984]. Methyltin intoxication in six men: toxicologic and clinical aspects. Vet Hum Toxicol. 26(2): 121-122.

Page 36 Health Hazard Evaluation Report No. 2003-0016-2959
APPENDIX D
Example of Ventilation Designees
Vapor Deposition Hood Figure 1 shows an example of local exhaust ventilation (LEV) installed to reduce worker exposure when cleaning the inside of the VDH or performing maintenance. The perspective is a side view of the VDH, with bottle flow from left to right. The baffle (not shown), which juts out from the unit along side the blower motor attached to the removable side panel, would be on the right side of the figure. The drawing, not drawn exactly to scale, is meant to be illustrative rather than prescriptive.
Figure 1. Local exhaust ventilation for side opening of vapor deposition hood with cover removed
Certain aspects, such as nozzle velocity and volumetric air flow rate, must conform with recommended design practices for the system to perform properly.41 For example, the slot velocity should be a minimum of 2,000 feet per minute (ft/min), and the duct velocities should be between 3,000 and 4,000 ft/min to minimize the accumulation of particles in the ductwork. The upper and lower systems should be designed for a capture velocity of 100 ft/min at the center of the opening, a distance of approximately 8 inches. The recommended air flow rates to attain this capture velocity are listed in Table 1 for each nozzle entry.

Health Hazard Evaluation Report No. 2003-0016-2959 Page 37
Table 1. Recommended flow rate for each of the nozzle entries
Individual entries as slots Individual entries as plan openings (width greater than 20% of the length)
Non-flanged Flanged Non-flanged Flanged
Top Nozzles 170 CFM 120 CFM 460 CFM 345 CFM
Bottom Nozzles 170 CFM 120 CFM 460 CFM 345 CFM
Side Nozzles 275 CFM 195 CFM 470 CFM 350 CFM
CFM = cubic feet per minute The high temperature of the process, equipment, and air coming from the unit creates vertically rising currents of air around the equipment. The upper exhaust ventilation system must be able to contain this vertically rising air. Using equations relating the buoyancy of the hot air to its heat capacity and the air stream at the top of the heat source can be estimated.42 For a process temperature between 500ºF and 700ºF, the thermal flow rates range from approximately 55 CFM to 65 CFM. These values would easily be handled by even the lowest recommended nozzle exhaust rate for the upper system nozzles. The bottom and side nozzles of the lower branch do not have to overcome the thermal rise; however, they do need to capture the air and particles that are not carried upward by the thermal rise or captured by the air motion of the upper exhaust ventilation system.
Hopper Door Figure 2 illustrates LEV installed at the hopper door to reduce worker exposure when unclogging the caked slurry above the rotary valve. The application is adapted from a barrel filling hood presented in the Specific Operations chapter of the ACGIH Industrial Ventilation manual.41 The exhaust is drawn in through the semicircular arc adjacent to the side of the circular door opening. The drawing, not drawn to scale, shows only a single side.
D
Figure 2. Local exhaust ventilation for side opening of hopper with cover removed. D is the diameter of the hopper opening.
Two side systems can be used together, completing the circle surrounding the hopper opening and improving control. The space between the exhaust slot and the edge of the opening should be as small as practicable, allowing for the worker’s arms and tools to move in and out of the opening without injury to

Page 38 Health Hazard Evaluation Report No. 2003-0016-2959
the worker or damage to the exhaust hood. The width of the slot should be 1 inch. The flow rate is calculated by multiplying a design velocity of 100 ft/min by the area, in square feet (sq-ft), of the hopper door opening. The duct(s) should be sized for a minimum velocity of 3,500 ft/min. the overall width of the unit should be 12 inches greater than the diameter, D, of the hopper opening. The angle of the transition from the rectangular slot plenum to the round exhaust duct should be 45 degrees.
References 41. ACGIH. Industrial ventilation: a manual of recommended practice. 24th ed. Cincinnati, OH: American Conference of Governmental Industrial Hygienist, 2001. pp. 3-6 – 3-12.
42. Hemeon, WCL. Plant and process ventilation. 2nd ed. New York: Industrial Press, Inc. 1962.

DEPARTMENT OF HEALTH AND HUMAN SERVICES Centers for Disease Control and Prevention National Institute for Occupational Safety and Health 4676 Columbia Parkway Cincinnati, OH 45226-1998 OFFICIAL BUSINESS Penalty for private use $300
Delivering on the Nation's promise:
Safety and Health at work for all people through research and prevention
To receive NIOSH documents or information about occupational Safety and Health topics
contact NIOSH at:
1-800-35-NIOSH (356-4674) Fax: 1-513-533-8573
E-mail: [email protected] or visit the NIOSH web site at:
www.cdc.gov/niosh/homepage.html S A F E R • H E A L T H I E R • P E O P L E™