hhe report no. heta-2009-0224-3274, evaluation of … aa vaai e 200902243274 page 1 evaluation of...
TRANSCRIPT
Page 1Health Hazard Evaluation Report 2009-0224-3274
Evaluation of Noise Exposures in the Knockoff Areas of an Iron Foundry
Report No. 2009-0224-3274March 2017
Scott E. Brueck, MS, CIH
U.S. Department of Health and Human ServicesCenters for Disease Control and PreventionNational Institute for Occupational Safety and Health

Page 2 Health Hazard Evaluation Report 2009-0224-3274
ContentsHighlights ...............................................i
Abbreviations ..................................... iii
Introduction ......................................... 1
Methods ............................................... 2
Results and Discussion ........................ 3
Conclusions ........................................ 13
Recommendations............................. 14
Appendix A ........................................ 17
References .......................................... 21
Acknowledgements ........................... 23
The employer is required to post a copy of this report for 30 days at or near the workplace(s) of affected employees. The employer must take steps to ensure that the posted report is not altered, defaced, or covered by other material.
The cover photo is a close-up image of sorbent tubes, which are used by the HHE Program to measure airborne exposures. This photo is an artistic representation that may not be related to this Health Hazard Evaluation. Photo by NIOSH.
Page iHealth Hazard Evaluation Report 2009-0224-3274
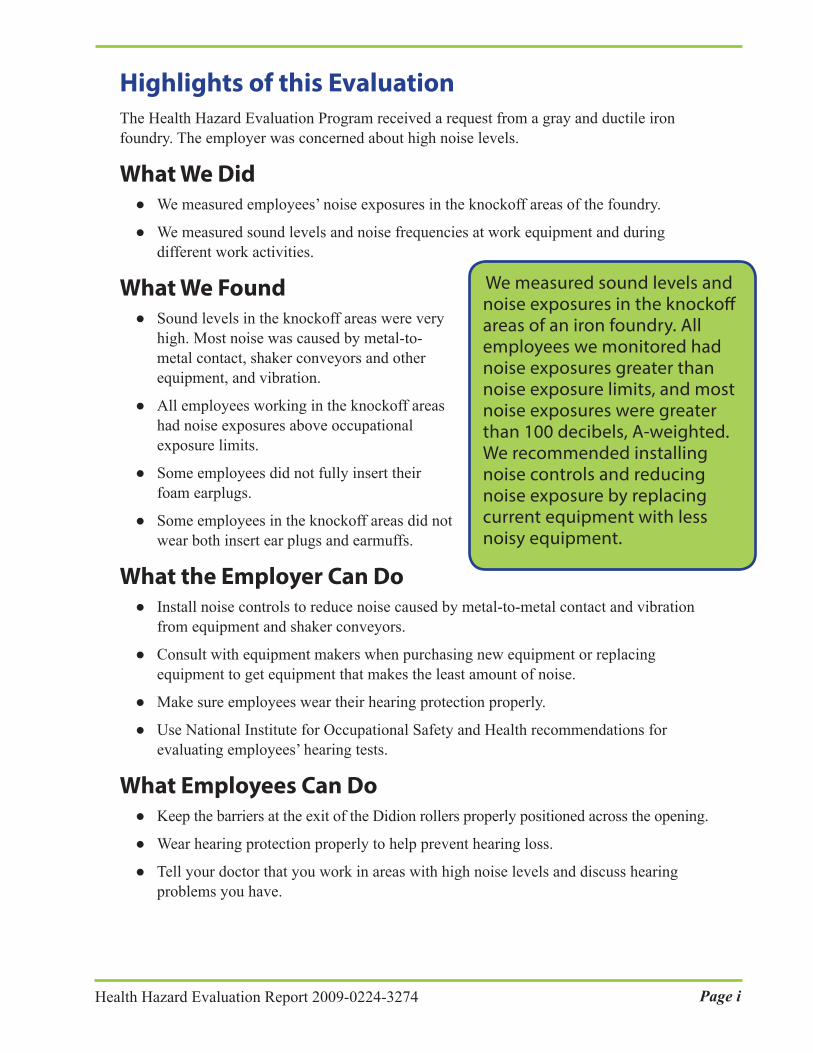
We measured sound levels and noise exposures in the knockoff areas of an iron foundry. All employees we monitored had noise exposures greater than noise exposure limits, and most noise exposures were greater than 100 decibels, A-weighted. We recommended installing noise controls and reducing noise exposure by replacing current equipment with less noisy equipment.
Highlights of this EvaluationThe Health Hazard Evaluation Program received a request from a gray and ductile iron foundry. The employer was concerned about high noise levels.
What We Did ● We measured employees’ noise exposures in the knockoff areas of the foundry.
● We measured sound levels and noise frequencies at work equipment and during different work activities.
What We Found ● Sound levels in the knockoff areas were very
high. Most noise was caused by metal-to-metal contact, shaker conveyors and other equipment, and vibration.
● All employees working in the knockoff areas had noise exposures above occupational exposure limits.
● Some employees did not fully insert their foam earplugs.
● Some employees in the knockoff areas did not wear both insert ear plugs and earmuffs.
What the Employer Can Do ● Install noise controls to reduce noise caused by metal-to-metal contact and vibration
from equipment and shaker conveyors.
● Consult with equipment makers when purchasing new equipment or replacing equipment to get equipment that makes the least amount of noise.
● Make sure employees wear their hearing protection properly.
● Use National Institute for Occupational Safety and Health recommendations for evaluating employees’ hearing tests.
What Employees Can Do ● Keep the barriers at the exit of the Didion rollers properly positioned across the opening.
● Wear hearing protection properly to help prevent hearing loss.
● Tell your doctor that you work in areas with high noise levels and discuss hearing problems you have.

Page ii Health Hazard Evaluation Report 2009-0224-3274
This page left intentionally blank
Page iiiHealth Hazard Evaluation Report 2009-0224-3274
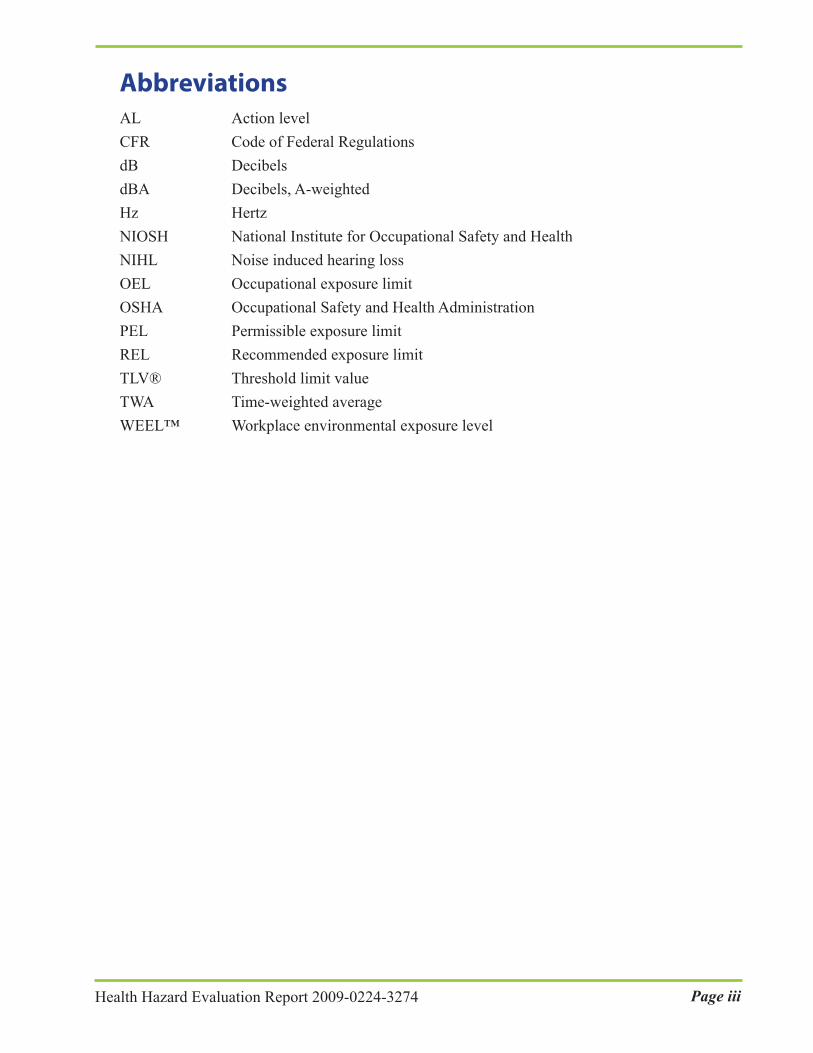
AbbreviationsAL Action levelCFR Code of Federal RegulationsdB DecibelsdBA Decibels, A-weightedHz HertzNIOSH National Institute for Occupational Safety and HealthNIHL Noise induced hearing lossOEL Occupational exposure limitOSHA Occupational Safety and Health AdministrationPEL Permissible exposure limitREL Recommended exposure limitTLV® Threshold limit valueTWA Time-weighted averageWEEL™ Workplace environmental exposure level
Page iv Health Hazard Evaluation Report 2009-0224-3274
This page left intentionally blank

Page 1Health Hazard Evaluation Report 2009-0224-3274
IntroductionThe Health Hazard Evaluation Program received a request from a ductile iron foundry. The employer was concerned about noise exposures in the knockoff areas of the facility. The company was also seeking guidance on noise control solutions. The Occupational Safety and Health Administration (OSHA) inspected the foundry in 2009 and issued citations for excessive noise exposures. OSHA suggested that the company contact the Health Hazard Evaluation Program for additional noise evaluation and assistance in identifying noise control options. We visited the facility in April 2011 to measure employees’ noise exposures and noise levels in the knockoff areas, and assess noise control options. We provided summary personal noise measurement results and preliminary noise control recommendations in a detailed letter to the employer and employee representatives in May 2011.
The foundry manufactured automotive parts for camshafts, axles, braking systems, and hydraulic rams out of ductile iron. The foundry had seven knockoff areas where employees separated ductile iron castings from the metal riser and runner gating that remained attached following the casting process. After casting, the work pieces moved from the casting area to the knockoff areas via Didion® rotary sand/casting separators, which were rotating metal tunnel structures that separated foundry sand from the casting. The castings exited the rotary separator and dropped onto shaker pan conveyors in the knockoff areas. The shaker conveyors were custom-made for the company and had a preset rate of throw that slowly moved the castings by mechanical vibration of the entire metal pan. Employees in the knockoff areas stood on or next to the shaker pan conveyor and separated the castings by manually striking the riser and runner gating with a sledgehammer or against the side rail on the conveyor. On some castings, depending on the configuration, employees used a hydraulic wedge to separate castings from excess gating (Figure 1). After separation, employees manually moved or tossed the riser and runner gating onto a separate conveyor or exit chute for recycling. Each knockoff area had one to four employees. Six of the seven knockoff areas were located in individual rooms. One of the knockoff areas was open to the foundry. The facility operated two work shifts per day. Employees normally worked 8-hour shifts. However, employees could work longer shifts, depending on production demands.

Page 2 Health Hazard Evaluation Report 2009-0224-3274
Figure 1. Hydraulic wedge suspended at one of the shaker conveyors. Photo by NIOSH.
MethodsOur objectives included the following:
● Evaluating knockoff employees’ full-shift time-weighted average (TWA) noise exposures
● Measuring one-third octave band noise frequency levels
● Identifying noise control options
We measured full-shift TWA noise exposures on a representative number of employees in all of the knockoff areas. Specifically, we monitored 13 employees during the first shift and 4 employees during the second shift. We used Larson Davis Spark™ model 706RC integrating noise dosimeters. We placed the dosimeter microphone on the top of the employee’s shoulder at the midpoint between the neck and edge of the shoulder. The dosimeters simultaneously collected data using three different settings to allow comparison of noise measurement results with three different noise exposure limits, the National Institute for Occupational Safety and Health (NIOSH) recommended exposure limit (REL), the OSHA action level (AL), and the OSHA permissible exposure limit (PEL). NIOSH uses a 3-decibel (dB) exchange rate, and OSHA uses a 5-dB exchange rate. The exchange rate expresses how much the sound level could increase or decrease while keeping the risk of hearing loss the same, if the exposure duration was simultaneously decreased or increased. For example, a 3-dB exchange rate requires that noise exposure time be halved for each 3-dB increase in noise levels; likewise, a 5-dB exchange rate requires that exposure time be halved for each 5-dB increase in noise. NIOSH considers noise measured using the 3-dB exchange rate to more accurately relate noise exposure to hearing loss risk. Additional information on noise exposure limits and health effects is provided in Appendix A.
We used Larson Davis Model 824 integrating sound level meters and frequency analyzers to measure sound levels and one-third octave band noise frequency levels (i.e., measurement

Page 3Health Hazard Evaluation Report 2009-0224-3274
of noise levels across 30 different frequencies). For most measurements we positioned the instrument, either by using a tripod or holding by hand, at a height of approximately 5 feet above the floor and within 3–6 feet of the employees or the primary noise source in the vicinity.
Results and DiscussionPersonal Noise Dosimetry MeasurementsPersonal noise dosimetry results are provided in Table 1. We compared employees’ noise monitoring results to the noise exposure limits set by NIOSH and OSHA. These noise exposure limits are meant to be the amount of noise that most employees can be exposed to without substantial risk of hearing loss. OSHA and NIOSH measure and calculate noise exposures in slightly different ways, as noted above. For an 8-hour work shift, the NIOSH REL is 85 decibels, A-weighted (dBA); the OSHA AL is 85 dBA; and the OSHA PEL is 90 dBA. For work shifts longer than 8 hours, the NIOSH REL and the OSHA AL are adjusted, as detailed in Appendix A. The OSHA PEL is not adjusted for extended work shifts. Employers are required to keep noise exposures below OSHA limits. However, NIOSH considers its REL to be more protective.
Table 1. Time-weighted average personal noise exposure results (dBA)Knockoff location
Shift Duration* (hours:minutes)
Result based on NIOSH REL
criterion
Result based on OSHA AL
criterion
Result based on OSHA PEL
criterionHerman 1st 11:42 106.4 105.7 105.6Herman 1st 9:37 104.7 104.3 104.3DISA 1 Hot 1st 5:57 107.1 106.4 106.4DISA 1 Cold 1st 6:02 104.8 102.6 102.5DISA 1 Cold 1st 6:52 104.1 102.1 102.1DISA 2 Hot 1st 7:07 100.5 99.5 99.4DISA 2 Cold 1st 5:57 107.1 106.4 106.42071 1st 7:47 100.9 99.8 99.72071 1st 8:00 100.3 99.4 99.42071 2nd 7:06 101.6 100.9 100.92071 2nd 7:06 100.1 99.7 99.72072 1st 7:49 105.4 103.8 103.72072 1st 7:49 102.7 101.1 1012072 (Sorter) 1st 7:43 97.7 96.1 95.72072 2nd 7:55 107.9 107.5 107.52072 2nd 7:00 106.6 106.6 106.6Noise exposure limits (8-hour work shift) 85 85 90*Noise exposure measurements of less than 8-hours duration are assumed to represent 8-hour time-weighted average exposures, on the basis of employees typical work activities during their full work shift.Note: One measurement during the first shift in the DISA 2 cold knockoff could not be used because of a dosimeter malfunction.

Page 4 Health Hazard Evaluation Report 2009-0224-3274
Noise sources in the knockout areas included noise from metal-to-metal contact, mechanical noise from equipment, and noise generated by vibration of shaker conveyors. Results showed that employees in all the job titles we monitored had full-shift TWA noise exposures greater than the NIOSH REL, OSHA AL, and OSHA PEL. Employees normally worked 8-hour work shifts, but on the days we monitored for noise employees in the Herman knockoff area worked longer shifts. Noise levels in knockoff 2071 and in the DISA 2 hot knockoff were slightly less than the other knockoff locations. However, employees in all of the knockout areas, except for the sorter station in knockoff 2072, had TWA noise exposures greater than 100 dBA. This was similar to previous noise measurements taken by OSHA and the company. NIOSH and OSHA recommend dual hearing protection, i.e., the use of both insert-type hearing protectors and earmuffs, when noise exposure is above 100 dBA. The company required that all employees in the knockoff areas wear dual hearing protection. However, we observed that some employees only used single protection.
One-third Octave Band Sound Level Measurement Results and Noise ControlsWorkplace noise is usually broadband noise that is distributed over a wide range of frequencies. However, noise from equipment, processes, and work activities can also have unique frequency-specific characteristics. For analysis of the frequency distribution characteristics of workplace noise, the frequency spectrum is broken into smaller frequency bands called bandwidths, the most common being the octave band, which is defined as a frequency band where the upper band frequency is twice the lower band-edge frequency. The one-third octave band further divides each of the single octave bands into three smaller frequency bands to provide even more detailed information about the noise frequency distribution characteristics. This information is useful for identifying the dominant frequencies of noise sources and determining appropriate engineering controls or other noise reduction measures. For example, if low frequency noise is dominant (i.e., the highest sound levels occur in frequencies of 500 Hertz [Hz] or less), noise is likely generated by vibration, and noise controls that reduce or isolate the vibration from tools or equipment might help decrease noise levels. If high frequency noise is dominant (i.e., the highest sound levels occur in frequencies of 3,000 Hz or greater), the most effective approach for noise reduction is to use noise enclosures, barriers, or sound absorption [Driscoll and Royster 2003].
Predominant sources of noise in the knockoff areas included the following:
● Metal castings or riser and runner gatings being dumped or dropped into metal-sided bins or onto flat metal shaker conveyors
● Metal castings, risers, and runners moving and bouncing on shaker pans or in Didion rollers
● Employees using sledgehammers or striking castings against metal rails of shaker conveyors to separate risers and runners from castings
● Mechanical and vibration-related noise from operation of the shaker conveyors
● Noise caused by loose or rattling parts on conveyors or other equipment

Page 5Health Hazard Evaluation Report 2009-0224-3274
Noise from Metal-to-Metal Contact and Vibration
In several of the knockoff areas, metal casting dropped 12–36 inches from Didion rollers onto metal shaker conveyors or from one shaker conveyor onto another shaker conveyor. Figure 2 shows the time history sound level profile for two cycles of castings being dropped about 18 inches from the hopper just outside the DISA 1 cold room onto the shaker conveyor below the hopper. Sound levels were 115–120 dBA from metal impact as castings were dumped onto the shaker conveyor. Sound levels decreased to 102–103 dBA when castings were not being dumped onto the conveyor. This background noise was from the operation of the shaker conveyor and from castings bouncing on the shaker pan. Employees in the work area reported that castings can be dumped onto this conveyor up to 150 times per shift.
Figure 2. Time history sound level profile showing the sound level characteristics for two cycles of castings being dropped onto the shaker conveyor in the DISA 1 area.
Octave band measurements at the DISA 1 cold knockoff conveyor (Figure 3) reveal differences in octave band noise levels when castings were moving on the shaker conveyor versus when casting were not on the conveyor. Overall sound levels were nearly 110 dBA when castings were moving on the shaker conveyor and employees were hand-separating the castings. Sound levels decreased to about 93 dBA when no castings were bouncing on the shaker conveyor. Octave band sound level differences were minimal from 12.5–125 Hz. Sound at these low frequencies was likely due to noise generated from the vibration transmitted by operation of the motor, conveyor drive system, and movement of the shaker pan. However, across the frequencies 160–20,000 Hz sound levels were 5–21 dB higher, showing the contribution of noise from castings moving and bouncing in the conveyor pan.

Page 6 Health Hazard Evaluation Report 2009-0224-3274
Figure 3. One-third octave noise frequency measurements at the cold knockoff shaker conveyor show frequency-dependent noise level differences when castings were moving on the shaker conveyor versus when castings were not on the shaker conveyor.
Low frequency noise is readily transmitted from equipment to surrounding surfaces. We observed that shaker conveyors were bolted directly to the concrete floor (Figure 4). However, vibration isolation pads or springs were not used to reduce vibration transmission to the floor. Additionally, some of the bolts had become loose, which could increase overall vibration of the shaker conveyor frame structure. Strategies to reduce noise due to vibration transmission include placing the shakers on vibration isolation pads and eliminating connection of other structures to the shaker frame. For example, the metal floor platform in the DISA 1 cold knockoff area was connected directly to the frame under the shaker, which caused the floor platform to vibrate. We also noted that the sound levels decreased 5 dB when the shaker had been turned off between two separate runs of castings.
Figure 4. Frame of shaker conveyor bolted directly to the concrete floor. Photo by NIOSH.

Page 7Health Hazard Evaluation Report 2009-0224-3274
At the Herman knockoff area, castings exited a chute and dropped about 3 feet from one shaker conveyor onto another shaker conveyor. The time history sound level profile measurements in this area (Figure 5) revealed that background sound levels were 105 dBA from operation of the conveyor and movement of castings on the conveyor. Sound levels increased to about 120 dBA when castings fell from one conveyor onto the other conveyor.
Figure 5. Time history sound level profile as castings dropped 3 feet from one shaker conveyor to another shaker conveyor at the Herman knockoff area.
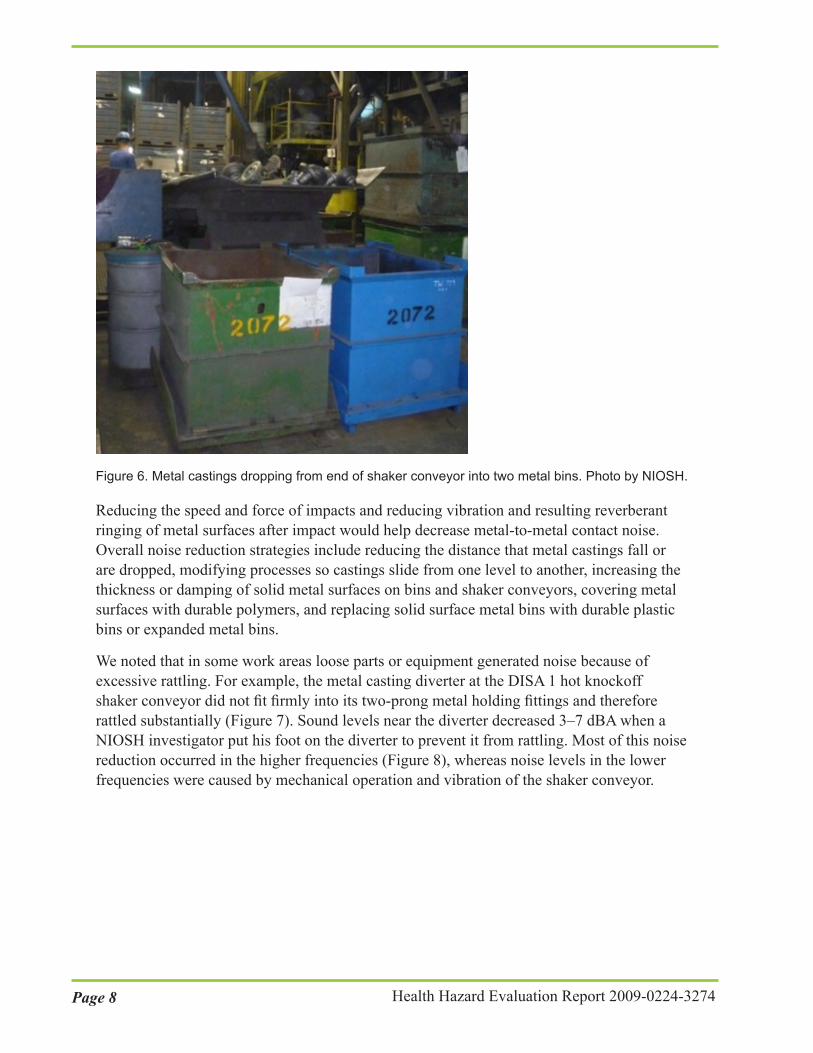
Figure 6 shows large finished metal castings falling from the end of a shaker conveyor into metal bins. Average sound levels when the castings were moving down the shaker conveyor and falling into the bin were 107–111 dBA due to noise from the castings bouncing on the shaker conveyor, mechanical noise from the shaker conveyor, and impact noise from parts falling into the bin. Peak sound levels reached 134 dB when castings fell up to 5 feet into the metal bins and struck the bottom, side, or edge of a bin.
Page 8 Health Hazard Evaluation Report 2009-0224-3274
Figure 6. Metal castings dropping from end of shaker conveyor into two metal bins. Photo by NIOSH.
Reducing the speed and force of impacts and reducing vibration and resulting reverberant ringing of metal surfaces after impact would help decrease metal-to-metal contact noise. Overall noise reduction strategies include reducing the distance that metal castings fall or are dropped, modifying processes so castings slide from one level to another, increasing the thickness or damping of solid metal surfaces on bins and shaker conveyors, covering metal surfaces with durable polymers, and replacing solid surface metal bins with durable plastic bins or expanded metal bins.
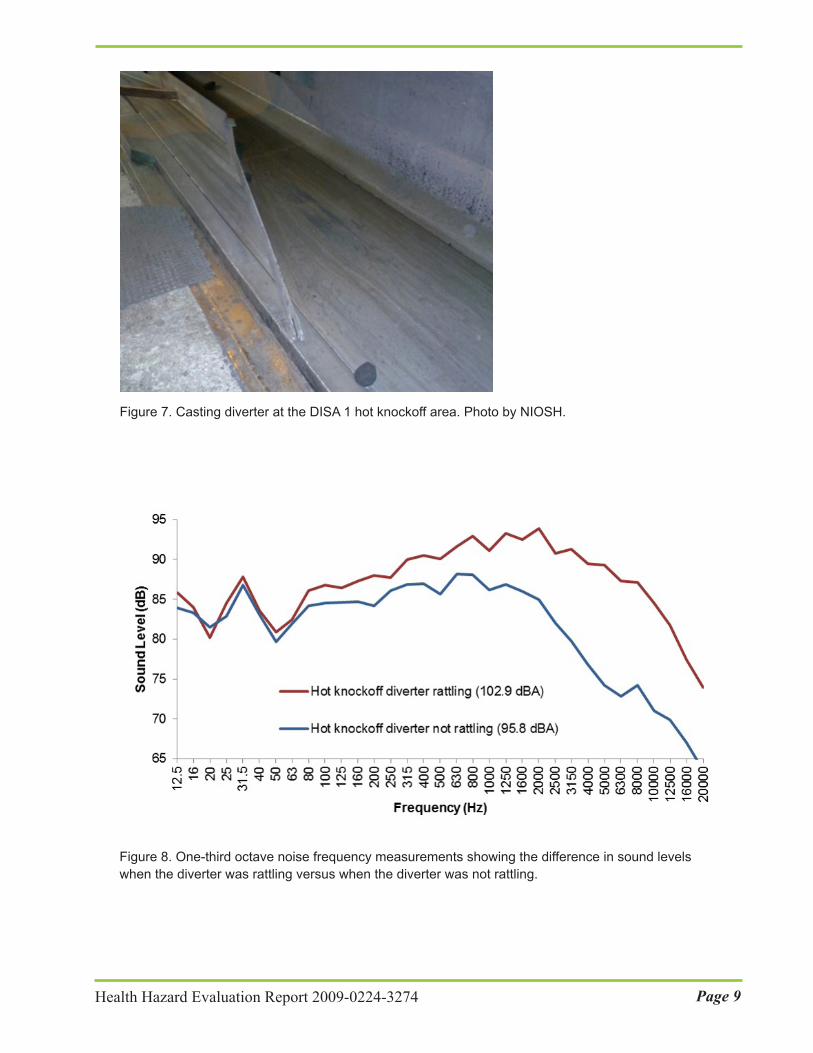
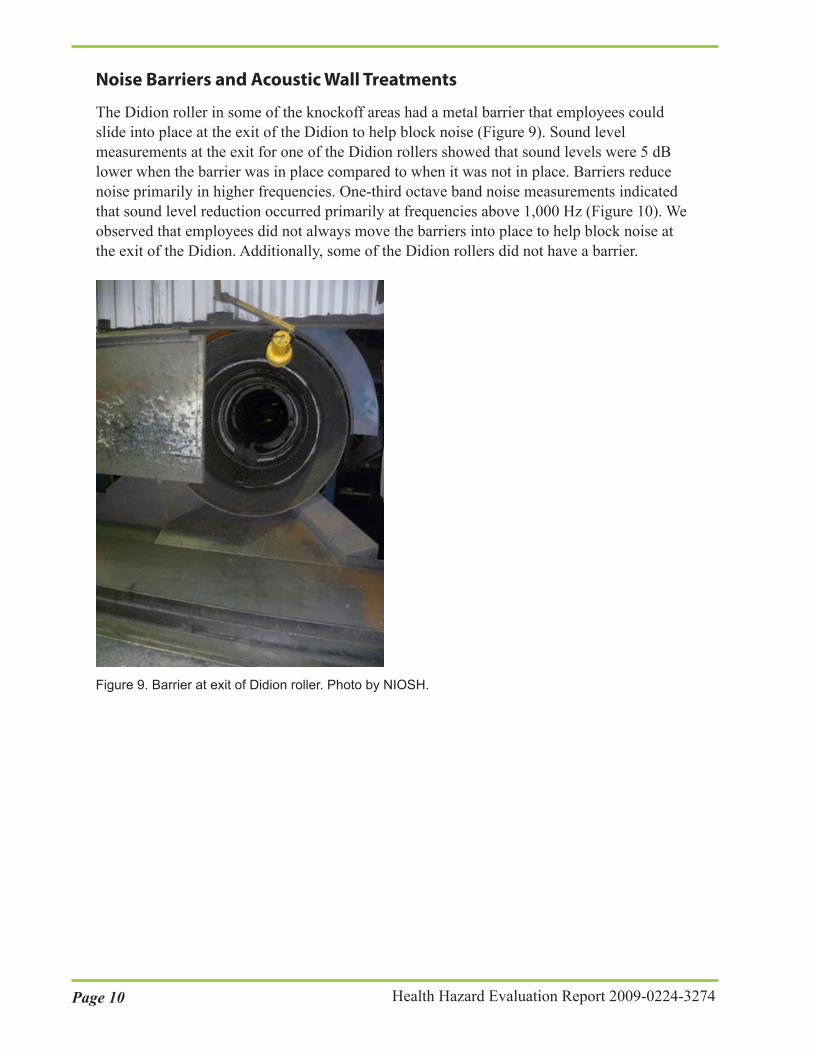
We noted that in some work areas loose parts or equipment generated noise because of excessive rattling. For example, the metal casting diverter at the DISA 1 hot knockoff shaker conveyor did not fit firmly into its two-prong metal holding fittings and therefore rattled substantially (Figure 7). Sound levels near the diverter decreased 3–7 dBA when a NIOSH investigator put his foot on the diverter to prevent it from rattling. Most of this noise reduction occurred in the higher frequencies (Figure 8), whereas noise levels in the lower frequencies were caused by mechanical operation and vibration of the shaker conveyor.
Page 9Health Hazard Evaluation Report 2009-0224-3274
Figure 7. Casting diverter at the DISA 1 hot knockoff area. Photo by NIOSH.
Figure 8. One-third octave noise frequency measurements showing the difference in sound levels when the diverter was rattling versus when the diverter was not rattling.
Page 10 Health Hazard Evaluation Report 2009-0224-3274
Noise Barriers and Acoustic Wall Treatments
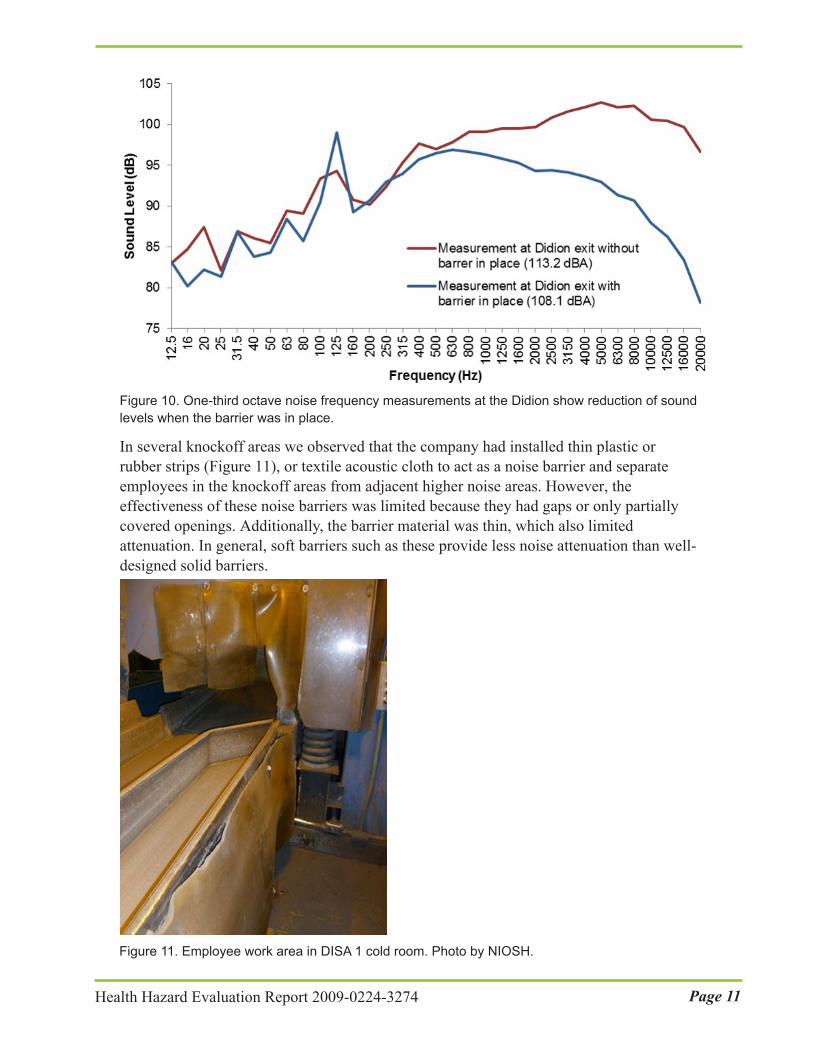
The Didion roller in some of the knockoff areas had a metal barrier that employees could slide into place at the exit of the Didion to help block noise (Figure 9). Sound level measurements at the exit for one of the Didion rollers showed that sound levels were 5 dB lower when the barrier was in place compared to when it was not in place. Barriers reduce noise primarily in higher frequencies. One-third octave band noise measurements indicated that sound level reduction occurred primarily at frequencies above 1,000 Hz (Figure 10). We observed that employees did not always move the barriers into place to help block noise at the exit of the Didion. Additionally, some of the Didion rollers did not have a barrier.
Figure 9. Barrier at exit of Didion roller. Photo by NIOSH.
Page 11Health Hazard Evaluation Report 2009-0224-3274
Figure 10. One-third octave noise frequency measurements at the Didion show reduction of sound levels when the barrier was in place.
In several knockoff areas we observed that the company had installed thin plastic or rubber strips (Figure 11), or textile acoustic cloth to act as a noise barrier and separate employees in the knockoff areas from adjacent higher noise areas. However, the effectiveness of these noise barriers was limited because they had gaps or only partially covered openings. Additionally, the barrier material was thin, which also limited attenuation. In general, soft barriers such as these provide less noise attenuation than well-designed solid barriers.
Figure 11. Employee work area in DISA 1 cold room. Photo by NIOSH.

Page 12 Health Hazard Evaluation Report 2009-0224-3274
The company had also installed quilted acoustic textile sound absorption treatment on the interior walls in some of the knockoff rooms to reduce reverberant noise within the rooms. However, in some knockoff rooms the acoustic treatment did not fully cover wall and ceiling surfaces (Figure 12). Additionally, we observed that in some knockoff rooms the acoustic material was damaged. These deficiencies can substantially reduce the effectiveness of acoustic treatments.
Figure 12. Knockoff area showing a corrugated metal wall partially covered with acoustic material. Photo by NIOSH.
“Buy Quiet” Noise Control Program
In addition to installing noise engineering controls, noise reduction should be considered as part of an overall long-term Buy Quiet strategy. For example, when equipment is replaced, the amount of noise generated by the new equipment should be considered as part of the purchasing decision. Buy Quiet is a concept by which companies can reduce hazardous noise levels through their procurement process. Purchasers can compare noise emission levels for differing models of equipment and, whenever possible, choose the quieter equipment.

Page 13Health Hazard Evaluation Report 2009-0224-3274
Hearing Conservation Program
The company had a written corporate and site-specific hearing conservation program. All employees were included in the program. Audiometric testing had previously been done onsite or through a local occupational health provider, but starting in 2010 an external contractor came onsite with a mobile test van to provide audiograms. The company also began to keep electronic records of audiometric test results in 2010.
We did not review employees’ audiometric test results, but we reviewed the audiometric testing program. The audiometric test provider identified threshold shifts using OSHA criteria. NIOSH recommends that threshold shifts are also identified using NIOSH criteria, as detailed in Appendix A. The audiometric provider referred employees for medical follow-up on the basis of a medical condition identified during the testing, excessive threshold differences compared to the medical baseline, or excessive threshold differences between ears. The company provided each employee with a letter detailing the employee’s hearing test results and recommendations for follow-up, if needed. Each audiometric test record included the employee’s job title and the employee’s noise exposure. However, the noise exposure level reported on all of the audiometric test records showed a “default” noise exposure of 85 dBA, rather than the actual noise exposure for each employee.
The company offered five models of earplugs (3M™ E-A-R™ Classic™, 3M Classic Superfit™, Howard Leight Max®, Howard Leight Maxlite®, and Moldex Goin’ Green®) and an earmuff (Howard Leight model L3). We observed that all employees in the foundry wore hearing protection. However, we saw that some employees in the knockoff areas did not wear dual hearing protection, as was company policy. We also saw that some employees in the mold area did not fully insert their hearing protection, which can substantially reduce the ability of the hearing protectors to attenuate noise.
Although the manufacturers’ noise reduction ratings for these hearing protectors ranged 29–33 dBA, hearing protectors do not typically achieve this level of attenuation [NIOSH 1998]. Noise attenuation of insert-type hearing protection by individual users depends on the type of hearing protector, shape of the user’s ear canal, how well the hearing protector fits, and proper insertion of the hearing protector. Several hearing protection manufacturers have developed methods for fit testing individual employees to determine the attenuation they actually receive from the hearing protectors they use.
ConclusionsEmployees’ TWA noise exposures in all of the knockoff jobs we monitored exceeded the NIOSH REL, OSHA PEL, and OSHA AL. Furthermore, TWA noise exposures in all of the knockoff locations were greater than 100 dBA. We observed that most but not all employees working in these areas wore dual hearing protection as recommended by NIOSH and OSHA. We recommend installing engineering noise controls, improving acoustic barriers and treatments, maintaining equipment to eliminate unnecessary rattling from loose parts, and implementing a Buy Quiet program to help reduce noise exposures.

Page 14 Health Hazard Evaluation Report 2009-0224-3274
RecommendationsOn the basis of our findings, we recommend the actions listed below. We encourage the ductile iron foundry use a labor-management health and safety committee or working group to discuss our recommendations and develop an action plan. Those involved in the work can best set priorities and assess the feasibility of our recommendations for the specific situation at this company.
Our recommendations are based on an approach known as the hierarchy of controls (Appendix A: Occupational Exposure Limits and Health Effects). This approach groups actions by their likely effectiveness in reducing or removing hazards. In most cases, the preferred approach is to eliminate hazardous materials or processes and install engineering controls to reduce exposure or shield employees. Until such controls are in place, or if they are not effective or feasible, administrative measures and personal protective equipment may be needed.
Elimination and SubstitutionEliminating or substituting hazardous processes or materials reduces hazards and protects employees more effectively than other approaches. Prevention through design, considering elimination or substitution when designing or developing a project, reduces the need for additional controls in the future.
1. Replace shaker conveyors with belt-driven conveyors, where feasible.
Engineering ControlsEngineering controls reduce employees’ exposures by removing the hazard from the process or by placing a barrier between the hazard and the employee. Engineering controls protect employees effectively without placing primary responsibility of implementation on the employee. No single noise engineering control will likely reduce employees’ noise exposures to below the noise exposure limits. However, a combination of multiple engineering controls can help reduce overall noise exposures.
1. In general, noise from metal-to-metal contacts can be decreased by reducing the speed and force of impacts and by reducing vibration and reverberant ringing of flat metal surfaces after impact. Specific actions that can be taken include the following:
a. Reduce the distance that metal castings or metal scrap drop into bins and onto shaker conveyors. b. Use slide pans with an angle of 45 degrees or less to move castings or scrap pieces from one level to a lower level instead of allowing the pieces to drop straight down. c. Increase the thickness of metal surfaces on shaker conveyors and walls of metal bins with thicker metal or constrained layer damped metal. Alternatively, replace metal bins with bins made of durable plastic polymer materials.

Page 15Health Hazard Evaluation Report 2009-0224-3274
d. Attach resilient plastic polymer material to the surface of flat metal pans and shaker conveyors to reduce noise from metal casting bouncing or moving on these surfaces. e. Perform preventive maintenance on equipment to eliminate unnecessary rattling of metal parts.
2. Place shaker conveyors on vibration isolation springs or pads and, where possible, eliminate direct metal-to-metal connection to other structures of the shaker frame.
3. Place barriers at the exit of all Didions to block noise.
Administrative ControlsThe term administrative controls refers to employer-dictated work practices and policies to reduce or prevent hazardous exposures. Their effectiveness depends on employer commitment and employee acceptance. Regular monitoring and reinforcement are necessary to ensure that policies and procedures are followed consistently.
1. Make sure that employees keep the barriers properly positioned at all times.
2. Consult with acoustic noise control engineers who have expertise in foundry noise reduction approaches for additional guidance on noise controls. The noise control engineers should be board certified by the Institute of Noise Control Engineers.
3. Implement a long-term strategy to reduce noise exposures by purchasing new equipment that generates less noise. Information on Buy Quiet programs is available at http://www.cdc.gov/niosh/topics/buyquiet/.
4. Refer to OSHA’s Technical Manual for additional information on noise and noise control at https://www.osha.gov/dts/osta/otm/new_noise/index.html. NIOSH has noise control information at http://www.cdc.gov/niosh/topics/noisecontrol/ and information on noise generated by power tools can be found in the NIOSH power tools database at http://wwwn.cdc.gov/niosh-sound-vibration/.
5. Conduct noise measurement surveys after noise controls have been installed to evaluate whether the controls have adequately reduced noise levels and employees’ noise exposures.
6. Use NIOSH criteria in addition to OSHA criteria to identify hearing threshold shifts to improve detection of potential hearing loss. Include the 8,000-Hz frequency in audiometric tests. Refer to NIOSH audiometric evaluation and monitoring recommendations at http://www.cdc.gov/niosh/docs/98-126/ for additional information on audiometric testing and hearing loss prevention programs.
7. Include the measured noise exposure levels by job title in each employee’s audiometric test record.
8. Advise employees to report any hearing problems to their healthcare provider and to the company.

Page 16 Health Hazard Evaluation Report 2009-0224-3274
Personal Protective EquipmentPersonal protective equipment is the least effective means for controlling hazardous exposures. Proper use of personal protective equipment requires a comprehensive program and a high level of employee involvement and commitment. The right personal protective equipment must be chosen for each hazard. Supporting programs such as training, change-out schedules, and medical assessment may be needed. Personal protective equipment should not be the sole method for controlling hazardous exposures. Rather, personal protective equipment should be used until effective engineering and administrative controls are in place.
1. Make sure that employees working in the knockoff areas always wear dual hearing protection and that they properly insert foam insert ear plugs.
2. Provide additional hands-on training for all employees and supervisors on how to insert hearing protectors properly and the importance of proper hearing protector fit.
3. Perform hearing protector fit testing to determine the noise attenuation of protectors worn by foundry employees.

Page 17Health Hazard Evaluation Report 2009-0224-3274
Appendix A: Occupational Exposure Limits and Health EffectsNIOSH investigators refer to mandatory (legally enforceable) and recommended occupational exposure limits (OELs) for chemical, physical, and biological agents when evaluating workplace hazards. OELs have been developed by federal agencies and safety and health organizations to prevent adverse health effects from workplace exposures. Generally, OELs suggest levels of exposure that most employees may be exposed to for up to 10 hours per day, 40 hours per week, for a working lifetime, without experiencing adverse health effects. However, not all employees will be protected if their exposures are maintained below these levels. Some may have adverse health effects because of individual susceptibility, a pre-existing medical condition, or a hypersensitivity (allergy). In addition, some hazardous substances act in combination with other exposures, with the general environment, or with medications or personal habits of the employee to produce adverse health effects. Most OELs address airborne exposures, but some substances can be absorbed directly through the skin and mucous membranes.
Most OELs are expressed as a TWA exposure. A TWA refers to the average exposure during a normal 8- to 10-hour workday. Some chemical substances and physical agents have recommended short-term exposure limits or ceiling values. Unless otherwise noted, the short-term exposure limit is a 15-minute TWA exposure. It should not be exceeded at any time during a workday. The ceiling limit should not be exceeded at any time.
In the United States, OELs have been established by federal agencies, professional organizations, state and local governments, and other entities. Some OELs are legally enforceable limits; others are recommendations.
● The U.S. Department of Labor OSHA PELs (29 CFR 1910 [general industry]; 29 CFR 1926 [construction industry]; and 29 CFR 1917 [maritime industry]) are legal limits. These limits are enforceable in workplaces covered under the Occupational Safety and Health Act of 1970.
● NIOSH RELs are recommendations based on a critical review of the scientific and technical information and the adequacy of methods to identify and control the hazard. NIOSH RELs are published in the NIOSH Pocket Guide to Chemical Hazards [NIOSH 2010]. NIOSH also recommends risk management practices (e.g., engineering controls, safe work practices, employee education/training, personal protective equipment, and exposure and medical monitoring) to minimize the risk of exposure and adverse health effects.
● Other OELs commonly used and cited in the United States include the threshold limit values (TLVs), which are recommended by the ACGIH, a professional organization, and the workplace environmental exposure levels (WEELs), which are recommended by the American Industrial Hygiene Association, another professional organization. The TLVs and WEELs are developed by committee members of these associations from a review of the published, peer-reviewed literature. These OELs are not consensus standards. TLVs are considered voluntary exposure guidelines for use by industrial

Page 18 Health Hazard Evaluation Report 2009-0224-3274
hygienists and others trained in this discipline “to assist in the control of health hazards” [ACGIH 2016]. WEELs have been established for some chemicals “when no other legal or authoritative limits exist” [AIHA 2016].
Outside the United States, OELs have been established by various agencies and organizations and include legal and recommended limits. The Institut für Arbeitsschutz der Deutschen Gesetzlichen Unfallversicherung (Institute for Occupational Safety and Health of the German Social Accident Insurance) maintains a database of international OELs from European Union member states, Canada (Québec), Japan, Switzerland, and the United States. The database, available at http://www.dguv.de/ifa/GESTIS/GESTIS-Internationale-Grenzwerte-für-chemische-Substanzen-limit-values-for-chemical-agents/index-2.jsp, contains international limits for more than 2,000 hazardous substances and is updated periodically.
OSHA requires an employer to furnish employees a place of employment free from recognized hazards that cause or are likely to cause death or serious physical harm [Occupational Safety and Health Act of 1970 (Public Law 91–596, sec. 5(a)(1))]. This is true in the absence of a specific OEL. It also is important to keep in mind that OELs may not reflect current health-based information.
When multiple OELs exist for a substance or agent, NIOSH investigators generally encourage employers to use the lowest OEL when making risk assessment and risk management decisions. NIOSH investigators also encourage use of the hierarchy of controls approach to eliminate or minimize workplace hazards. This includes, in order of preference, the use of (1) substitution or elimination of the hazardous agent, (2) engineering controls (e.g., local exhaust ventilation, process enclosure, dilution ventilation), (3) administrative controls (e.g., limiting time of exposure, employee training, work practice changes, medical surveillance), and (4) personal protective equipment (e.g., respiratory protection, gloves, eye protection, hearing protection). Control banding, a qualitative risk assessment and risk management tool, is a complementary approach to protecting employee health. Control banding focuses on how broad categories of risk should be managed. Information on control banding is available at http://www.cdc.gov/niosh/topics/ctrlbanding/. This approach can be applied in situations where OELs have not been established or can be used to supplement existing OELs.
NoiseNoise induced hearing loss (NIHL) is an irreversible condition that progresses with noise exposure. It is caused by damage to the nerve cells of the inner ear and, unlike some other types of hearing disorders, cannot be treated medically [Berger et al. 2003]. More than 22 million U.S. workers are estimated to be exposed to workplace noise levels above 85 dBA [Tak et al. 2009]. NIOSH estimates that workers exposed to an average daily noise level of 85 dBA over a 40-year working lifetime have an 8% excess risk of material hearing impairment. This excess risk increases to 25% for an average daily noise exposure of 90 dBA [NIOSH 1998].
Although hearing ability commonly declines with age, exposure to excessive noise can increase the rate of hearing loss. In most cases, NIHL develops slowly from repeated
Page 19Health Hazard Evaluation Report 2009-0224-3274
exposure to noise over time, but the progression of hearing loss is typically the greatest during the first several years of noise exposure. NIHL can also result from short duration exposures to high noise levels or even from a single exposure to an impulse noise or a continuous noise, depending on the intensity of the noise and the individual’s susceptibility to NIHL [Berger et al. 2003]. Noise exposed workers can develop substantial NIHL before it is clearly recognized. Even mild hearing losses can impair one’s ability to understand speech and hear many important sounds. In addition, some people with NIHL also develop tinnitus. This is a condition in which a person perceives hearing sound in one or both ears when no external sound is actually present. Persons with tinnitus often describe hearing ringing, hissing, buzzing, whistling, clicking, or chirping like crickets. Tinnitus can be intermittent or continuous and the perceived volume can range from soft to loud. Currently, no cure for tinnitus exists.
The preferred unit for reporting occupational and environmental noise measurements is the decibel, A-weighted, abbreviated as dBA. A-weighting is used because it approximates the “equal loudness perception characteristics of human hearing for pure tones relative to a reference of 40 dB at a frequency of 1,000 Hz” and is considered to provide a better estimation of hearing loss risk than using unweighted or other weighting measurements [Earshen 2003]. The dB unit is dimensionless, and it represents the logarithmic ratio of the measured sound pressure level to an arbitrary reference sound pressure (20 micropascals, which is defined as the threshold of normal human hearing at a frequency of 1,000 Hz). Decibels are used because of the very large range of sound pressure levels audible to the human ear. Because the dB is logarithmic, an increase of 3 dB is a doubling of the sound energy, an increase of 10 dB is a 10-fold increase, and an increase of 20 dB is a 100-fold increase in sound energy. Noise exposures expressed in dB should not be averaged using the arithmetic mean.
Workers exposed to noise should have baseline and yearly hearing tests to evaluate their hearing thresholds and determine whether their hearing has changed over time. Hearing testing must be done in a quiet location, such as an audiometric test booth, where background noise does not interfere with accurate measurement of hearing thresholds. In workplace hearing conservation programs, hearing thresholds must be measured at 500 Hz, 1,000 Hz, 2,000 Hz, 3,000 Hz, 4,000 Hz, and 6,000 Hz. Additionally, NIOSH recommends that 8,000 Hz should also be tested [NIOSH 1998]. The OSHA hearing conservation standard requires analysis of changes from baseline hearing thresholds to determine if the changes are substantial enough to meet OSHA criteria for a standard threshold shift. OSHA defines a standard threshold shift as a change in hearing threshold relative to the baseline hearing test of an average of 10 dB or more at 2,000 Hz, 3,000 Hz, and 4,000 Hz in either ear [29 CFR 1910.95]. If a standard threshold shift occurs, the company must determine if the hearing loss also meets the requirements to be recorded on the OSHA Form 300 Log of Work-Related Injuries and Illnesses [29 CFR 1904.1]. In contrast to OSHA, NIOSH defines a significant threshold shift as an increase in the hearing threshold level of 15 dB or more, relative to the baseline audiogram, at any test frequency in either ear measured twice in succession [NIOSH 1998].
NIOSH has an REL for noise of 85 dBA, as an 8-hour TWA. For calculating exposure limits, NIOSH uses a 3-dB time/intensity trading relationship, or exchange rate. Using this criterion,

Page 20 Health Hazard Evaluation Report 2009-0224-3274
an employee can be exposed to 88 dBA for no more than 4 hours, 91 dBA for 2 hours, 94 dBA for 1 hour, 97 dBA for 0.5 hours, etc. Exposure to impulsive noise should never exceed 140 dBA. For extended work shifts NIOSH adjusts the REL to 84.5 dBA for a 9-hour shift, 84.0 dBA for a 10-hour shift, 83.6 dBA for an 11-hour shift, and 83.2 dBA for a 12-hour work shift. When noise exposures exceed the REL, NIOSH recommends the use of hearing protection and implementation of a hearing loss prevention program [NIOSH 1998].
The OSHA noise standard specifies a PEL of 90 dBA and an AL of 85 dBA, both as 8-hour TWAs. OSHA uses a less conservative 5-dB exchange rate for calculating the PEL and AL. Using the OSHA criterion, an employee may be exposed to noise levels of 95 dBA for no more than 4 hours, 100 dBA for 2 hours, 105 dBA for 1 hour, 110 dBA for 0.5 hours, etc. Exposure to impulsive or impact noise must not exceed 140 dB peak noise level. OSHA does not adjust the PEL for extended work shifts. However, the AL is adjusted to 84.1 dBA for a 9-hour shift, 83.4 dBA for a 10-hour shift, 82.7 dBA for an 11-hour shift, and 82.1 dBA for a 12-hour work shift. OSHA requires implementation of a hearing conservation program when noise exposures exceed the AL [29 CFR 1910.95].
An employee’s daily noise dose, based on the duration and intensity of noise exposure, can be calculated according to the formula: Dose = 100 x (C1/T1 + C2/T2 + ... + Cn/Tn), where Cn indicates the total time of exposure at a specific noise level and Tn indicates the reference exposure duration for which noise at that level becomes hazardous. A noise dose greater than 100% exceeds the noise exposure limit.
To calculate the noise dose using NIOSH criteria, the reference duration (Tn) for each time period must be calculated using the following formula: T (minutes) = 480/2(L−85)/3, where L = the measured noise exposure level for each time period. To calculate noise dose using OSHA criteria, the reference duration (Tn) for each time period must be calculated using a slightly different formula: T (minutes) = 480/2(L−90)/5, where L = the measured noise exposure level for each time period.

Page 21Health Hazard Evaluation Report 2009-0224-3274
ReferencesACGIH [2016]. 2016 TLVs® and BEIs®: threshold limit values for chemical substances and physical agents and biological exposure indices. Cincinnati, OH: American Conference of Governmental Industrial Hygienists.
AIHA [2016]. AIHA 2016 emergency response planning guidelines (ERPG) & workplace environmental exposure levels (WEEL) handbook. Fairfax, VA: American Industrial Hygiene Association.
Berger EH, Royster LH, Royster JD, Driscoll DP, Layne M, eds. [2003]. The noise manual. 5th rev. ed. Fairfax, VA: American Industrial Hygiene Association.
CFR. Code of Federal Regulations. Washington, DC: U.S. Government Printing Office, Office of the Federal Register.
Driscoll DP, Royster LH [2003]. Noise control engineering. In: Berger EH, Royster LH, Royster JD, Driscoll DP, Layne M. eds. The noise manual, 5th ed. Akron, OH: American Industrial Hygiene Association, pp. 279–378.
Earshen J [2003]. Sound measurement: instrumentation and noise descriptors. In Berger EH, Royster LH, Royster JD, Driscoll DP, Layne M, eds. The noise manual. 5th rev. ed. Fairfax, VA: American Industrial Hygiene Association, pp. 41–100.
NIOSH [1998]. Criteria for a recommended standard: occupational noise exposure (revised criteria 1998). Cincinnati, OH: U.S. Department of Health and Human Services, Centers for Disease Control and Prevention, National Institute for Occupational Safety and Health, DHHS (NIOSH) Publication No. 98-126, https://www.cdc.gov/niosh/docs/98-126/pdfs/98-126.pdf.
NIOSH [2010]. NIOSH pocket guide to chemical hazards. Cincinnati, OH: U.S. Department of Health and Human Services, Centers for Disease Control and Prevention, National Institute for Occupational Safety and Health, DHHS (NIOSH) Publication No. 2010-168c, http://www.cdc.gov/niosh/npg/.
Tak S, Davis RR, Calvert GM [2009]. Exposure to hazardous workplace noise and use of hearing protection devices among U.S. workers—NHANES, 1999–2004. Am J Ind Med 52(5):358–371, http://dx.doi.org/10.1002/ajim.20690.
Page 22 Health Hazard Evaluation Report 2009-0224-3274
Keywords: North American Industry Classification System 331511 (Iron Foundries); Wisconsin; Noise; Impact Noise; Noise Controls; Buy Quiet; Hearing Loss; Hearing Protection
Page 23Health Hazard Evaluation Report 2009-0224-3274
The Health Hazard Evaluation Program investigates possible health hazards in the workplace under the authority of the Occupational Safety and Health Act of 1970 (29 U.S.C. § 669(a)(6)). The Health Hazard Evaluation Program also provides, upon request, technical assistance to federal, state, and local agencies to investigate occupational health hazards and to prevent occupational disease or injury. Regulations guiding the Program can be found in Title 42, Code of Federal Regulations, Part 85; Requests for Health Hazard Evaluations (42 CFR Part 85).
DisclaimerThe recommendations in this report are made on the basis of the findings at the workplace evaluated and may not be applicable to other workplaces.
Mention of any company or product in this report does not constitute endorsement by NIOSH.
Citations to Web sites external to NIOSH do not constitute NIOSH endorsement of the sponsoring organizations or their programs or products. NIOSH is not responsible for the content of these Web sites. All Web addresses referenced in this document were accessible as of the publication date.
AcknowledgmentsDesktop Publisher: Shawna Watts Editor: Ellen Galloway Industrial Hygiene Field Assistance: Lilia ChenLogistics: Donnie Booher, Karl Feldmann
Availability of ReportCopies of this report have been sent to the employer and employees at the facility. The state and local health department and the Occupational Safety and Health Administration Regional Office have also received a copy. This report is not copyrighted and may be freely reproduced.
Recommended citation for this report:NIOSH [2017]. Evaluation of noise exposures in the knockoff areas of an iron foundry. By Brueck SE. Cincinnati, OH: U.S. Department of Health and Human Services, Centers for Disease Control and Prevention, National Institute for Occupational Safety and Health, NIOSH Health Hazard Evaluation Report 2009-0224-3274, http://www.cdc.gov/niosh/hhe/reports/pdfs/2009-0224-3274.pdf.

To receive NIOSH documents or more information about occupational safety and health topics, please contact NIOSH:
Telephone: 1–800–CDC–INFO (1–800–232–4636)TTY: 1–888–232–6348CDC INFO: www.cdc.gov/infoor visit the NIOSH Web site at www.cdc.gov/nioshFor a monthly update on news at NIOSH, subscribe to NIOSH eNews by visiting www.cdc.gov/niosh/eNews.
Delivering on the Nation’s promise:Safety and health at work for all people through research and prevention