hhe report no. heta-2015-0050-3308, evaluation of exposure ... · tphp tris(phenyl) phosphate tlv®...
TRANSCRIPT
Page 1Health Hazard Evaluation Report 2015-0050-3308
Evaluation of Exposure to Metals, Flame Retardants, and Nanomaterials at an Electronics Recycling Company
HHE Report No. 2015-0050-3308May 2018
Catherine C. Beaucham, MPH, CIHDiana Ceballos, PhD, CIHElena H. Page, MD, MPH
Charles Mueller, MSAntonia M. Calafat, PhD
Andreas Sjodin, PhDMaria Ospina, PhD
Mark La Guardia, MSEric Glassford, MS, CIH

Page 2 Health Hazard Evaluation Report 2015-0050-3308
ContentsHighlights ...............................................i
Abbreviations ..................................... iii
Introduction ......................................... 1
Methods ............................................... 4
Results ................................................ 10
Discussion .......................................... 28
Conclusions ........................................ 39
Recommendations............................. 40
Appendix A ........................................ 43
Appendix B ........................................ 49
Appendix C ........................................ 50
Appendix D ........................................ 61
References .......................................... 62
Acknowledgements ........................... 73
The employer is required to post a copy of this report for 30 days at or near the workplace(s) of affected employees. The employer must take steps to ensure that the posted report is not altered, defaced, or covered by other material.
The cover photo is a close-up image of sorbent tubes, which are used by the HHE Program to measure airborne exposures. This photo is an artistic representation that may not be related to this Health Hazard Evaluation. Photo by NIOSH.

Page iHealth Hazard Evaluation Report 2015-0050-3308
We assessed employees’ exposures to metals and flame retardants at an electronics recycling company. We found some flame retardants typically associated with electronics in the air, on employees’ hands, in their blood, and in their urine (metabolites). We found metals in the air and on surfaces outside of the processing area. One employee’s exposure to cadmium in the air was above the recommended exposure limit. Three employees had elevated blood lead levels. We recommended adding local exhaust ventilation to the small shredder sorter, requiring that employees in the disassembly and shredding areas wear respirators until cadmium exposures are reduced, and supplying outdoor air to the office ventilation system.
Highlights of this EvaluationThe Health Hazard Evaluation Program received a request from an electronics recycling company. The employer was concerned about exposure to metals and flame retardant chemical compounds occurring during the work process, and whether they were present in the workers’ bodies and work environment. We visited the company in March and August 2015.
What We Did ● We observed work practices and spoke informally
with employees about their work activities.
● We collected surface, hand wipe, and air samples for 30 metals and 24 flame retardants.
● We collected blood samples for cadmium, indium, lead, and some polybrominated diphenyl ether flame retardants.
● We collected urine samples for some organobromine and organophosphorous flame retardants.
● We used direct-reading instruments to measure the air for mercury and particulate matter.
What We Found ● We found 13 different flame retardants and 19
different metals in the air samples.
● We observed employees dry sweeping and eating and/or drinking in the processing areas.
● One employee in the batteries and disassembly area was overexposed to cadmium.
● We found some metals on surfaces outside of the processing area.
● Levels of some flame retardants from employee’s hands were higher after the work shift than before the work shift. Increases in the levels of flame retardants during the work shift, particularly those commonly used on electronics, show the potential for dermal exposure. The increases also highlight the importance of personal protective equipment and hand washing to reduce exposures.
● We found some flame retardants in employees’ blood and urine. We are not able to predict specific health effects from this because the science is not sufficient to do so at this time; however, we believe these flame retardants are potentially hazardous.

Page ii Health Hazard Evaluation Report 2015-0050-3308
● We also found metals in the employees’ blood and urine. These metals can damage the body over time.
● Three employees working in the shredder/sorter area had elevated blood lead levels. Lead can cause damage to the body over time.
What the Employer Can Do ● Hire a qualified engineer to evaluate the office ventilation to make sure that sufficient
air is introduced from the outside, and that air from the warehouse is not mixed with the office air.
● Include all processing employees in a lead exposure prevention program.
● Provide employees with a lead-removing product to wash their hands. Soap and water is not enough.
● Require employees in the disassembly and shredding areas to wear respirators until cadmium exposures are reduced below occupational exposure limits.
● Provide onsite laundering facilities or contract with a laundering service for all employees exposed to lead or cadmium.
What Employees Can Do ● Wash your hands with a lead-removing product before eating, drinking, smoking, or
leaving work.
● Do not dry sweep. Use wet cleaning methods or vacuuming instead.
● Use respirators in the disassembly and shredding areas until controls are put in place and exposures are reduced below applicable exposure limits.

Page iiiHealth Hazard Evaluation Report 2015-0050-3308
Abbreviationsα-HBCD α-hexabromocyclododecane β-HBCD β-hexabromocyclododecaneγ-HBCD γ-hexabromocyclododecaneµg/100 cm2 Micrograms per 100 square centimetersµg/g Micrograms per gramµg/m3 Micrograms per cubic meterµg/dL Micrograms per deciliterµg/L Micrograms per literµm MicrometerACGIH® American Conference of Governmental Industrial HygienistsBCEP bis(2-chloroethyl) phosphateBCIPP bis(l-chloro-2-propyl) phosphateBDCIPP bis(l,3-dichloro-2-propyl) phosphateBDE-17 2,2’,4’-tribromodiphenyl etherBDE-28 2,4,4’-tribromodiphenyl etherBDE-47 2,2’,4,4’-tetrabromodiphenyl etherBDE-66 2,3’,4,4’-tetrabromodiphenyl etherBDE-85 2,2’,3,4,4’-pentabromodiphenyl etherBDE-99 2,2’,4,4’,5-pentabromodiphenyl etherBDE-100 2,2’,4,4’,6-pentabromodiphenyl etherBDE-153 2,2’,4,4’,5,5’-hexabromodiphenyl etherBDE-154 2,2’,4,4’,5,6’-hexabromodiphenyl etherBDE-183 2,2’,3,4,4’,5’,6-heptabromodiphenyl etherBDE-206 2,2’,3,3’,4,4’,5,5’,6-nonabromodiphenyl etherBDE-209 decabromodiphenyl etherBEH-TEBP Bis(2-ethylhexyl) tetrabromophthalateBLL Blood lead levelsBTBPE 1,2-Bis(2,4,6-tribromophenoxy)ethane CAS Chemical abstract serviceCFR Code of Federal RegulationsDecaBDE Decabromodiphenyl ether technical mixture DBDPE Decabromodiphenyl ethane DoCP Di-o-cresylphosphateDpCP Di-p cresylphosphateDPHP Diphenyl phosphateEH-TBB 2-ethylhexyl 2,3,4,5-tetrabromobenzoate

Page iv Health Hazard Evaluation Report 2015-0050-3308
GM Geometric meanLCD Liquid crystal displayLOD Limit of detectionMDC Minimum detectable concentrationmg/m3 Milligrams per cubic metermm MillimetermL MilliliterMOUDI Micro-orifice, uniform deposit impactorng/m3 Nanograms per cubic meter ng/g Nanograms per gramng/sample Nanograms per sampleND Not detectednm NanometerNHANES National Health and Nutrition Examination SurveyNIOSH National Institute for Occupational Safety and HealthOctaBDE Octabromodiphenyl ether technical mixture OEL Occupational exposure limitOSHA Occupational Safety and Health AdministrationPCB Polychlorinated biphenylsp/cc Particles per cubic centimeterPBDE Polybrominated diphenyl ethersPEL Permissible exposure limitPentaBDE Pentabromodiphenyl ether technical mixture PP Persistent pesticidesPPE Personal protective equipmentREL Recommended exposure limitSTEL Short-term exposure limitTBBA 2,3,4,5-tetrabromobenzoic acidTBBPA Tetrabromobisphenol A TCP Tricresyl phosphate TCEP Tris(chloroethyl) phosphate TCIPP Tris(2-chloroisopropyl) phosphate TDCIPP Tris(1,3-dichloro-2-propyl) phosphate TPHP Tris(phenyl) phosphate TLV® Threshold limit valueTWA Time-weighted average

Page 1Health Hazard Evaluation Report 2015-0050-3308
IntroductionThe Health Hazard Evaluation Program received a request from an electronics recycling company. The employer was concerned about possible employee exposures to flame retardant chemicals (flame retardants) and metals while recycling electronics. We first visited the company in March 2015. We met with employer and employee representatives and toured the workplace to observe operations, work practices, and working conditions. We also collected hand wipe samples for flame retardants for a pilot study to determine the need for repeated hand wipes to assess exposure. We returned in August 2015 to collect air, hand wipe, surface wipe, blood, and urine samples for metals and flame retardants. We provided our preliminary findings and recommendations to the employer and the employee representatives in letters in March 2015, September 2015, October 2015, and July 2016.
BackgroundElectronic devices contain many hazardous components including chemical flame retardants and heavy metals. Flame retardants are found in plastic and resin housings and components, wires, cable insulation, and circuit boards. They are also added to manufactured materials, surface finishes, and coatings to inhibit, suppress, or delay combustion and impede the spread of fire. Many electronics also contain dusts from sources such as carpet padding or office furniture foam that may contain flame retardants.
Polybrominated diphenyl ethers (PBDEs), tetrabromobisphenol A (TBBPA), and organophosphates are examples of flame retardants used in electronics. Recent observational epidemiological research concluded that PBDEs are associated with liver, thyroid, reproductive/developmental, and neurological effects [Dallaire et al. 2009; Grant et al. 2013]. Although PBDEs are no longer used in the manufacture of U.S. electronics, they will remain in the electronic recycling stream for decades. TBBPA, tris(phenyl) phosphate (TPHP), and other brominated flame retardants and organophosphate flame retardants will continue to be used and be present in the electronics recycling stream. Organophosphate flame retardants have been associated with adverse reproductive/developmental and neurological effects in animals [van der Veen and de Boer 2012]. We are able to measure levels of some flame retardant chemicals in blood and urine, but there is scientific uncertainty regarding the relationship between these levels in the body and specific health outcomes. More detailed information about flame retardants can be found in Appendix C.
Previous health hazard evaluations [NIOSH 2009a, 2014a] found employee exposures during electronic recycling, such as:
● lead from batteries, printed circuit boards, power cords, and cathode ray tubes
● cadmium from batteries, pigments, plastic stabilizers, metal coatings, and cathode ray tubes phosphors; and mercury from fluorescent lights, batteries, medical and telecommunication equipment, and some flat-panel displays
Electronic recycling employees may also be exposed to indium, a metal used in flat-panel displays and touchscreens. Employee overexposures and potential take-home exposures to

Page 2 Health Hazard Evaluation Report 2015-0050-3308
metals in the electronics recycling industry have also been documented [Ceballos and Dong 2016; Ceballos et al. 2016; Newman et al. 2015; NIOSH 2009a, 2014a]. More detailed information about lead and other metals can be found in Appendix C.
Process DescriptionThe company began operations in an open warehouse in 2012. At the time of our evaluation, 15 employees worked at the company. Their primary activities included recycling batteries, metals, cardboard, and ballast and capacitors for fluorescent lights. Other activities included (1) sorting, dismantling, and shredding electronic equipment such as computers, printers, keyboards, central processing units, circuit boards, fax machines, cameras, medical equipment, and photocopiers; and (2) secure data destruction of electronic medical records. The company did not recycle cathode ray tube monitors or fluorescent light bulbs, but did collect and ship them to another recycling company. Items not generally considered electronics, such as children’s toys and artificial Christmas trees, were also recycled.
Shipping and Receiving
Shipping and receiving involved processing paperwork associated with incoming electronics and unloading trucks. There was an office near the loading docks, and coordination was done in the shipping area and in the main office area with office staff. At times, shipping and receiving personnel would work in other locations, such as the optical sorter.
Shredding and Sorting
Large boxes of electronic components were moved by forklift and placed next to the shredder conveyor. Employees manually removed electronic components from the boxes and placed them onto a conveyor belt that carried them to the shredder (Figure 1). The shredded material then passed through a magnetic separator. The magnetic components were expelled from the separator to a conveyor belt where two or three employees separated copper wiring from its metal housing. Nonmagnetic scrap was further separated as it traveled through an eddy current separator. This primary shredder had local exhaust ventilation that extended from the shredder entrance to the eddy current separator. A smaller shredder was located in the center of the warehouse next to an optical sorter. This shredder and the optical sorter did not have local exhaust ventilation. The small shredder and optical sorter were in the same vicinity as the larger shredder.

Page 3Health Hazard Evaluation Report 2015-0050-3308
Figure 1. Electronic shredding conveyor. Photo by NIOSH.
Three employees operated the optical sorter (Figure 2). Employees loaded the sorter with shredded material from both the small and large shredders, removed large boxes full of sorted material and cleaned underneath the optical sorter using a broom.
Figure 2. The discharge chute of the optical sorting machine. Photo by NIOSH.

Page 4 Health Hazard Evaluation Report 2015-0050-3308
Batteries and Disassembly
Two employees sorted expired batteries from their original packaging and removed batteries from electric toothbrushes. Five employees manually disassembled and separated computer components, such as circuit boards, hard drives, copper wiring, and other parts that contained valuable materials (Figure 3). Each employee worked at a station, selected a piece of electronic equipment, removed the screws, and separated the components. Two employees manually disassembled the electronic components and placed them on the conveyor belt or into a large box nearby. Another employee selected specific components for further disassembly. A fourth employee at the end of the conveyor separated the remaining components into one of four boxes located at the end of the conveyor. The fifth employee was primarily responsible for crushing and bailing the components using a bailing machine.
Figure 3. Three of the five disassembly employees manually disassembling printers. Photo by NIOSH.
Office Work
Office employees primarily worked at a desk using a computer; however, they occasionally entered the recycling area briefly.
MethodsWe obtained informed consent from all participants before beginning the evaluation. We asked all participants to fill out a questionnaire about their pertinent personal, medical, and work history such as length of employment, job tasks, current practices, use of personal protective equipment (PPE), and hygiene practices. Our objectives were to evaluate flame retardants and metal exposures.
Flame retardants:
1. Evaluate different wipe materials and number of wipes.
2. Characterize employee exposures to selected flame retardants.

Page 5Health Hazard Evaluation Report 2015-0050-3308
3. Compare the levels of selected flame retardants in employees’ blood and urine to levels in the general population.
4. Assess whether airborne and dermal exposures contribute to employees’ urine and blood levels of selected flame retardants.
Metals:
1. Characterize employee exposures to metals.
2. Assess whether employee exposures to airborne metals exceed applicable occupational exposure limits (OELs).
3. Assess whether employees’ blood lead and cadmium levels exceed biological exposure indices.
4. Evaluate the potential for take-home contamination from metals.
5. Evaluate the potential for generation of incidental nanoparticles, specifically indium.
Appendix A, Table A1 lists the flame retardants that we sampled for, where they are typically found, and when they are typically used, if used in electronics. Appendix A, Table A2 lists the three types of PBDE technical mixtures that we sampled for and their major congeners (a group of related chemicals). PBDE technical mixtures include pentabromodiphenyl ether (PentaBDE), octabromodiphenyl ether (OctaBDE), and decabromodiphenyl ether (DecaBDE). For some of our analyses, we divided the flame retardants into five categories on the basis of their usage in electronics.
Hand Wipe Samples for Flame RetardantsHand wipes have been used in previous studies in homes or offices to measure dermal exposures to flame retardants. Watkins et al. [2013] found that flame retardant levels in hand wipes were significantly correlated with the same flame retardant in office dust and on office surfaces. Similarly, Hoffman et al. [2014] and Stapleton et al. [2014] found that the levels of some flame retardants on hand wipes were significantly correlated with house dust concentrations collected by vacuum. Research has also shown that the level of some flame retardants on hands significantly correlated with flame retardant levels in blood [Watkins et al. 2011] and were a better predictor of serum levels than house dust collected by vacuum [Stapleton et al. 2011]. Other research found that the hand wipe levels of flame retardants were significantly correlated with their urinary metabolites [Hoffman et al. 2014, 2015].
We conducted a pilot study in March 2015 comparing gauze and twill wipes (two commercially available wiping materials) and assessing the value of repeat hand wipes to design hand wipe procedures for flame retardants. See Appendix B for more details.
August 2015, we collected preshift and postshift hand wipe samples on 3 days for all 15 employees (one employee was not present for hand wipes on Day 3). We collected the preshift samples as soon as the employees arrived in the office on consecutive days at the beginning of the week. No participants worked on the Saturday or Sunday prior to the evaluation. We collected the postshift samples before the employees washed their hands at

Page 6 Health Hazard Evaluation Report 2015-0050-3308
the end of the work shift. We used gauze wipes and 99% isopropyl alcohol as the wetting agent. Each employee used only one set of hand wipes (for the palms of the hands and backs of the hands) because our pilot study showed sequential wiping dried the skin too much. The hand wipe procedures that we followed are outlined in Appendix B.
A contract lab analyzed all hand wipes flame retardants by ultra-performance liquid chromatography atmospheric pressure photoionization tandem mass spectrometry using methods previously described by LaGuardia et al. [2015]. All wipes were spiked with surrogate standards prior to extraction to determine the percent recovery for each type of flame retardant. The wipe sample results were surrogate corrected for percent recovery.
The flame retardants we analyzed are listed below. We used the abbreviation standard for flame retardants proposed by Bergman et al. [2012]:
● α-hexabromocyclododecane (α-HBCD) ● β-hexabromocyclododecane (β-HBCD) ● γ-hexabromocyclododecane (γ-HBCD) ● 2,4,4’-tribromodiphenyl ether (BDE-28) ● 2,2’,4,4’-tetrabromodiphenyl ether (BDE-47) ● 2,3’,4,4’-tetrabromodiphenyl ether (BDE-66) ● 2,2’,3,4,4’-pentabromodiphenyl ether (BDE-85) ● 2,2’,4,4’,5-pentabromodiphenyl ether (BDE-99) ● 2,2’,4,4’,6-pentabromodiphenyl ether (BDE-100) ● 2,2’,4,4’,5,5’-hexabromodiphenyl ether (BDE-153) ● 2,2’,4,4’,5,6’-hexabromodiphenyl ether (BDE-154) ● 2,2’,3,4,4’,5’,6-heptabromodiphenyl ether (BDE-183) ● 2,2’,3,3’,4,4’,5,5’,6-nonabromodiphenyl ether (BDE-206) ● decabromodiphenyl ether (BDE-209) ● 1,2-Bis(2,4,6-tribromophenoxy)ethane (BTBPE) ● decabromodiphenyl ethane (DBDPE) ● 2-ethylhexyl 2,3,4,5-tetrabromobenzoate (EH-TBB) ● tetrabromobisphenol A (TBBPA) ● Bis(2-ethylhexyl) tetrabromophthalate (BEH-TEBP) ● tricresyl phosphate (TCP) ● Tris(chloroethyl) phosphate (TCEP) ● Tris(2-chloroisopropyl) phosphate (TCIPP) ● Tris(1,3-dichloro-2-propyl) phosphate (TDCIPP) ● Tris(phenyl) phosphate (TPHP)
Air Samples for Flame Retardants We collected full-shift personal air samples over 3 consecutive days on all 15 employees (one employee was not present for air samples on the last day). We do not report the results

Page 7Health Hazard Evaluation Report 2015-0050-3308
for the first day of air samples because a mistake was made during the collection of these samples. We collected the personal air samples for flame retardants on an Institute of Medicine sampler with a glass fiber filter at a nominal flow rate of 2 liters per minute. The sampler collects the inhalable fraction of particulates. A contract lab analyzed the samples for the same flame retardants that were analyzed from the hand wipes using a method developed by LaGuardia et al. [2015]. Flame retardants can be found as particulates or in a vapor phase, but we analyzed the flame retardants as particulates. Previous research has shown that more than 99% of organophosphate flame retardants in indoor air were found as particulates, and that TCEP and TCIPP were strongly associated with airborne particulates or adsorbed onto the filters due to polar interactions [Carlsson et al. 1997]. In addition, BDE-209 and the higher congeners of brominated flame retardants, such as BDE-99 and BDE-153, are predominately particulates [Allen et al. 2007]. BTBPE and TBBPA have also been found to be primarily in the particle-associated phase rather than the semivolatile phase [Sjödin et al. 2001].
Blood Samples for Flame Retardants and Lead and CadmiumWe collected approximately 30 milliliters (mL) of blood from 12 of the 15 employees at the end of their last shift of the work week. A trained technician drew venous blood from each participant into two serum separating tubes and one whole blood tube. Technicians followed universal precautions for working with blood and blood products specified by the Centers for Disease Control and Prevention [Siegel et al. 2007] and the Occupational Safety and Health Administration (OSHA) [OSHA 2003]. The tube of whole blood was sent to a commercial laboratory to be analyzed for blood lead, indium, and cadmium levels. We sent one tube of serum to the National Center for Environmental Health laboratory for quantification of PBDEs, polychlorinated biphenyls (PCBs), persistent pesticides (PPs), and cholesterol and triglycerides. PBDEs included BDE-17, BDE-47, BDE-85, BDE-99, BDE-100, BDE-128, BDE-153, BDE-154, BDE-183, and BDE-209. Cholesterol and triglycerides were measured to adjust brominated flame retardant, PCB, and PP levels for body fat. We sampled for PCBs and PPs to address the possibility of dietary effects on the levels of the PBDEs. If the participant gave consent, we stored a second serum tube for future research not related to the current health hazard evaluation.
Urine Samples for Flame RetardantsWe collected preshift and postshift urine samples on each day that air and hand wipe sampling for flame retardants was performed for all 15 employees (one employee was not present for urine samples on the last day). Each urine sample was collected in a sterile 250-mL plastic cup. We measured the specific gravity of each sample, shook it, then transferred 30 mL to two separate containers. One container was sent to the National Center for Environmental Health laboratory for analysis of the following flame retardant metabolites:
● diphenyl phosphate (DPHP) – a metabolite of TPHP ● bis(l,3-dichloro-2-propyl) phosphate (BDCIPP) – a metabolite of TDCIPP ● bis(l-chloro-2-propyl) phosphate (BCIPP) – a metabolite of TCIPP ● bis(2-chloroethyl) phosphate (BCEP) – a metabolite of TCEP

Page 8 Health Hazard Evaluation Report 2015-0050-3308
● di-p cresylphosphate (DpCP) – a metabolite of TCP ● di-o-cresylphosphate (DoCP) – a metabolite of TCP ● 2,3,4,5-tetrabromobenzoic acid (TBBA) – a metabolite of EH-TBB
These analyses were conducted using the approach reported by Jayatilaka et al. [2017]. We used the reference range values in urine for the flame retardant metabolites for the U.S. population ages 20–59 as described in Ospina et al. [2018]. The second container was stored for future research if the employee gave us consent.
Surface and Hand Wipe Samples for MetalsWe collected and analyzed surface and hand wipe samples for metals according to National Institute for Occupational Safety and Health (NIOSH) Method 9102, including indium and neodymium [NIOSH 2018]. For surface samples, we used premoistened SKC Inc. Ghostwipe® towelettes to wipe surfaces outside of the processing areas of the plant. We used a 10 centimeter by 10 centimeter square disposable template to demarcate the surface sampling area at each sample location.
We evaluated the potential for take-home exposure to metals by collecting a postshift hand wipe sample from all 15 employees on 1 day. We used the same method previously described in Appendix B for flame retardants, except that we used the premoistened Ghostwipe towelettes instead of alcohol soaked wipes. We collected these hand wipe samples after the employee washed his or her hands at the end of the work shift. These samples were collected on a Friday prior to the start of the flame retardant portion of the study.
Air Samples for MetalsWe collected personal and area air samples for metals and minerals, including indium and neodymium on 37 millimeter (mm) cassettes and analyzed them according to NIOSH Method 7303 [NIOSH 2018], with modification. The modification included wiping the interior walls of the filter cassette with the back side of the sample filter to collect particles on the inside of the cassette walls, as recommended by NIOSH [2016]. We collected these samples on the same days as the flame retardant samples.
We collected and analyzed full-shift area air samples for hexavalent chromium according to NIOSH Method 7605 [NIOSH 2018]. We collected these samples for 3 consecutive days in the area where employees loaded the conveyor and where the magnetic separator was located.
Air Samples for Particulate and Mercury VaporWe used direct-reading instruments to measure airborne particulate in real time during the shredding operations of liquid crystal display (LCD) televisions, frames, boards, and other computer equipment. We used a TSI® model 3007 handheld condensation particle counter to count particles in the air, a TSI model 3330 optical particle sizer (OPS 3330) to measure the number and mass of particles, and a TSI DustTrak DRX™ Aerosol Monitor model 8533 to simultaneously measure mass and size fraction of airborne particles. We placed the instruments at the outfeed of the sorter conveyor in the magnetic metals sorter area, about

Page 9Health Hazard Evaluation Report 2015-0050-3308
3 feet above the floor. We also collected particulate samples in the conference room for comparison to particle levels in the processing areas. Particulate samples were taken when the shredder was running, about 4.75 hours.
We used a Jerome® J505 atomic fluorescence mercury vapor analyzer to measure mercury vapor concentrations in the air in several storage locations and in the shredding process area. We took each sample for approximately 1 minute.
Detailed information about direct reading instrument operation is provided in Appendix D.
Air Samples for NanomaterialsWe collected area air samples using a MSP® M131 Micro-Orifice, Uniform Deposit Impactor (MOUDI) high flow impactor. The MOUDI M131 is a six-stage cascade impactor with aerosol cut point diameters of 10 micrometers (µm), 2.5 µm, 1.4 µm, 0.77 µm, 0.44 µm, and 0.25 µm. The aerosol cut point diameter is the size where 50% of the particles of that diameter are collected onto a filter, and the remaining particles pass through the impactor to the next smaller size-range stage and collection filter. The smallest cut point, 0.25 µm, is most similar to the engineered nanomaterial particle size range, for example the indium nanoparticles commonly found in LCD screens. We used the 2.5-µm cut point for respirable aerosols and the 10-µm cut point for inhalable-size aerosols. If inhaled, respirable particles can reach the deep (alveolar) region of the lung.
Using the MOUDI we collected six air samples in the magnetic metals sorting area and six air samples inside the conference room for comparison and to determine if aerosol particles migrated from the processing area to the office area. We collected these samples on 75 mm diameter, 1.0 µm pore size, mixed cellulose ester membrane filters that were coated with silicone to help the particles adhere to the filter surface. The MOUDI operated at a flow rate of 100 liters per minute. We analyzed our air samples for indium, beryllium, cadmium, lead, manganese, neodymium, nickel, silver, tin, and titanium according to NIOSH Method 7303 [NIOSH 2018].
Statistical AnalysisWe used the American Industrial Hygiene Association IHstats V229 and SAS version 9.3 software for data analysis. Flame retardant wipe and air sample data were corrected for recoveries reported by the laboratory on three replicate spikes (100 nanograms per sample [ng/sample]) on blank wipes. For sample results that were reported as “not detected” we used the laboratory reporting limit divided by the square root of 2 [Hornung and Reed 1990] as the estimate. We examined the distributions of the air, hand wipe, and urine data. Some were normally distributed, some were log normally distributed, and some were neither; therefore, we reported medians, geometric means (GM), and ranges. We did not calculate GMs unless 70% or more of the samples had detectable results. We did not report medians or GMs if the sample size was five or less. Comparisons of medians or GMs were based simply on observation, not statistical testing. The reporting limits were 16 ng per sample for TCEP, TCIPP, and TDCIPP, 6.3 ng per sample of HBCD, and 1 ng per sample for the remainder of the air samples. The reporting limits for hand wipe samples were 63 ng per sample for HBCD, 156 ng per sample for TCEP, TCIPP, and TDCIPP, and

Page 10 Health Hazard Evaluation Report 2015-0050-3308
10 ng per sample for the remainder of the wipe samples. We assessed the efficiency of the repeat hand wipes by adding the sample results for each flame retardant from the three consecutive hand wipes, then calculated the percentage that was removed by each wipe. We compared the urine and serum levels of flame retardant biomarkers with the general population using the National Health and Nutrition Examination Survey (NHANES) data [ACGIH 2018; NIOSH 2014a; Ospina et al. 2018; Sjodin et al. 2008]. We reported GMs for the study participants and the general population using relevant age ranges.
ResultsParticipant CharacteristicsAll 15 employees participated in this evaluation; three were female. The average age was 37 (range: 20–52) and the median length of time in this company was 15 months (range: 1 month to 88 months). Participants usually worked a minimum of 40 hours per week, although on occasion they worked up to 45 hours. Duties involved disassembly (five participants), shredding (three), batteries (four), sorting (six), shipping/receiving (one), and office work (two). Some participants rotated to other duties as needed. Twelve participants reported wearing their work clothing home, and 13 reported wearing their work shoes or boots home. Seven of the 13 participants who worked in the processing area (all areas in the warehouse) reported always wearing gloves at work, three reported wearing them most of the time, two reported sometimes, and one employee did not report on the frequency of glove use. The company provided and required the use of gloves. All reported reusing their gloves. Cloth gloves were most commonly worn (six participants), followed by nitrile and cut-resistant gloves (three each), and leather gloves (one). Eight participants reported washing their hands four to five times per day at work, with the remainder washing their hands less frequently. One participant reported sometimes washing hands before eating at work, while 14 reported always washing their hands before eating at work. Twelve participants reported always washing their hands before leaving work, while three reported they sometimes washed their hands before leaving work. Six employees reported that they currently smoked.
Hand Wipe Sampling for Flame RetardantsPilot Hand Wipe Study (March 2015)
We detected 19 of the 24 different flame retardants on each of the gauze and twill hand wipe samples. Table 1 shows that the median and range of the percent of total flame retardants removed by the sequential hand wipes were similar for the gauze and twill hand wipe materials. For both wipe materials, we found that the first set of two hand wipes removed the highest median percentage of total flame retardants. For individual flame retardants, we found that the percent removed by each of the three sequential wipe sets ranged from less than 5% to 98%. It is also likely that flame retardants remained on the hands even after the third sequential wipe. Therefore, the medians in Table 1 should be considered overestimates of the percent recovered. The alcohol was drying, and after three sets of wipes, the employees’ hands were white and irritated. A more detailed description and analysis of this pilot study will be provided in a separate manuscript.

Page 11Health Hazard Evaluation Report 2015-0050-3308
Table 1. Median and range of the percent of total flame retardants removed by gauze or twill hand wipes
Gauze wipes (n = 86) Median of percent (range)
Twill wipes (n = 74) Median of percent (range)
Percent removed by first wipe set 45 (4–98) 50 (1–89)Percent removed by second wipe set 26 (1–55) 26 (5–93)
Percent removed by third wipe set* 23 (0–92) 23 (0–60)*Because of laboratory analytical error we were unable to obtain results for 7 of the 19 detected flame retardants on the third sequential wipes for 4 of the participants using gauze and 4 using twill. In addition, one of the twill participants was missing all of the measurements on the third wipe.
Hand Wipe Sampling (August 2015)
Table 2 summarizes the results of the preshift and postshift hand wipe sampling for 22 of the 24 flame retardants taken on 3 subsequent days. We found no detectable (BDE-183) or very few detectable preshift or postshift hand wipes for OctaBDE flame retardant congeners (BDE-154, BDE-153). OctaBDE was not used in electronics after 2004. In contrast, we found that flame retardants commonly used in electronics (TPHP, TCP, DBDPE, and TBBPA) were detected in all of the postshift handwipe samples for processing employees. Additionally, postshift median levels of these flame retardants were higher than preshift levels. BTBPE, which is also commonly used in electronics, was not detected in all of the post shift samples. We also found that the median levels of BDE-209 was higher in the postshift handwipes than the preshift handwipes. We found these higher levels in the postshift handwipes of flame retardants commonly used in electronics and for BDE-209 in all four job task groups (shipping and receiving, sorting and shredding, batteries and disassembly, and office). Rarely used in electronics, PentaBDE (as represented by the congeners BDE-99, BDE-47, BDE-100, and BDE-85), was detected in most of the samples. The levels ranged from ND to 400 ng/sample. We did not report the results for BDE-66 and BDE-28, which are minor congeners for PentaBDE. TDICPP, which is also rarely used in electronics, had a median level of 5,590 ng/sample. The handwipe results for the flame retardants that are less commonly used in electronics now and in the past were varied. There was not much of a difference for the postshift medians for EH-TBB, BEH-TEBP, and TCEP and the preshift medians. TCIPP had a higher median in the post shift handwipe (965 ng/sample) than the preshift handwipe (965 ng/sample) for sorting and shredding.

Page 12 Health Hazard Evaluation Report 2015-0050-3308
Tabl
e 2.
Pre
shift
and
pos
tshi
ft le
vels
of 2
2 of
the
24 fl
ame
reta
rdan
ts in
han
d w
ipe
sam
ples
, by
job
task
, in
ng/s
ampl
eFl
ame
re
tard
ant
Ship
ping
and
rece
ivin
g (n
= 3
) %
Det
ecte
d ra
nge
Sorti
ng a
nd s
hred
ding
(n =
17)
%
Det
ecte
d m
edia
n ra
nge
Batte
ries
and
disa
ssem
bly
(n =
18)
%
Det
ecte
d m
edia
n ra
nge
Offi
ce (n
= 6
) %
Det
ecte
d m
edia
n ra
nge
Pres
hift
Post
shift
Pres
hift
Post
shift
Pres
hift
Post
shift
Pres
hift
Post
shift
Oct
aBD
E (c
omm
only
use
d in
ele
ctro
nics
unt
il ar
ound
200
4)BD
E-18
3 LO
D =
10
0%0%
0%0%
0%0%
0%0%
BDE-
154*
† LO
D =
10
0%0%
13%
N
D
ND
–24
13%
N
D
ND
–58
0%11
%
ND
N
D–3
4
17%
N
D
ND
–27
17%
N
D
ND
–27
BDE-
153*
LO
D =
10
0%67
%
ND
–45
6%
ND
N
D–1
5
35%
N
D
ND
–45
6%
ND
N
D–1
2
17%
N
D
ND
–38
17%
N
D
ND
–10
17%
N
D
ND
–11
Oct
aBD
E an
d D
ecaB
DE
(com
mon
ly u
sed
in e
lect
roni
cs u
ntil
arou
nd 2
013)
BDE-
209
LOD
= 1
010
0%
180–
570
100%
1,
200–
10,0
0010
0%
332
93–2
,000
100%
1,
900
470–
11,0
00
100%
35
8 83
–2,3
00
100%
1,
300
180–
7,80
0
100%
19
1 30
–14,
000
100%
29
30
81–2
2,00
0BD
E-20
6 LO
D =
10
33%
N
D–2
110
0%
72–4
3018
%
ND
N
D–1
50
71%
56
.7
ND
–440
22%
N
D
ND
–93
50%
36
.2
ND
–810
17%
N
D
ND
–950
50%
13
2 N
D–5
40C
omm
only
use
d in
ele
ctro
nics
now
and
in th
e pa
st
TPH
P LO
D =
10
100%
13
0–26
010
0%
1,40
0–4,
400
100%
34
1 11
0–80
0
100%
3,
100
500–
11,0
00
94%
17
0 N
D–8
00
100%
1,
000
59–3
,600
100%
10
5 77
–300
83%
48
7 N
D–6
40TC
P LO
D =
10
100%
63
–140
100%
81
0–1,
900
100%
18
7 50
–430
100%
1,
500
230–
6,00
0
89%
95
.3
ND
–390
100%
27
0 32
–4,4
00
83%
39
.3
ND
–77
67%
17
4 N
D–3
20BT
BPE
LOD
= 1
067
%
ND
–110
100%
27
0–4,
300
71%
23
.1
ND
–110
100%
31
9 46
–1,3
00
33%
N
D
ND
–98
89%
62
.8
ND
–530
0%50
%
25.8
N
D–8
4D
BDPE
LO
D =
10
100%
41
–110
100%
63
0–4,
600
100%
13
7 35
–1,6
00
100%
1,
500
96–7
,900
100%
57
.9
20–5
00
100%
31
0 60
–3,1
00
67%
21
.5
ND
–38
100%
93
.6
28–7
30TB
BPA
LOD
= 1
010
0%
96–2
3010
0%
590–
2,20
094
%
156
ND
–610
100%
1,
300
77–3
,300
94%
89
.1
ND
–330
100%
36
5 25
–3,4
00
100%
40
.4
31–2
00
83%
29
9 N
D–1
,100

Page 13Health Hazard Evaluation Report 2015-0050-3308
Tabl
e 2
Con
tinue
d. P
resh
ift a
nd p
osts
hift
leve
ls o
f flam
e re
tard
ants
in h
and
wip
e sa
mpl
es, b
y jo
b ta
sk, i
n ng
/sam
ple
Flam
e
reta
rdan
tSh
ippi
ng a
nd re
ceiv
ing
(n =
3)
% D
etec
ted
rang
e
Sorti
ng a
nd s
hred
ding
(n =
17)
%
Det
ecte
d m
edia
n ra
nge
Batte
ries
and
disa
ssem
bly
(n =
18)
%
Det
ecte
d m
edia
n ra
nge
Offi
ce (n
= 6
) %
Det
ecte
d m
edia
n ra
nge
Pres
hift
Post
shift
Pres
hift
Post
shift
Pres
hift
Post
shift
Pres
hift
Post
shift
Less
com
mon
ly u
sed
in e
lect
roni
cs n
ow a
nd in
the
past
EH
-TBB
LO
D =
10
100%
81
–130
100%
91
–140
100%
72
.6
17–4
70
94%
42
.7
ND
–170
100%
52
.0
20–1
90
78%
32
.8
ND
–220
100%
47
.6
35–1
00
100%
37
.0
22–1
00BE
H-T
EBP
LO
D =
10
100%
86
–200
100%
21
0–97
010
0%
79.2
16
–1,7
00
100%
10
7 45
–3,6
00
100%
70
.0
16–1
,100
94%
99
.0
ND
–5,9
00
100%
93
.5
15–1
40
100%
11
8 20
–410
TCEP
LO
D =
156
0%33
%
ND
–108
0%24
%
ND
N
D–3
10
0%6%
N
D
ND
–250
17%
N
D
ND
–190
0%
TCIP
P LO
D =
156
100%
37
0–47
010
0%
500–
920
53%
18
1 N
D–1
,500
88%
96
5 N
D–4
,600
61%
17
9 N
D–8
50
67%
29
5 N
D–5
60
100%
60
0 32
0–1,
300
83%
19
6 N
D–4
50H
BCD
(α,β
,γ)
LOD
= 6
30%
0%0%
0%0%
0%0%
0%
Rar
ely
used
in e
lect
roni
cs§
Pent
aBD
EBD
E-99
LO
D =
10
100%
34
–65
100%
17
0–37
010
0%
44.1
19
–340
100%
95
.0
26–1
60
94%
52
N
D–2
30
94%
54
.2
ND
–370
100%
48
.2
19–2
30
100%
50
.5
28–1
10BD
E-47
LO
D =
10
100%
26
–55
100%
13
0–40
088
%
30.0
N
D–2
30
88%
59
.5
ND
–120
83%
40
.0
ND
–190
94%
27
.5
ND
–170
67%
45
.0
ND
–230
100%
27
.8
12–1
30BD
E-10
0 LO
D =
10
33%
N
D–1
410
0%
27–9
718
%
ND
N
D–5
3
47%
N
D
ND
–28
56%
12
.1
ND
–33
28%
N
D
ND
–60
50%
13
.8
ND
–30
50%
7.
19
ND
–23
BDE-
85
LOD
= 1
00%
33%
N
D–1
76%
N
D
ND
–25
0%0%
0%0%
0%
TDC
IPP
LOD
= 1
5610
0%
1,00
0–1,
500
100%
1,
100–
1,50
094
%
577
ND
–2,4
00
100%
1,
000
170–
5,30
0
94%
45
5 N
D–3
,600
100%
72
2 21
0–2,
900
100%
68
3 38
0–1,
500
100%
5,
590
180–
19,0
00LO
D =
Lim
it of
det
ectio
n*A
lso
pres
ent i
n Pe
ntaB
DE
in s
mal
l am
ount
s †T
he n
for B
DE-
154
is 2
pre
shift
and
3 p
ost s
hift
for s
hipp
ing
and
rece
ivin
g, 1
6 pr
eshi
ft an
d 15
pos
t shi
ft fo
r sor
ting
and
shre
ddin
g, 1
7 pr
eshi
ft an
d 18
pos
t shi
ft fo
r ba
tterie
s an
d di
sass
embl
y, a
nd 6
for o
ffice
.§P
rimar
ily u
sed
in p
olyu
reth
ane
foam
and
com
mon
ly p
rese
nt in
dus
t

Page 14 Health Hazard Evaluation Report 2015-0050-3308
Air Samples for Flame RetardantsResults of personal air sampling for 22 of the 24 flame retardants are listed in Table 3, in nanograms per cubic meter of air (ng/m3). PBDEs are listed by technical mixture (i.e., OctaBDE) and by decreasing concentration of each congener within that mixture. BDE-209 had the highest GM concentration and the largest range of concentrations across the 15 participants. DecaBDE is composed of 97%–98% BDE-209, while OctaBDE is composed of 1%–50% BDE-209 [Alaee et al. 2003; La Guardia et al. 2006]. BDE-183 is present in concentrations ranging from 13%–43% in OctaBDE, and considered a marker for OctaBDE because it is not present in either PentaBDE or DecaBDE. BDE-183 and BDE-154 were not detected in any air samples. This indicates that the likely source of the BDE-209 was DecaBDE (see Appendix A, Table A2). The next highest GM concentration was TPHP followed by TCP then DBDPE. We did not find BDE-85, α-HBCD, β-HBCD, γ-HBCD, TCEP, TCIPP, or TDCIPP in any of the personal air samples.
Results of personal air sampling for flame retardants, stratified by job tasks performed during sampling, are in Table 4. We detected the flame retardant congeners in about 80% of the air samples for those flame retardants commonly used in electronics until 2013 as well as those used commonly in electronics now and in the past, regardless of job task. Some of the flame retardants less commonly used in electronics (EH-TBB and BEH-TEBP) and some not generally used in electronics, but primarily used in polyurethane foam (BDE-99, BDE-47, and BDE-100) were also found in all or nearly all of the air samples, but at a median concentration of ≤ 11 ng/m3 overall. The highest airborne concentrations of BDE-209 occurred in the shipping and receiving department and the sorting and shredding department. In general, the highest concentrations of flame retardants occurred in the sorting and shredding job tasks. The lowest concentrations were in the office.

Page 15Health Hazard Evaluation Report 2015-0050-3308
Table 3. Full-shift personal air sampling results for 15 participants over 2 days (n = 29), in ng/m3 Flame retardant, MDC Median Geometric mean (GM) (range) # (%) detectedOctaBDE (commonly used in electronics until around 2004)
BDE-183, MDC = 0.9 ND ND 0 (0)BDE-154†, MDC = 0.9 ND ND 0 (0)BDE-153†, MDC = 0.9 ND (ND–14) 5 (17)
OctaBDE and DecaBDE (commonly used in electronics until around 2013)BDE-209, MDC = 0.9 142 189 (29–3,600) 29 (100)BDE-206, MDC = 0.9 4.03 4.65 (ND–240) 23 (79)
Commonly used in electronics now and in the pastTPHP, MDC = 0.9 148 117 (ND–1,800) 28 (97)TCP, MDC = 0.9 110 110 (ND–1,900) 28 (97)DBDPE, MDC = 0.9 54.7 62.1 (2.8–630) 29 (100)BTBPE, MDC = 0.9 10.2 (ND–140) 20 (69)TBBPA, MDC = 0.9 ND (ND–86) 5 (17)Less commonly used in electronics now and in the past EH-TBB, MDC = 0.9 5.79 6.49 (2.0–110) 29 (100)BEH-TEBP, MDC = 0.9 4.92 5.60 (ND–40) 28 (97)TCEP, MDC = 14 ND ND 0 (0)TCIPP, MDC = 14 ND ND 0 (0)HBCD (α,β,γ), MDC = 6 ND ND 0 (0)Rarely used in electronics‡PentaBDE
BDE-99, MDC = 0.9 10.6 11.7 (6.0–63) 29 (100)BDE-47, MDC = 0.9 3.84 4.45 (ND–44) 26 (90)BDE-100, MDC = 0.9 3.37 3.34 (1.5–9.1) 29 (100)BDE-85, MDC = 0.9 ND ND 0 (0)
TDCIPP, MDC = 14 ND ND 0 (0)MDC = minimum detectable concentrationND = not detected†Also present in PentaBDE in small amounts ‡Primarily used in polyurethane foam and commonly present in dust

Page 16 Health Hazard Evaluation Report 2015-0050-3308
Table 4. Concentrations of flame retardants in full-shift personal air samples, by job task, in ng/m3
Flame retardant, MDC
Shipping and receiving (n = 2*)
% Detected (range)
Sorting and shredding (n = 12)
% Detected Median (range)
Batteries and disassembly (n = 11)
% Detected Median (range)
Office (n = 4*) % Detected
(range)
OctaBDE (commonly used in electronics until around 2004)BDE-183 MDC = 0.9
0% 0% 0% 0%
BDE-154† MDC = 0.9
0% 0% 0% 0%
BDE-153† MDC = 0.9
50% (ND–2.7)
25% ND (ND–14)
9% ND (ND–3.6)
0%
OctaBDE and DecaBDE (commonly used in electronics until around 2013)BDE-209 MDC = 0.9
100% (290–2,400)
100% 329 (29–3,600)
100% 114 (43–500)
100% (43–240)
BDE-206 MDC = 0.9
100% (11–67)
92% 7.68 (ND–240)
64% 1.65 (ND–16)
75% (ND–5.5)
Commonly used in electronics now and in the pastTPHP MDC = 0.9
100% (48–290)
100% 259 (68–1,800)
100% 137 (2.1–710)
75% (ND–50)
TCP MDC = 0.9
100% (120–150)
100% 208 (70–1,900)
91% 85.9 (ND–650)
100% (29–38)
DBDPE MDC = 0.9
100% (15–170)
100% 145 (24–540)
100% 42.9 (2.8–630)
100% (14–80)
BTBPE MDC = 0.9
50% (ND–35)
83% 25.2 (ND–140)
82% 9.93 (ND–56)
0%
TBBPA MDC = 0.9
0% 8% ND (ND–86)
18% ND (ND–10)
50% (ND–10)
Less commonly used in electronics now and in the pastEH-TBB MDC = 0.9
100% (9.2–30)
100% 6.79 (2.0–110)
100% 4.52 (2.0–30)
100% (3.1–8.5)
BEH-TEBP MDC = 0.9
100% (6.7–22)
100% 7.44 (1.5–40)
91% 3.35 (ND–13)
100% (1.6–4.9)
TCEP MDC = 14
0% 0% 0% 0%
TCIPP MDC = 14
0% 0% 0% 0%
HBCD (α,β,γ) MDC = 6
0% 0% 0% 0%
Rarely used in electronics‡PentaBDE
BDE-99 MDC = 0.9
100% (23–37)
100% 11.9 (6.4–63)
100% 8.39 (6.0–29)
100% (8.1–11)
BDE-47 MDC = 0.9
100% (14–15)
92% 5.84 (ND–44)
91% 3.28 (ND–17)
75% (ND–3.0)
BDE-100 MDC = 0.9
100% (7.2–9.1)
100% 3.36 (1.9–6.9)
100% 2.87 (1.5–5.4)
100% (2.5–3.6)
BDE-85 MDC = 0.9
0% 0% 0% 0%
TDCIPP MDC = 14
0% 0% 0% 0%
Note: These MDCs were calculated using an average volume of 1,043 liters.*Median not calculated if n = 5 or less†Also present in PentaBDE in small amounts ‡Primarily used in polyurethane foam and commonly present in dust

Page 17Health Hazard Evaluation Report 2015-0050-3308
Blood Samples for Flame RetardantsOf the fifteen employees, 12 had blood drawn for metals and PBDEs. Table 5 shows the serum PBDE concentrations in our participants for 10 different polybrominated flame retardants. The table also shows the serum PBDE concentrations found in the NHANES, which is a representative sample of the general population. The highest median and GM serum PBDE concentrations in our participants were for BDE-47, BDE-153, and BDE-209. In addition all 12 of the participants had BDE-153, BDE-47, and BDE-100 detected in their blood serum. The GM concentration of BDE-209 was 8.1 nanograms per gram (ng/g) lipid weight in our participants, which was above the LOD of 5.8 ng/g lipid weight in the NHANES. One of the office participants had serum BDE-209 concentrations less than the LOD of 4.8 ng/g lipid weight; the other did not have blood tests.
Table 5. PBDE concentrations in serum of electronics recycling employees and in the National Health and Nutrition Examination Survey, in ng/g lipid weight
Electronics recycling company participants (n = 12)
National Health and Nutrition Examination Survey*†
Median GM‡ Max Median GM 95th percentile
OctaBDE (commonly used in electronics until around 2004)BDE-183 0.542 (-) 1.40 Not
reportedND (< 1.7) ND (< 1.7)
BDE-154§ 0.533 (-) 1.43 Not reported
ND (< 0.8) 4.20
BDE-153§ 8.19 8.39 32.4 4.40 5.41 73.3OctaBDE and DecaBDE (commonly used in electronics until around 2013)
BDE-209¶ 8.36 8.10 14.8 Pooled sample; no mean calculated due to high proportion of ND (< 5.8)
PentaBDE (rarely used in electronics)**BDE-99 3.84 3.08 13.8 Not
reportedND (< 5.0) 41.6
BDE-47 16.4 13.5 49.1 18.0 19.5 163.0BDE-100 4.20 3.31 9.81 3.30 3.77 36.6BDE-85 0.465 (-) 1.44 Not
reportedND (< 2.4) 4.10
*Age 20 and older†Samples taken 2003 and 2004‡GM not calculated if n = 5 or less§Also present in PentaBDE in small amounts.¶Data from 2007–2008 NHANES**Primarily used in polyurethane foam and commonly present in dust

Page 18 Health Hazard Evaluation Report 2015-0050-3308
We sampled for PCBs and PPs to address the possibility of dietary effects on the levels of the PBDEs. Appendix A, Tables A5 and A6 show the concentrations of serum PCBs and PPs in our participants and the concentrations found in NHANES. With the exception of PCB-28, all were lower in our participants than in NHANES. The higher PCB-28 concentration may reflect occupational exposure to PCBs, but this was beyond the scope of this evaluation.
Urine Samples for Flame RetardantsThe results of urine testing for metabolites of certain flame retardants divided by departments are shown in Table 6 (uncorrected concentrations in micrograms per liter [µg/L]) and Table 7 (creatinine corrected concentrations in micrograms per gram [µg/g] creatinine). Creatinine correction is done to adjust for individual variation in urine concentration. Sorting and shredding participants had close to double the median concentration of DPHP, the metabolite of TPHP, in their urine postshift compared to preshift. This was true when looking at creatinine corrected or uncorrected results. Concentrations of DPHP were similar preshift and postshift among shipping and receiving, and among batteries and disassembly participants. They declined across the shift in office participants. We compare the results for the third day post shift urinary metabolite measurements for the electronics recycling company employees to the general population in Appendix A, Table A7 (uncorrected concentrations in µg/L) and Table A8 (creatinine corrected concentrations in µg/g creatinine).
DpCP and DoCP, metabolites of TCP, were undetectable in most participants. We detected no TBBA, the metabolite of EH-TBB, in the urine of any participants. Median concentrations of BCEP, the metabolite of TCEP, increased slightly across the shift among sorting and shredding, and batteries and disassembly participants. BDCIPP, the metabolite of TDCIPP, was detected in all urine samples, and median concentrations decreased slightly across shift for all categories of participants.

Page 19Health Hazard Evaluation Report 2015-0050-3308
Tabl
e 6.
Unc
orre
cted
con
cent
ratio
ns o
f flam
e re
tard
ant m
etab
olite
s in
urin
e sa
mpl
es, b
y jo
b ta
sk, i
n µg
/LM
etab
olite
(p
aren
t flam
e re
tard
ant)
Ship
ping
and
rece
ivin
g (n
= 3
*)
% D
etec
ted
rang
e
Sorti
ng a
nd s
hred
ding
(n
= 1
7)
% D
etec
ted
m
edia
n ra
nge
Batte
ries
and
disa
ssem
bly
(n =
16–
18)
% D
etec
ted
m
edia
n ra
nge
Offi
ce (n
= 6
) %
Det
ecte
d m
edia
n ra
nge
Pres
hift
Post
shift
Pres
hift
Post
shift
Pres
hift
Post
shift
Pres
hift
Post
shift
Com
mon
ly u
sed
in e
lect
roni
cs n
ow a
nd in
the
past
D
PHP
(TPH
P)
LOD
= 0
.16
100%
1.
0–1.
810
0%
0.89
–2.1
100%
1.
62
0.69
–4.3
100%
3.
48
1.3–
7.1
100%
1.
40
0.51
–5.4
89%
1.
57
ND
–9.2
100%
1.
04
0.64
–2.4
83%
0.
379
ND
–1.2
DpC
P (T
CP)
LO
D =
0.0
50%
33%
N
D–0
.06
29%
N
D
ND
–0.1
5
35%
N
D
ND
–0.2
1
6%
ND
N
D–0
.06
33%
N
D
ND
–0.1
1
0%0%
DoC
P (T
CP)
LO
D =
0.0
50%
0%0%
0%0%
0%0%
0%
Less
com
mon
ly u
sed
in e
lect
roni
cs n
ow a
nd in
the
past
TB
BA (E
H-T
BB)
LOD
= 0
.05
0%0%
0%0%
0%0%
0%0%
BCEP
(TC
EP)
LOD
= 0
.08
100%
0.
29–2
.310
0%
0.38
–0.6
594
%
0.67
6 N
D–1
.6
100%
0.
792
0.21
–2.2
75%
0.
367
ND
–1.2
94%
0.
586
ND
–1.9
100%
1.
09
0.27
–2.5
100%
0.
436
0.21
–0.6
3BC
IPP
(TC
IPP)
LO
D =
0.1
010
0%
0.23
–1.3
33%
N
D–0
.77
35%
N
D
ND
–2.6
35%
N
D
ND
–2.4
22%
N
D
ND
–1.5
22%
N
D
ND
–12
50%
0.
263
ND
–0.9
7
33%
N
D
ND
–0.5
0R
arel
y us
ed in
ele
ctro
nics
†BD
CIP
P (T
DC
IPP)
LO
D =
0.1
1
100%
3.
9–8.
510
0%
2.5–
6.1
100%
2.
50
0.66
–5.2
100%
2.
43
0.47
–4.4
100%
1.
75
0.36
–6.7
100%
1.
57
0.15
–12
100%
5.
82
1.7–
15
100%
3.
16
0.31
–11
*Med
ian
not c
alcu
late
d if
n =
5 or
less
†Prim
arily
use
d in
pol
yure
than
e fo
am a
nd c
omm
only
pre
sent
in d
ust

Page 20 Health Hazard Evaluation Report 2015-0050-3308
Tabl
e 7.
Cre
atin
ine
corre
cted
con
cent
ratio
ns o
f flam
e re
tard
ant m
etab
olite
s in
urin
e sa
mpl
es, b
y jo
b ta
sk, i
n µg
/g c
reat
inin
eM
etab
olite
(p
aren
t flam
e re
tard
ant)
Ship
ping
and
rece
ivin
g (n
= 3
*)
% D
etec
ted
rang
e
Sorti
ng a
nd s
hred
ding
(n
= 1
7)
% D
etec
ted
med
ian
rang
e
Batte
ries
and
disa
ssem
bly
(n =
16–
18)
% D
etec
ted
med
ian
rang
e
Offi
ce (n
= 6
) %
Det
ecte
d m
edia
n ra
nge
Pres
hift
Post
shift
Pres
hift
Post
shift
Pres
hift
Post
shift
Pres
hift
Post
shift
Com
mon
ly u
sed
in e
lect
roni
cs n
ow a
nd in
the
past
DPH
P (T
PHP)
100%
0.
52–0
.73
100%
0.
56–0
.86
100%
0.
868
0.39
–2.3
100%
1.
76
0.41
–4.3
100%
0.
913
0.26
–2.4
89%
0.
973
ND
–3.0
100%
0.
507
0.38
–0.8
1
83%
0.
345
ND
–0.7
4D
pCP
(TC
P)0%
33%
N
D–0
.03
29%
N
D
ND
–0.1
0
35%
N
D
ND
–0.0
9
6%
ND
N
D–0
.05
33%
N
D
ND
–0.2
3
0%0%
DoC
P (T
CP)
0%0%
0%0%
0%0%
0%0%
Less
com
mon
ly u
sed
in e
lect
roni
cs n
ow a
nd in
the
past
TBBA
(EH
-TBB
)0%
0%0%
0%0%
0%0%
0%BC
EP (T
CEP
)10
0%
0.20
–0.9
010
0%
0.16
–0.4
894
%
0.35
8 N
D–0
.87
100%
0.
372
0.17
–0.8
1
75%
0.
282
ND
–0.7
6
94%
0.
355
ND
–0.9
2
100%
0.
540
0.15
–1.3
100%
0.
424
0.19
–0.5
8BC
IPP
(TC
IPP)
100%
0.
16–0
.50
33%
N
D–0
.31
35%
N
D
ND
–0.8
3
35%
N
D
ND
–0.6
4
22%
N
D
ND
–0.9
7
22%
N
D
ND
–4.8
50%
0.
142
ND
–0.4
5
33%
N
D
ND
–0.2
9R
arel
y us
ed in
ele
ctro
nics
†BD
CIP
P (T
DC
IPP)
100%
2.
3–3.
510
0%
1.5–
2.5
100%
1.
23
0.54
–2.4
100%
1.
02
0.54
–2.7
100%
1.
14
0.20
–5.2
100%
0.
920
0.06
–4.5
100%
2.
14
0.85
–8.3
100%
2.
11
0.62
–7.0
*Med
ian
not c
alcu
late
d if
n =
5 or
less
†Prim
arily
use
d in
pol
yure
than
e fo
am a
nd c
omm
only
pre
sent
in d
ust

Page 21Health Hazard Evaluation Report 2015-0050-3308
Surface Samples for MetalsWe wiped surfaces outside of the processing area to determine if metals were inadvertently transferred or had migrated from the processing area. Our results showed the presence of metals on most of these surfaces (Table 8). However, we found that the levels of lead and manganese on the air diffuser in the conference room and on the employee water cooler handle were more than five times greater than on the other surfaces. Levels of nickel were highest on the men’s office bathroom door handle and on the handle of the tap water cooler at the employee entrance.
Table 8. Surface wipe samples for selected metals in nonprocessing locations, in µg/100 cm2
Sample location* Cadmium Lead Manganese NickelCoffee table top 0.066 2.7 1.4 0.52Men’s bathroom door handle (in the office)† 0.056 1.2 0.83 7.4Floor, conference room entrance from office 0.07 2.4 2 0.72Conference room supply air diffuser 0.68 30 13 3.2Men’s bathroom in processing area 0.044 0.83 0.47 0.34Breakroom table top ND 0.32 0.11 NDBreakroom microwave table top 0.11 3.8 2.4 1.2Breakroom microwave keypad ND ND 0.23 0.35Employee entrance, water cooler (handle)† 0.81 21 15 6.8Locker room, next to locker handle 0.036 0.63 0.3 0.64Employee desk by computer mouse ND 0.32 ND 0.072Employee keyboard† 0.063 3.6 1.7 0.59Limit of detection 0.02 0.3 2 0.07µg/100 cm2 = Micrograms per 100 square centimetersND = Not detected, results were below the limit of detection.*Unless otherwise noted, the surface sampling area was 100 cm2.†Estimated surface area

Page 22 Health Hazard Evaluation Report 2015-0050-3308
Hand Wipe Samples for MetalsWe detected metals on the hands of all processing employee participants after they washed their hands before leaving work at the end of the shift (Table 9). We found that lead had the highest mean and median concentrations in the hand wipes.
Table 9. Hand wipe sample results for all employee (n = 12) in µg/sample for selected metalsElement Mean concentration
(range)Median
concentrationCadmium 0.45 (0.032–1.4) 0.33Lead 12 (0.57–37) 7.5Manganese 8.3 (0.54–34) 4.6Nickel 3.0 (0.39–7.4) 2.5
Air Samples for MetalsWe collected personal air samples for 30 elements for 15 employees over 3 days and then calculated summary statistics about these exposures (Appendix A, Table A3). One employee working in batteries and disassembly was exposed to airborne cadmium above the NIOSH recommended exposure limit (REL) of 5 micrograms per cubic meter (µg/m3). The remaining cadmium exposures (GM 0.09 µg/m3) were well below the lowest OEL. No employees were exposed to lead concentrations above the OEL of 50 µg/m3; however, an employee working on the shredder had an airborne lead exposure of 19 µg/m3. The highest manganese concentration, 45 µg/m3, is about half the lowest OEL of 100 µg/m3. Median indium concentrations were very low overall (0.2% of the OEL). Calcium, magnesium, strontium, and titanium concentrations were all 100 times below the OEL. We did not detect arsenic (< 0.73 µg/m3) or tellurium (< 0.42 µg/m3), and with the exception of one sample (0.31 µg/m3) all molybdenum samples were not detectable (< 0.08 µg/m3). Phosphorous (< 2.08 µg/m3), selenium (< 0.42 µg/m3), thallium (< 0.83 µg/m3), and vanadium (< 0.06 µg/m3) were not detected in most samples.
Table 10 shows the concentrations of cadmium, lead, manganese, and nickel in personal air samples by job task. The highest GM lead and manganese concentrations occurred during sorting and shredding. The highest GM cadmium concentrations occurred in the shredding and the disassembly participants. However, one of the employees in batteries and disassembly had cadmium exposures above the NIOSH REL. Even though the office participants rarely entered the warehouse, they had detectable concentrations of metals in their air samples.

Page 23Health Hazard Evaluation Report 2015-0050-3308
Table 10. Geometric mean and range of concentrations of metals in personal air samples, by job task, in µg/m3
Location Cadmium Lead Manganese NickelGM Range GM Range GM Range GM Range
Shipping and receiving (n = 3)
0.046 0.02–0.08 1.61 0.89–2.5 1.02 0.56–1.6 0.42 0.26–0.58
Sorting and shredding (n = 15)
0.136 0.05–0.39 5.81 2.4–19 7.09 1.5–45 2.00 0.87–5.5
Batteries and disassembly (n = 19)
0.106 0.05–6.4 1.43 0.93–2.8 0.857 0.59–1.8 0.397 0.17–0.94
Office (n = 6)
0.023 0.0070–0.48 0.480 0.27–0.91 0.250 0.13–0.47 0.130 0.060–0.39
We took area air samples for metals in three processing locations and an area air sample in the conference room where we expected less airborne metals. Table 11 shows the results for cadmium, lead, manganese, and nickel. Lead and cadmium concentrations were highest near the infeed of the shredder, and manganese and nickel were highest at the sorting end of the shredder. Concentrations of all four metals were lower in the disassembly area. The airborne area metal concentrations in the conference room were below the concentrations we measured in the processing areas. We did not detect hexavalent chromium in any area air samples.
Table 11. Area air sample results for metals over 3 sampling days, in µg/m3 Location Cadmium Lead Manganese Nickel
GM Range GM Range GM Range GM RangeInfeed of shredder
0.15 0.07–0.54 6.9 2.6–25 4.4 1.6–15 1.2 0.40–3.1
Sorting end of shredder
0.059 0.04–0.08 3.2 2.3–4.1 8.1 6.4–9.9 2.5 1.3–5.7
Batteries and disassembly
0.068 0.04–0.14 1.2 1.2–1.3 0.70 0.64–0.74 0.52 0.24–2.3
Conference room
0.015 0.01–0.02 0.29 0.21–0.46 0.16 0.14–0.17 0.060 0.06–0.07

Page 24 Health Hazard Evaluation Report 2015-0050-3308
Mercury Vapor Sampling ResultsWe found mercury vapor present in several locations in the warehouse and recycling process areas (Table 12). The highest level was measured in the magnetic metals sorting bin, only a few inches above the metal scrap.
Table 12. Mercury vapor direct-reading spot measurement results, in µg/m3
Sample location description ResultBreakroom 3.5Feeder area of shredding process 4.9Feeder area of shredding process 5.9Magnetic metals sorting area, at height of scrap bin opening
9.5
Magnetic metals sorting area, inches above metal scrap
28
Magnetic metals sorting area, about a foot above metal scrap
13
Shredded glass and plastic sorting area 2.6Bin of LCD screens 0.55Bin of fluorescent lights 0.64
Direct-Reading Particulate Measurement ResultsWe measured higher concentrations of particulates in the processing area near the magnetic metals sorting operations compared to the conference room, a nonprocessing area. In general, the nonprocessing concentrations remained steady throughout the sampling period (4 hours 45 minutes). In contrast, particle concentrations in the magnetic metals sorting area varied and increased above background levels during shredding, emptying metal scrap bins, and dumping aluminum and plastic scraps into bins.
Airborne particle concentrations in the magnetic metals sorting area increased when a pedestal floor fan was turned on to cool employees. Employees were picking magnetic metal scraps off the conveyor belt and sorting them into other bins for further recycling. The fan blew air across the metal scrap conveyor belt toward employees (Figure 4). The direct-reading instruments also measured a particle increase when the bin containing the magnetic metals was moved.

Page 25Health Hazard Evaluation Report 2015-0050-3308
Figure 4. Cooling fan blowing air across sorting belt toward employee.
Figure 5 compares particulate concentrations in the conference room to the magnetic metals sorting area concentrations. The conference room particulate concentration remained mostly steady throughout the sampling period. In the magnetic metals sorting area, particulate concentrations fluctuated but were generally above the conference room levels, especially for particles less than 1 µm in diameter. For a brief period of time, the magnetic metals sorting area had lower particulate concentrations when compared to the conference room. This corresponded to when the employees were on a break and no activities were occurring in the area.

Page 26 Health Hazard Evaluation Report 2015-0050-3308
Figure 5. Comparison of total particulate concentrations in the magnetic metals sorting area and conference room as measured by the OPS3330 direct-reading particulate monitor.
A comparison of 0.3 µm sized particle concentration from the OPS3330 showed that the magnetic metals sorting area and conference room had similar particle concentrations (Figure 6), except for a 1-hour period during which particle concentrations in the magnetic metal sorting area fluctuated several times above concentrations in the conference room.
Figure 6. Comparison of 0.3 µm particle concentrations in the magnetic metals sorting area and conference room.

Page 27Health Hazard Evaluation Report 2015-0050-3308
Size-selective Filter-based Air Sample ResultsTable A4a and A4b in Appendix A show the size-selective area air sample results. In the magnetic metals sorting area we did not detect indium or indium compounds (< 0.02 µg/m3) in the smaller sizes (0.25 µm, 0.44 µm, and 0.77 µm) but we did detect indium in the larger sizes (1.4 µm, 2.5 µm, and 10 µm). We did not detect indium (< 0.02 µg/m3) in the conference room in any of the size ranges.
We found detectable amounts of manganese and titanium in all size ranges of the air samples collected in the processing area. We found detectable levels of lead, nickel, silver, and tin in all stages except the 0.25 µm cut point. In addition, we found cadmium and neodymium in all stages above the 0.44 µm cut point. Beryllium was not detected above the MDC in any of the processing area size-selective samples.
In the size-selective air sample collected in the conference room, we did not find beryllium, indium, and neodymium above their respective MDCs. In contrast, manganese and titanium were detected at every cut point. Cadmium, lead, nickel, silver, and tin were detected in respirable size cut points.
Blood Samples for MetalsBlood lead levels (BLLs) ranged from 0.99 micrograms per deciliter (µg/dL) to 12 µg/dL. The NIOSH Adult Blood Lead Epidemiology and Surveillance System uses a surveillance case definition for an elevated BLL in adults of 5 µg/dL of blood or higher [CDC 2015a]. Three BLLs were over 5 µg/dL (6.7, 7.0, and 12.0 µg/dL) in the shredding and sorting areas.
Blood cadmium levels were low, with all but two below the laboratory LOD of 0.5 µg/L. The other two were below 1 µg/L in shredding and in sorting. OSHA defines an acceptable blood
Table 13. Average mass concentrations* in mg/m3 from the DustTrak for different size cut pointsDustTrak cut point size bin Average mass concentration1 µm 0.212.5 µm 0.224 µm 0.2410 µm 0.41mg/m3 = Milligrams per cubic meter*From the magnetic metals sorting area
Table 13 compares the mass concentration of four different particulate sizes. Particulates greater than 10 µm diameter had the largest mass concentration. We did not see any differences between particulate mass concentrations in the nanoscale and respirable size fractions of 1 µm, 2.5 µm, and 4 µm.

Page 28 Health Hazard Evaluation Report 2015-0050-3308
cadmium level as less than 5 µg/L. The GM blood cadmium level in a large representative sample of the general population was 0.337 µg/L, with a 95th percentile of 1.70 µg/L [CDC 2015b]. All serum indium levels were below the LOD of 0.5 µg/L.
Workplace ObservationsPPE included safety glasses, steel-toed boots, and cut-resistant gloves. Ear plugs and hard hats were required for working around the shredder, but optional in other areas. Some employees voluntarily wore cut resistant sleeves and N95 filtering facepiece respirators. Employees had received a copy of Appendix D of the OSHA respiratory protection standard (29 Code of Federal Regulation [CFR] 1910.134). We observed some employees working at the metal sorter wearing their respirators incorrectly (e.g., not wearing the lower strap). Employees were permitted to have water bottles and other drinks on the processing floor even though they had a break room. We also saw employees dry sweeping in the processing area, a practice that can re-aerosolize dust. The company did not provide uniforms or have shower facilities, laundry facilities, or locker rooms. Employees were permitted to wear their work clothes home. The employees ate lunch inside a breakroom.
DiscussionMetalsSurface levels of metals in the conference room were lower than those found in the processing areas, but we found relatively higher levels on the supply air diffuser in the conference room. This likely occurred because the office area and conference room air intake was located inside the warehouse, and dusts containing metal deposited on the supply air diffuser as air entered the conference room. In addition, we found metals, including lead, in the conference room air samples, which emphasizes the need for a separate ventilation system. According to ANSI/ASHRAE Standard 62.1-2016, air with potentially dangerous particles such as lead or other heavy metals should never be recirculated or transferred to any space [ANSI/ASHRAE 2016].
We found lead on hand wipe samples collected after participants washed their hands before leaving work. This indicated that soap and water alone did not sufficiently remove lead from the skin. NIOSH research shows that washing hands with soap and water alone is not completely effective in removing lead and other toxic metals from the skin [Esswein et al. 2011; NIOSH 2014b,c]. Some commercially available lead removal products have been proven to remove more contamination from the skin. In addition, employees frequently reused gloves, which could potentially transfer contamination from the dirty gloves to the hands. Metals present on skin or clothing when leaving work could contaminate personal vehicles and homes and present a hazard to family members.
With the exception of one personal air sample taken in the batteries and disassembly area that exceeded the REL for cadmium, personal exposures to other airborne metals were well below the lowest OELs. Overall, the highest concentrations of metals in personal samples were from participants working around the small shredder and optical sorter. In addition, area

Page 29Health Hazard Evaluation Report 2015-0050-3308
samples showed that concentrations of metals near the shredder, although very low, were slightly higher than levels in a sample taken in the disassembly area. The mechanical action of the small shredder coupled with the lack of local exhaust ventilation likely contributed to the higher concentrations of metals in the air.
BLLs ranged from 0.99 µg/dL to 12 µg/dL. The NIOSH Adult Blood Lead Epidemiology and Surveillance System uses a surveillance case definition for an elevated BLL in adults of 5 µg/dL of blood or higher [CDC 2015a]. Three BLLs were over 5 µg/dL in shredding and sorting. These jobs have the highest potential for exposure to metals. Blood cadmium levels were well below the OSHA acceptable level of 5 µg/L. Two of the employees with the highest cadmium levels (0.5–1.0 µg/L) and two of the three employees with the highest BLLs smoked. Smoking can increase blood lead and blood cadmium levels [Adams and Newcomb 2014; Mannino et al. 2005].
Although employees do not typically work near the metals sorter during production, the presence of low levels of mercury vapor indicate a potential for exposure in this and nearby areas during the recycling process even when not shredding florescent bulbs. These results indicate that mercury vapor could be emitted during the recycling process, particularly from components that contain fluorescent lights, batteries, medical and telecommunication equipment, and some flat-panel displays. No LCD mercury lamps were shredded at the company during our evaluation. While we cannot compare these area measurement results to OELs, employees are unlikely to exceed exposure limits on the basis of these area measurements and their typical work locations.
The particulate monitors showed increases in particle concentrations when a fan was blowing across the sorting belt and when a bin of magnetic metals was replaced. These increases indicate that the magnetic metals sorting process generates particulates and that the fan is likely aerosolizing particulate matter, presumably metal scrap dust, and blowing it at the employee, increasing their potential for inhalation of metal dust.
Increases in the number of particles less than 1 µm in size could be attributed to many particle-generating sources, including both natural and man-made particle sources. For instance, additional recycling operations were ongoing in the area and warehouse. In addition, forklifts, motors, pumps, and heaters were in operation; aluminum, plastic scrap, and dust were emptied in bins at adjacent areas; and the large garage doors to the warehouse were open. These activities and factors can create or introduce particles, including incidental nanoscale particulate matter, into the work environment.
We did not find indium in the nano-size range, and indium was not detected in the blood samples. Our area size-selective sampling results suggest that nano-sized indium, such as the indium nanoparticles commonly found in the LCD screens, are likely not being released from this shredding process. However, we found indium compounds in the larger and respirable size range cut point stages. We cannot rule out that indium nanoparticles could be present in agglomerated larger particles. At the time of our evaluation, employees were shredding LCD screens and other electronic devices that commonly contain indium and indium nanoparticle compounds. Measurement of various heavy metals such as titanium and manganese in the respirable and larger aerosol size ranges may be attributable to the shredding process, which

Page 30 Health Hazard Evaluation Report 2015-0050-3308
may be releasing inhalable-sized aerosols. This is a potential inhalation hazard for employees working in the magnetic metals sorting area.
Our results showed migration of airborne metals from the processing area to the conference room. While we cannot determine the exact source of the metals in the air of the conference room, two pathways are likely. Because the general ventilation systems for both the processing areas and nonprocessing areas are shared and connected, air from the processing area could be recirculated to the conference room. In addition, passive air movement could carry some airborne metals from the processing area to the conference room through pathways such as the conference room door. Although airborne metal concentrations in the conference air samples were very low, employees are unnecessarily exposed in this area. A separate ventilation system for the conference room could reduce employee risk of exposures in this area.
Flame RetardantsHand Wipes and Dermal Exposure
Exposure to flame retardants in indoor non-work environments is thought to primarily occur from hand-to-mouth ingestion of dust and secondarily by absorption through the skin [Abdallah et al. 2015; Mäkinen et al. 2009]. These exposure pathways can also occur in workplaces.
BDE-183 was not detected in any hand wipes and BDE-154 and BDE-153 were detected in a low percentage of the hand wipes. Because the use of these OctaBDE flame retardants in electronics was phased out after 2004, these results suggests that at the time of our evaluation, the company was not processing or processing very few electronics made before 2004. We detected BDE-209, TPHP, TCP, BTBPE, DBDPE, and TBBPA in nearly all of the hand wipes. In addition, the amounts of these flame retardants on the hands increased across the work shift among participants working in processing, shipping, and office areas. This increase was not surprising because these flame retardants are currently used or have been recently used in electronics. Although shipping and receiving and office workers did not handle electronics as part of normal job duties, the shipping and receiving area was located within the sorting and shredding department, and some office employees regularly went into the processing areas. In addition, the air handling units for the office area pulled supply air from the processing areas.
Office employees also had increases in TDCIPP, which is used mainly in polyurethane foam. Because polyurethane foam is used in so many types of products, its dust is found everywhere. The increase seen across the shift most likely represents office employees’ exposure from sitting in upholstered chairs that contain polyurethane foam. On the contrary, processing employees had much smaller median increases in TDCIPP levels on their hands across shifts.
We detected some of the PentaBDE flame retardants (BDE-99 and BDE-47) and TDCIPP in most of the samples, and typically saw an increase from the preshift to the postshift levels. However for batteries and disassembly and the office, BDE-99 postshift medians are nearly equal to the preshift medians and BDE-47 postshift medians are lower than preshift medians.

Page 31Health Hazard Evaluation Report 2015-0050-3308
TDCIPP and PentaBDE are typically found in polyurethane foam, not in electronics [Alaee et al. 2003] and were phased out starting in 2005. However, several studies have shown that while PentaBDE and TDCIPP are not typically used in electronics, they are often present in high concentration in office dusts [Sjödin et al. 2008; Watkins et al. 2013], which could be pulled into electronic devices by their cooling fans.
Thorough hand washing at the end of the work shift with soap and water should remove contaminants from the skin to reduce risk of possible ingestion through hand-to-mouth contact and continued dermal exposure. In addition, contaminants remaining on the skin could be transferred to non-work surfaces in vehicles and in the home. Table 14 shows the levels of selected flame retardants on hands of sorting and shredding, and batteries and disassembly participants compared to results published in studies of the general population, which were collected using similar hand-wipe methods. Hand wipes for several of the flame retardants (BDE-154, BDE-153, BDE-99, BDE-47, BDE-100) did not have substantial preshift and postshift differences nor were the levels substantially different than levels reported in one or more studies of the general population, suggesting minimal dermal exposures to these flame retardants at work. In contrast, the levels of BDE-209, TPHP, TCIPP, and TDCIPP among our participants were substantially higher than levels found the general population, even on preshift testing. These results illustrate not only workplace exposure, but also that these flame retardants were not completely removed from the skin between work shifts (and most likely after several hand washes) or that employees had dermal exposures outside of work, potentially from their vehicles and homes due to take-home exposure.

Page 32 Health Hazard Evaluation Report 2015-0050-3308
Table 14. Geometric mean and range of flame retardants on hand wipes in sorting and shredding participants, batteries and disassembly participants, and the general population, in ng/sampleFlame retardant
Sorting and shredding n = 15–17
% Detected GM
(range)
Batteries and disassembly n = 17–18
% Detected GM
(range)
General population*
n = 53 % Detected
GM (range)
General population†
n = 33 % Detected
GM (range)
General population‡
n = 40 % Detected
GM (range)Preshift Postshift Preshift Postshift
OctaBDE (commonly used in electronics until around 2004)BDE-183 0% 0% 0% 0% Not
sampled76% 0.7
(ND–8.5)
Not sampled
BDE-154 13% (-)
(ND–24)
13% (-)
(ND–58)
0% 11% (-)
(ND–34)
87% 1.0
(ND–59.8)
97% 4.9
(ND–59)
Not sampled
BDE-153 6% (-)
(ND–15)
35% (-)
(ND–45)
6% (-)
(ND–12)
17% (-)
(ND–38)
91% 1.3
(ND–67.9)
97% 15.8
(ND–290)
Not sampled
OctaBDE and DecaBDE (commonly used in electronics until around 2013)BDE-209 100%
315 (93–2,000)
100% 2,210
(470–11,000)
100% 311
(83–2,300)
100% 1,300
(180–7,800)
96% 19.5
(ND–804)
67% 43.1
(ND–270)
Not sampled
Commonly used in electronics now and in the pastTPHP 100%
297 (110–800)
100% 2,770
(500–11,000)
94% 170
(ND–800)
100% 770
(59–3,600)
87% 62.1
(ND–1,230)
Not sampled
100% 22.4
(?–416.7)Less commonly used in electronics now and in the pastTCIPP 53%
(-) (ND–1,500)
88% 849
(ND–4,600)
61% (-)
(ND–850)
67% (-)
(ND–560)
Not sampled
Not sampled
100% 45.4
(?–255)Rarely used in electronicsPentaBDE
BDE-99 100% 44.8
(19–340)
100% 77.5
(26–160)
94% 55.6
(ND–230)
94% 50.9
(ND–370)
100% 26
(4.4–707)
100% 72.2
(0.9–747)
Not sampled
BDE-47 88% 31.6
(ND–230)
88% 46.8
(ND–120)
83% 35.3
(ND–190)
94% 30.3
(ND–170)
100% 18.4
(2.5–454)
97% 72.7
(ND–565)
Not sampled
BDE-100 18% (-)
(ND–53)
47% (-)
(ND–28)
56% (-)
(ND–33)
28% (-)
(ND–60)
81% 2.8
(ND–128)
100% 13.3
(0.08–142)
Not sampled
TDCIPP 94% 517
(ND–2,400)
100% 932
(170–5,300)
94% 548
(ND–3,600)
100% 754
(210–3,000)
91% 84.1
(ND–537)
Not sampled
95% 108.3
(ND–535)? = Study did not provide a lower-end of the range*Hoffman et al. 2015 †Stapleton and Dodder 2008 ‡Hammel et al. 2016
Page 33Health Hazard Evaluation Report 2015-0050-3308
Our results indicate that hand exposure to some flame retardants in this electronics recycling company differs greatly from exposures in the general population. TPHP hand exposures found in other electronic recycling facilities were similar to what we found [Mäkinen et al. 2009]. In our evaluation, TPHP was detected in 100% of the preshift and postshift hand wipes of the shredder and sorter employees. The TPHP level (GM = 2,766 ng) of our postshift hand wipe samples was approximately 45 times higher than the general population [Hoffman et al. 2015]. In addition, our hand wipe samples indicate that flame retardant exposures were higher for shredding and sorting participants than batteries and disassembly participants. Although employees had flame retardants on their hands before their work shift, increases in the levels of flame retardants during the work shift, particularly those commonly used on electronics, illustrate the potential for dermal exposure and highlight the importance of PPE and hand washing to reduce exposures. A study of flame retardant exposure in young children suggested those who washed their hands at least five times a day had lower levels of flame retardants on their hands than those who washed less often [Stapleton et al. 2014]. Office workers who washed their hands fewer than four times daily had significantly higher levels of PentaBDE on their hand wipes than those who washed four or more times daily [Watkins et al. 2011]. Absorption of TCIPP and TCEP was significantly reduced by hand washing in an experimental study using human ex vivo skin, but penetration continued, presumably from the reservoir in the skin [Abdallah et al. 2016]. Hand washing did not significantly reduce absorption of TDCIPP [Abdallah et al. 2016].
Several factors can affect overall interpretation of the hand wipe sampling results. The hand wipe sampling procedure removes an unknown proportion of the flame retardants that are present on the hand and can vary depending on the technique of the person doing the wiping. In our pilot hand wipe study the amount removed by the first gauze wipe set varied from 0% to 98% of the total. If a hand wipe removed more of a particular flame retardant preshift than was added to the hands during the shift, it could appear there was a decline in flame retardant levels, even though exposure to that flame retardant may have occurred during the work shift.
The efficiency of hand wipes in collecting all the contamination that is present is unknown. Also, we do not know the efficiency of hand washing in removing different flame retardants. If hand washing was very efficient in removing flame retardants from the workers’ hands, then the postshift flame retardant levels might be far less than if hand washing had not been done. Participants with less time between their last hand washing and their postshift hand wipe sample might have lower amounts of flame retardants on their hands due to removal from washing. We instructed participants to wash their hands as they normally would during the work shift, but instructed them to refrain from washing them immediately before having their postshift hand wipe sampling done. We did not record the time interval from the last hand washing to the postshift wipe sampling. The wide variability of the results could be from interpersonal sampling variation, such as participants wiping their hands differently, thereby removing the flame retardants from a previously unwiped portion of the hand or differences in applied pressure and speed of wiping. We do not know if differences in skin moisture and use of skin care products could affect the results.

Page 34 Health Hazard Evaluation Report 2015-0050-3308
Personal Air Sampling for Flame Retardants
Several published studies have examined airborne exposure to flame retardants in homes and nonindustrial settings. Allen et al. [2007] collected inhalable personal air samples for PBDEs from 20 individuals in Boston for 7 days while they were at home. The main congeners they detected were BDE-47, BDE-209, and BDE-99. BDE-47 was detected in 100% of the air samples with a GM concentration of 0.227 ng/m3. BDE-209 was detected in 45% of the samples with a GM concentration of 0.174 ng/m3. The authors estimated that about 22% of the participants’ total BDE-209 exposures were likely through inhalation.
LaGuardia and Hale [2015] evaluated flame retardant exposures on four individuals in their homes in Seattle. Samples were collected for an 8-hour period. Inhalable personal air sampling found that the predominant flame retardants were TDCIPP (94% of the total) and TCIPP (65% of the total). BDE-209 was detected in two of the four samples, at concentrations of 0.1 ng/m3 and 3.8 ng/m3. Schreder et al. [2016] collected personal air samples for chlorinated organophosphate flame retardants over a 24-hour period, on 10 individuals in Washington. The median concentrations were 262 ng/m3 (TCIPP), 82 ng/m3 (TDCIPP) and 78 ng/m3 (TCEP).
Swedish researchers examined the presence and levels of several organophosphate flame retardants using area air sampling for particulate and vapor at night in three schools, a day care center, and an office. TPHP was detected in all locations, but below levels of quantification in two, and at concentrations less than 1 ng/m3 in the others [Carlsson et al. 1997]. The highest concentrations these researchers measured were for TCEP, with mean concentration in each building ranging from 11 ng/m3 to 250 ng/m3. These researchers also detected TCIPP in much lower concentrations (maximum mean concentration 41 ng/m3).
We anticipated that occupational exposures to flame retardants in the air would differ from air sampling results in non-industrial environments. Our evaluation demonstrated airborne exposures to several flame retardants, primarily BDE-209, TPHP, TCP, and DBDPE. We detected BDE-209 in 100% of our air samples at a GM concentration of 189 ng/m3 (range: 29–3,576 ng/m3). This was far higher than the levels found in non-industrial settings [Allen et al. 2007; LaGuardia and Hale 2015]. In addition, the airborne BDE-209 concentrations we measured were well above the GM concentration of 25 ng/m3 in personal air samples collected over 2 years reported in Swedish electronics recycling disassemblers [Pettersson-Julander et al. 2004] and concentrations of 0.22 ng/m3 found in general air samples in a Swedish electronics recycling company [Sjodin et al. 2001].
A study of sorters and disassemblers (not shredders) at two electronics recycling facilities in Finland documented median airborne DBDPE concentrations of 61 ng/m3 and median sum PBDE concentrations of 295 ng/m3 [Rosenberg et al. 2011]. The researchers recommended ventilation controls then resampled after their installation. Median airborne DBDPE concentrations decreased to 14 ng/m3, and median PBDE concentrations dropped to 65 ng/m3, indicating that controls reduced exposures. Our DBDPE results in the sorting and shredding department (median = 145 ng/m3) was higher and our result in the batteries and disassembly (median = 42.9 ng/m3) was slightly lower than the initial airborne concentrations
Page 35Health Hazard Evaluation Report 2015-0050-3308
reported by Rosenberg et al. [2011]; however, we cannot directly compare our PDBE results with Rosenberg et al. [2011] because that study did not differentiate congeners.
TPHP has been used as a flame retardant in electronic products as well as a plasticizer [van der Veen and Boer 2012]. We found TPHP in the second highest concentration in our air samples, with a GM concentration of 95 ng/m3 in our disassembly and battery participants and 287 ng/m3 among shredding and sorting participants. Only 75% of the air samples from the office participants were detectable, with a maximum concentration of 50 ng/m3. A study of two other electronics recycling facilities in Finland where sorting, dismantling, and crushing were performed showed TPHP was present in the highest airborne concentrations of the eight organophosphate flame retardants measured (GM personal air concentrations of TPHP of 760 ng/m3 and 850 ng/m3) [Mäkinen et al. 2009].
Mäkinen et al. [2009] also found that airborne TCP was typical in electronics dismantling facilities. The GM personal air TCP concentration in a dismantling and sorting room of an electronics dismantling company was 90 ng/m3 (range: 62 ng/m3 to 175 ng/m3) and 110 ng/m3 (range: 62 ng/m3 to 175 ng/m3) in an electronics crushing process at a separate facility. Comparatively, our disassembly and battery sorting participants had a GM exposure of 65.8 ng/m3, while our shredding and sorting participants had a GM exposure of 251 ng/m3.
Mäkinen et al. [2009] detected TBBPA in few air samples and at very low concentrations. Sjodin et al. [2001] found TBBPA present in air with a mean concentration of 0.20 ng/m3, and Rosenberg et al. [2011] found TBBPA with a median concentration of 145 ng/m3. We only detected TBBPA in the air in 17% of samples, with a median concentration of ND. TBBPA is one of the most commonly used brominated flame retardants in printed circuit boards. Unlike most of the flame retardants we examined, which are additive flame retardants (blended with the plastics), TBBPA is a reactive flame retardant (chemically bonded into the plastics). Because of this chemical bonding, we found very little in our air samples, as expected [Rosenberg et al. 2011]. It is unclear why TBBPA was detected in higher concentrations in previous studies.
BTBPE is found in Firemaster 680, which is used in many computer housings. Pettersson-Julander et al. [2004] found a GM concentration of airborne BTBPE of 15 ng/m3. We measured similar but slightly lower GM concentrations among sorters and shredders (14.2 ng/m3) and batteries and disassemblers (7.43 ng/m3).
TCIPP, TDCIPP, TCEP, and PentaBDE are not typically used in electronics and are predominantly found in polyurethane foam [Alaee et al. 2003; Stapleton et al. 2011; van der Veen and Boer 2012]. We detected no TCIPP, TDCIPP, or TCEP, and we detected low concentrations of PentaBDE with the highest GM concentration of 13.3 ng/m3, as represented by its primary congener BDE-99. On the contrary, the studies from non-industrial settings [LaGuardia and Hale 2015; Schreder et al. 2016] detected higher concentrations of TCIPP and TDCIPP. We suspect the source of PentaBDE to be primarily from dust collected inside of the electronic equipment.
These data indicate that airborne exposure in this electronics recycling company differ greatly from those in homes and nonindustrial settings, but are within the range of exposures

Page 36 Health Hazard Evaluation Report 2015-0050-3308
found in other electronic recycling facilities. In addition, our air samples indicate that flame retardant exposures were higher for shredding and sorting participants than batteries and disassembly participants. This is likely due to the mechanical grinding that occurs in shredding and sorting as opposed to the more manual tasks in batteries and disassembly.
Biological Burden of Flame Retardants: Blood
We examined serum PBDE concentrations and compared them to a representative sample of the general population. The GM serum concentration of BDE-209 (the flame retardant present in the highest concentrations in the air and with large increases on hands across shifts) was 8.098 ng/g lipid weight. NHANES data did not have reported values because so many of their samples were below the LOD of 5.8 ng/g lipid weight. The higher serum BDE-209 concentrations in our participants appears to be from occupational exposures and not from diet. The NHANES samples were collected in 2007 and 2008, when concentrations were presumably higher because this was prior to the phase-out of DecaBDE. Data is also now available for the years 2009 and 2010, but it is segregated by age groups, gender, and race/ethnicity [CDC 2018]. Swedish electronics disassembly employees had a median serum BDE-209 concentration of 4.8 ng/g lipid weight [Thuresson et al. 2006a]. Workers were retested several years later after the shredder was moved from the disassembly area to a different location. The median decrease in their serum BDE-209 concentrations was 46% [Thuresson et al. 2006b]. In the initial Swedish study, serum concentrations of BDE-47, BDE-153, BDE-154, and BDE-183 were also significantly higher than their reference populations of computer clerks and hospital cleaners [Sjodin et al. 1999]. We found median serum concentrations of BDE-153 about double that of the general population sample, but the concentrations of others were similar to the general population. Concentrations of other PBDEs, PCBs, and other persistent pollutants were generally lower in our participants than in NHANES participants. This may be because the NHANES specimens were collected several years before ours when concentrations were likely higher, but it does suggest that diet was not the primary contributor to the serum BDE-209 concentrations in our participants. In addition, PCB-153 concentrations in our participants was lower than in the NHANES specimens. PCB-153 is a stable, persistent contaminant, and exposure to it comes mainly from food [Jakobsson et al. 2002].
Biological Burden of Flame Retardants: Urine
Biomonitoring for phosphate flame retardants is in its early phase [Dodson et al. 2014; Kosarac et al. 2016] and identification of major metabolites and pharmacokinetics are not fully elucidated [Dodson et al. 2014; Kosarac et al. 2016]. However, half-lives of identified flame retardant metabolites appear to be relatively short (hours); therefore, results of urine measurements likely reflect recent exposures [Carignan et al. 2016; Dodson et al. 2014; Hammel et al. 2016; Meeker et al. 2013a]. NHANES has recently released urinary metabolite data for the general population for the years 2013 and 2014 [CDC 2018].
Median urinary concentrations of DPHP (a metabolite of TPHP, used in plastic housings of electronics, among other things) approximately doubled across the shift in participants who performed sorting and shredding during our visit, stayed about the same in participants who
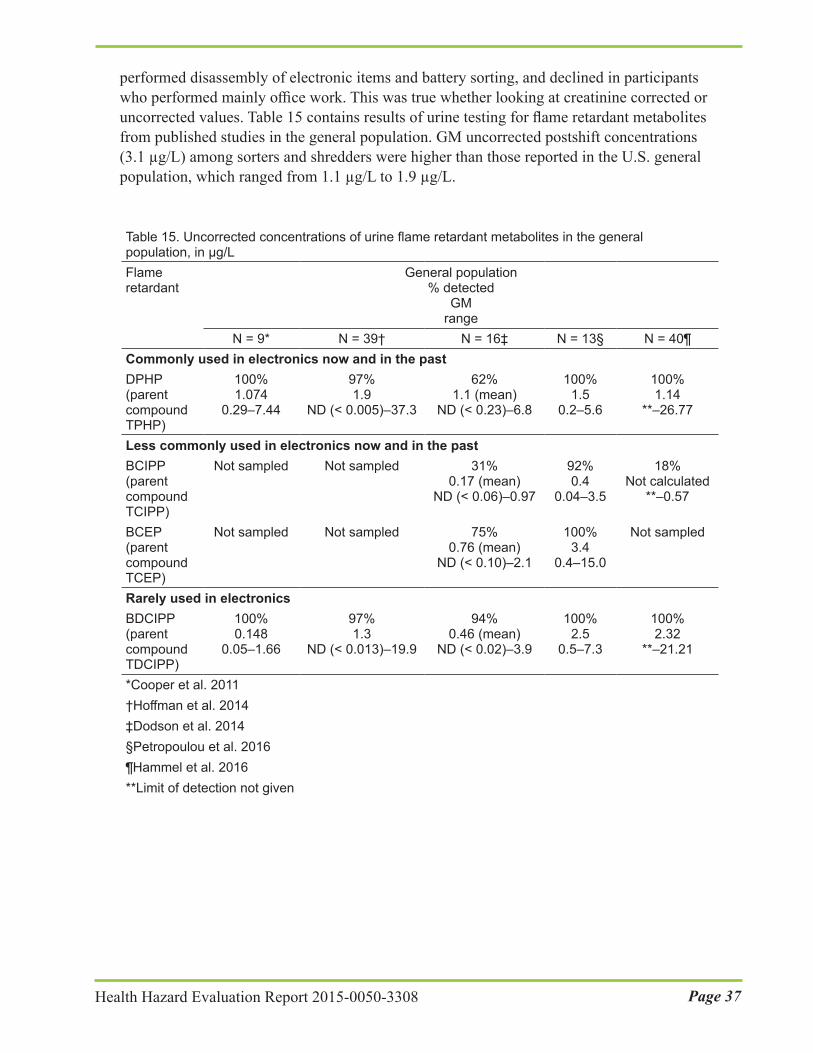
Page 37Health Hazard Evaluation Report 2015-0050-3308
performed disassembly of electronic items and battery sorting, and declined in participants who performed mainly office work. This was true whether looking at creatinine corrected or uncorrected values. Table 15 contains results of urine testing for flame retardant metabolites from published studies in the general population. GM uncorrected postshift concentrations (3.1 µg/L) among sorters and shredders were higher than those reported in the U.S. general population, which ranged from 1.1 µg/L to 1.9 µg/L.
Table 15. Uncorrected concentrations of urine flame retardant metabolites in the general population, in µg/LFlame retardant
General population % detected
GM range
N = 9* N = 39† N = 16‡ N = 13§ N = 40¶Commonly used in electronics now and in the pastDPHP (parent compound TPHP)
100% 1.074
0.29–7.44
97% 1.9
ND (< 0.005)–37.3
62% 1.1 (mean)
ND (< 0.23)–6.8
100% 1.5
0.2–5.6
100% 1.14
**–26.77
Less commonly used in electronics now and in the past BCIPP (parent compound TCIPP)
Not sampled Not sampled 31% 0.17 (mean)
ND (< 0.06)–0.97
92% 0.4
0.04–3.5
18% Not calculated
**–0.57
BCEP (parent compound TCEP)
Not sampled Not sampled 75% 0.76 (mean)
ND (< 0.10)–2.1
100% 3.4
0.4–15.0
Not sampled
Rarely used in electronicsBDCIPP (parent compound TDCIPP)
100% 0.148
0.05–1.66
97% 1.3
ND (< 0.013)–19.9
94% 0.46 (mean)
ND (< 0.02)–3.9
100% 2.5
0.5–7.3
100% 2.32
**–21.21
*Cooper et al. 2011†Hoffman et al. 2014 ‡Dodson et al. 2014§Petropoulou et al. 2016¶Hammel et al. 2016**Limit of detection not given

Page 38 Health Hazard Evaluation Report 2015-0050-3308
Urinary BDCIPP (a metabolite of TDCIPP, whose main use is in polyurethane foam) concentrations either remained about the same or declined across the shift in our participants, despite relatively high hand levels of TDCIPP. The overall GM uncorrected concentrations preshift were 2.43 µg/L and 1.94 µg/L postshift. They were slightly higher than those reported in the U.S. general population, which ranged from 1.3–2.5 µg/L (Table 15). BDCIPP is specific to TDCIPP. No TDCIPP was detected in the air in this evaluation. TDCIPP in dust has been detected at higher levels in vehicles and offices than in homes [Carignan et al. 2013]. Office participants had a large increase in median hand levels of TDCIPP across the shifts, yet GM and median urine concentrations of BDCIPP either remained similar (creatinine corrected) or decreased (uncorrected). This was unexpected considering that animal studies show absorption through the skin and gastrointestinal tract [Nomier et al. 1981]. The half-life of TDCIPP in rats is between 1.5 and 5.4 hours [Nomier et al. 1981], so perhaps urine concentrations of BDCIPP peaked sometime between the end of the shift and the beginning of the next shift because of hand exposure continuing through until the end of the shift.
Urinary BCIPP and BCEP concentrations in our participants were lower than or similar to what has been found in the general population. Urinary TBBA was not detected in any of our samples. One study of 52 U.S. adults reported a GM concentration of 0.0056 µg/L. Because our LOD was 0.05 µg/L, we may have been unable to detect it [Hoffman et al.
A study of gymnasts before and after a 2.5 hour practice demonstrated that GM DPHP concentrations nearly doubled (from 6 to 11 µg/L), and then began to decline between 1 and 3 hours after practice [Carignan et al. 2016]. In addition to its use in electronics products, TPHP is a component of Firemaster 550 (and other flame retardant mixtures), which is used in polyurethane foam. Gymnasts use pits filled with foam blocks and other foam padded equipment to protect them from injury when falling. These levels in gymnasts were much higher than those we found (GM range: ND [< 0.16]–9.17 µg/L).
A study of the relationship between reproductive outcomes in 33 men found a 57% decrease in sperm concentration, a 19% decrease in straight line velocity, a 13% decrease in linearity, and a 38% decrease in inhibin B concentrations in blood for each interquartile increase in urinary DPHP [Meeker et al. 2013a]. Specific gravity corrected urinary DPHP ranged from nondetectable (< 0.06 µg/L) to 9.84 (median 0.27 µg/L, 95th percentile 2.65 µg/L) in the study from which these men were a subset [Meeker et al. 2013b]. Another study found a significant 0.43 µg/dL increase in mean total T4 serum concentrations in individuals with specific gravity corrected urine DPHP concentrations greater than or equal to 2.65 µg/L compared to those with concentrations below 2.65 µg/L [Preston et al. 2017].
TPHP was present in the air in our electronics recycling company in the second highest concentrations, after BDE-209. Median airborne concentrations of TPHP were highest among sorting and shredding participants. All groups of participants had increased median levels of TPHP on their hands postshift, but the difference between the preshift and postshift median levels were highest in sorting and shredding participants. These findings in conjunction with the urinary DPHP findings indicate that exposure to TPHP among shredding and sorting participants during the work shift exceeds background.

Page 39Health Hazard Evaluation Report 2015-0050-3308
2014]. Urinary DoCP and DpCP (metabolites of TCP, which is also used in plastic housings of electronics) were mostly undetectable, despite TCP being present in the third highest GM and median airborne concentrations, after BDE-209 and TPHP. GM and median hand wipe levels of TCP also increased from the preshift to postshift levels for all participants, with the biggest differences and highest concentrations among shipping and receiving, and sorting and shredding. The absence of urinary metabolites could be due to a variety of reasons. Urine may not be an important route of excretion for TCP in humans. Kurebayashi et al. [1985] found that TCP was excreted mainly in the feces (77%) and not the urine (12%) of rats after a single oral dose. In addition, dermal or inhalation absorption may be poor.
Biological Burden of Flame Retardants: Uncertainty Regarding Health Effects
Recognition of the potential adverse effects of exposure to flame retardants is relatively recent, unlike lead, whose effects have been recognized and studied for decades, allowing us to predict health effects based upon the BLL. Some human epidemiologic studies have shown an association between exposure to certain flame retardants and changes in male reproductive hormones, semen quality, thyroid homeostasis, and hormone levels and fertility in women; cryptorchidism (undescended testicles); low birth weight and length; delayed motor skills; decreased IQ; and cancer [Abdallah et al. 2015; Czerska et al. 2013; Dallaire et al. 2009; Dishaw et al. 2014; Grant et al. 2013; Johnson et al. 2013; Meeker and Stapleton 2010; Meeker et al. 2013a,b; van der Veen and de Boer 2012]. However, it is not clear at what levels these effects begin to occur. Studies like this one help us identify populations who have the highest exposure and begin to study health effects in them and will ultimately lead to our ability to predict health effects based upon biological burden.
ConclusionsEmployees at this electronics recycling company are exposed to metals, including lead and cadmium. One employee in the batteries and disassembly area had an overexposure to cadmium. Three employees working in shredding and sorting had elevated BLLs. There is the potential for take-home contamination with lead and other metals. These metals are hazardous, even at low levels. Employees are also exposed to several flame retardants through inhalation and skin contact, especially BDE-209, TPHP, TCP, and DBDPE. The GM serum concentration of BDE-209 was higher than that found in the general population. The median DPHP (a metabolite of TPHP) levels in the urine of participants who worked in the shredding and sorting area doubled from preshift to postshift, and postshift DPHP levels were higher than levels in the general population. We are not able to predict specific health effects based on the levels of flame retardants in employees’ blood and urine. However, we believe that uptake of flame retardants in the body is potentially hazardous to health. Exposures need to be reduced. There is the potential for take-home contamination with cadmium, lead, other metals, and flame retardants.
Page 40 Health Hazard Evaluation Report 2015-0050-3308
RecommendationsOn the basis of our findings, we recommend the actions listed below. We encourage the electronics recycling company to use a labor-management health and safety committee or working group to discuss our recommendations and develop an action plan. Those involved in the work can best set priorities and assess the feasibility of our recommendations for the specific situation at the electronics recycling company.
Our recommendations are based on an approach known as the hierarchy of controls (Appendix C). This approach groups actions by their likely effectiveness in reducing or removing hazards. In most cases, the preferred approach is to eliminate hazardous materials or processes and install engineering controls to reduce exposure or shield employees. Until such controls are in place, or if they are not effective or feasible, administrative measures and PPE may be needed.
Engineering ControlsEngineering controls reduce employees’ exposures by removing the hazard from the process or by placing a barrier between the hazard and the employee. Engineering controls protect employees effectively without placing primary responsibility of implementation on the employee.
1. Discontinue the use of pedestal fans, and consider adding supplemental ventilation for cooling in the warehouse to reduce the amount of re-aerosolization and distribution of metal-containing dusts.
2. Relocate conference and office area air intakes, so that air is brought into these spaces from outdoors rather than from the warehouse. The office and break room should be kept under positive pressure relative to the warehouse, meaning that air flows from the office and break room into the warehouse. In addition, adequate outdoor air should be introduced into the office space, and air from the warehouse should not be entrained into the office air [ANSI/ASHRAE 2016].
3. Install local exhaust ventilation on the small shredder and optical sorter.
Administrative Controls The term administrative controls refers to employer-dictated work practices and policies to reduce or prevent hazardous exposures. Their effectiveness depends on employer commitment and employee acceptance. Regular monitoring and reinforcement are necessary to ensure that policies and procedures are followed consistently.
1. Include all employees in a lead exposure prevention program. Follow the medical surveillance program outlined in Appendix C in addition to all requirements of the OSHA lead standard. Provide employees with the results of their individual BLLs in writing after each blood draw.
2. Provide employees with a lead-removing product to wash their hands when they leave the processing area, and before eating, drinking, or smoking. Learn more about commercially available lead removal products by reading “Information for Workers,
Page 41Health Hazard Evaluation Report 2015-0050-3308
How You Can Keep Yourself and Your Family Safe from Lead” available at http://www.cdc.gov/niosh/topics/lead/safe.html.
3. Prohibit dry sweeping. Use wet cleaning methods or high-efficiency particulate air vacuuming instead.
4. Complete a job hazard assessment (or job hazard analysis) according to the OSHA PPE standard (29 CFR 1910.132) for tasks throughout the processing areas to standardize work practices and determine what PPE will be required for each task. You can find additional information on job hazard analysis at http://www.osha.gov/Publications/osha3071.pdf.
5. Do not permit eating or drinking outside of the breakroom.
6. Provide laundry facilities on-site or contract a laundry service to ensure that contaminated uniforms are not taken home. Laundry personnel should be made aware of the potential exposure to lead and other contaminants on work clothes and take action to minimize potential exposures.
7. Install an employee shower and clean clothes changing room. Separate these areas from the storage room. Design the changing room and shower area so that once employees shower, they cannot re-enter the potentially contaminated changing area. Clean items should be stored in changing rooms separate from areas where contaminated work items are stored.
Personal Protective EquipmentPPE is the least effective means for controlling hazardous exposures. Proper use of PPE requires a comprehensive program and a high level of employee involvement and commitment. The right PPE must be chosen for each hazard. Supporting programs such as training, change-out schedules, and medical assessment may be needed. PPE should not be the sole method for controlling hazardous exposures. Rather, PPE should be used until effective engineering and administrative controls are in place.
1. Provide clean gloves for daily use, or use clean inner gloves when reusing dirty cloth, leather, or cut-resistant gloves. Instruct employees to leave dirty gloves in the work area. Encourage employees to replace dirty gloves frequently to minimize contamination of surfaces with metals.
2. Require employees who voluntarily use disposable filtering facepiece respirators to wear them properly. Guidelines for putting on and taking off a disposable respirator are available at http://www.cdc.gov/niosh/docs/2010-133/pdfs/2010-133.pdf.
3. Require respirators for employees who work in the disassembly and shredder areas until overexposures to cadmium are controlled.
4. Follow the OSHA respiratory protection standard for general industry [29 CFR 1910.134] for a comprehensive respiratory protection program. Information from NIOSH can also help in developing an effective respirator program. See http://www.cdc.gov/niosh/topics/respirators/. A written program should include the

Page 42 Health Hazard Evaluation Report 2015-0050-3308
following elements:
○ written operation procedures
○ appropriate respirator selection
○ employee training
○ effective cleaning of respirators
○ proper storage
○ routine inspection and repair
○ exposure surveillance
○ program review
○ medical approval
○ use of approved respirators
5. Ensure all aspects of the OSHA respiratory protection standard are correctly implemented. These include the following:
○ ensuring that employees are clean shaven when wearing respirators
○ using appropriate fit testing procedures for selected respirators
○ wearing respirators all the time while in work areas of required respirator use
○ developing a formal respirator cartridge change-out schedule to determine if current change-out practices are sufficient

Page 43Health Hazard Evaluation Report 2015-0050-3308
Appendix A: TablesTable A1. Flame retardants sampled during this evaluation and where they are typically foundFlame retardant CAS number Typically found inCommonly used in electronics until around 2004 Octabromodiphenyl ether technical mixture (OctaBDE)
32536-52-0 Acrylonitrile-butadiene-styrene resins and housings for electrical equipment; not used in United States since 2004
Commonly used in electronics until around 2013Decabromodiphenyl ether technical mixture (DecaBDE)
1163-19-5 High impact polystyrene for television and computer monitor housings, polycarbonate and polymer resins, rubber; not used in United States since 2013
Commonly used in electronics now and in the pastTris(phenyl) phosphate (TPHP)
115-86-6 High impact polystyrene and acrylonitrile-butadiene-styrene plastics for electronics housings, printed wiring boards, synthetic resins and decorative laminated sheets, photographic film, plasticizer in lacquers, varnishes, and hot melt adhesives, in roofing paper, component of Firemaster 550 (used as a PentaBDE replacement in foam)
Tricresyl phosphate (TCP) 1330-78-5 Polystyrene and plastics for housings, rubbers, cables, hoses, conveyor belts, waterproofing
Decabromodiphenyl ethane (DBDPE)
84852-53-9 Used as a replacement for DecaBDE) in high impact polystyrene and acrylonitrile-butadiene-styrene plastics for electronics housings, wires and cables, and textiles
1,2-Bis(2,4,6- tribromophenoxy)ethane (BTBPE)
37853-59-1 Firemaster 680 (a replacement for OctaBDE) in high impact polystyrene and acrylonitrile-butadiene-styrene plastics for electronics housings, thermoplastics, elastomers, adhesives and coatings
Tetrabromobisphenol-A (TBBPA)
79-94-7 Printed circuit boards, epoxies, and polycarbonate resins
Less commonly used in electronics now and in the past 2-ethylhexyl 2,3,4,5- tetrabromobenzoate (EH-TBB)
183658-27-7 Firemaster 550 (used as a replacement for PentaBDE in foam), polyvinyl chloride and neoprene, wire and cable insulation, coated fabrics
Bis(2-ethylhexyl) tetrabromophthalate (BEH-TEBP)
26040-51-7 Firemaster 550 (used as a replacement for PentaBDE in foam), also for flexible polyvinyl chloride, wire and cable insulation, film and sheeting, coated fabrics, wall coverings, and adhesives
Tris(chloroethyl) phosphate (TCEP)
115-96-8 Polyester resins, adhesives, and coatings
Tris(2-chloroisopropyl) phosphate (TCIPP)
13674-84-5 Polyurethane rigid and flexible foam, polyvinyl chloride, and epoxy resin, thermosets and thermoplastics, textile finishes
α-, β-, γ Hexabromocyclododecane (α-, β-, γ HBCD)
134237-50-6 134237-51-7 134237-52-8
Polystyrene for building construction, high impact polystyrene for electronics casings, acrylic and latex dispersions (textile backings)
Rarely used in electronicsPentabromodiphenyl ether technical mixture (PentaBDE)
32534-81-9 Polyurethane foam and textiles, so often present in dusts; not used in United States since 2004
Tris(1,3-dichloro-2-propyl) phosphate (TDCIPP)
13674-87-8 Polyurethane foam
CAS = Chemical abstract service

Page 44 Health Hazard Evaluation Report 2015-0050-3308
Table A2. Major congeners of PentaBDE, OctaBDE, and DecaBDE [La Guardia et al. 2006; Alaee et al. 2003]Flame retardant and major congeners
CAS Number Percentage
PentaBDE technical mixture 32534-81-9BDE-99* 60348-60-9 45–49BDE-47* 5436-43-1 38–42BDE-100 189084-64-8 7.5–13BDE-153† 68631-49-2 5.3–4.0BDE-154† 207122-15-4 2.7–4.5BDE-85 182346-21-0 2.2–3.0
OctaBDE technical mixture 32536-52-0BDE-183* 207122-16-5 13–42BDE-209‡ 145538-75-5 1.3–50
DecaBDE technical mixture 1163-19-5BDE-209 145538-75-5 97–98BDE-206§ 63387-28-0 low
*These congeners are used as markers for their parent chemicals.†These can also be components of OctaBDE.‡Photolytic debromination of BDE-209 can form BDE-183 [Stapleton and Dodder 2008].§This is also a breakdown product of BDE-209.

Page 45Health Hazard Evaluation Report 2015-0050-3308
Table A3. Results of personal air samples for metals (in µg/m3) collected over three days for 15 employees (n = 45)Metal Median GM (range) Lowest OEL AgencyAluminum 14 11.9 (1.5–87) 10,000 NIOSHAntimony 0.021 0.0600 (0.020–1.9) 500 OSHA/NIOSH/ACGIHBarium 2.5 3.10 (0.36–27) 400 OSHA/NIOSH/ACGIHBeryllium 0.010 0.0100 (0.010–0.020) 0.05 ACGIHCadmium 0.082 0.0890 (0.01–6.4)* 5 OSHAChromium 0.15 0.238 (0.15–1.2) 500 NIOSH/ACGIHCobalt 0.30 0.401(0.30–2.0) 20 ACGIHCopper 2.2 2.55 (0.23–23) 1,000 NIOSH/OSHA/ACGIHIndium 0.22 0.254 (0.22–2.5) 100 NIOSH/ACGIHIron 37 36.4 (4.0–550) 5,000 N/ALead 1.7 1.91 (0.060–19) 50 OSHA/NIOSH/ACGIHManganese 1.03 1.53 (0.13–45) 100 ACGIHNeodymium 0.20 0.254 (0.06–3.5) 100 N/ANickel 0.52 0.596 (0.06–5.4) 15 NIOSHPotassium 2.6 2.63 (0.79–14) 2,000 N/ASilver 0.13 0.163 (0.01–1.8) 10 OSHA/NIOSHTin 1.4 1.87 (0.01–17) 2,000 OSHA/NIOSH/ACGIHYttrium 1.4 1.35 (0.2–16) 1,000 OSHA/NIOSH/ACGIHZinc 9.7 10.8 (1.1–220) 5,000 NIOSHACGIH = American Conference of Governmental Industrial HygienistsN/A = not applicable*One employee, working in batteries and disassembly, was overexposed to cadmium.

Page 46 Health Hazard Evaluation Report 2015-0050-3308
Table A4a. Size-selective area air samples results for metals, in µg/m3
Cut point (µm) Location Beryllium Cadmium Indium Lead Manganese0.25 Office ND ND ND ND [0.0042]0.44 ND ND ND ND [0.0058]0.77 ND [0.0033] ND 0.085 0.0421.4 ND [0.0017] ND 0.054 0.0192.5 ND [0.0012] ND 2.0 [0.0065]10 ND ND ND ND 0.00960.25 Processing ND 0.10 0.39 3.7 9.80.44 ND 0.024 0.13 0.94 2.00.77 ND 0.017 0.14 0.86 1.11.4 ND [0.0039] ND 0.18 0.182.5 ND ND ND 0.067 0.06710 ND ND ND ND 0.014ND = not detected above the MDC (not shown)Note: total run time and sample volume was 260 minutes and 26,000 liters for the background sample and 255 minutes and 25,500 liters for the processing sample.[ ] = Concentrations in brackets are between the minimum detectable and minimum quantifiable concentration (not shown). This means there is more uncertainty associated with this value.
Table A4b. Size-selective area air samples results for metals, in µg/m3 (continued)Cut point (µm) Location Neodymium Nickel Silver Tin Titanium0.25 Office ND ND ND ND [0.0014]0.44 ND [0.0042] ND ND [0.0013]0.77 ND 0.014 0.0054 0.039 0.0121.4 ND [0.0085] [0.0028] 0.019 0.00772.5 ND [0.0088] ND ND 0.005010 ND [0.0058] [0.0021] ND 0.00180.25 Processing 0.94 1.5 0.47 3.1 0.980.44 0.16 0.28 0.075 0.82 0.220.77 0.13 0.18 0.047 0.67 0.211.4 0.027 0.030 0.0082 0.12 0.0382.5 ND [0.012] [0.0033] 0.05 0.01510 ND ND ND ND 0.0030ND = not detected above the MDC (not shown)Note: total run time and sample volume was 260 minutes and 26,000 liters for the background sample and 255 minutes and 25,500 liters for the processing sample.[ ] = Concentrations in brackets are between the minimum detectable and minimum quantifiable concentration (not shown). This means there is more uncertainty associated with this value.

Page 47Health Hazard Evaluation Report 2015-0050-3308
Table A6. Comparing selected PCBs found in the blood of electronics recycling employees with the National Health and Nutrition Examination Survey for the general population, in ng/g lipid weightPolychlorinated biphenyl
Electronics recycling company participants
(n = 11)
National Health and Nutrition Examination Survey
(2003–2004)Median GM Maximum Median GM 95th
percentilePolychlorinated biphenyl 28
14.7 12.3 19.7 4.98 4.88 11.1
Polychlorinated biphenyl 66
3.41 2.76 4.99 1.40 1.42 4.20
Polychlorinated biphenyl 74
3.21 2.87 6.47 5.00 5.38 24.1
Polychlorinated biphenyl 99
2.40 2.44 10.4 4.08 4.52 18.6
Polychlorinated biphenyl 153
10.6 10.2 62.1 24.2 23.7 101
Polychlorinated biphenyl 156
0.994 1.18 10.9 4.10 3.31 16.8
Polychlorinated biphenyl 170
1.99 2.19 20.0 7.83 6.86 29.5
Polychlorinated biphenyl 180
4.81 5.18 44.9 21.5 19.0 88.0
Polychlorinated biphenyl 187
2.49 2.67 17.3 5.71 5.20 25.9
Table A5. Comparing selected PPs found in the blood of electronics recycling employees with the National Health and Nutrition Examination Survey for the general population, in ng/g lipid weightPersistent pesticide Electronics recycling
company participants (n = 11)
National Health and Nutrition Examination Survey
(2003–2004)Median GM Maximum Median GM 95th
percentilePolybrominated biphenyl 153
0.892 1.05 6.55 2.50 2.72 34.6
Hexachlorobenzene 7.92 8.52 16.8 15.1 15.5 29.0Beta- hexachlorocyclohexane
1.81 1.85 3.91 ND 7.89 62.2
Oxychlordane 3.09 3.43 19.6 11.4 10.6 39.2Trans-nonchlor 5.06 6.65 31.5 17.3 16.9 74.7p,p’-dichlorodiphenyl trichloroethene
82.5 76.1 211 233 268 1,990
o,p’-dichlorodiphenyl trichloroethane
1.73 1.71 4.77 Not reported
ND ND
p,p’-dichlorodiphenyl trichloroethane
1.91 2.22 7.74 Not reported
ND 20.7

Page 48 Health Hazard Evaluation Report 2015-0050-3308
Table A7. Uncorrected concentrations or flame retardant metabolites in urine of electronics recycling employees and in the National Health and Nutrition Examination Survey, in µg/L. Samples are the third day of sampling, post-shift values.
Electronics recycling company participants (n = 14)
National Health and Nutrition Examination Survey*
Median GM† Max Median GM 95th percentile
Commonly used in electronics now and in the pastDPHP (TPHP) LOD = 0.16
1.6 1.8 7.1 0.73 0.76 5.5
DpCP (TCP) LOD = 0.05
ND ND 0.21 ND Not calculated
0.10
DoCP (TCP)‡ LOD = 0.05
ND ND ND ND ND ND
Less commonly used in electronics now and in the pastTBBA (EH-TBB) LOD = 0.05
ND ND ND ND ND ND
BCEP (TCEP) LOD = 0.08
0.57 0.54 1.5 0.37 0.39 3.6
BCIPP (TCIPP) LOD = 0.10
ND ND 0.84 0.16 0.19 1.3
Rarely used in electronicsBDCIPP (TDCIPP) LOD = 0.11
1.9 2.1 11 0.85 0.82 6.4
*Age 20 to 59, n = 1266, samples taken 2013 and 2014†GM not calculated if proportion of results below the limit of detection was too high to provide a valid result.‡n = 13 for this compound
Table A8. Creatinine corrected concentrations or flame retardant metabolites in urine of electronics recycling employees and in the National Health and Nutrition Examination Survey, in µg/g creatinine. Samples are the third day of sampling, post-shift values
Electronics recycling company participants (n = 14)
National Health and Nutrition Examination Survey*
Median GM† Max Median GM 95th percentile
Commonly used in electronics now and in the pastDPHP (TPHP) 1.3 1.1 3.1 0.70 0.79 4.7DpCP (TCP) ND ND 0.09 ND Not
calculated0.18
DoCP (TCP)‡ ND ND ND ND ND NDLess commonly used in electronics now and in the pastTBBA (EH-TBB) ND ND ND ND ND NDBCEP (TCEP) 0.35 0.32 0.66 0.33 0.41 3.3BCIPP (TCIPP) ND ND 0.45 0.18 0.20 1.3Rarely used in electronicsBDCIPP (TDCIPP) 1.0 1.2 7.0 0.82 0.85 4.3*Age 20 to 59, n = 1266, samples taken 2013 and 2014†GM not calculated if proportion of results below the limit of detection was too high to provide a valid result.‡n = 13 for this compound

Page 49Health Hazard Evaluation Report 2015-0050-3308
Appendix B: Hand Wipe Sampling Pilot StudyWe selected 12 processing employees from the disassembly, shredding, and battery sorting departments. We sampled their hands after their shift was over, but before they had washed their hands. We sampled six employees using sterile gauze wipes and six employees using twill wipes. Each group of employees included an even representation from the production departments. We presoaked two, 3 inch by 3 inch gauze pads or twill wipes in approximately 6 ml of laboratory grade 99% isopropyl alcohol and placed them in a glass vial [Carignan et al. 2013]. We opened the glass vial, and asked the employee to take one wipe and wipe both palms from wrist to fingertips for 30 seconds, then place it back into the same glass vial. We then asked the employee to take the second wipe and repeat the process for the back of both hands and again place the wipe into the same glass vial. We sealed the vial with its lid and Parafilm®. Each employee performed this procedure three times, using new wipes and glass vials each time. We put on a new, clean pair of nitrile gloves during each step of the hand wipe sampling process to avoid cross contamination. For the 12 participants, we determined the percentage of 19 of the 24 individual flame retardants removed by each of the three sequential hand wipes by first summing the total amount removed and then dividing the amount removed on the first wipe, second wipe and the third wipe, by the total. We only included data for the participants that had all three sequential measures for a given flame retardant.

Page 50 Health Hazard Evaluation Report 2015-0050-3308
Appendix C: Occupational Exposure Limits and Health EffectsNIOSH investigators refer to mandatory (legally enforceable) and recommended OELs for chemical, physical, and biological agents when evaluating workplace hazards. OELs have been developed by federal agencies and safety and health organizations to prevent adverse health effects from workplace exposures. Generally, OELs suggest levels of exposure that most employees may be exposed to for up to 10 hours per day, 40 hours per week, for a working lifetime, without experiencing adverse health effects. However, not all employees will be protected if their exposures are maintained below these levels. Some may have adverse health effects because of individual susceptibility, a pre-existing medical condition, or a hypersensitivity (allergy). In addition, some hazardous substances act in combination with other exposures, with the general environment, or with medications or personal habits of the employee to produce adverse health effects. Most OELs address airborne exposures, but some substances can be absorbed directly through the skin and mucous membranes.
Most OELs are expressed as a time-weighted average (TWA) exposure. A TWA refers to the average exposure during a normal 8- to 10-hour workday. Some chemical substances and physical agents have recommended short-term exposure limit (STEL) or ceiling values. Unless otherwise noted, the STEL is a 15-minute TWA exposure. It should not be exceeded at any time during a workday. The ceiling limit should not be exceeded at any time.
In the United States, OELs have been established by federal agencies, professional organizations, state and local governments, and other entities. Some OELs are legally enforceable limits; others are recommendations.
● The U.S. Department of Labor OSHA permissible exposure limits (PELs) (29 CFR 1910 [general industry]; 29 CFR 1926 [construction industry]; and 29 CFR 1917 [maritime industry]) are legal limits. These limits are enforceable in workplaces covered under the Occupational Safety and Health Act of 1970.
● NIOSH RELs are recommendations based on a critical review of the scientific and technical information and the adequacy of methods to identify and control the hazard. NIOSH RELs are published in the NIOSH Pocket Guide to Chemical Hazards [NIOSH 2010]. NIOSH also recommends risk management practices (e.g., engineering controls, safe work practices, employee education/training, PPE, and exposure and medical monitoring) to minimize the risk of exposure and adverse health effects.
● Another set of OELs commonly used and cited in the United States is the ACGIH threshold limit values (TLVs). The TLVs are developed by committee members of this professional organization from a review of the published, peer-reviewed literature. TLVs are not consensus standards. They are considered voluntary exposure guidelines for use by industrial hygienists and others trained in this discipline “to assist in the control of health hazards” [ACGIH 2018].
Page 51Health Hazard Evaluation Report 2015-0050-3308
Outside the United States, OELs have been established by various agencies and organizations and include legal and recommended limits. The Institut für Arbeitsschutz der Deutschen Gesetzlichen Unfallversicherung (Institute for Occupational Safety and Health of the German Social Accident Insurance) maintains a database of international OELs from European Union member states, Canada (Québec), Japan, Switzerland, and the United States. The database, available at http://www.dguv.de/ifa/GESTIS/GESTIS-Internationale-Grenzwerte-für-chemische-Substanzen-limit-values-for-chemical-agents/index-2.jsp, contains international limits for more than 2,000 hazardous substances and is updated periodically.
OSHA requires an employer to furnish employees a place of employment free from recognized hazards that cause or are likely to cause death or serious physical harm [Occupational Safety and Health Act of 1970 (Public Law 91–596, sec. 5(a)(1))]. This is true in the absence of a specific OEL. It also is important to keep in mind that OELs may not reflect current health-based information.
When multiple OELs exist for a substance or agent, NIOSH investigators generally encourage employers to use the lowest OEL when making risk assessment and risk management decisions. NIOSH investigators also encourage use of the hierarchy of controls approach to eliminate or minimize workplace hazards. This includes, in order of preference, the use of (1) substitution or elimination of the hazardous agent, (2) engineering controls (e.g., local exhaust ventilation, process enclosure, dilution ventilation), (3) administrative controls (e.g., limiting time of exposure, employee training, work practice changes, medical surveillance), and (4) PPE (e.g., respiratory protection, gloves, eye protection, hearing protection). Control banding, a qualitative risk assessment and risk management tool, is a complementary approach to protecting employee health. Control banding focuses on how broad categories of risk should be managed. Information on control banding is available at http://www.cdc.gov/niosh/topics/ctrlbanding/. This approach can be applied in situations where OELs have not been established or can be used to supplement existing OELs.
Flame RetardantsFlame retardants are added to manufactured materials, surface finishes, and coatings to inhibit, suppress, or delay the production of flames and impede the spread of fire. In 1975, California Technical Bill 117 required that upholstered furniture filling, which is usually polyurethane foam, meet an open flame test. Manufacturers added chemical flame retardants to foam to meet this standard. While the standard only applied in California, manufacturers sold Technical Bill 117-compliant products across the North America to avoid having double inventory and to minimize liability. California updated the standard in 2014 (TB117-2013). While it does not ban flame retardants, flammability safety standards can now be met without them.
PBDEs were used in a variety of products from the 1980s until recently. All PBDEs have a common structure of brominated diphenyl ether molecules with 1–10 bromine atoms attached. PBDEs have 209 different structural variations possible [Lorber 2008]. The manufacturing and import of the PentaBDE and OctaBDE formulations were phased out in 2004 in the United States, and the production of DecaBDE ended in 2013. Manufacturers

Page 52 Health Hazard Evaluation Report 2015-0050-3308
of flame retardants have introduced replacements for the PBDEs, but the toxicity of the replacements has not been well characterized [Allen et al. 2013]. These replacement compounds include novel brominated flame retardants like EH-TBB and BEH-TEBP, and phosphorus flame retardants like TDCIPP and TPHP.
PBDEs have a molecular structure similar to thyroid hormones [McDonald 2002]. Some human epidemiologic studies have shown an association between exposure to PBDEs and changes in male reproductive hormones, semen quality, thyroid homeostasis, and hormone levels and fertility in women; cryptorchidism (undescended testicles); low birth weight and length; delayed motor skills; and decreased IQ [Abdallah et al. 2015; Czerska et al. 2013; Dallaire et al. 2009; Dishaw et al. 2014; Grant et al. 2013].
TPHP, BEH-TEBP, EH-TBB and isopropylated triphenyl phosphate isomers are components of Firemaster 550, which appears to be the second most common flame retardant mixture currently applied to foam, after TDCIPP [Hoffman et al. 2014]. Studies indicate that BEH-TEBP may affect thyroid hormones [Johnson et al. 2013]. TCEP and TCIPP are also used in some polyurethane foam. Some phosphorus flame retardants have been associated with decreased fertility, reduced sperm motility, altered reproductive and thyroid hormones, and cancer in humans [Dishaw et al. 2014; Meeker and Stapleton 2010; Meeker et al. 2013a,b; van der Veen and de Boer 2012].
Exposure to flame retardants in indoor environments like homes, schools, and offices is thought to be mainly from ingestion of dust, primarily during the transfer of the flame retardants from hands to mouth, with dermal absorption the next most important route of exposure [Abdallah et al. 2015]. In contrast, a recent study estimated that inhalation exposure exceeded intake from ingestion of some chlorinated organophosphate flame retardants [Scheder et al. 2015]. Experimental data using human skin equivalent tissue demonstrates that absorption through skin increased as the number of bromine atoms decreased for PBDEs [Abdallah et al. 2015]. Animal studies show that TDCIPP is easily absorbed through the skin and gastrointestinal tract [Nomeir et al. 1981], and recent studies of human ex vivo skin showed absorption of 28% for TCEP, 25% for TCIPP, and 13% for TDCIPP [Abdallah et al. 2016].
Only two of the flame retardants have OSHA PELs, TPHP and TCP. The OSHA PEL for TPHP is 3,000,000 ng/m3 (3 mg/m3) while the PEL for tri-o-cresyl phosphate (one of the isomers of TCP) is 100,000 ng/m3 (0.1 mg/m3). The NIOSH REL and ACGIH TLV for TPHP are also 3 mg/m3. The NIOSH REL and ACGIH TLV are also 0.1 mg/m3. In addition, ATSDR [2013] recommends that if dust levels of PentaBDE and OctaBDE exceed 5,000,000 ng/m3 (5 mg/m3) then periodic air monitoring should be required.
LeadInorganic lead is a naturally occurring, soft metal that has been mined and used in industry since ancient times. It comes in many forms (e.g., lead acetate, lead chloride, lead chromate, lead nitrate, lead oxide, lead phosphate, and lead sulfate). Lead is considered toxic to all organ systems and serves no useful purpose in the body.

Page 53Health Hazard Evaluation Report 2015-0050-3308
Occupational exposure to inorganic lead occurs via inhalation of lead-containing dust and fume and ingestion of lead particles from contact with lead-contaminated surfaces. Exposure may also occur through transfer of lead to the mouth from contaminated hands or cigarettes when careful attention to hygiene, particularly hand washing, is not practiced. In addition to the inhalation and ingestion routes of exposure, lead can be absorbed through the skin, particularly through damaged skin [Filon et al. 2006; Stauber et al. 1994; Sun et al. 2002].
Workplace settings with exposure to lead and lead compounds include smelting and refining, scrap metal recovery, automobile radiator repair, construction and demolition (including abrasive blasting), and firing ranges. Occupational exposures also occur among workers who apply or remove lead-based paint and among welders who burn or torch-cut metal structures.
Blood Lead Levels
In most cases, an individual’s blood lead level is a good indication of recent exposure to lead because the half-life of lead (the time interval it takes for the quantity in the body to be reduced by half its initial value) is 1–2 months [CDC 2013a; Lauwerys and Hoet 2001; Moline and Landrigan 2005]. Most lead in the body is stored in the bones, with a half-life of years to decades. Measuring bone lead, however, is primarily done only for research. Elevated zinc protoporphyrin levels have also been used as an indicator of chronic lead intoxication; however, other factors, such as iron deficiency, can cause an elevated zinc protoporphyrin level, so monitoring the BLL over time is more specific for evaluating chronic occupational lead exposure.
BLLs in adults in the United States have declined consistently over time. The GM BLL went from 1.75 µg/dL of whole blood in 1999–2000 to 1.09 µg/dL in 2011–2012 [CDC 2015b]. The NIOSH Adult Blood Lead Epidemiology and Surveillance System uses a surveillance case definition for an elevated BLL in adults of 5 µg/dL of blood or higher [CDC 2015a]. Very high BLLs are defined as being ≥ 40 µg/dL. From 2002–2011, occupational exposures accounted for 91% of adults with very high BLLs (where exposure source was known) [CDC 2013b]. This underscores the need to increase efforts to prevent lead exposures in the workplace.
Occupational Exposure Limits
In the United States, employers in general industry are required by law to follow the OSHA lead standard (29 CFR 1910.1025). This standard was established in 1978 and has not yet been updated to reflect the current scientific knowledge regarding the health effects of lead exposure.
Under this standard, the OSHA PEL for airborne exposure to lead is 50 µg/m3 of air for an 8-hour TWA. The standard requires lowering the PEL for shifts that exceed 8 hours, medical monitoring for employees exposed to airborne lead at or above the action level of 30 µg/m3 (8-hour TWA), medical removal of employees whose average BLL is 50 µg/dL or greater, and economic protection for medically removed workers. Medically removed workers cannot return to jobs involving lead exposure until their BLL is below 40 µg/dL.
In the United States, other guidelines for lead exposure, which are not legally enforceable, are often followed. Similar to the OSHA lead standard, these guidelines were set years ago and have not yet been updated to reflect current scientific knowledge. NIOSH has a REL for
Page 54 Health Hazard Evaluation Report 2015-0050-3308
lead of 50 µg/m3 averaged over an 8-hour work shift [NIOSH 2010]. ACGIH has a TLV for lead of 50 µg/m3 (8-hour TWA), with worker BLLs to be controlled to, or below, 20 µg/dL. ACGIH designates lead as an animal carcinogen [ACGIH 2018]. In 2013, the California Department of Public Health recommended that Cal/OSHA lower the PEL for lead to 0.5 to 2.1 µg/m3 (8-hour TWA) to keep BLLs below the range of 5 to 10 µg/dL [Billingsley 2013].
Neither NIOSH nor OSHA has established surface contamination limits for lead in the workplace. The U.S. Environmental Protection Agency and the U.S. Department of Housing and Urban Development limit lead on surfaces in public buildings and child-occupied housing to less than 40 micrograms of lead per square foot [EPA 1998; HUD 2012]. OSHA requires in its substance-specific standard for lead that all surfaces be maintained as free as practicable of accumulations of lead [29 CFR 1910.1025(h)(1)]. An employer with workplace exposures to lead must implement regular and effective cleaning of surfaces in areas such as change areas, storage facilities, and lunchroom/eating areas to ensure they are as free as practicable from lead contamination.
Health Effects
The PEL, REL, and TLV may prevent overt symptoms of lead poisoning, but do not protect workers from lead’s contributions to conditions such as hypertension, renal dysfunction, and reproductive and cognitive effects [Brown-Williams et al. 2009; Holland and Cawthorn 2016; Institute of Medicine 2012; Schwartz and Hu 2007; Schwartz and Stewart 2007]. Generally, acute lead poisoning with symptoms has been documented in persons having BLLs above 70 µg/dL. These BLLs are rare today in the United States, largely as a result of workplace controls put in place to comply with current OELs. When present, acute lead poisoning can cause myriad adverse health effects including abdominal pain, hemolytic anemia, and neuropathy. Lead poisoning has, in very rare cases, progressed to encephalopathy and coma [Moline and Landrigan 2005].
People with chronic lead poisoning, which is more likely at current occupational exposure levels, may not have symptoms or they may have nonspecific symptoms that may not be recognized as being associated with lead exposure. These symptoms include headache, joint and muscle aches, weakness, fatigue, irritability, depression, constipation, anorexia, and abdominal discomfort [Moline and Landrigan 2005].
The National Toxicology Program recently released a monograph on the health effects of low-level lead exposure [National Toxicology Program 2012]. For adults, the National Toxicology Program concluded the following about the evidence regarding health effects of lead (Table C1).

Page 55Health Hazard Evaluation Report 2015-0050-3308
Various organizations have assessed the relationship between lead exposure and cancer. According to the Agency for Toxic Substances and Disease Registry [ATSDR 2007] and the National Toxicology Program [NTP 2011], inorganic lead compounds are reasonably anticipated to cause cancer in humans. The International Agency for Research on Cancer classifies inorganic lead as probably carcinogenic to humans [IARC 2006a]. According to the American Cancer Society [ACS 2011], some studies show a relationship between lead exposure and lung cancer, but these results might be affected by exposure to cigarette smoking and arsenic. Some studies show a relationship between lead and stomach cancer, and these findings are less likely to be affected by the other exposures. The results of studies looking at other cancers, including brain, kidney, bladder, colon, and rectum, are mixed.
Table C1. Evidence regarding health effects of lead in adultsHealth area NTP
conclusionPrincipal health effects Blood lead
evidenceNeurological Sufficient Increased incidence of essential tremor Yes, < 10 µg/dL
Limited Psychiatric effects, decreased hearing, decreased cognitive function, increased
incidence of amyotrophic lateral sclerosis
Yes, < 10 µg/dL
Limited Increased incidence of essential tremor Yes, < 5 µg/dLImmune Inadequate UnclearCardiovascular Sufficient Increased blood pressure and increased risk
of hypertensionYes, < 10 µg/dL
Limited Increased cardiovascular-related mortality and electrocardiography abnormalities
Yes, < 10 µg/dL
Renal Sufficient Decreased glomerular filtration rate Yes, < 5 µg/dLReproductive Sufficient Women: reduced fetal growth Yes, < 5 µg/dL
Sufficient Men: adverse changes in sperm parameters and increased time to pregnancy
Yes, ≥ 15–20 µg/dL
Limited Women: increase in spontaneous abortion and preterm birth
Yes, < 10 µg/dL
Limited Men: decreased fertility Yes, ≥ 10 µg/dLLimited Men: spontaneous abortion Yes, ≥ 31 µg/dL
Inadequate Women and Men: stillbirth, endocrine effects, birth defects
Unclear

Page 56 Health Hazard Evaluation Report 2015-0050-3308
Medical Management
To prevent acute and chronic health effects, a panel of experts convened by the Association of Occupational and Environmental Clinics published guidelines for the management of adult lead exposure [Kosnett et al. 2007]. The panel recommended BLL testing for all lead-exposed employees, regardless of the airborne lead concentration. These recommendations do not apply to pregnant women, who should avoid BLLs > 5 µg/dL. Removal from lead exposure should be considered if control measures over an extended period do not decrease BLLs to < 10 µg/dL or an employee has a medical condition that would increase the risk of adverse health effects from lead exposure. These guidelines were endorsed by the Council of State and Territorial Epidemiologists and the California Department of Public Health in 2009 and the American College of Occupational and Environmental Medicine in 2010 [ACOEM 2010; CDPH 2009; CSTE 2009]. The Council of State and Territorial Epidemiologists published updated guidelines in 2013 to reflect the new definition of an elevated BLL in adults of 5 µg/dL [CSTE 2015]. The California Department of Public Health recommended keeping BLLs below 5 to 10 µg/dL in 2013 [Billingsley 2013] and updated their medical management guidelines in 2014 [CDPH 2014]. In 2015, NIOSH designated 5 µg/dL of whole blood, in a venous blood sample, as the reference blood lead level for adults. An elevated BLL is defined as a BLL ≥ 5 µg/dL. In 2016, the American College of Occupational and Environmental Medicine released a position statement entitled “Workplace Lead Exposure,” which reinforces the guidelines and recommendations above [Holland and Cawthorn 2016]. Table C2 incorporates recommendations from the expert panel guidelines and those from CDPH, ACOEM, and CSTE.

Page 57Health Hazard Evaluation Report 2015-0050-3308
Table C2. Health-based medical surveillance recommendations for lead-exposed employeesCategory of exposure RecommendationsAll lead exposed workers ● Baseline or preplacement medical history and physical
examination, baseline BLL, and serum creatinineBLL < 5 µg/dL ● BLL monthly for first 3 months placement, or upon change in
task to higher exposure, then BLL every 6 months; if BLL increases ≥ 5 µg/dL, evaluate exposure and protective measures, and increase monitoring if indicated
BLL 5–9 µg/dL ● Discuss health risks● Minimize exposure● Consider removal for pregnancy and certain medical conditions● BLL monthly for first 3 months placement or every 2 months for
the first 6 months placement, or upon change in task to higher exposure, then BLL every 6 months; if BLL increases ≥ 5 µg/dL, evaluate exposure and protective measures, and increase monitoring if indicated
BLL 10–19 µg/dL ● Discuss health risks● Decrease exposure● Remove from exposure for pregnancy● Consider removal for certain medical conditions or BLL > 10 µg/dL
for extended period● BLL every 3 months; evaluate exposure, engineering controls, and
work practices; consider removal. ● Revert to BLL every 6 months after 3 BLLs < 10 µg/dL
BLL 20–29 µg/dL ● Remove from exposure for pregnancy● Remove from exposure if repeat BLL measured in 4 weeks
remains ≥ 20 µg/dL● Annual lead medical exam recommended● Monthly BLL testing● Consider return to work after 2 BLLs < 15 µg/dL a month apart,
then monitor as aboveBLL 30–49 µg/dL ● Remove from exposure
● Prompt medical evaluation● Monthly BLL testing● Consider return to work after 2 BLLs < 15 µg/dL a month apart,
then monitor as aboveBLL 50–79 µg/dL ● Remove from exposure
● Prompt medical evaluation● Consider chelation with significant symptoms
BLL > 80 µg/dL ● Remove from exposure● Urgent medical evaluation● Chelation may be indicated
Adapted from Kosnett et al. 2007, CSTE 2015, and CDPH 2014

Page 58 Health Hazard Evaluation Report 2015-0050-3308
Take-home Contamination
Occupational exposures to lead can result in exposures to household members, including children, from take-home contamination. Take-home contamination occurs when lead dust is transferred from the workplace on employees’ skin, clothing, shoes, and other personal items to their vehicle and home [CDC 2009, 2012].
The Centers for Disease Control and Prevention considers a BLL in children of 5 µg/dL or higher as a reference level above which public health actions should be initiated, and states that no safe BLL in children has been identified [CDC 2013a].
The U.S. Congress passed the Workers’ Family Protection Act in 1992 (29 U.S.C. 671a). The Act required NIOSH to study take-home contamination from workplace chemicals and substances, including lead. NIOSH found that take-home exposure is a widespread problem [NIOSH 1995]. Workplace measures effective in preventing take-home exposures were (1) reducing exposure in the workplace, (2) changing clothes before going home and leaving soiled clothing at work for laundering, (3) storing street clothes in areas separate from work clothes, (4) showering before leaving work, and (5) prohibiting removal of toxic substances or contaminated items from the workplace. NIOSH noted that preventing take-home exposure is critical because decontaminating homes and vehicles is not always effective. Normal house cleaning and laundry methods are inadequate, and decontamination can expose the people doing the cleaning and laundry.
Beryllium, Cadmium, Chromium, Nickel, Manganese, and CobaltBelow, Table C3 summarizes the OELs for the other common metals found in electronic recycling, as well as a discussion of the potential health effects from exposure to these elements.

Page 59Health Hazard Evaluation Report 2015-0050-3308
Table C3. Chemical health effectsChemicals Health effects IARC OEL (µg/m3)Beryllium ● Beryllium exposure may cause
dermatitis, lung inflammation, and chronic beryllium disease in humans [Proctor et al. 1991]
● Exposure to beryllium can lead to sensitization
● Exposure also slightly increases the risk for lung cancer [Schubauer-Berigan et al. 2010]
Group 1: carcinogenic to humans
[IARC 2012]
OSHA PEL: 2.0NIOSH REL: 0.5ACGIH TLV: 0.05
Cadmium ● Long-term occupational exposure to cadmium is associated with increased occurrence of lung cancer, kidney damage, and chronic obstructive lung disease [WHO 1992]
Group 1: carcinogenic to humans
[IARC 2012]
OSHA PEL: 5.0NIOSH REL: Cancer
ACGIH TLV: 10 (2 respirable fraction)
Chromium ● The toxic effects of chromium exposure, including lung and nasal cancer, are primarily related to hexavalent chromium
● Skin exposure to chromium dust can cause skin irritation and skin ulceration, and allergic contact dermatitis
Group 1: carcinogenic to humans
[IARC 2012]
OSHA PEL: 1,000NIOSH REL: 500ACGIH TLV: 500
Nickel ● Allergic contact dermatitis, respiratory irritation, chronic bronchitis, asthma, reduced lung function
Nickel compounds,
Group 1: carcinogenic to
humans; paranasal
sinus, nasal cavity, and lung
OSHA PEL: 1,000NIOSH REL: 15
ACGIH TLV: 1,500
Manganese ● Subclinical neurological effects, such as decreased performance on neurobehavioral tests; significantly poorer eye-hand coordination, hand steadiness, and reaction time; poorer postural stability; and lower levels of cognitive flexibility
None OSHA PEL: 5,000NIOSH REL: 1,000ACGIH TLV: 100
Cobalt ● Exposure to elevated levels of cobalt can cause gastrointestinal irritation, nausea, and vomiting
● Inhaled cobalt can lead to lung damage
● Skin exposure can cause irritant and allergic contact dermatitis [Vincoli 1997]
Group 2B: possibly
carcinogenic to humans
[IARC 2006b]
OSHA PEL: 100NIOSH REL: 50ACGIH TLV: 20
IARC = International Agency for Research on Cancer

Page 60 Health Hazard Evaluation Report 2015-0050-3308
Indium and Indium NanoparticlesNanotechnology is the manipulation of matter on a near-atomic scale to product new structures, materials, and devices. Nanomaterials or nano-objects are defined according to ISO/TS 27687:2008 as material with one, two, or three external dimensions in the size range of approximately 1–100 nanometers (nm), or 1,000 times smaller than a micrometer. This includes engineered nanomaterials and ultrafine particles. Engineered nanomaterials are intentionally produced nanomaterials, whereas ultrafine particles or incidental nanoparticles are typically byproducts of processes such as combustion or vaporization [NIOSH 2009b]. Nanomaterials may have properties that are different from those of larger particles of the same material, which makes them unique and desirable for specific product applications. Nanomaterials have greater surface-area-to-mass ratios when compared to larger particles of the same material. This and other properties such as size, surface area, shape, chemistry, solubility, agglomeration, and biopersistence makes them generally more reactive than their larger-sized counterparts, and may increase their toxicity [NIOSH 2014b]. Engineered nanomaterials and ultrafine particles are a health concern because recent studies have shown that the toxicity of these ultrafine or engineered nanoparticles is greater than that of the same mass of larger particles of similar chemical composition [NIOSH 2009b].
Indium, including indium oxide, indium tin oxide and particularly indium nanoparticles, are widely used as a thin coating or conductive film on touch screens, flat panel displays such as LCD televisions, computer screens, solar panels, and aircraft and automobile windows [National Toxicology Program 2009]. Occupational exposure to indium metals may cause eye, skin, and respiratory system irritation, liver, kidney, heart and blood effects, pulmonary edema and lung damage [National Toxicology Program 2009; NIOSH 2010].
The OELs for indium (including indium compounds) includes the NIOSH REL of 0.1 mg/m3, as an 8-hour time weighted average [NIOSH 2010] and the ACGIH 8-hr TWA TLV of 0.1 mg/m3 [ACGIH 2018]. However, there is not a specific OEL for nanoscale indium particles for example, which may be present in coatings on LCD screens shredded in this study.
Presently, limited data are available to characterize the potential health risks associated with occupational exposure to indium nanoparticles. The results of experimental in vivo and in vitro studies indicate that size of the particle is critical to subsequent biological effects, raising the possibility that indium nanoparticles may have the potential to be more hazardous than larger sized particles, and may exhibit mutagenic properties [Hasegawa et al. 2012; Lim et al. 2014].

Page 61Health Hazard Evaluation Report 2015-0050-3308
Appendix D: Operation of the Direct-reading InstrumentsThe condensation particle counter operates by drawing air through a size-selective inlet, passing it through a heated saturator filled with isopropyl alcohol, and then cooling the air stream via a condenser chamber. In the condenser, the alcohol vapor condenses on the particles until the particle size reaches approximately 10 µm in diameter. This process allows the condensation particle counter optical detector to count particles in the size range of 10‒1,000 nm. The data output is expressed as total number of p/cc of sampled air, with an upper dynamic range limit of approximately 100,000 p/cc [TSI Incorporated 2012].
The OPS 3330 is an aerosol photometer, which illuminates an aerosol passing through a defined volume, and then detecting the total light scattered by all particles in that defined volume. The OPS 3330 allows the user to define 16 sizes ranges (also called bins) ranging from 0.3 µm (or 300 nm) to 10 µm. The counting efficiency of optical particle sizers using laser photometry has been shown to gradually decline as the aerodynamic diameter of the sampled aerosol decreases. According to TSI, the counting efficiency of the OPS 3330 is 50% at 300 nm. The OPS 3330 approaches 100% counting efficiency at 500 nm. The OPS 3330 is capable of accurately measuring aerosols at concentrations up to 3,000 p/cc.
The DustTrak operates by passing sampled air through a chamber illuminated by a laser. The light scattered by particles is measured at a 90° angle using a solid-state silicon photo-detector. The intensity of the scattered light is a function of the particle mass concentration and the size distribution and composition of the aerosol. We used this instrument to estimate the aerosol mass concentration of particles smaller than 15,000 nm in aerodynamic diameter. Aerosol photometers like the TSI DustTrak provide estimates based upon assumed density and particle size distributions. According to TSI, this instrument will respond to particles in the size range of 100 nm to approximately 15,000 nm, and aerosol mass concentrations ranging from 1‒150,000 µg/m3 [TSI Incorporated 2014]. However, detector sensitivity declines for particles smaller than 250 nm in diameter.
The Jerome® model J505 atomic fluorescence mercury vapor analyzer measures mercury vapor concentrations in the air. The instrument contains a mercury light source that is energized to emit light at 254 nm wavelength into a sample cell, which corresponds to the wavelength of light that mercury atoms absorb light. When mercury atoms absorb the light, it gets re-emitted at the same wavelength. A photo multiplier tube measures the light emitted at 90° to the source, correlating to the mercury concentration in the air. Air is drawn into the instrument at approximately 1 liter per minute. We used this instrument to estimate the mercury vapor concentration in µg/m3 of air. The Jerome J505 responds to mercury vapor concentrations in ambient air of 0.05–500 µg/m3 of air [Arizona Instrument LLC 2014].

Page 62 Health Hazard Evaluation Report 2015-0050-3308
ReferencesAbdallah MA, Pawar G, Harrad S [2015]. Effect of bromine substitution on human dermal absorption of polybrominated diphenyl ethers. Environ Sci Technol 49(18):10976–10983, http://dx.doi.org/10.1021/acs.est.5b03904.
Abdallah MA, Pawar G, Harrad S [2016]. Human dermal absorption of chlorinated organophosphate flame retardants; implications for human exposure. Toxicol Appl Pharmacol 291:28–37, http://dx.doi.org/10.1016/j.taap.2015.12.004.
ACGIH [2018]. 2018 TLVs® and BEIs®: threshold limit values for chemical substances and physical agents and biological exposure indices. Cincinnati, OH: American Conference of Governmental Industrial Hygienists.
ACOEM [2010]. ACOEM provides input to OSHA on key issues facing agency in 2010. Letter to David Michaels. Elk Grove Village, IL: American College of Occupational and Environmental Medicine, http://www.acoem.org/Page2Column.aspx?PageID=7392&id=6676.
ACS [2011]. Lead. Atlanta, GA: American Cancer Society, http://www.cancer.org/cancer/cancercauses/othercarcinogens/athome/lead.
Adams SV, Newcomb PA [2014]. Cadmium blood and urine concentrations as measures of exposure: NHANES 1999-2010. J Expo Sci Environ Epidemiol 24(2):163–170, http://dx.doi.org/10.1038/jes.2013.55.
Alaee, M, Arias P, Sjodin A, Bergman A [2003]. An overview of commercially used brominated flame retardants, their applications, their use patterns in different countries/regions and possible modes of release. Environ Int 29(6):683–689, http://dx.doi.org/10.1016/S0160-4120(03)00121-1.
Allen JG, McClean MD, Stapleton HM, Nelson JW, Webster TF [2007]. Personal exposure to polybrominated diphenyl ethers (PBDEs) in residential indoor air. Environ Sci Technol 41(13):4574–4579, http://dx.doi.org/10.1021/es0703170.
Allen JG, Stapleton HM, Vallarino J, McNeely E, McClean MD, Harrad SJ, Rauert CB, Spengler JD [2013]. Exposure to flame retardant chemicals on commercial airplanes. Env Health 12:17, http://dx.doi.org/10.1186/1476-069X-12-17.
ANSI/ASHRAE [2016]. Ventilation for acceptable indoor quality. American National Standards Institute/ASHRAE standard 62.1-2016. Atlanta, GA: ASHRAE.
Arizona Instrument LLC [2014]. Jerome® J505 mercury vapor analyzer operation manual. Chandler, AZ: Arizona Instrument LLC.
ATSDR [2007]. Toxicological profile for lead. Atlanta, GA: U.S. Department of Health and Human Services, Agency for Toxic Substances and Disease Registry.

Page 63Health Hazard Evaluation Report 2015-0050-3308
ATSDR [2013]. Toxicological profile for polybrominated biphenyls and polybrominated diphenyl ethers. Atlanta, GA: U.S. Department of Health and Human Services, Agency for Toxic Substances and Disease Registry, http://www.atsdr.cdc.gov/toxprofiles/tp68.pdf.
Bergman A, Rydén A, Law RJ, de Boer J, Covaci A, Alaee M, Birnbaum L, Petreas M, Rose M, Sakai S, Van den Eede N, van der Veen I [2012]. A novel abbreviation standard for organobromine, organochlorine and organophosphorus flame retardants and some characteristics of the chemicals. Environ Int 49C:57–82, http://dx.doi.org/10.1016/j.envint.2012.08.003.
Billingsley KJ [2013]. Letter of September 30, 2013, from K. J. Billingsley, California Department of Public Health, to Juliann Sum, Division of Occupational Safety and Health (Cal/OSHA), California Department of Industrial Relations.
Brown-Williams H, Lichterman J, Kosnett M [2009]. Indecent exposure: lead puts workers and families at risk. Health Research in Action, University of California, Berkeley. Perspectives 4(1):1–9.
Carignan CC, Heiger-Bernays W, McClean MD, Roberts SC, Stapleton HM, Sjödin A, Webster TF [2013]. Flame retardant exposure among collegiate United States gymnasts. Environ Sci Technol 47(23):13848–13856, http://dx.doi.org/10.1021/es4037868.
Carignan CC, Fang M, Stapleton HM, Heiger-Bernays W, McClean MD, Webster TF [2016]. Urinary biomarkers of flame retardant exposure among collegiate U.S. gymnasts. Environ Int 94:362–368, http://dx.doi.org/10.1016/j.envint.2016.06.030.
Carlsson H, Nilsson U, Becker G, Östman C [1997]. Organophosphate ester flame retardants and plasticizers in the indoor environment: Analytical methodology and occurrence. Environ Sci Technol 31(10):2931–2936, http://dx.doi.org/10.1021/es970123s.
CDC (Centers for Disease Control and Prevention) [2009]. Childhood lead poisoning associated with lead dust contamination of family vehicles and child safety seats --- Maine, 2008. MMWR 58(32):890–893, https://www.cdc.gov/mmwr/preview/mmwrhtml/mm5832a2.htm.
CDC (Centers for Disease Control and Prevention) [2012]. Adult blood lead epidemiology and surveillance (ABLES), http://www.cdc.gov/niosh/topics/ABLES/description.html.
CDC (Centers for Disease Control and Prevention) [2013a]. Blood lead levels in children aged 1–5 years — United States, 1999–2010. MMWR 62(13):245–248, https://www.cdc.gov/mmwr/preview/mmwrhtml/mm6213a3.htm.
CDC (Centers for Disease Control and Prevention) [2013b]. Very high blood lead levels among adults — United States, 2002–2011. MMWR 62(47):967–971, https://www.cdc.gov/mmwr/preview/mmwrhtml/mm6247a6.htm.
CDC (Centers for Disease Control and Prevention) [2015a]. Adult blood lead epidemiology and surveillance (ABLES), http://www.cdc.gov/niosh/topics/ables/description.html.

Page 64 Health Hazard Evaluation Report 2015-0050-3308
CDC (Centers for Disease Control and Prevention) [2015b]. Fourth national report on human exposure to environmental chemicals updated tables, February, 2015, http://www.cdc.gov/biomonitoring/pdf/FourthReport_UpdatedTables_Feb2015.pdf.
CDC (Centers for Disease Control and Prevention) [2018]. National report on Human Exposure to Environmental Chemicals updated tables, March 2018, https://www.cdc.gov/exposurereport/.
CDPH [2009]. Medical guidelines for the lead‐exposed worker. Sacramento, CA: California Department of Public Health, Occupational Lead Poisoning Prevention Program, http://www.cdph.ca.gov/programs/olppp/Documents/medgdln.pdf.
CDPH [2014]. Management guidelines for blood lead levels in adults. Sacramento, CA: California Department of Public Health, Occupational Lead Poisoning Prevention Program, http://www.cdph.ca.gov/programs/olppp/documents/adultmgtguide.pdf.
Ceballos D, Dong Z [2016]. The formal electronic recycling industry: environmental and occupational health research challenges and opportunities. Environ Int 95:157–166, http://dx.doi.org/10.1016/j.envint.2016.07.010.
Ceballos D, Beaucham C, Page E [2016]. Metal exposures at three U.S. electronic scrap recycling facilities. J Occup Environ Med 14(6):401–408, http://dx.doi.org/10.1080/15459624.2016.1269179.
CFR. Code of Federal Regulations. Washington, DC: U.S. Government Printing Office, Office of the Federal Register.
Cooper EM, Covaci A, vanNuijs AL, Webster TF, Stapleton HM [2011]. Analysis of the flame retardant metabolites bis(1,3-dichloro-2-propyl) phosphate (BDCPP) and diphenyl phosphate (DPP) in urine using liquid chromatography-tandem mass spectrometry. Anal Bioanal Chem 401(7):2123–2132, http://dx.doi.org/10.1007/s00216-011-5294-7.
CSTE [2009]. Proposal to adopt new or amended surveillance definitions for four environmental conditions. CSTE position statement 09-OH-02. Atlanta, GA: Council of State and Territorial Epidemiologists, http://c.ymcdn.com/sites/www.cste.org/resource/resmgr/PS/09-OH-02.pdf.
CSTE [2015]. Public health reporting and national notification for elevated blood lead levels. CSTE position statement 15-eH-01. Atlanta, GA: Council of State and Territorial Epidemiologists, http://c.ymcdn.com/sites/www.cste.org/resource/resmgr/2015PS/2015PSFinal/15-EH-01.pdf.
Czerska M, Zieliński M, Kamińska J, Ligocka D [2013]. Effects of polybrominated diphenyl ethers on thyroid hormone, neurodevelopment and fertility in rodents and humans. Int J Occup Med Environ Health 26(4):498–510, http://dx.doi.org/10.2478/s13382-013-0138-7.
Dallaire R, Dewailly É, Pereg D, Dery S, Ayotte P [2009]. Thyroid function and plasma concentrations of polyhalogenated compounds in Inuit adults. Environ Health Perspect 117:1380–1386, https://dx.doi.org/10.1289/ehp.0900633.
Page 65Health Hazard Evaluation Report 2015-0050-3308
Dishaw LV, Macaulay LJ, Roberts SC, Stapleton HM [2014]. Exposures, mechanisms, and impacts of endocrine-active flame retardants. Curr Opin Pharmacol 19:125–133, http://dx.doi.org/10.1016/j.coph.2014.09.018.
Dodson RE, Van den Eede, Covaci A, Petrovich LJ, Brody JG, Rudel RA [2014]. Urinary biomarkers of phosphate flame retardants: levels in California adults and recommendations for future studies. Environ Sci Technol 48(23):13625–13633, http://dx.doi.org/10.1021/es503445c.
EPA [1998]. Risk analysis to support standards for lead in paint, dust, and soil. EPA Publication EPA-747-R097-006. Washington, D.C.: U.S. Environmental Protection Agencyhttp://www2.epa.gov/lead/risk-analysis-support-standards-lead-paint-dust-and-soil-volume-i-chapters-1-7-and-appendix-epa.
Esswein EJ, Boeniger MF, Ashley K [2011]. Handwipe method for removing lead from skin. J ASTM International 8(5):1–10, https://doi.org/10.1520/JAI103527.
Filon FL, Boeniger M, Maina G, Adami G, Spinelli P, Damian A [2006]. Skin absorption of inorganic lead (PbO) and the effect of skin cleansers. J Occup Environ Med 48(7):692–699, http://dx.doi.org/10.1097/01.jom.0000214474.61563.1c.
Grant K, Goldizen FC, Sly PD, Brune MN, Neira M, van den Berg M, Norman RE [2013]. Health consequences of exposure to e-scrap: a systematic review. The Lancet Global Health 1(6):e350–e361, http://dx.doi.org/10.1016/S2214-109X(13)70101-3.
Hammel SC, Hoffman K, Webster TF, Anderson KA, Stapleton HM [2016]. Measuring personal exposure to organophosphate flame retardants using silicone wristbands and hand wipes. Environ Sci Technol 50(8):4483–4491, http://dx.doi.org/10.1021/acs.est.6b00030.
Hasegawa G, Shimonaka M, Ishihara Y [2012]. Differential genotoxicity of chemical properties and particle size of rare metal and metal oxide nanoparticles. J Appl Toxicol 32(1):72–80, http://dx.doi.org/10.1002/jat.1719.
Hoffman K, Fang M, Horman B, Patisaul HB, Garantziotis S, Birnbaum LS, Stapleton HM [2014]. Urinary tetrabromobenzoic acid (TBBA) as a biomarker of exposure to the flame retardant mixture Firemaster® 550. Environ Health Perspect 122(9):963–969, http://dx.doi.org/10.1289/ehp.1308028.
Hoffman K, Garantziotis S, Birnbaum LS, Stapleton HM [2015]. Monitoring indoor exposure to organophosphate flame retardants: hand wipes and house dust. Environ Health Perspect 123(2):160–165, http://dx.doi.org/10.1289/ehp.1408669.
Holland MG, Cawthorn D [2016]. ACOEM position statement: workplace lead exposure. JOEM 58(12):371–373, https://dx.doi.org/10.1097/JOM.0000000000000928.
Hornung RW, Reed LD [1990]. Estimation of average concentration in the presence of nondetectable values. Appl Occup Environ Hyg 5(1):46–51, http://dx.doi.org/10.1080/1047322x.1990.10389587.
Page 66 Health Hazard Evaluation Report 2015-0050-3308
HUD [2012]. Guidelines for the evaluation and control of lead-based paint hazards in housing, http://portal.hud.gov/hudportal/HUD?src=/program_offices/healthy_homes/lbp/hudguidelines.
IARC [2006a]. IARC monographs on the evaluation of carcinogenic risks to humans: inorganic and organic lead compounds. Volume 87. Lyon, France: World Health Organization, International Agency for Research on Cancer.
IARC [2006b]. IARC monographs on the evaluation of carcinogenic risks to humans: cobalt in hard metals and cobalt sulfate, gallium arsenide, indium phosphide and vanadium pentoxide. Volume 86. Lyon, France: World Health Organization, International Agency for Research on Cancer.
IARC [2012]. IARC monographs on the evaluation of carcinogenic risks to humans: arsenic, metals, fibres and dusts. Volume 100C. Lyon, France: World Health Organization, International Agency for Research on Cancer.
Institute of Medicine [2012]. Potential health risks from recurrent lead exposure of DOD firing range personnel. Washington, D.C.: National Academies Press.
Jakobsson K, Thuresson K, Rylander L, Sjödin A, Hagmar L, Bergman A [2002]. Exposure to polybrominated diphenyl ethers and tetrabromobisphenol A among computer technicians. Chemosphere 46(5):709–716, https://doi.org/10.1016/S0045-6535(01)00235-1.
Jayatilaka NK, Restrepo P, Williams L, Ospina M, Valentin-Blasini L, Calafat AM [2017]. Quantification of three chlorinated dialkyl phosphates, diphenyl phosphate, 2,3,4,5-tetrabromobenzoic acid, and four other organophosphates in human urine by solid phase extraction-high performance liquid chromatography-tandem mass spectrometry. Anal Bioanal Chem 409(5):1323–1332, http://dx.doi.org/10.1007/s00216-016-0061-4.
Johnson PI, Stapleton HM, Mukherjee B, Hauser R, Meeker JD [2013]. Associations between brominated flame retardants in house dust and hormone levels in men. Sci Total Environ 445–446:177–184, http://dx.doi.org/10.1016/j.scitotenv.2012.12.017.
Kosarac I, Kubwabo C, Foster W [2016]. Quantitative determination of nine urinary metabolites of organophosphate flame retardants using solid phase extraction and ultra performance liquid chromatography coupled to tandem mass spectrometry (UPLC-MS/MS). J Chromatogr B 1014:24–30, http://dx.doi.org/10.1016/j.jchromb.2016.01.035.
Kosnett MJ, Wedeen RP, Rothenberg SJ, Hipkins KL, Materna BL, Schwartz BS, Hu H, Woolf A [2007]. Recommendations for medical management of adult blood lead exposure. Environ Health Perspect 115(3):463–471, http://dx.doi.org/10.1289/ehp.9784.
Kurebayashi H, Tanaka A, Yamaha T [1985]. Metabolism and disposition of the flame-retardant plasticizer, tri-para-cresyl phosphate, in the rat. Toxicol Appl Pharmacol 77(3):395–404.
La Guardia MJ, Hale RC, Harvey E [2006]. Detailed polybrominated diphenyl ether (PBDE) congener composition of the widely used Penta-, Octa-, and Deca-PBDE technical flame-retardant mixtures. Environ Sci Technol 40(2):6247–6254, http://dx.doi.org/ 10.1021/es060630m.
Page 67Health Hazard Evaluation Report 2015-0050-3308
La Guardia MJ, Hale RC [2015]. Halogenated flame-retardant concentrations in settled dust, respirable and inhalable particulates and polyurethane foam at gymnastic training facilities and residences. Environ Int 79:106–114, http://dx.doi.org/10.1016/j.envint.2015.02.014.
Lauwerys RR, Hoet P [2001]. Industrial chemical exposure: guidelines for biological monitoring. 3rd ed. Boca Raton, FL: CRC Press, LLC, pp. 21–180.
Lim CH, Han JH, Cho HW, Kang M [2014]. Studies on the toxicity and distribution of indium compounds according to particle size in Sprague-Dawley rats. Toxicological Research 30(1):55–63, http://dx.doi.org/10.5487/TR.2014.30.1.055.
Lorber M [2008]. Exposure of Americans to polybrominated diphenyl ethers. J Expo Sci Environ Epidemiol 18(1):2–19, http://dx.doi.org/10.1038/sj.jes.7500572.
Mäkinen MS, Mäkinen MR, Koistinen JT, Pasanen AL, Pasanen PO, Kalliokoski PJ, Korpi AM [2009]. Respiratory and dermal exposure to organophosphorus flame retardants and tetrabromobisphenol A at five work environments. Environ Sci Technol 43(3):941–947, http://dx.doi.org/10.1021/es802593t.
Mannino DM, Homa DM, Matte T, Hernandez-Avila M [2005]. Active and passive smoking and blood lead levels in U.S. adults: data from the Third National Health and Nutrition Examination Survey. Nicotine Tob Res 7(4):557–564, http://dx.doi.org/10.1080/14622200500185264.
McDonald TA [2002]. A perspective on the potential health risks of PBDEs. Chemosphere 46(5):745–755, http://dx.doi.org/10.1016/S0045-6535(01)00239-9.
Meeker JD, Stapleton HM [2010]. House dust concentrations of organophosphate flame retardants in relation to hormone levels and semen quality parameters. Environ Health Perspect 118(3):318–323, http://dx.doi.org/10.1289/ehp.0901332.
Meeker JD, Cooper EM, Stapleton HM, Hauser R [2013a]. Exploratory analysis of urinary metabolites of phosphorus-containing flame retardants in relation to markers of male reproductive health. Endocr Disruptors (Austin) 1(1):e26306, http://dx.doi.org/10.4161/endo.26306.
Meeker JD, Cooper EM, Stapleton HM, Hauser R [2013b]. Urinary metabolites of organophosphate flame retardants: temporal variability and correlations with house dust concentrations. Environ health perspect 121(5):580–585, http://dx.doi.org/10.1289/ehp.1205907.
Moline JM, Landrigan PJ [2005]. Lead. In: Rosenstock L, Cullen MR, Brodkin CA, Redlich CA, eds. Textbook of clinical occupational and environmental medicine. 2nd ed. Philadelphia, PA: Elsevier Saunders, pp. 967–979.
Newman N, Jones C, Page E, Ceballos D, Oza A [2015]. Investigation of childhood lead poisoning from parental take-home exposure from an electronic scrap recycling facility – Ohio, 2012. MMWR 64(27):743–745, https://www.cdc.gov/mmwr/preview/mmwrhtml/mm6427a3.htm.

Page 68 Health Hazard Evaluation Report 2015-0050-3308
NIOSH [1995]. Report to Congress on the workers’ home contamination study conducted under the Workers’ Family Protection Act 29 U.S.C. 671a. Cincinnati, OH: U.S. Departmentof Health and Human Services, Centers for Disease Control and Prevention, National Institute for Occupational Safety and Health, DHHS (NIOSH) Publication No. 95-123, http://www.cdc.gov/niosh/docs/95-123/.
NIOSH [2009a]. Exposure to hazardous metals during electronics recycling at four UNICOR facilities. By Page E, Sylvain D. Cincinnati, OH: U.S. Department of Health and Human Services, Centers for Disease Control and Prevention, National Institute for Occupational Safety and Health, Health Hazard Evaluation Report 2008-0055-3098, https://www.cdc.gov/niosh/hhe/reports/pdfs/2008-0055-3098.pdf.
NIOSH [2009b]. Approaches to safe nanotechnology: managing the health and safety concerns associated with engineered nanomaterials. Cincinnati, OH: U.S. Department of Health and Human Services, Centers for Disease Control and Prevention, National Institute for Occupational Safety and Health, DHHS (NIOSH) Publication No. 2009-125, http://www.cdc.gov/niosh/docs/2009-125/pdfs/2009-125.pdf.
NIOSH [2010]. NIOSH pocket guide to chemical hazards. Cincinnati, OH: U.S. Department of Health and Human Services, Centers for Disease Control and Prevention, National Institute for Occupational Safety and Health, DHHS (NIOSH) Publication No. 2010-168c, http://www.cdc.gov/niosh/npg/.
NIOSH [2014a]. Evaluation of occupational exposures at an electronic scrap recycling facility. By Ceballos D, Chen L, Page E, Echt A, Oza A, Ramsey J. Cincinnati, OH: U.S. Department of Health and Human Services, Centers for Disease Control and Prevention, Health Hazard Evaluation Report 2012-0100-3217, https://www.cdc.gov/niosh/hhe/reports/pdfs/2012-0100-3217.pdf.
NIOSH [2014b]. Current strategies for engineering controls in nanomaterial production and downstream handling processes. Cincinnati, OH: U.S. Department of Health and Human Services, Centers for Disease Control and Prevention, National Institute for Occupational Safety and Health, DHHS (NIOSH) Publication No. 2014-102, http://www.cdc.gov/niosh/docs/2014-102/pdfs/2014-102.pdf.
NIOSH [2014c]. Indoor firing ranges, Cincinnati, OH: U.S. Department of Health and Human Services, Centers for Disease Control and Prevention, National Institute for Occupational Safety and Health, http://www.cdc.gov/niosh/topics/ranges/.
NIOSH [2016]. NIOSH manual of analytical methods. Consideration of sampler wall deposits, Inclusion of material adhering to internal cassette surfaces during sampling and analysis of airborne particles. Cincinnati, OH: U.S. Department of Health and Human Services, Centers for Disease Control and Prevention, National Institute for Occupational Safety and Health, https://www.cdc.gov/niosh/docs/2003-154/cassetteguidance.html.
NIOSH [2018]. NIOSH manual of analytical methods (NMAM). 5th ed. O’Connor PF, Ashley K, eds. Cincinnati, OH: U.S. Department of Health and Human Services, Centers for Disease Control and Prevention, National Institute for Occupational Safety and Health, DHHS (NIOSH) Publication No. 2014-151, http://www.cdc.gov/niosh/nmam.

Page 69Health Hazard Evaluation Report 2015-0050-3308
National Toxicology Program (NTP) [2009]. Chemical information profile for indium tin oxide. Research Triangle Park, NC: U.S. Department of Health and Human Services, National Institutes of Health, National Institute of Environmental Health Sciences, National Toxicology Program, https://ntp.niehs.nih.gov/ntp/noms/support_docs/ito060309_508.pdf.
National Toxicology Program (NTP) [2011]. Report on carcinogens, 12th ed. Research Triangle Park, NC: U.S. Department of Health and Human Services, National Institutes of Health, National Institute of Environmental Health Sciences, National Toxicology Program, http://ntp.niehs.nih.gov/ntp/roc/twelfth/profiles/Lead.pdf.
National Toxicology Program (NTP) [2012]. Monograph on the health effects of low-level lead. Research Triangle Park, NC: U.S. Department of Health and Human Services, National Institutes of Health, National Institute of Environmental Health Sciences, National Toxicology Program, https://ntp.niehs.nih.gov/ntp/ohat/lead/final/monographhealtheffectslowlevellead_newissn_508.pdf.
Nomeir AA, Kato S, Matthews HB [1981]. The metabolism and disposition of tris(1,3-dichloro-2-propyl)phosphate (Fyrol FR-2) in the rat. Toxicol Appl Pharmacol 57(3):401–413, https://doi.org/10.1016/0041-008X(81)90238-6.
OSHA [2003]. Standard interpretation letter–lead standard 29 CFR 1926.62 (i)(2)(ii),http://www.osha.gov/pls/oshaweb/owadisp.show_document?p_table=INTERPRETATIONS&p_id=25617.
Ospina M, Jayatilaka N, Wong L, Restrepo P, Calafat A [2018]. Exposure to organophosphate flame retardant chemicals in the U.S. general population: data from the 2013–2014 National Health and Nutrition Examination Survey. Environ Int 110(2018):32–41, http://dx.doi.org/10.1016/j.envint.2017.10.001.
Petropoulou SS, Petreas M, Park JS [2016]. Analytical methodology using ion-pair liquid chromatography-tandem mass spectrometry for the determination of four di-ester metabolites of organophosphate flame retardants in California human urine. J Chromatogr A 1434:70–80, http://dx.doi.org/10.1016/j.chroma.2016.01.020.
Pettersson-Julander A, van Bavel B, Engwall M, Westberg H [2004]. Personal air sampling and analysis of polybrominated diphenyl ethers and other bromine containing compounds at an electronic recycling facility in Sweden. J Environ Monit 6(11):874–880, http://dx.doi.org/10.1039/B408381D.
Preston EV, McClean MD, Claus Henn B, Stapleton HM, Braverman LE, Pearce EN, Makey CM, Webster TF [2017]. Associations between urinary diphenyl phosphate and thyroid function. Environ Int 101:158–164, http://dx.doi.ord/10.1016/j.envint.2017.01.020.
Proctor NH, Hughes JP, Fischmann ML [1991]. Chemical hazards of the worplace, 3rd ed. New York: Van Nostrand Reinhold.

Page 70 Health Hazard Evaluation Report 2015-0050-3308
Rosenberg C, Hämeilä M, Tornaeus J, Säkkinen K, Puttonen K, Korpi A, Kiilunen M, Linnainmaa M, Hesso A [2011]. Exposure to flame retardants in electronics recycling sites. Ann Occup Hyg 55(6):658–665, http://dx.doi.org/10.1093/annhyg/mer033.
Schreder ED, Uding N, La Guardia MJ [2016]. Inhalation a significant exposure route for chlorinated organophosphate flame retardants. Chemosphere 150:499–504, http://dx.doi.org/10.1016/j.chemosphere.2015.11.084.
Schubauer-Berigan MK, Deddens JA, Couch JR, Petersen MR [2010]. Risk of lung cancer associated with quantitative beryllium exposure metrics within an occupational cohort. Occup Environ Med 68(5):354–360, http://dx.doi.org/10.1136/oem.2010.056515.
Schwartz BS, Hu H [2007]. Adult lead exposure: time for change. Environ Health Perspect 115(3):451–454, http://dx.doi.org/10.1289/ehp.9782.
Schwartz BS, Stewart WF [2007]. Lead and cognitive function in adults: a question and answers approach to a review of the evidence for cause, treatment, and prevention. Int Rev Psychiatry 19(6):671–692, http://dx.doi.org/10.1080/09540260701797936.
Siegel JD, Rhinehart E, Jackson M, Chiarello L, Healthcare Infection Control Practices Advisory Committee [2007]. Guideline for isolation precautions: preventing transmission of infectious agents in healthcare settings, http://www.cdc.gov/hicpac/pdf/isolation/Isolation2007.pdf.
Sjodin A, Hagmar L, Klasson-Wehler E, Kronholm-Diab K, Jakobsson E, Bergman A [1999]. Flame retardant exposure: polybrominated diphenyl ethers in blood from Swedish workers. Environ Health Perspect 107(8):643–648, http://dx.doi.org/10.1289/ehp.99107643.
Sjodin A, Carlsson H, Thuresson K, Sjolin S, Bergman A, Ostman C [2001]. Flame retardants in indoor air at an electronics recycling plant and at other work environments. Environ Sci Technol 35(3):448–454, http://dx.doi.org/10.1021/es000077n.
Sjodin A, Wong LY, Jones RS, Park A, Zhang Y, Hodge C, Dipietro E, McClure C, Turner W, Needham LL, Patterson Jr DG [2008]. Serum concentrations of polybrominated diphenyl ethers (PBDEs) and polybrominated biphenyl (PBB) in the United States population: 2003–2004. Environ Sci Technol 42(4):1377–1384, http://dx.doi.org/10.1021/es702451p.
Stapleton HM, Dodder NG [2008]. Photodegradation of decabromodiphenyl ether in house dust by natural sunlight. Environ Toxicol Chem 27(2):306–312, http://dx.doi.org/10.1897/07-301R.1.
Stapleton HM, Klosterhaus S, Keller A, Ferguson PL, van Bergen S, Cooper E, Webster T, Blum A [2011]. Identification of flame retardants in polyurethane foam collected from baby products. Environ Sci Technol 45(12):5323–5331, http://dx.doi.org/10.1021/es2007462.
Stapleton HM, Misenheimer J, Hoffman K, Webster TF [2014]. Flame retardant associations between children’s handwipes and house dust. Chemosphere 116:54–60, http://dx.doi.org/10.1016/j.chemosphere.2013.12.100.
Stauber JL, Florence TM, Gulson B, Dale L [1994]. Percutaneous absorption of inorganic lead compounds. Sci Total Environ 145(1–2):55–70, https://doi.org/10.1016/0048-9697(94)90297-6.

Page 71Health Hazard Evaluation Report 2015-0050-3308
Sun CC, Wong TT, Hwang YH, Chao KY, Jee SH, Wang JD [2002]. Percutaneous absorption of inorganic lead compounds. Am Ind Hyg Assoc J 63(5):641–646, https://doi.org/10.1080/15428110208984751.
Thuresson K, Bergman K, Rothenbacher K, Herrmann T, Sjölin S, Hagmar L, Päpke O, Jakobsson K [2006a]. Polybrominated diphenyl ether exposure to electronics recycling workers--a follow up study. Chemosphere 64(11):1855–1861, https://doi.org/10.1016/j.chemosphere.2006.01.055.
Thuresson K, Hoglund P, Hagmar L, Sjodin A, Bergman A, Jakobsson K [2006b]. Apparent half-lives of hepta- to decabrominated diphenyl ethers in human serum as determined in occupationally exposed workers. Environ Health Perspect 114(2):176–181, https://dx.doi.org/10.1289/ehp.8350.
TSI Incorporated [2012]. Hand-held condensation particle counter model 3007. Shoreview, MN: TSI Incorporated.
TSI Incorporated [2014]. DustTrak™ DRX aerosol monitor model 8533/8534/8533EP operation and service manual. Shoreview, MN: TSI Incorporated.
van der Veen I, de Boer J [2012]. Phosphorus flame retardants: properties, production, environmental occurrence, toxicity and analysis. Chemosphere 88(10):1119–1153, http://dx.doi.org/10.1016/j.chemosphere.2012.03.067.
Vincoli JW [1997]. Risk management for hazardous chemicals. Boca Raton, FL: CRC Press.
Watkins DJ, McClean MD, Fraser AJ, Weinberg J, Stapleton HM, Sjödin A, Webster TF [2011]. Exposure to PBDEs in the office environment: evaluating the relationships between dust, handwipes, and serum. Environ Health Perspect 19(9):1247–1252, http://dx.doi.org/10.1289/ehp.1003271.
Watkins DJ, McClean MD, Fraser AJ, Weinberg J, Stapleton HM, Webster TF [2013]. Associations between PBDEs in office air, dust, and surface wipes. Environ Int 59:124–132, http://dx.doi.org/10.1016/j.envint.2013.06.001.
WHO [1992]. Environmental health criteria 134. Cadmium. Geneva, Switzerland: World Health Organization, http://www.inchem.org/documents/ehc/ehc/ehc134.htm.

Page 72 Health Hazard Evaluation Report 2015-0050-3308
Keywords: North American Industry Classification System (NAICS) 423930 (Recyclable Material Merchant Wholesalers), Ohio, Electronics Recycling, E-Scrap, E-Waste Flame Retardants, Lead, Cadmium, Indium, Nanoparticles

Page 73Health Hazard Evaluation Report 2015-0050-3308
The Health Hazard Evaluation Program investigates possible health hazards in the workplace under the authority of the Occupational Safety and Health Act of 1970 (29 U.S.C. § 669(a)(6)). The Health Hazard Evaluation Program also provides, upon request, technical assistance to federal, state, and local agencies to investigate occupational health hazards and to prevent occupational disease or injury. Regulations guiding the Program can be found in Title 42, Code of Federal Regulations, Part 85; Requests for Health Hazard Evaluations (42 CFR Part 85).
DisclaimerThe recommendations in this report are made on the basis of the findings at the workplace evaluated and may not be applicable to other workplaces.
Mention of any company or product in this report does not constitute endorsement by NIOSH.
Citations to Web sites external to NIOSH do not constitute NIOSH endorsement of the sponsoring organizations or their programs or products. NIOSH is not responsible for the content of these Web sites. All Web addresses referenced in this document were accessible as of the publication date.
AcknowledgmentsAnalytical Support: Maxxam AnalyticsDesktop Publisher: Shawna Watts Editor: Ellen Galloway Industrial Hygiene Field Assistance: Kevin Dunn, Jonathan Slone Logistics: Donnie Booher, Kevin MooreMedical Field Assistance: Deborah Sammons, Barbara MacKenzie, Christine ToennisBiomonitoring Data: Nayana Jayatilaka, Richard Jones
We received support for this study from NIOSH as part of its National Occupational Research Agenda activities.
Availability of ReportCopies of this report have been sent to the employer and employees at the facility. The state and local health department and the Occupational Safety and Health Administration Regional Office have also received a copy. This report is not copyrighted and may be freely reproduced.
Recommended citation for this report:NIOSH [2018]. Evaluation of exposure to metals, flame retardants, and nanomaterials at an electronics recycling company. By Beaucham CC, Ceballos D, Page EH, Mueller C, Calafat A, Sjodin A, Ospina M, La Guardia M, Glassford E. Cincinnati, OH: U.S. Department of Health and Human Services, Centers for Disease Control and Prevention, National Institute for Occupational Safety and Health, Health Hazard Evaluation Report 2015-0050-3308, https://www.cdc.gov/niosh/hhe/reports/pdfs/2015-0050-3308.pdf.

To receive NIOSH documents or more information about occupational safety and health topics, please contact NIOSH:
Telephone: 1–800–CDC–INFO (1–800–232–4636)TTY: 1–888–232–6348CDC INFO: www.cdc.gov/infoor visit the NIOSH Web site at www.cdc.gov/nioshFor a monthly update on news at NIOSH, subscribe to NIOSH eNews by visiting www.cdc.gov/niosh/eNews.
Delivering on the Nation’s promise:Promoting productive workplaces through safety and health research