hhs overview - lbb.state.tx.us
TRANSCRIPT

HHS Overview
•LEGISLATIVE BUDGET BOARD STAFF
•PRESENTED TO THE HOUSE COMMITTEE ON HUMAN SERVICES
February 2019

February 11, 2019 LEGISLATIVE BUDGET BOARD ID: 5654 2
Presentation Overview
• Overview of Article II;
• Medicaid financing, caseloads, and cost drivers;
• State Supported Living Centers;
• DFPS overview;
• Foster care funding and caseloads;
• TANF cash assistance and caseload;
• House Bill 1 as Introduced

February 11, 2019 LEGISLATIVE BUDGET BOARD ID: 5654 3
Article II General Revenue Expenditures, FY 2009-2018
NOTE: Amounts for fiscal year 2018 are estimated.
$-
$10.0
$20.0
$30.0
$40.0
$50.0
$60.0
2009 2010 2011 2012 2013 2014 2015 2016 2017 2018
Bill
ion
s
HHS Statewide

February 11, 2019 LEGISLATIVE BUDGET BOARD ID: 5654 4
Article II All Funds Expenditures, FY 2009-2018
NOTE: Amounts for fiscal year 2018 are estimated.
$-
$20.0
$40.0
$60.0
$80.0
$100.0
$120.0
2009 2010 2011 2012 2013 2014 2015 2016 2017 2018
Bill
ion
s
HHS Statewide

February 11, 2019 LEGISLATIVE BUDGET BOARD ID: 5654 5
Medicaid Overview
•Medicaid is a jointly funded State/Federal program providing health insurance primarily to low-income parents, non-disabled children, pregnant women, the elderly, and people with disabilities. As a requirement of participation, states must cover certain groups and have the option to cover additional groups.
•The Health and Human Services Commission (HHSC) is the single state agency responsible for Texas’s Medicaid program, but services are administered by a variety of state agencies.

February 11, 2019 LEGISLATIVE BUDGET BOARD ID: 5654 6
Medicaid Average Monthly Full-Benefit Caseload by Enrollment Group Fiscal Years 2009 to 2018
NOTES:
(1) Other adults includes TANF Adults, Pregnant Women, Medicaid for Breast and Cervical Cancer, and Medically Needy clients.
(2) Amounts for fiscal year 2018 are estimated.
69.7%69.7%
69.6% 70.1% 71.5% 72.4%72.1% 71.5% 71.4% 73.0%
11.8%
11.8%
11.8%11.4% 10.6% 10.1%
10.0% 10.0% 9.9% 9.2%
10.4%
10.9%
11.3%11.5% 11.2% 11.0%
11.2% 11.5% 11.4% 10.5%
8.1%
7.6%
7.3%7.0% 6.7%
6.5%
6.8% 7.0% 7.2% 7.2%
0
1
2
3
4
5
2009 2010 2011 2012 2013 2014 2015 2016 2017 2018
IN MILLIONS
Children Aged Disabled Other Adults
February 11, 2019 LEGISLATIVE BUDGET BOARD ID: 5654 7
Budget Drivers: Caseload and Cost
•Medicaid expenditures are primarily a function of two factors: caseload and cost.
• As caseloads increase or decrease (due to factors such as population growth, the economy, or policy changes), Medicaid expenditures fluctuate.
• Medicaid expenditures also fluctuate as a result of cost growth (tied to rate changes, medical inflation, utilization, and acuity), which can be negative or positive.

February 11, 2019 LEGISLATIVE BUDGET BOARD ID: 5654 8
Financing
•Financing of the Medicaid program is based on an array of matching rates that determine the amount of state funds (General Revenue, General Revenue-Dedicated, and Other Funds) and the amount of Federal Funds.
•The primary matching rate for client services is the Federal Medical Assistance Percentage (FMAP).
• Each state has a different FMAP based on its per capita personal income (PCPI) relative to the nation’s PCPI.
o Federal Fiscal Year (FFY) FMAP is generally announced in November of the previous FFY.
o FMAP is based on the three most recent years of income data available.
o FFY 2020 FMAP was announced in November 2018 based on PCPI data for calendar years 2015 through 2017.
• State FMAPs can range from 50 to 83 percent.
o Below 55 percent: states with PCPI higher than the national average.
o Above 55 percent: states with PCPI below the national average.

February 11, 2019 LEGISLATIVE BUDGET BOARD ID: 5654 9
Medicaid Funding by Method of Finance Fiscal Years 2000 to 2021
$-
$5.0
$10.0
$15.0
$20.0
$25.0
$30.0
$35.0IN BILLIONS
GR-Related Federal Funds Other Funds
NOTE: Fiscal years 2000 to 2017 are expended, fiscal years 2018 through 2021 are amounts included in the Legislative Budget Estimates, House.
SOURCE: Legislative Budget Board.

February 11, 2019 LEGISLATIVE BUDGET BOARD ID: 5654 10
State Supported Living Centers
• Texas operates 13 intermediate-care facilities known as state supported living centers (SSLCs). Residents at SSLCs are individuals with severe or profound intellectual disabilities and those with intellectual disabilities who have behavioral health conditions or are medically fragile.
• Nationwide trends have been toward deinstitutionalization and the expansion of community-based services. As demand for institutional services has decreased and community-based services are made available in Texas, the population served at SSLCs has decreased.
• From 1977 to 2018, the average monthly census for all SSLCs has decreased by 75.6 percent, from 12,132 to 2,962.

February 11, 2019 LEGISLATIVE BUDGET BOARD ID: 5654 11
SSLC Average Monthly Census and Strategy Funding, FY 2009-2018
29.4%32.6%
38.7%42.1% 41.6% 41.8% 42.1% 43.1% 42.8% 42.5%
70.6%
67.4%
61.3%57.9% 58.4% 58.2% 57.9%
56.9% 57.2% 57.5%
$590.5 $639.4
$659.7 $667.8 $659.7 $674.8 $681.9
$700.2 $687.9 $694.0
4627
4337
40713880
3650
34113240
31253026 2962
0
1000
2000
3000
4000
5000
6000
$0
$100
$200
$300
$400
$500
$600
$700
$800
2009 2010 2011 2012 2013 2014 2015 2016 2017 2018
Cen
sus
Mill
ion
s
SSLC Census and Strategy Spending, Fiscal Years 2009-2018
General Revenue Non-GR CensusNOTE: Amounts for fiscal year 2018 are estimated.

February 11, 2019 LEGISLATIVE BUDGET BOARD ID: 5654 12
Overview of Child Protective Services
• The Department of Family and Protective Services (DFPS) pays a daily rate for the care and maintenance of children who have been removed from their homes and placed in foster homes or residential treatment facilities as a result of abuse or neglect allegations.
• In 2012, DFPS began implementing a redesign of the foster care program that utilizes single-source continuum contractors in a DFPS catchment area to provide a full continuum of services to children in foster care.
• In the Eighty-fifth Legislature, Regular Session, 2017, Senate Bill 11 was implemented to outsource case management and Full-time-equivalent (FTE) positions and continue expansion of Foster Care Redesign, now known as Community-based Care to continue to provide child welfare services.

February 11, 2019 LEGISLATIVE BUDGET BOARD ID: 5654 13
Child Protective Services Expenditures by CategoryFiscal Years 2009 to 2018
$-
$200
$400
$600
$800
$1,000
$1,200
$1,400
$1,600
$1,800
$2,000
FY2009 FY2010 FY2011 FY2012 FY2013 FY2014 FY2015 FY2016 FY2017 FY2018
Mill
ion
s
Direct Delivery and Program Support Day Care Purchased Services Foster Care Adoption/PCA Relative Caregiver Community-based Care
NOTE: Amounts for fiscal year 2018 are estimated.

February 11, 2019 LEGISLATIVE BUDGET BOARD ID: 5654 14
Foster Care Payments and Community-based Care Strategy Expenditures, FY 2009-2018
37.2% 37.1% 39.3% 42.8% 43.2%
49.3%40.8% 41.9%
43.9%
45.3%
62.8%62.9%
60.7% 57.2% 56.8%
50.7%59.2%
58.1%56.1%
54.7%$354.2
$376.8 $383.2 $375.2 $366.8
$399.3 $403.4 $422.6
$440.5
$510.3
$0
$100
$200
$300
$400
$500
$600
2009 2010 2011 2012 2013 2014 2015 2016 2017 2018
Mill
ion
s
General Revenue Non-GR
February 11, 2019 LEGISLATIVE BUDGET BOARD ID: 5654 15
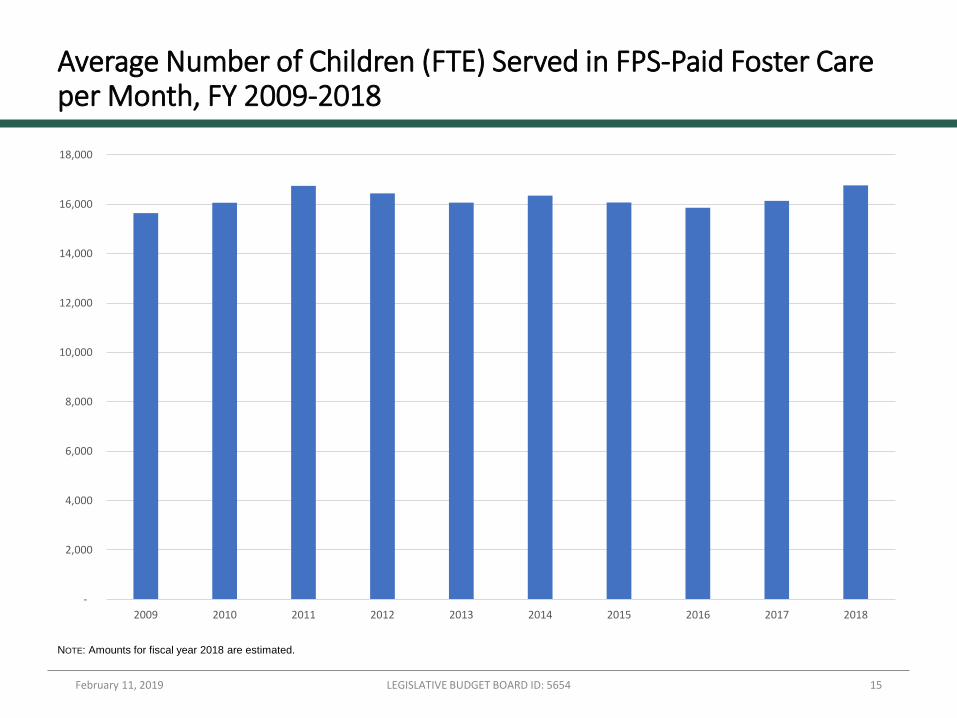
Average Number of Children (FTE) Served in FPS-Paid Foster Care per Month, FY 2009-2018
-
2,000
4,000
6,000
8,000
10,000
12,000
14,000
16,000
18,000
2009 2010 2011 2012 2013 2014 2015 2016 2017 2018
NOTE: Amounts for fiscal year 2018 are estimated.

February 11, 2019 LEGISLATIVE BUDGET BOARD ID: 5654 16
Paid Caseworkers and Caseload Per Worker by Type Fiscal Years 2009 to 2018
0.0
5.0
10.0
15.0
20.0
25.0
30.0
35.0
40.0
45.0
50.0
0
500
1,000
1,500
2,000
2,500
3,000
FY2009 FY2010 FY2011 FY2012 FY2013 FY2014 FY2015 FY2016 FY2017 FY2018
Cas
elo
ad p
er W
ork
er
Pai
d C
asew
ork
ers
Conservatorship Foster/Adoptive Home Dev. Family Based Safety Services Kinship Investigations
Conservatorship Foster/Adoptive Home Dev. Family Based Safety Services Kinship Investigations
Paid CaseworkersCaseload per Worker
NOTE: Amounts for fiscal year 2018 are estimated.

February 11, 2019 LEGISLATIVE BUDGET BOARD ID: 5654 17
Overview of Temporary Assistance for Needy Families (TANF)
• TANF is a block grant that provides assistance to needy families with children to care for children in their homes or the homes of relatives; promotes job preparation, work, and marriage; strives to reduce and prevent out-of-wedlock pregnancies; and encourages the formation and maintenance of two-parent families.
• One component of the program, TANF cash assistance, provides monthly cash payments for eligible families with children under age 18 and includes certain obligations on the part of the parents or relative caretaker of children, including training for or looking for work and making sure the child attends school. The cash payments are intended to help these families pay for basic living needs such as food, clothing, housing, utilities, medical supplies not paid for by Medicaid, and other basic needs.
• One-time annual TANF assistance is also available for families in crisis to help them afford basic living needs and to certain grandparents caring for a child who gets TANF.
• TANF appropriations include federal funds and state maintenance of effort funds.
• Flexibility provided by the federal government allows the Legislature to appropriate TANF funds on other allowable program areas in addition to TANF cash assistance.

February 11, 2019 LEGISLATIVE BUDGET BOARD ID: 5654 18
TANF Cash Assistance Strategy Expenditures, FY 2009-2018
64.0% 52.4% 56.2% 68.7% 77.5% 88.1%
20.9%
85.3% 86.5% 92.6%
36.0%
47.6%
43.8%
31.3%
22.5%
11.9%
79.1%
14.7% 13.5%7.4%
$106.8
$129.4
$116.9
$96.3
$85.7
$74.8
$65.1
$59.2 $58.4 $54.3
$0
$20
$40
$60
$80
$100
$120
$140
2009 2010 2011 2012 2013 2014 2015 2016 2017 2018
Mill
ion
s
General Revenue Related Non-GRNOTE: Amounts for fiscal year 2018 are estimated.
February 11, 2019 LEGISLATIVE BUDGET BOARD ID: 5654 19
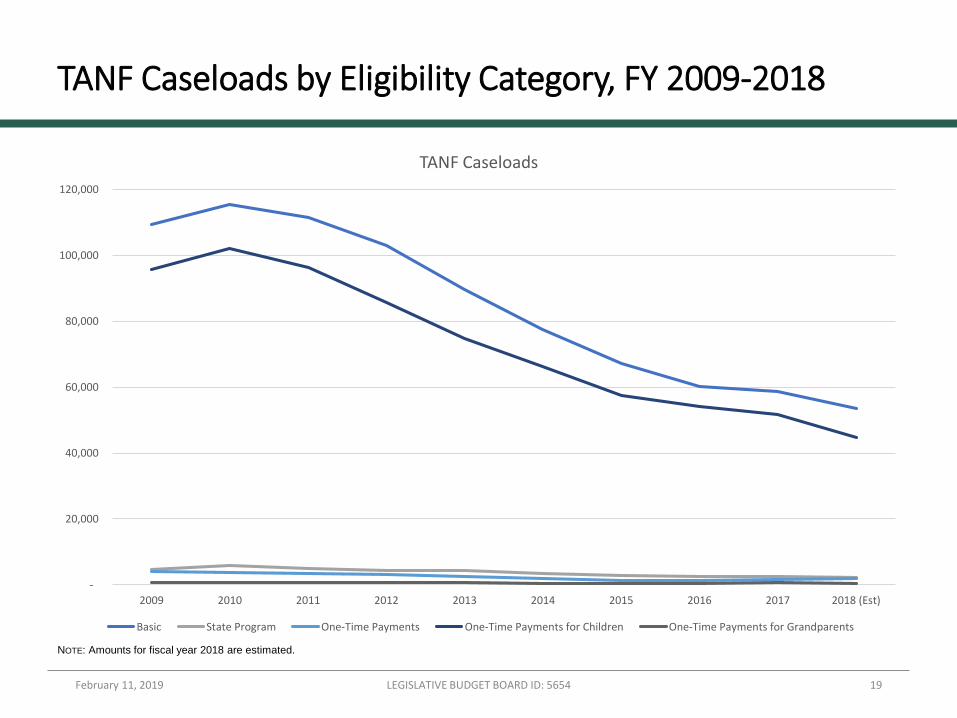
TANF Caseloads by Eligibility Category, FY 2009-2018
-
20,000
40,000
60,000
80,000
100,000
120,000
2009 2010 2011 2012 2013 2014 2015 2016 2017 2018 (Est)
TANF Caseloads
Basic State Program One-Time Payments One-Time Payments for Children One-Time Payments for Grandparents
NOTE: Amounts for fiscal year 2018 are estimated.

February 11, 2019 LEGISLATIVE BUDGET BOARD ID: 5654 20
House Bill 1, All Funds by Article
Article 2018–19 Base 2020–21 HB 1 $ Change % Change
1 – General Government $7,503.3 $6,729.5 ($773.8) (10.3%)
2 – Health/Human Services $83,584.2 $84,826.1 $1,241.9 1.5%
3 – Public Education $60,492.7 $70,615.3 $10,122.6 16.7%
3 – Higher Education $20,736.3 $21,072.1 $335.8 1.6%
4 – Judiciary $857.1 $875.4 $18.4 2.1%
5 – Public Safety/Criminal Justice $18,378.5 $15,407.6 ($2,970.9) (16.2%)
6 – Natural Resources $6,566.0 $8,905.4 $2,339.4 35.6%
7 – Business/Econ Development $36,587.5 $37,770.0 $1,182.5 3.2%
8 – Regulatory $671.7 $633.7 ($38.0) (5.7%)
10 - Legislature $392.8 $392.0 ($0.8) (0.2%)
TOTAL, ALL ARTICLES $235,770.2 $247,227.3 $11,457.1 4.9%
All Funds, in millions

February 11, 2019 LEGISLATIVE BUDGET BOARD ID: 5654 21
House Bill 1, GR by Article
Article 2018–19 Base 2020–21 HB 1 $ Change % Change
1 – General Government $3,406.9 $3,709.0 $302.2 8.9%
2 – Health/Human Services $34,716.3 $33,611.2 ($1,105.1) (3.2%)
3 – Public Education $41,548.7 $48,677.4 $7,128.7 17.2%
3 – Higher Education $14,909.7 $15,148.1 $238.4 1.6%
4 – Judiciary $490.8 $541.9 $51.1 10.4%
5 – Public Safety/Criminal Justice $11,322.1 $11,414.9 $92.7 0.8%
6 – Natural Resources $910.6 $786.5 ($124.1) (13.6%)
7 – Business/Econ Development $496.5 $815.4 $318.9 64.2%
8 – Regulatory $345.3 $350.4 $5.1 1.5%
10 - Legislature $392.7 $391.8 ($0.9) (0.2%)
TOTAL, ALL ARTICLES $108,539.7 $115,446.6 $6,906.9 6.4%
General Revenue, in millions

House Bill 1 Medicaid
● $67.6 billion in All Funds and $25.2 billion in General Revenue.
● This is an increase of $2.0 billion in All Funds and a decrease of $1.4 billion in General Revenue.
● More favorable Federal Medical Assistance Percentages (FMAP) result in a higher proportion of the program being funded with Federal Funds.
● Funding is provided for:
• Projected caseload growth
• Maintaining fiscal year 2019 average costs for most services
• Cost growth associated with average costs established by the federal government
February 11, 2019 22LEGISLATIVE BUDGET BOARD ID: 5654

House Bill 1 Child Protective Services (CPS)
● $3.7 billion in All Funds and $2.1 billion in General Revenue.
● This is an increase of $141.7 million in All Funds and $45.1 million in General Revenue:
● Foster Care Payments:
• $1.0 billion in All Funds and $470.4 million in General Revenue
• Includes Community-based Care
• Includes projected caseload growth
● CPS Direct Delivery Staff:
• $1.5 billion in All Funds
• Includes increased funding and additional full-time-equivalent (FTE) positions to maintain caseload per worker
• Includes increased funding and a decrease in FTE positions for Community-based Care expansion that occurred during fiscal year 2019
February 11, 2019 23LEGISLATIVE BUDGET BOARD ID: 5654
Contact the LBBLegislative Budget Board
www.lbb.state.tx.us512.463.1200
February 11, 2019 24LEGISLATIVE BUDGET BOARD ID: 5654