hidden diversity in the andes: comparison of species delimitation methods in montane marsupials
TRANSCRIPT

Accepted Manuscript
Hidden diversity in the Andes: Comparison of species delimitation methods inmontane marsupials
Thomas C. Giarla, Robert S. Voss, Sharon A. Jansa
PII: S1055-7903(13)00377-1DOI: http://dx.doi.org/10.1016/j.ympev.2013.09.019Reference: YMPEV 4720
To appear in: Molecular Phylogenetics and Evolution
Received Date: 30 April 2013Revised Date: 17 September 2013Accepted Date: 20 September 2013
Please cite this article as: Giarla, T.C., Voss, R.S., Jansa, S.A., Hidden diversity in the Andes: Comparison of speciesdelimitation methods in montane marsupials, Molecular Phylogenetics and Evolution (2013), doi: http://dx.doi.org/10.1016/j.ympev.2013.09.019
This is a PDF file of an unedited manuscript that has been accepted for publication. As a service to our customerswe are providing this early version of the manuscript. The manuscript will undergo copyediting, typesetting, andreview of the resulting proof before it is published in its final form. Please note that during the production processerrors may be discovered which could affect the content, and all legal disclaimers that apply to the journal pertain.

1
Hidden diversity in the Andes: Comparison of species delimitation methods in montane 1
marsupials 2
3
Thomas C. Giarlaa, Robert S. Voss
b, and Sharon A. Jansa
a 4
5
a Department of Ecology, Evolution, and Behavior; and J.F. Bell Museum of Natural History. 6
University of Minnesota, 1987 Upper Buford Circle, St. Paul, MN, 55108, USA 7
8
b Division of Vertebrate Zoology (Mammalogy), American Museum of Natural History, Central 9
Park West at 79th Street, New York, NY, 10024, USA 10
11
Correspondent: 12
Thomas C. Giarla 13
Department of Ecology, Evolution, and Behavior 14
University of Minnesota 15
1987 Upper Buford Circle, Room 100 16
St. Paul, MN 55108 17
651-925-6383 19
20

2
Abstract 21
22
Cryptic genetic diversity is a significant challenge for systematists faced with ever-23
increasing amounts of DNA sequence data. Computationally intensive coalescent-based analyses 24
involving multiple unlinked loci are the only currently viable methods by which to assess the 25
extent to which phenotypically similar populations (or metapopulations) are genetically distinct 26
lineages. Although coalescent-based approaches have been tested extensively via simulations, 27
few empirical studies have examined the impact of prior assumptions and dataset size on the 28
ability to assess genetic isolation (evolutionary independence) using molecular data alone. Here, 29
we consider the efficacy of two coalescent-based approaches (BPP and SpeDeSTEM) for testing 30
the evolutionary independence of cryptic mtDNA haplogroups within three morphologically 31
diagnosable species of Andean mouse opossums (Thylamys pallidior, T. sponsorius, and T. 32
venustus). Fourteen anonymous nuclear loci, one X-linked nuclear intron, and one mitochondrial 33
gene were analyzed for multiple individuals within each haplogroup of interest. We inferred 34
individual gene trees for each locus and considered all of the nuclear loci jointly in a species-tree 35
analysis. Using only the nuclear loci, we performed ―species validation‖ tests for the cryptic 36
mitochondrial lineages in SpeDeSTEM and BPP. For BPP, we also tested a wide range of prior 37
assumptions, assessed performance of the rjMCMC algorithm, and examined how many loci 38
were necessary to confidently delimit lineages. Results from BPP provided strong support for 39
two independent evolutionary lineages each within T. pallidior, T. sponsorius, and T. venustus, 40
whereas SpeDeSTEM results did not support splitting out mtDNA haplogroups as distinct 41
evolutionary units. For most tests, BPP was robust to prior assumptions, although priors were 42
shown to have an effect on both the strength of lineage recognition among T. venustus 43

3
haplotypes and on the efficiency of the rjMCMC algorithm. Comparisons of results from datasets 44
with different numbers of loci revealed that some cryptic lineages could be confidently delimited 45
with as few as two loci. [Keywords: Species delimitation, cryptic species, anonymous loci, 46
multilocus power analysis, Didelphidae, Thylamys] 47

4
1. Introduction 48
49
The current debate regarding species concepts (reviewed by Hausdorf 2011) shows no 50
sign of abating, but most biologists agree that speciation is an ongoing process, and that 51
contemporary populations of organisms represent evolutionary lineages at different stages of 52
distinctiveness (De Queiroz 2007). For some organisms, the delineation of independent 53
evolutionary lineages seems straightforward due to the presence of diagnostic morphological 54
characters, which can be expected to evolve either by genetic drift after a long history of 55
isolation or by divergent selection on readily observable traits (Lande, 1976). However, for many 56
organisms—perhaps especially animals that do not rely on visual mating cues (Bickford et al., 57
2007)—species recognition based solely on morphological differences can be problematic if 58
diagnostic traits are subtle, occur in commonly overlooked anatomical structures (e.g., soft 59
tissues), or simply are not present. 60
A proliferation of cryptic diversity in a given area could be caused by geographical or 61
ecological factors unique to that region. For example, mountainous areas might harbor more 62
cryptic lineages than lowland areas because rugged terrain and altitudinal zonation of habitats 63
could limit dispersal and thus create more opportunities for allopatric divergence, especially in 64
combination with dynamic climate-change regimes (Roy, 1997; Weir, 2006; Kozak and Wiens, 65
2006; Brumfield and Edwards, 2007; Ribas et al., 2007). In particular, if the ecological niches of 66
allopatric montane populations remain similar (Wiens and Graham, 2005), reliable phenotypic 67
indicators of lineage divergence may not evolve. In situations like this, morphological traits may 68
not be sufficient to detect recently diverged (or incipiently diverging) species. 69

5
Advances in DNA sequencing technologies over the past twenty years have allowed 70
systematists to uncover cryptic genetic diversity at a rapid pace, challenging all researchers who 71
study biological processes at or above the species level to contend with unexpected numbers of 72
putative lineages and candidate species (Beheregaray and Caccone, 2007; Bickford et al., 2007). 73
Mitochondrial DNA (mtDNA) markers have been especially effective for revealing cryptic 74
genetic diversity within animal systems because of the mitochondrial genome’s high mutation 75
rate and rapid coalescence time (Moore, 1995). However, the exclusive use of mtDNA in 76
phylogenetic and phylogeographic work has been criticized (Ballard and Whitlock, 2004; 77
Edwards and Bensch, 2009; Galtier et al., 2009), primarily because single-gene trees can deviate 78
from historical patterns of population branching due to the stochastic nature of coalescence 79
(gene-tree/species-tree incongruence; Degnan and Rosenberg, 2009). Nonetheless, studies that 80
include mtDNA are still common because mtDNA is typically quite variable for most animal 81
taxa, is easy to amplify and sequence, and may be a ―leading indicator‖ of isolation (Zink and 82
Barrowclough, 2008). Many studies that included both mtDNA and multiple unlinked nuclear 83
DNA (nDNA) markers have reported striking examples of cytonuclear discordance (Toews and 84
Brelsford, 2012). The discordance observed between trees inferred from mtDNA and nDNA 85
could be caused by phylogenetic error, incomplete lineage sorting, or lateral gene transfer (Funk 86
and Omland, 2003), so studies based on both types of data are necessary to disentangle the 87
evolutionary processes that resulted in observed patterns. 88
The purpose of this study is to evaluate the evolutionary independence of 89
morphologically cryptic mtDNA haplogroups within a genus of Neotropical marsupials based on 90
data from 15 nuclear loci and one mitochondrial locus. Didelphid marsupials of the genus 91
Thylamys are found in a variety of ecoregions in central and southern South America, but they 92

6
primarily inhabit arid and semiarid open habitats. Three species—T. pallidior, T. sponsorius, and 93
T. venustus—are principally montane (with some populations inhabiting areas up to 4000 meters 94
above sea level in the Andes) and occur in Peru, Bolivia, Chile, and Argentina. In a previous 95
study, we identified multiple allopatric mtDNA haplogroups within each of these species, but we 96
were unable to find morphological characters that could consistently distinguish conspecific 97
haplogroups (Giarla et al., 2010). Nevertheless, the deep mtDNA divergence we observed among 98
conspecific haplogroups (2.5% to 5.4 at the cytochrome b locus) suggests that up to seven 99
independent lineages might be present (Giarla et al., 2010). 100
A variety of methods have recently been proposed to assess the evolutionary 101
independence of putative lineages using DNA sequence data; here we focus on two of the more 102
widely used approaches. The first, Bayesian Phylogenetics and Phylogeography (BPP; Yang and 103
Rannala, 2010), provides a Bayesian approach to ―species delimitation‖ in which both 104
phylogenetic uncertainty and stochastic lineage coalescence are taken into account when testing 105
predefined splits on a single proposed species tree. BPP does this by simultaneously estimating a 106
distribution of genealogies for each locus and fitting that distribution to various permutations of 107
the species tree. The permutations allow the program to test different species tree models, from 108
the assumption of a single-taxon, panmictic population that incorporates all of the putative 109
species to the maximally resolved guide tree with each putative species as a tip. By contrast, 110
SpeDeSTEM (Ence and Carstens, 2011) is a software pipeline based on the multilocus species-111
tree method STEM (Kubatko et al., 2009), in which various permutations and combinations of 112
subpopulations within putative species are assessed for genetic independence using previously 113
estimated gene trees. SpeDeSTEM, unlike BPP, relies on a set of previously estimated gene trees 114
being in place before ―species limits‖ are assessed, so phylogenetic error is not incorporated 115

7
directly into the analysis. This approach, however, has the added benefit of being 116
computationally efficient, which becomes especially important if many sequences or loci are 117
included. 118
Tests of ―species limits‖ (in effect, genetic isolation) using both of these coalescent-based 119
approaches have the potential to validate or refute cryptic lineage diversity that only receives 120
weak support from traditional morphological approaches or that depends on single-gene 121
phylogenetic analyses. Here, we use both approaches to examine the coalescent history of 122
putative lineages within T. pallidior, T. sponsorius, and T. venustus in order to assess their 123
genetic independence. In addition to the evolutionary implications of our results, various aspects 124
of the lineage recognition process were considered and tested in this study, including: (1) Do 125
different coalescent-based ―species validation‖ approaches yield similar results based on the 126
same data? (2) How does the choice of priors affect Bayesian lineage recognition? (3) How 127
many loci are necessary to confidently recognize distinct lineages? And (4), to what extent do 128
partitions based on mtDNA haplotype membership correspond to real evolutionary units? 129
130
2. Materials and methods 131
132
2.1. Nuclear marker design 133
134
Primer pairs for nearly 40 anonymous nuclear loci were developed for testing within 135
Thylamys species. A genomic library of DNA fragments ranging in length from 500 to 1500 bp 136
was developed following a modified version of the genomic library generation protocol of Glenn 137
and Schabel (2005). First, whole genomic DNA was extracted from tissue sample NK22949 138

8
(Thylamys venustus) using a DNeasy Blood and Tissue Kit (Qiagen Inc.). Genomic DNA was 139
digested with restriction enzymes Xmn1 and Rsa and run on an agarose gel. Portions of the gel 140
corresponding to fragment lengths between 500 and 1500 bp were excised and purified using a 141
QIAquick Gel Extraction Kit (Qiagen Inc.). Double-stranded linkers were ligated to the size-142
selected fragments, and PCR was used to amplify the fragments. The resulting amplified 143
fragment library was cloned into E. coli cells using a pGEM-T Vector System (Promega Inc.). 144
After growing overnight, dozens of bacterial colonies containing inserts were picked with sterile 145
toothpicks and immediately added to a PCR reaction mixture (12.5 μL GoTaq Green Master Mix 146
[Promega Inc.], 1.0 μL of 10 μM M13F primer solution, 1.0 μL of 10 μM M13R primer solution, 147
and 10.5 μL water) for colony PCR (5 min. of initial melting at 95°; followed by 35 cycles of 148
melting at 95° for 30 sec., annealing at 55° for 30 sec., and extension at 72° for 1.5 min.; and a 149
final extension for 3 min. at 72°). PCR products were run on an agarose gel, with 700–1000 bp 150
fragments preferentially selected for further development. Selected PCR products were cleaned 151
using Exonuclease I and Shrimp Alkaline Phosphatase (Hanke and Wink, 1994) and sequenced 152
in both directions on an ABI 3730 at the University of Minnesota’s Biomedical Genomics 153
Center. 154
Sequences were assembled in Geneious version 5 (Drummond et al., 2011) and cloning 155
vector regions were trimmed. For 35 genomic regions, forward and reverse primers were 156
designed using the Primer3 (Rozen and Skaletsky, 2000) software plug-in in Geneious with the 157
goal of selecting primers that would amplify products between 500 and 800 bp long. All primers 158
were designed to be approximately 30 bp long in order to achieve a higher amplification success 159
rate and fewer instances of non-specific amplification (Belfiore, 2011). Primers were tested on 160
individuals from each of the three taxonomic species under consideration in this study: Thylamys 161

9
pallidior, T. sponsorius, and T. venustus. If amplification was successful, PCR products were 162
sequenced and aligned to determine if variation was present across the individuals tested. 163
Exemplar sequences from each of the markers developed were used as queries in a BLAST 164
search against GenBank’s nucleotide database to determine if the sequence contained protein-165
coding regions. In addition, a BLAT search (BLAST-Like Alignment Tool; Kent, 2002) was 166
used to identify the number and location of hits within the whole-genome sequence of the 167
didelphid marsupial Monodelphis domestica (Mikkelsen et al., 2007). Some BLAT searches 168
closely matched to multiple regions in the M. domestica genome, suggesting that the sequences 169
could have one or more paralogs that could ultimately be co-amplified if the marker were to be 170
developed further. BLAST searches revealed that a small number of sequences appeared to 171
contain protein-coding regions. Both protein-coding sequences and sequences that might have 172
closely related paralogs were eliminated from the pool of potential markers. Of the 35 primer 173
pairs designed, 14 sets were ultimately chosen for inclusion in this study based on product 174
length, ease of amplification, and presence of variation (Appendix A). 175
Two other markers with smaller effective population sizes (and thus, on average, shorter 176
coalescence times) than autosomal nDNA markers were included in analyses: the mitochondrial 177
protein-coding gene cytochrome b (CYTB) and an intron within the X-linked gene O-linked N-178
acetylglucosamine transferase (OGT). CYTB sequences for the individuals of interest were 179
compiled from a previous study (Giarla et al., 2010). The X-linked intron marker OGT was 180
developed by downloading a subset of single-copy gene sequences from the Ensembl Genome 181
Project (www.ensembl.org) for the Monodelphis domestica X chromosome and sorting by intron 182
size. We identified a ~600 bp intron between exons 8 and 9 of the M. domestica OGT gene and 183

10
designed primers from conserved portions of the flanking exon sequences that aligned across M. 184
domestica and Homo sapiens (Appendix A). 185
186
2.2. Sampling of loci and individuals 187
188
Fifteen nuclear markers (14 anonymous loci and the X-linked intron OGT) and one 189
mitochondrial marker (CYTB) were amplified and sequenced for multiple individuals within 190
Thylamys sponsorius, T. pallidior, and T. venustus, three species that occur in adjacent Andean 191
biomes of northern Argentina, Bolivia, northern Chile, and southern Peru (Fig. 1; Table 1). In a 192
previous analysis of mitochondrial DNA sequence variation, Giarla et al. (2010) observed 193
multiple morphologically undifferentiated mtDNA haplogroups within each of these Andean 194
species. Two haplogroups were identified within T. pallidior and T. sponsorius (designated as 195
―A‖ and ―B‖) and three were identified within T. venustus (designated as ―A‖, ―B‖, and ―C‖). In 196
all but one case (T. sponsorius A, but see Results), mitochondrial haplogroups were 197
monophyletic and well-supported by all nodal metrics (Giarla et al., 2010). Without exception, 198
all haplogroups assigned to the same species are allopatric, although the geographic ranges of 199
haplogroups T. venustus B and T. venustus C are closely juxtaposed near Vallegrande in western 200
Santa Cruz, Bolivia (Giarla et al., 2010). Limited by the availability of high-quality tissue 201
samples, between 4 and 10 individuals were chosen for inclusion in this study from within each 202
haplogroup, for a total of 60 individuals (Table 1). 203
PCR conditions were optimized for each set of primers, resulting in variation among 204
annealing temperatures and reagent concentrations. A typical PCR mixture contained 7.5 μL 205
GoTaq Green Master Mix (Promega Inc.), 0.5 μL of each 10 μM primer solution, and 5.5 μL 206

11
water. A typical thermocycler protocol consisted of 2 min. of initial melting at 95° followed by 207
35 cycles of melting at 95° for 30 sec., annealing at an optimized temperature for 30 sec., and 208
extension at 72° for 1 min., and ending with a single final extension for 7 min. at 72°. 209
Problematic amplifications were re-run using Platinum Taq DNA polymerase (Life Technologies 210
Corp.) with varying Taq concentrations. PCR products were cleaned and sequenced following 211
protocols described above. Chromatograms were compiled and edited in Sequencher 4.7 (Gene 212
Codes Inc.). All sequences used in this study are deposited in Genbank (Accession numbers 213
KF621308 - KF623029; Online Appendix B) 214
215
2.3. Haplotype phasing, sequence alignment, and neutrality tests 216
217
Heterozygous nuclear loci were phased in a three-step process. First, all length-variant 218
heterozygotes were phased using the software Champuru 1.0 (Flot, 2007). Champuru exploits the 219
haplotypic information contained in the overlapping chromatograms of length-variant 220
heterozygotes (Seroussi and Seroussi, 2007; Sorenson and DaCosta, 2011) and parses the 221
haplotypes of any heterozygous single-nucleotide polymorphisms (SNPs) present in the sequence 222
mixture. After running Champuru, remaining unresolved haplotypes were phased using the 223
software package PHASE (Stephens et al., 2001). Input files for PHASE were created using the 224
SeqPhase webserver (Flot, 2010). A ―known haplotype‖ file containing all of the haplotypes 225
resolved by Champuru was included in the PHASE analysis. PHASE was run using the default 226
settings, except the threshold for accepting a haplotype was reduced to 0.7, an appropriate value 227
based on simulation studies (Garrick et al., 2010). Finally, allele-specific sequencing primers 228
were developed for heterozygous sequences that remained unresolved after the first two steps. 229

12
PCR products from the original amplification attempts were re-sequenced with allele-specific 230
primers designed following the recommendations of Scheen et al. (2012). Successfully primed 231
haplotype sequences were added to the ―known haplotype‖ file, and PHASE was re-run with the 232
same settings as before. The four sequences that remained unresolved were removed from all 233
subsequent analyses. 234
Sequences were aligned using Clustal 2.0 (Larkin et al., 2007). Most alignments were 235
trivial and only required minor adjustments by eye. All alignments were tested for recombination 236
using the DSS method (McGuire and Wright, 2000) as implemented in the software package 237
TOPALi v2 (Milne et al., 2009). Neutrality of each locus was tested using Tajima’s D in DnaSP 238
v5 (Librado and Rozas, 2009). 239
240
2.4. Gene trees and “species” trees 241
242
Gene trees sampled across Thylamys pallidior, T. sponsorius, and T. venustus were 243
inferred from fourteen anonymous loci and one X-linked intron. For each locus, nucleotide 244
substitution models were fitted to phased sequence alignments using jModelTest 2.0 (Darriba et 245
al., 2012) and ranked according to the Bayesian Information Criterion (BIC). The best-fitting 246
model was chosen for each dataset, and phylogenetic trees were inferred in Garli 2.0 (Zwickl, 247
2006). All of the default settings in Garli were used, and Garli runs were replicated five times for 248
each locus to ensure consistency. For each locus, we report only the tree that received the highest 249
likelihood. 250
We used BEAST v. 1.7.4 (Drummond et al., 2012) to infer an ultrametric tree of 102 251
Thylamys pallidior, T. sponsorius, and T. venustus CYTB sequences used in a prior study (Giarla 252

13
et al., 2010). In that prior phylogenetic analysis of CYTB, which included all recognized 253
Thylamys species, we found that a partitioning scheme in which each codon position received its 254
own partition was the best fit (Giarla et al., 2010). Here, with a dataset that only included 255
Thylamys pallidior, T. sponsorius, and T. venustus, we used PartitionFinder (Lanfear et al., 2012) 256
to simultaneously evaluate nucleotide substitution models and codon-partitioning schemes. For 257
the BEAST analysis, we assigned the resulting best-fitting model to each partition and selected a 258
lognormal clock model, with the prior on the ucld.mean parameter set to an exponential 259
distribution with a mean equal to 1.0. Default settings were used for all other priors. BEAST was 260
run for 50 million generations, sampling every 50,000, and convergence of parameter estimates 261
was assessed using the program Tracer 1.5 (Rambaut and Drummond, 2007). 262
Before the computational tools to estimate species trees became widely available, 263
conventional multilocus phylogenetic approaches relied on concatenation of disparate genetic 264
loci into one effectively linked locus (Kubatko and Degnan, 2007). Such an approach neglects 265
the independent coalescent history of unlinked genomic regions and can lead to errors in 266
phylogenetic estimation and overconfidence in nodal support metrics (Edwards and Beerli, 2000; 267
Kubatko and Degnan, 2007). To avoid such problems, we estimated a ―species‖ (lineage) tree 268
from the 15 phased nDNA sequence datasets described above using BEAST 1.7.4 (Drummond et 269
al., 2012). Based on our results from individual-gene trees, sequences from two individuals with 270
putative hybrid ancestry were removed from the datasets used to estimate the species tree. We 271
identified these individuals as potential hybrids between T. sponsorius and T. venustus based on 272
the discordance between their positions in the mitochondrial-gene tree and their positions in the 273
nuclear-gene trees (see Results). The *BEAST algorithm (Heled and Drummond, 2010) was 274
implemented, and each sequence was assigned to a putative lineage based on the results from 275

14
analysis of CYTB alone. The same nucleotide substitution model from the Garli analyses were 276
used in BEAST. Each gene tree was tested for rate heterogeneity with likelihood-ratio tests by 277
comparing likelihood scores of trees with and without molecular clock constraints. A strict 278
molecular clock model was used for each locus that did not exhibit significant rate heterogeneity, 279
whereas a lognormal relaxed-clock model was used for each locus that did. All nucleotide 280
substitution and clock models were unlinked across loci, and all clock models were set to 281
―estimate‖ so that the resultant tree would be scaled to substitutions per site. Default settings 282
were used for all priors except for the lognormal clock model’s ucld.mean priors, which were set 283
to exponential distributions with a mean of 1.0. We ran the MCMC chain for 200 million 284
generations, sampling every 20,000th
generation, and assessed mixing in Tracer 1.5. 285
286
2.5. Bayesian “species” delimitation in BPP using nDNA 287
288
―Species‖ limits (lineage membership) based on mtDNA haplogroups were tested with 289
fifteen nuclear loci (mtDNA excluded) using BPP v 2.1 (Yang and Rannala, 2010). The BPP 290
model assumes no exchange of genes between species (Mayr, 1942), that recombination does not 291
exist within sampled loci, that all loci are independent, and that all loci are evolving neutrally. 292
BPP implements a Jukes-Cantor model of nucleotide evolution because all sampled sequences 293
are expected to be closely related. The posterior distribution of two population genetic 294
parameters are sampled: contemporary and ancestral mutation-rate-scaled effective population 295
sizes (θ) and mutation-rate-scaled species divergence times (τ). Priors for all θ parameters and 296
the τ parameter for the root of the species tree are modeled as gamma distributions (α, β), where 297

15
the prior mean = α/β and its variance = α/β2. All other τ parameters in the model were assigned a 298
Dirichlet prior. 299
In the species-delimitation model used by BPP, the variation inherent to the coalescent 300
process is explicitly incorporated, and gene trees are sampled under the constraints of a user-301
defined guide tree. When testing the limits between just two putative species, the guide tree is a 302
trivial two-taxon dichotomy. However, when testing limits between three or more species, the 303
guide tree should be justified based on morphology, geography, or a previously inferred species 304
tree (Yang and Rannala 2010). Unfortunately, mis-specified guide trees can lead to false 305
positives if divergent populations are incorrectly associated as sister taxa (Leaché and Fujita, 306
2010). Given a guide tree, a reversible-jump Markov Chain Monte Carlo (rjMCMC) algorithm 307
moves between different species delimitation models by collapsing and resolving nodes 308
throughout the tree, from a fully resolved model wherein each tip of the guide tree is considered 309
a species, to a fully collapsed model wherein all sequences are considered part of the same 310
species. The rjMCMC chain samples a posterior distribution of speciation probabilities for each 311
split in the pre-specified guide tree. Three separate datasets were initially constructed for species 312
delimitation in BPP: (1) Thylamys pallidior A and B; (2) T. sponsorius A and B; and (3) T. 313
venustus A, B, and C. Sequences were assigned to putative species based on mtDNA 314
haplogroups, and the guide tree for T. venustus was based on the topology of the *BEAST 315
species tree analysis (which also matched our previously studied CYTB topology [Giarla et al., 316
2010: fig. 8]). 317
The rjMCMC algorithm exhibits mixing problems for datasets with a large number of 318
loci and sequences (Yang and Rannala, 2010), as is the case for the three datasets considered 319
here. Poor mixing is manifested by different runs giving substantially different results, or the 320
chain getting ―stuck‖ on the fully resolved or fully collapsed guide tree. During trial runs, these 321

16
behaviors were observed for all three fully phased Thylamys datasets. Considerably better mixing 322
was observed when a smaller, pruned dataset was used. Simulation studies have shown that five 323
sequences per putative population are sufficient for species delimitation when at least 10 loci are 324
used (as in this study), but datasets with even fewer sequences are still successful as long as more 325
loci are included (Yang and Rannala, 2010; Zhang et al., 2011). Our pruned datasets varied in 326
size, but ranged from four sequences (T. pallidior A) to ten sequences (T. pallidior B). one 327
haplotype sequence from each pair of phased sequences for a given diploid individual for all 328
individuals (mostly eliminating duplicate sequences from homozygous individuals). For the X-329
linked intron OGT, males were already represented by one sequence alone, so only sequences 330
from females were pruned by half. Pilot trials using the final pruned datasets reached the same 331
results for different starting trees, suggesting that proper mixing of the rjMCMC algorithm was 332
occurring. 333
334
2.5.1. Effect of priors on species delimitation 335
336
Misspecified priors can have a strong influence on the accuracy of species delimitation 337
(Zhang et al., 2011), so different values for the gamma shape parameters α and β were tested for 338
each dataset. In total, seven different sets of priors were tested (Table 2). The first set of priors 339
considered (Scheme 1: Thylamys-specific) were derived based on Thylamys-specific estimates of 340
means for τ and θ. Jansa et al. (unpublished) inferred a time-scaled phylogeny for Didelphidae 341
based on five protein-coding nuclear genes and five external fossil calibrations; this dated 342
phylogeny included T. pallidior, T. venustus, and two other congeneric species. The average age 343
of the most recent split among these Thylamys species was estimated to be 0.8 Ma, and we 344

17
assume that all splits among the haplogroups analyzed in this report (but not analyzed by Jansa et 345
al.) would have occurred before at least 0.7 Ma. Given this assumption and a nuclear gene 346
mutation rate of ~10-9
substitutions per site (Kumar and Subramanian, 2002), a prior distribution 347
for τ could be approximated with a mean of 0.0007. DNAsp v5 (Librado and Rozas, 2009) was 348
used to identify an initial mean value for Watterson’s estimator of θ (θW; Watterson, 1975) for 349
each of the three final datasets. All three datasets had similar average θW’s across all loci (Table 350
3), and the average across the three datasets is 0.004. Diffuse gamma priors based on these 351
estimates of θ and τ were θ ~ (2, 500) and τ ~ (2, 3000). Because the gamma distribution for 352
the θ prior is based on the same data as used in the BPP runs themselves, Scheme 1 is not a 353
strictly Bayesian approach to fixing priors. To deal with potential prior misspecification, 354
independent prior schemes were considered. Similar to an approach suggested by Leaché and 355
Fujita (2010), six additional sets of priors were tested, in which three different divergence depths 356
(~0.1 Ma, 1.0 Ma, and 10.0 Ma, assuming a nuclear gene mutation rate of ~10-9
) and two 357
different effective population sizes (large, θ ~ 0.1; and small, θ ~ 0.001) were chosen (Table 2). 358
In order to ensure convergence and proper mixing of the rjMCMC algorithm, a total of 359
four BPP runs (together referred to as a ―set‖) were initialized for each of the three datasets by 360
varying the starting tree (fully resolved or collapsed) and the rjMCMC algorithm (algorithm 0 or 361
1 from Yang and Rannala, 2010). During pilot trials, the best mixing was observed for algorithm 362
0 with fine-tune parameter ε = 20 and for algorithm 1 with fine-tune parameters α = 2 and m = 363
0.5. As such, those tuning values were implemented in the corresponding final runs. All runs 364
used the cleandata=1 setting to eliminate gaps; inter-locus rate heterogeneity was modeled using 365
a Dirichlet distribution D(α), where α = 10; and the heredity scalar for the X-linked OGT gene 366

18
was set to 0.75. Each run consisted of a burn-in period of 50,000 steps and a sampling period of 367
500,000 steps (logged every 5), for a total of 100,000 samples. 368
369
2.5.2. Putative hybrids and confirmation of taxonomic species 370
371
Sequences from two individuals assigned to Thylamys venustus C (vouchered by OMNH 372
29966 and MSB 67392; Table 1) exhibited strikingly discordant signals between nuclear and 373
mitochondrial trees. For nearly all of the nuclear trees, one or both of the alleles from these 374
individuals sort with T. sponsorius sequences. Such strong and consistent cytonuclear conflict 375
suggests introgression as opposed to incomplete lineage sorting. Consistent with this 376
interpretation, both specimens are from a region of known geographic range overlap between T. 377
sponsorius and T. venustus, and one of them (OMNH 29966) was previously recognized as a 378
phenotypic intermediate based on craniodental measurements (Giarla et al., 2010: fig. 18). 379
Because these putative hybrids likely represent gene flow between sympatric T. sponsorius and 380
T. venustus, and not gene flow between allopatric haplogroups within T. venustus or T. 381
sponsorius, these individuals were removed from all of the species delimitation analyses that 382
concerned differentiation of haplogroups. To assess the taxonomic distinctiveness of T. 383
sponsorius and T. venustus, a final set of BPP runs was completed on a dataset that grouped 384
together haplogroups within these morphologically diagnosable species and included sequences 385
from the putative hybrids. 386
Although the model assumes no gene flow between putative lineages, simulation studies 387
have found that low levels of gene flow do not hinder species delimitation using BPP (Zhang et 388
al., 2011; Camargo et al., 2012). A large dataset that included all individuals (including putative 389

19
hybrids) and all loci for T. sponsorius and T. venustus exhibited inconsistent results. To attain 390
better mixing, four sequences from each haplogroup were randomly chosen for inclusion in a 391
pruned dataset, along with the sequences from the two putative hybrids. Following the same 392
procedure as described above, seven different prior schemes were tested to account for different 393
depths of divergence and effective population size. In order to ensure consistent results, four 394
rjMCMC runs were initialized for each of the prior schemes following the same procedure as for 395
the haplogroup tests described in the previous section. 396
397
2.5.3. Impact of number of loci on species delimitation 398
399
In order to determine what effect the number of loci used in each BPP run might have on 400
its ability to delimit independent evolutionary units, multilocus power analyses were completed 401
(Roe et al., 2010). For each of the three taxonomic species, loci were randomly removed and 402
BPP was re-run using rjMCMC algorithm 1 (with fine tune parameters α = 2 and m = 0.5), Prior 403
Scheme 1, the same run parameters as the species delimitation tests described above, and a 404
randomly collapsed or resolved guide tree. Six dataset size classes were considered: 15 loci, 12 405
loci, 8 loci, 4 loci, 2 loci, and 1 locus. Within the 12-, 8-, 4-, and 2-locus size classes, four 406
randomly rarefied datasets were constructed as replicates. For the single-locus datasets, all 15 407
loci were considered separately as single-locus replicates. For the complete, 15-locus dataset, the 408
same dataset was used for four replicated BPP runs. The number of sequences per locus was the 409
same across all trials within a given taxonomic species. 410
411
2.5.4. Assessment of mixing 412

20
413
For some datasets it can be difficult to distinguish between a run with poor mixing that is 414
―stuck‖ on a fully resolved species model, versus a run in which the posterior probability of a 415
given split in the tree is so high that the algorithm should not be expected to visit the collapsed 416
trees at an appreciable rate. To further verify that the rjMCMC algorithm was working 417
effectively, nuclear sequences were randomly assigned to putative species within a given dataset, 418
and BPP trials were repeated with Prior Scheme 1. Under this tip-randomization scheme, it is 419
expected that a one-species model (where all of the nodes in the guide tree are collapsed) will be 420
favored over a multi-species model. If the rjMCMC algorithm were to get stuck on a fully 421
resolved guide tree despite randomly assigned sequences, the algorithm could not be expected to 422
display appropriate mixing on the non-randomized datasets. However, if the algorithm is able to 423
move between different levels of guide tree resolution and consistently results in a one-species 424
model (i.e., the expectation for a random mixture of sequences sampled from two reproductively 425
isolated species), the algorithm is behaving properly. 426
427
2.6. Species delimitation in SpeDeSTEM 428
429
SpeDeSTEM (Ence and Carstens, 2011) is a computationally efficient approach to 430
species validation based on the STEM method of species-tree estimation (Kubatko et al., 2009). 431
Sequences are first assigned to putative species, then gene trees are estimated in PAUP* 432
(Swofford, 2002) and input files for STEM are generated for each possible permutation of 433
lineage grouping. SpeDeSTEM extracts the log-likelihood scores from STEM for each 434
permutation and ranks the models according to AIC score. This approach relies on the 435

21
assumption that gene trees are estimated accurately and that the alignment for each locus does 436
not deviate from a molecular clock model. After testing clock models for BEAST (described 437
above), we removed two loci (Anon72 and Anon122) for which we were able to reject a 438
molecular clock model and prepared input files for SpeDeSTEM for the remaining 13 loci. 439
STEM requires an estimate of in order to scale the branch lengths in the species trees it 440
produces. Using DNAsp v5 (Librado and Rozas, 2009), we computed the average across the 13 441
included loci (Table 3), but we ultimately tested different values from 0.01 to 0.05 (in 442
increments of 0.01) in SpeDeSTEM due to numerical issues associated with calculating 443
likelihoods with small values. We ran SpeDeSTEM for 100 replicates, with each replicate 444
including 4 randomly subsampled alleles per putative taxon as suggested by Hird et al. (2010), 445
and tested all 20 possible permutations for haplogroup clustering within taxonomic species. 446
447
3. Results 448
449
3.1. Gene tree and species tree results 450
451
Of the 14 anonymous nDNA markers developed for this study, 11 could be mapped to 452
Monodelphis domestica autosomes (Table 3). The remaining three markers that could not be 453
mapped to the M. domestica genome also did not receive any strong hits to the non-redundant 454
―nr‖ nucleotide BLAST database, suggesting that these genomic regions do not contain protein-455
coding genes. Neutrality tests across all loci using Tajima’s D statistic revealed that none of the 456
loci exhibited significant signs of selection (Table 3), and tests for recombination using the DSS 457
method revealed that only the alignment for Anon-94 exhibited signs of a recombination 458
22
breakpoint. The shorter of the two regions on either side of the breakpoint in Anon-94 was 459
removed from the alignment and from all subsequent analyses. Measured across all sampled 460
sequences and species, θW ranges from 0.003 (the X-linked intron OGT) to 0.021 (Anon-101), 461
and the average over all of the loci is 0.009. 462
For the BEAST analysis of CYTB, the best data partitioning scheme included a separate 463
partition and substitution model for each codon position (Position 1: TrNef+I; Position 2: 464
HKY+I; Position 3: TrN). The ultrametric CYTB tree (Fig. 2) illustrates the relative divergence 465
times of each haplogroup. Thylamys sponsorius haplogroups diverged most recently, whereas the 466
deepest splits within T. venustus and T. pallidior appear to have occurred in the more distant 467
past. Each of the 15 nDNA locus alignments was analyzed separately, and the resultant 468
phylogenetic trees exhibit a wide range of relative substitution rates and topologies (Online 469
Appendix C). Notably, the haplogroup designations apparent in the CYTB tree (Fig. 2) are not 470
consistently resolved in many of the gene trees. In fact, for some of the nuclear loci, the 471
taxonomic species T. pallidior, T. sponsorius, and T. venustus do not sort into monophyletic 472
groups. Two individuals initially identified as Thylamys venustus C based on mtDNA sequences 473
and morphology (tissue nos. Arg 1108 and NK 23992 in Table 1; collecting localities marked 474
with asterisks on Fig. 1) have nuclear sequences that cluster with T. sponsorius, providing 475
evidence for limited introgression between T. sponsorius and T. venustus. Sequences from these 476
individuals were removed from BPP analyses comparing haplogroups within taxonomic species 477
but were retained in the analysis that lumped haplogroups in order to validate the species status 478
of T. venustus versus T. sponsorius. 479
Results from the species-tree analysis of nuclear data in *BEAST (Fig. 3) support the 480
same tree topology as the CYTB tree alone (Fig. 2), with posterior probabilities ≥0.95 at all 481

23
nodes. For Thylamys venustus, haplogroups B and C together formed a clade to the exclusion of 482
haplogroup A, and we used this topology for the T. venustus guide tree in BPP. 483
484
3.2. Species Delimitation using BPP with Fifteen Nuclear Loci 485
486
3.2.1. Performance of the rjMCMC algorithm 487
488
As expected, BPP runs in which sequences were randomly assigned to haplogroups 489
within a taxonomic species never recovered significant support for the defined haplogroups 490
(Table 4), indicating that the dataset size and parameters used were tractable for BPP’s rjMCMC 491
algorithm, at least for Prior Scheme 1. In total, 35 sets of analyses on the non-randomized 492
datasets were conducted (Table 4), with each set comprising 4 replicates that varied by rjMCMC 493
algorithm (0 or 1 from Yang and Rannala, 2010) and collapsed/resolved starting tree. We 494
considered a set inconsistent—and thus mixing poorly—if at least one run strongly supported a 495
different species delimitation scenario from the other runs. Of the 35 sets, three sets using Prior 496
Scheme 6 (―Deep-Large‖) exhibited inconsistent results across replicates (Table 4). The 497
remaining 32 sets converged on similar results across replicates, which indicates efficient mixing 498
of the rjMCMC chain. 499
500
3.2.2. The effect of priors on species delimitation 501
502
The effect of applying different prior schemes on species delimitation could be studied 503
for the 32 sets of analyses that exhibited proper mixing. For Thylamys pallidior and T. 504

24
sponsorius, both sets of haplogroups receive strong support as distinct species, irrespective of 505
prior scheme. Within T. venustus, the sets that exhibited proper mixing consistently reject the 506
model that splits haplogroups A, B, and C into three distinct species. For the deeper split within 507
T. venustus—between haplogroup A and the clade that unites haplogroups B+C—the choice of 508
prior dramatically affects the results. Results based on Prior Schemes 1, 2, and 3 agree that A 509
should be distinct from B+C, but results based on the remaining prior schemes support uniting 510
all of T. venustus haplogroups into one species. In order to confirm that T. sponsorius and T. 511
venustus were, in fact, genetically isolated taxa, separate analyses were conducted on a dataset 512
that pooled all of the haplogroups within each of these taxonomic species. Unlike the previous 513
tests involving T. sponsorius and T. venustus haplogroups, sequences from two individuals with 514
suspected hybrid ancestry were not removed before running BPP. Across all of the prior 515
schemes, BPP consistently resolved T. sponsorius and T. venustus as distinct species at the 516
highest level of support (Table 4). 517
518
3.2.3. Multilocus power analysis 519
520
The effects of randomly removing loci from BPP analyses varied among the three 521
taxonomic species (Fig. 4). At one extreme, the Thylamys sponsorius A and T. sponsorius B 522
were consistently differentiated with only two loci, and seven single-locus replicates received 523
posterior probabilities (PP) for species delimitation >0.95 (Fig. 4b). The distinction between T. 524
pallidior A and T. pallidior B received consistently high support (1.0 PP) with eight or more 525
loci, but two four-locus replicates recovered these groups with >0.95 PP (Fig. 4a). The 526
differentiation of T. venustus haplogroup A from B+C received consistent support (≥0.95 PP) 527

25
with eight loci (Fig. 4c), but support varied (between 0.78 and 1.0 PP) for replicates of 12 loci; 528
for 15 loci, the average support for this split was 0.99 PP. Across all trials, support for 529
differentiation between T. venustus B and T. venustus C never exceeded 0.80 PP, and the 530
maximum number of loci (15) supports differentiation between these two lineages with only 0.59 531
PP (Fig. 4d). Across all species, the single-locus replicates were especially variable, with some 532
single-locus replicates accurately delimiting species with posterior probabilities above 0.95 but 533
most coming nowhere near this threshold. 534
535
3.3. Species Limit Validation using SpeDeSTEM 536
537
When we used Watterson’s estimator of genetic diversity across all species and 538
haplogroups (0.009) as the estimate for in SpeDeSTEM, the program would not work properly, 539
presumably due to computational problems associated with calculating likelihoods when is 540
small (described in the STEM User Manual). Results from our SpeDeSTEM analysis of the 13 541
nDNA loci that fit the assumption of a molecular clock do not support our hypothesis that all of 542
the mtDNA haplogroups within Thylamys pallidior, T. sponsorius, and T. venustus should be 543
considered separate species (Table 5; only results from the analysis in which was set to 0.05 544
are shown). Instead, the model that receives the highest support (52% of the model weighting) 545
unites the haplogroups within T. pallidior and T. sponsorius, and separates out T. venustus B 546
from T. venustus A+C. The latter result contrasts with both our mtDNA topology and species 547
tree analysis, in which T. venustus A is sister to haplogroups B+C. The next two best-supported 548
models (each receiving about 20% of the overall model weighting) are similar to the top choice, 549
but either T. pallidior A and B or T. sponsorius A and B are considered distinct in the models. 550

26
The model that receives the lowest weighting is the one in which all of the haplogroups are 551
considered distinct, and the model supported by BPP is ranked 19th
of the 20 possibilities. 552
553
4. Discussion 554
555
The main goal of this study was to test the evolutionary independence (genetic isolation) 556
of mitochondrial lineages within three montane Thylamys species that were identified in a 557
previous phylogenetic study of this genus (Giarla et al., 2010). To do so, we analyzed 15 nuclear 558
DNA markers using two commonly used coalescent-based approaches: BPP (Yang and Rannala, 559
2010) and SpeDeSTEM (Ence and Carstens, 2011). This study design facilitates an empirical 560
evaluation of analytical approaches to ―species‖ delimitation, and we consider this topic first 561
before addressing the biological and evolutionary implications of our results. 562
563
4.1. Comparison of “species delimitation” methods 564
565
Results from BPP and SpeDeSTEM support different conclusions regarding the number 566
of evolutionarily independent units within the species studied. Whereas BPP supports the 567
recognition of six independent lineages (two within each of the species), SpeDeSTEM supports 568
the recognition of only four (one each for T. pallidior and T. sponsorius plus two within T. 569
venustus). Moreover, the recognition of lineages within T. venustus differs between the two 570
programs: BPP supports the basal split between the mitochondrial lineages A versus B+C, 571
whereas SpeDeSTEM supports a split between B and A+C that was not apparent in analysis of 572
the mitochondrial data or the nDNA species tree analysis. The difference between the lineage-573

27
splitting models supported by the two analyses is significant: the top four models in the 574
SpeDeSTEM analysis encompass 100% of the total model probability, but the model supported 575
by BPP is ranked 19th
out of 20 possible models. Such a large difference suggests that 576
assumptions inherent in the two different approaches to lineage recognition are strongly 577
influencing our results. 578
One significant issue with BPP (or any other Bayesian) analysis concerns the appropriate 579
specification of priors (Zhang et al., 2011). In our case, different priors affect both the 580
probability of delimiting multiple species (Table 4) and the performance of the algorithm (i.e., 581
consistency of rjMCMC results across multiple runs). One reasonable approach to prior 582
specification suggested by Leaché and Fujita (2010) is to analyze data under a range of different 583
prior schemes that encompass multiple speciation scenarios. Although this approach is far 584
superior to assuming a single set of priors, results should still be interpreted carefully. Leaché 585
and Fujita (2010) imply that setting priors for large population size and recent divergence times 586
will be the ―most difficult‖ scenario in which to test species delimitation, but this is not 587
necessarily true. Any prior that is not concordant with a strong signal from the data has the 588
potential to cause problematic results. In particular, an incorrect prior in conjunction with weak 589
signal in the data can yield results strongly biased by the prior (Zhang et al., 2011). 590
For our data, a prior scheme that coupled deep divergence times with a large population 591
size (Scheme 6) seemed especially problematic. For three of our five cases, analyses under this 592
set of priors failed to exhibit adequate mixing of the rjMCMC chain, so the results are unreliable 593
(Table 4). Setting this apparently unreasonable scenario aside, posterior probability estimates of 594
lineage independence (or lack thereof) were reassuringly consistent across a wide range of other 595
prior schemes for most of our cases. The single exception concerns whether to recognize one or 596

28
two independent lineages within T. venustus. The decision here rests on which prior scheme is 597
more reasonable for these data: one that assumes a recent (~0.1 Ma) basal divergence within the 598
taxonomic species versus ones that assume moderate (~1.0 Ma) or deep (~10.0 Ma) divergence, 599
irrespective of effective population size (Table 4). 600
In an attempt to evaluate this question, we estimated priors for our sample by using 601
existing data. To establish a prior for the splitting-time parameter , we used a fossil-calibrated 602
phylogeny of Didelphidae based on five independent nuclear protein-coding genes (Jansa et al., 603
unpublished). For θ, we used the average value of θW from the 15 nuclear loci used in this study. 604
This ―Thylamys-specific‖ prior exhibited good chain mixing in all cases, and recovered 605
consistent posterior probability values for the four cases that were not sensitive to prior 606
specification (Table 4). In the one case where prior specification affected our results (whether to 607
recognize one vs. two lineages of T. venustus), posterior probability estimates derived under this 608
prior scheme were consistent with those derived under prior schemes that assumed a recent 609
divergence time, but differed from those assuming moderate or deep divergences. In this case, 610
the population-size prior seemed to exert relatively little influence, as posterior probability 611
estimates for the two shallow-divergence schemes (large vs. small population size, schemes 2 612
and 3, respectively) were similar. Although using such empirically derived parameter estimates 613
for construction of priors might not be possible for some systems, this approach can help 614
distinguish among reasonable and unreasonable prior schemes. In our case, the deeper 615
divergence priors apparently conflict with the signal in the data, a behavior that was also 616
observed by Zhang et al. (2011) in their simulation study. 617
For SpeDeSTEM, a significant analytical issue concerns the reliability of the method for 618
inferring very recent lineage divergence. Two recent simulation studies testing the efficacy of 619

29
SpeDeSTEM have addressed this issue. Ence and Carstens (2011) found that the method was 620
effective at delimiting species that have diverged as recently as 0.25Ne generations ago, as long 621
as more than 10 loci were used. Camargo et al. (2012), however, found that SpeDeSTEM 622
performed quite poorly in scenarios in which putative species diverged less than 0.75Ne 623
generations ago, even when 10 loci were used. They note that the discrepancy between their 624
simulations and Ence and Carsten’s (2011) may be due to the relative amount of genetic 625
diversity (as approximated by ) in the gene sequences, with low-information alignments leading 626
to increased uncertainty in gene tree estimation (Camargo et al., 2012). Our estimates of and 627
(0.004 and 0.0007, respectively) suggest that all of the putative divergences considered here 628
occurred approximately 0.175Ne generations ago, putting these Thylamys species well below the 629
range in which SpeDeSTEM has been demonstrated to perform acceptably. Moreover, Camargo 630
et al. (2012) found that BPP performed very well across a range of different simulated datasets, 631
even when putative species were modeled to have diverged from one another only very recently. 632
As such, we think it is appropriate to rely on the BPP results over the SpeDeSTEM results, and 633
this study further supports the conclusions about the efficacy of SpeDeSTEM for recent 634
divergences noted by Camargo et al. (2012). It is likely that error in estimation of the gene trees 635
is high enough to obscure the signal of recent divergence and that it is necessary to incorporate 636
this error directly into species validation methods (as done in BPP) in order to recover the signal. 637
638
4.2. Lineage recognition using mitochondrial vs. nuclear loci 639
640
Our multilocus analysis clearly indicates that six of the seven mitochondrial haplotype 641
groups we tested correspond to genetically isolated lineages. The concordance between 642

30
mitochondrial and nuclear-gene analyses in these six cases provides additional evidence that the 643
inferred mitochondrial structure reflects true lineage splits rather than stochastic lineage sorting. 644
However, the two most recently formed mitochondrial haplogroups within T. venustus—even 645
though they are each strongly supported and exhibit relatively high sequence divergence—646
appear simply to reflect stochastic processes. It would be difficult to predict this latter result from 647
our analysis of the mitochondrial data alone. For example, the most recent split in our 648
mitochondrial phylogeny defines the two haplogroups within T. sponsorius (Fig. 2). If the timing 649
of this split reflects the relative recency of population splitting, then we might expect nuclear loci 650
to have had insufficient time to coalesce and define these two lineages. Perhaps surprisingly 651
then, analyses of the nuclear gene data provide very robust support for recognition of these two 652
lineages: the 15-locus BPP analysis supports two lineages of T. sponsorius across the full range 653
of prior schemes (Table 4), and our multilocus power analysis suggests that these two lineages 654
could be identified with datasets comprising as few as two nuclear loci (Figure 4). Conversely, 655
the split between the mitochondrial lineages B and C of T. venustus apparently predates the split 656
within T. sponsorius (Fig. 2), implying a higher probability that nuclear genes would have 657
coalesced for these lineages. Nevertheless, none of the BPP analyses supports this split, even 658
when 15 loci are included. Thus, although it has been argued that mitochondrial data—due to its 659
relatively small effective population size and rapid coalescence time—is a leading marker of 660
within-species genetic structure (Zink and Barrowclough, 2008), our results suggest that it is 661
impossible to distinguish population divergence from stochastic lineage sorting based solely on 662
analyses of mitochondrial loci. 663
Nuclear data are also critically important for addressing the relative timing of lineage 664
splitting events. Notably, for montane species such as these, coincident splits across multiple 665

31
species could reflect a synchronized response to a single or very closely spaced geological or 666
climatic events (Arbogast and Kenagy, 2001; Hickerson et al., 2006; McCulloch et al., 2010; 667
Bell et al., 2012). Point estimates of relative divergence times derived from our mitochondrial 668
DNA tree suggest that the basal divergence events within each of the three taxonomic species 669
were asynchronous, with simultaneous splits in T. pallidior and T. venustus preceding the split 670
within T. sponsorius by a factor of two (Fig. 2). However, the error surrounding these single-671
locus estimates is so large that the possibility of synchronous splitting cannot be rejected (Fig. 5). 672
In contrast, mean estimates of relative lineage divergence time from the 15-locus nuclear gene 673
dataset are all more recent than those derived from the single-locus mitochondrial dataset; 674
moreover, the precision of these nuclear gene estimates appears to be far higher. The error 675
estimates surrounding basal lineage splitting times derived from the 15-locus nuclear dataset are 676
at least five times smaller than the error surrounding estimates derived from the single 677
mitochondrial locus. With these reduced error estimates in hand, rather than failing to reject 678
synchronous splitting, our confidence in the conclusion that these splits were either synchronous 679
or very closely spaced in time is markedly improved. 680
681
4.3. A large number of loci might not be needed to identify cryptic lineages 682
683
At the shallow level of divergence considered here, individual gene trees based on a 684
single nuclear locus are not well resolved and reveal little about potential species limits (Online 685
Appendix C), a result that is in accordance with the expectations of coalescent theory for recently 686
diverged species (Hudson and Coyne, 2002). When considered in combination and as part of a 687
coalescent framework, nuclear genes have much greater power to detect phylogenetic units; by 688

32
integrating over phylogenetic error, the BPP algorithm leverages this power to weigh alternative 689
species delimitation scenarios (Yang and Rannala, 2010). Coalescent-based species delimitation 690
methods—including BPP and SpeDeSTEM—may offer an objective, quantitative method by 691
which to weigh alternative hypotheses of lineage independence (Fujita et al., 2012). However, 692
one potential drawback to these methods is that putative species boundaries and guide trees must 693
be defined in advance, and incorrect assignments may lead to erroneous conclusions. Given these 694
issues, it is evident that preliminary studies using mitochondrial sequences or morphology are 695
still important steps in detecting cryptic diversity. In addition, other multilocus methods for 696
species delimitation that do not rely on a priori species assignments are available to facilitate 697
lineage recognition in potentially cryptic taxa (Pons et al., 2006; O'Meara, 2010; Reid and 698
Carstens, 2012; Rittmeyer and Austin, 2012). Thus, whereas morphology might not detect 699
recently diverged lineages, and mitochondrial sequences might over-split species, multi-locus 700
nuclear data and associated analytical approaches offer a powerful way to interrogate cryptic 701
diversity. 702
With this in mind, the question of how many independent loci—and how many alleles for 703
a given locus—to sample become important analytical concerns (Pluzhnikov and Donnelly, 704
1996; Felsenstein, 2006; Carling and Brumfield, 2007; Brito and Edwards, 2008; Dupuis et al., 705
2012). With massively parallel sequencing platforms becoming more widely available and 706
cheaper to use, it is easier than ever before to generate large quantities of sequence data. A 707
fundamental question remains, however: is it really necessary to use thousands of loci to delimit 708
species when traditional approaches may be cheaper (at least for the time being) and just as 709
effective? Also, if loci are limiting, and incorporating gene tree uncertainty is critical, next-710
generation sequencing data (which might have only one or two SNPs per locus, McCormack et 711

33
al., 2013) may not be the best choice given current analytical tools. Our results indicate that BPP 712
can consistently detect lineage distinctiveness with sequences from as few as two nuclear loci. 713
However, this varied widely, and in some cases more loci were needed. Overall, this finding 714
concurs with simulation studies. Zhang et al. (2011) found that a single locus might be enough to 715
identify some recent speciation events, as long as a large number (ca. 15+) of sequences per 716
putative species are used. Camargo et al. (2012) concurred, and further found that BPP 717
performed better than other coalescent-based methods like SpeDeSTEM in situations with post-718
divergence gene flow and recent splits. SpeDeSTEM, with its reliance on point-estimates for 719
gene trees, would likely perform better with more information-rich alignments (i.e., higher 720
values) because they would garner more robustly supported gene trees. Regardless, our data 721
suggest that a moderate number (rather than thousands) of loci can provide relevant information 722
for identification of cryptic lineages, even when divergence is relatively recent. To save costs, 723
we recommend attempting species delimitation in BPP using a moderate number of loci (e.g., 724
four to eight) before investing in more intensive sequencing efforts. 725
726
4.4. Introgression detected between two species 727
728
Thylamys sponsorius and T. venustus are found in similar habitats on the eastern Andean 729
slopes and foothills of Bolivia and northern Argentina, and they are known to occur 730
sympatrically in at least one sampling area (Giarla et al., 2010). Despite deep divergence in the 731
mtDNA tree, these species are morphologically similar, with no single phenotypic character 732
consistently distinguishing them. Previously, a multivariate morphometric analysis of 733
craniodental characters demonstrated that samples of sequenced specimens could be 734

34
distinguished by linear combinations of measurement variables; these factors were then used to 735
assign taxonomic names to molecular clades by computing scores of unsequenced holotypes 736
(Giarla et al 2010). Two sequenced specimens, however, could not be convincingly assigned to 737
species based on morphometrics alone (Giarla et al., 2010), hinting at the possibility that they 738
might be hybrids. Genetic data reported here provide some support for that possibility. One of 739
these morphometric intermediates (Arg 1108) is also one of the two individuals that clusters with 740
the T. venustus C clade in the CYTB tree but with T. sponsorius in the nDNA gene trees (Online 741
Appendix C). In contrast, NK 23992 is morphometrically assigned to T. venustus with high 742
confidence, but exhibits just as much cytonuclear discordance as Arg 1108. Because Arg 1108 743
exhibits both morphometric intermediacy and strong cytonuclear discordance, we feel confident 744
in concluding that it comes from a population that has experienced introgression. Although NK 745
23992 is confidently assigned to T. venustus based on morphology alone, the strong degree of 746
discord between the CYTB results and the nDNA results also support the notion that T. 747
sponsorius and T. venustus have exchanged genes. 748
A similar pattern could be observed if both populations shared ancestral polymorphisms, 749
but this explanation seems unlikely given the high degree of concordance observed across all of 750
the independent nuclear loci we sequenced. If incomplete lineage sorting were the source of 751
cytonuclear discordance, we would expect less consistent sorting across loci. Given our results, it 752
seems likely that the mitochondrial genome of T. venustus C has introgressed through at least 753
part of the T. sponsorius population. Before further conclusions can be drawn, more focused 754
sampling at putative contact zones in northern Argentina and additional genetic studies are 755
needed. Nonetheless, this is the first reported case of introgression between species in 756
Didelphidae. 757

35
758
4.5. Conclusions: Are these cryptic lineages really species? 759
760
Although BPP and other coalescence-based approaches are often described as methods 761
for ―species delimitation‖ or ―species validation,‖ they effectively test the hypothesis that 762
populations (or metapopulations) of related organisms have ceased to exchange migrants and are 763
therefore isolated genetically (Yang and Rannala, 2010; Ence and Carstens, 2011). Genetic 764
isolation, however, is a necessary but not sufficient property for species recognition because 765
gene flow can be prevented by extrinsic factors such as geographic separation (allopatry), rather 766
than by intrinsic factors that maintain lineage separation. As Yang and Rannala (2010: 9269) 767
remarked, their method is expected to be maximally useful for identifying cryptic species that 768
occur in sympatry (where genetic isolation is most likely due to intrinsic mechanisms), and that 769
species delimitation ―should rely on many [other] kinds of data, such as morphological, 770
behavioral, and geographic evidence.‖ 771
All of the mtDNA haplotypes confirmed as genetically isolated lineages in this report are 772
allopatric, and inference about their status as full species is correspondingly problematic. 773
Because speciation is a process, the discovery of lineages in various stages of divergence is to be 774
expected. Although such discoveries pose challenges for taxonomic interpretation, they are also 775
opportunities for productive research on the sequence of evolutionary intermediates associated 776
with speciation in different plant and animal clades. 777
Names are available for all of the distinct lineages of Thylamys identified by our BPP 778
results. As we have previously discussed (Giarla et al., 2010), the name venustus is based on a 779
type specimen collected within the known geographic range of the lineage we designate as T. 780
36
venustus A, whereas the type of cinderella (currently regarded as a junior synonym of venustus), 781
was collected within the combined geographic ranges of T. venustus B and C. Although sequence 782
data from topotypic specimens would be preferable, taxonomic usage could plausibly be based 783
on these map criteria. Similarly (see Giarla et al. [2010] for type localities), the name janetta 784
could be used for T. sponsorius A, the name sponsorius could be restricted for T. sponsorius B, 785
the name pallidior could be restricted for T. pallidior A, and the name fenestrae could be used 786
for T. pallidior B. 787
For the reasons explained earlier, we do not think that a revised binomial nomenclature 788
based on such assignments is warranted until the hypothesis that these lineages are full species is 789
better corroborated (sensu De Queiroz, 2007). Logical extensions of our results that might 790
provide such corroboration could consist of ecological niche modeling to explore the possibility 791
that each lineage is associated with a distinct range of environmental conditions (as in cryptic 792
salamanders; Rissler and Apodaca, 2007), or more sophisticated phenotypic analyses that might 793
uncover subtle divergence in morphology overlooked in previous revisionary work (as by 794
Berendzen et al., 2009). The latter would be particularly welcome as a basis for more securely 795
associating type material with taxa than the geographic criteria suggested above. Lastly, fresh 796
collections along Andean transects carefully sited to intersect contact zones (if any) between 797
sister lineages could provide crucial evidence for genetic isolation in sympatry or parapatry. 798
Absent such corroboration, taxonomic restraint seems only prudent. 799
800
References 801
802
Arbogast B.S., Kenagy G.J., 2001. Comparative phylogeography as an integrative approach to 803

37
historical biogeography. J. Biogeogr. 28, 819–825. 804
Ballard J.W.O., Whitlock M.C., 2004. The incomplete natural history of mitochondria. Mol. 805
Ecol. 13, 729–744. 806
Beheregaray L.B., Caccone A., 2007. Cryptic biodiversity in a changing world. J. Biol. 6, 9. 807
Belfiore N., 2011. Developing nuclear sequences for species tree estimation in nonmodel 808
organisms: Insights from a case study of Bottae's pocket gopher, Thomomys bottae, in: 809
Knowles L.L., Kubatko L. (Eds.), Estimating Species Trees: Practical and Theoretical 810
Aspects. John Wiley & Sons, Inc., Hoboken, NJ, pp. 175–191. 811
Bell R.C., MacKenzie J.B., Hickerson M.J., Chavarría K.L., Cunningham M., Williams S.E., 812
Moritz C., 2012. Comparative multi-locus phylogeography confirms multiple vicariance 813
events in co-distributed rainforest frogs. Proc. R. Soc. Lond. B. 279, 991–999. 814
Berendzen P.B., Olson W.M., Barron S.M., 2009. The utility of molecular hypotheses for 815
uncovering morphological diversity in the Notropis rubellus species complex 816
(Cypriniformes: Cyprinidae). Copeia. 2009, 661–673. 817
Bickford D., Lohman D.J., Sodhi N.S., Ng P.K.L., Meier R., Winker K., Ingram K.K., Das I., 818
2007. Cryptic species as a window on diversity and conservation. Trends Ecol. Evol. 22, 819
148–155. 820
Brito P.H., Edwards S.V., 2008. Multilocus phylogeography and phylogenetics using sequence-821
based markers. Genetica. 135, 439–455. 822
Brumfield R.T., Edwards S.V., 2007. Evolution into and out of the Andes: a Bayesian analysis of 823
historical diversification in Thamnophilus antshrikes. Evolution. 61, 346–367. 824
Camargo A., Morando M., Avila L.J., Sites J.W. Jr, 2012. Species delimitation with ABC and 825
other coalescent-based methods: A test of accuracy with simulations and an empirical 826

38
example with lizards of the Liolaemus darwinii complex (Squamata: Liolaemidae). 827
Evolution. 66, 2834–2849. 828
Carling M.D., Brumfield R.T., 2007. Gene sampling strategies for multi-locus population 829
estimates of genetic diversity (θ). PLoS ONE. 2, e160. 830
Darriba D., Taboada G.L., Doallo R., Posada D., 2012. jModelTest 2: More models, new 831
heuristics and parallel computing. Nat. Methods. 9, 772. 832
De Queiroz K., 2007. Species concepts and species delimitation. Syst. Biol. 56, 879–886. 833
Degnan J.H., Rosenberg N.A., 2009. Gene tree discordance, phylogenetic inference and the 834
multispecies coalescent. Trends Ecol. Evol. 24, 332–340. 835
Drummond A.J., Ashton B., Buxton S., Cheung M., Cooper A., Heled J., Kearse M., Moir R., 836
Stones-Havas S., Sturrock S., Thierer T., Wilson A. Geneious v5.5.1. 2010. Available from 837
http://www.geneious.com. 838
Drummond A.J., Suchard M.A., Xie D., Rambaut A., 2012. Bayesian phylogenetics with 839
BEAUti and the BEAST 1.7. Mol. Biol. Evol. 29, 1969–1973. 840
Dupuis J.R., Roe A.D., Sperling F.A.H., 2012. Multi-locus species delimitation in closely related 841
animals and fungi: One marker is not enough. Mol. Ecol. 21, 4422–4436. 842
Edwards S.V., Beerli P. 2000. Perspective: gene divergence, population divergence, and the 843
variance in coalescence time in phylogeographic studies. Evolution. 54:1839–1854. 844
Edwards S.V., Bensch S., 2009. Looking forwards or looking backwards in avian 845
phylogeography? A comment on Zink and Barrowclough 2008. Mol. Ecol. 18, 2930–2933. 846
Ence D.D., Carstens B.C., 2011. SpedeSTEM: A rapid and accurate method for species 847
delimitation. Mol. Ecol. Resour. 11, 473–480. 848
Felsenstein J., 2006. Accuracy of coalescent likelihood estimates: do we need more sites, more 849

39
sequences, or more loci? Mol. Biol. Evol. 23, 691–700. 850
Flot J.F., 2007. Champuru 1.0: a computer software for unraveling mixtures of two DNA 851
sequences of unequal lengths. Mol. Ecol. Notes. 7, 974–977. 852
Flot J.F., 2010. SeqPHASE: A web tool for interconverting PHASE input/output files and 853
FASTA sequence alignments. Mol. Ecol. Resour. 10, 162–166. 854
Fujita M.K., Leaché A.D., Burbrink F.T., McGuire J.A., Moritz C., 2012. Coalescent-based 855
species delimitation in an integrative taxonomy. Trends Ecol. Evol. 27, 480–488. 856
Funk D.J., Omland K.E., 2003. Species-level paraphyly and polyphyly: Frequency, causes, and 857
consequences, with insights from animal mitochondrial DNA. Annu. Rev. Ecol. Evol. Syst. 858
34, 397–423. 859
Galtier N., Nabholz B., Glemin S., Hurst G.D.D., 2009. Mitochondrial DNA as a marker of 860
molecular diversity: A reappraisal. Mol. Ecol. 18, 4541–4550. 861
Garrick R.C., Sunnucks P., Dyer R.J., 2010. Nuclear gene phylogeography using PHASE: 862
Dealing with unresolved genotypes, lost alleles, and systematic bias in parameter estimation. 863
BMC Evol. Biol. 10, 118. 864
Giarla T.C., Voss R.S., Jansa S.A., 2010. Species limits and phylogenetic relationships in the 865
didelphid marsupial genus Thylamys based on mitochondrial DNA sequences and 866
morphology. Bull. Am. Mus. Nat. Hist. 1–67. 867
Glenn T.C., Schable N.A., 2005. Isolating microsatellite DNA loci. Meth. Enzymol. 395, 202–868
222. 869
Hanke M., Wink M., 1994. Direct DNA sequencing of PCR-amplified vector inserts following 870
enzymatic degradation of primer and dNTPs. Biotech. 17, 858. 871
Hausdorf B., 2011. Progress toward a general species concept. Evolution. 65, 923–931. 872

40
Heled J., Drummond A.J., 2010. Bayesian inference of species trees from multilocus data. Mol. 873
Biol. Evol. 27, 570–580. 874
Hickerson M.J., Dolman G., Moritz C., 2006. Comparative phylogeographic summary statistics 875
for testing simultaneous vicariance. Mol. Ecol. 15, 209–223. 876
Hird S., Kubatko L., Carstens B., 2010. Rapid and accurate species tree estimation for 877
phylogeographic investigations using replicated subsampling. Mol. Phylogenet. Evol. 57, 878
888–898. 879
Hudson R.R., Coyne J.A., 2002. Mathematical consequences of the genealogical species 880
concept. Evolution. 56, 1557–1565. 881
Jansa, S.A., Barker F.K., Voss R.S. The early diversification history of didelphid marsupials: A 882
window into South America’s ―splendid isolation.‖ Submitted to Evolution. 883
Kent W.J., 2002. BLAT—the BLAST-like alignment tool. Genome Res. 12, 656–664. 884
Kozak K.H., Wiens J.J., 2006. Does niche conservatism promote speciation? A case study in 885
North American salamanders. Evolution. 60, 2604–2621. 886
Kubatko L.S., Carstens B.C., Knowles L.L., 2009. STEM: species tree estimation using 887
maximum likelihood for gene trees under coalescence. Bioinformatics. 25, 971–973. 888
Kubatko L.S., Degnan J.H. 2007. Inconsistency of phylogenetic estimates from concatenated 889
data under coalescence. Syst. Biol. 56:17–24. 890
Kumar S., Subramanian S., 2002. Mutation rates in mammalian genomes. Proc. Natl. Acad. Sci. 891
USA. 99, 803–808. 892
Lande R., 1976. Natural selection and random genetic drift in phenotypic evolution. Evolution. 893
30, 314–334. 894
Lanfear R., Calcott B., Ho S.Y.W., Guindon S., 2012. Partitionfinder: combined selection of 895

41
partitioning schemes and substitution models for phylogenetic analyses. Mol. Biol. Evol. 29, 896
1695–1701. 897
Larkin M.A., Blackshields G., Brown N.P., Chenna R., McGettigan P.A., McWilliam H., 898
Valentin F., Wallace I.M., Wilm A., Lopez R., 2007. Clustal W and Clustal X version 2.0. 899
Bioinformatics. 23, 2947–2948. 900
Leaché A.D., Fujita M.K., 2010. Bayesian species delimitation in West African forest geckos 901
(Hemidactylus fasciatus). Proc. R. Soc. Lond. B. 277, 3071–3077. 902
Librado P., Rozas J., 2009. DnaSP v5: a software for comprehensive analysis of DNA 903
polymorphism data. Bioinformatics. 25, 1451–1452. 904
Mayr E. 1942. Systematics and the origin of species, from the viewpoint of a zoologist. Harvard 905
University Press, Cambridge, MA. 906
McCormack J.E., Hird S.M., Zellmer A.J., Carstens B.C., Brumfield R.T., 2013. Applications of 907
next-generation sequencing to phylogeography and phylogenetics. Mol. Phylogenet. Evol. 908
66, 526–538. 909
McCulloch G.A., Wallis G.P., Waters J.M., 2010. Onset of glaciation drove simultaneous 910
vicariant isolation of Alpine insects in New Zealand. Evolution. 64, 2033–2043. 911
McGuire G., Wright F., 2000. TOPAL 2.0: Improved detection of mosaic sequences within 912
multiple alignments. Bioinformatics. 16, 130–134. 913
Mikkelsen T.S., Wakefield M.J., Aken B., Amemiya C.T., Chang J.L., Duke S., Garber M., 914
Gentles A.J., Goodstadt L., Heger A., 2007. Genome of the marsupial Monodelphis 915
domestica reveals innovation in non-coding sequences. Nature. 447, 167–177. 916
Milne I., Lindner D., Bayer M., Husmeier D., McGuire G., Marshall D.F., Wright F., 2009. 917
TOPALi v2: A rich graphical interface for evolutionary analyses of multiple alignments on 918

42
HPC clusters and multi-core desktops. Bioinformatics. 25, 126–127. 919
Moore W.S., 1995. Inferring phylogenies from mtDNA variation: Mitochondrial-gene trees 920
versus nuclear-gene trees. Evolution. 49, 718–726. 921
O'Meara B.C., 2010. New heuristic methods for joint species delimitation and species tree 922
inference. Syst. Biol. 59, 59–73. 923
Pluzhnikov A., Donnelly P., 1996. Optimal sequencing strategies for surveying molecular 924
genetic diversity. Genetics. 144, 1247–1262. 925
Pons J., Barraclough T., Gomez-Zurita J., Cardoso A., Duran D., Hazell S., Kamoun S., Sumlin 926
W., Vogler A., 2006. Sequence-based species delimitation for the DNA taxonomy of 927
undescribed insects. Syst. Biol. 55, 595–609. 928
Rambaut A., Drummond A. 2007. Tracer v1.5. Available from: http://beast.bio.ed.ac.uk/Tracer. 929
Reid N.M., Carstens B.C., 2012. Phylogenetic estimation error can decrease the accuracy of 930
species delimitation: A Bayesian implementation of the general mixed Yule-coalescent 931
model. BMC Evol. Biol. 12, 196. 932
Ribas C.C., Moyle R.G., Miyaki C.Y., Cracraft J., 2007. The assembly of montane biotas: 933
Linking Andean tectonics and climatic oscillations to independent regimes of diversification 934
in Pionus parrots. Proc. R. Soc. Lond. B. 274, 2399–2408. 935
Rissler L.J., Apodaca J.J., 2007. Adding more ecology into species delimitation: Ecological 936
niche models and phylogeography help define cryptic species in the black salamander 937
(Aneides flavipunctatus). Syst. Biol. 56, 924–942. 938
Rittmeyer E.N., Austin C.C., 2012. The effects of sampling on delimiting species from multi-939
locus sequence data. Mol. Phylogenet. Evol. 65, 451–463. 940
Roe A.D., Rice A.V., Bromilow S.E., Cooke J.E.K., Sperling F.A.H., 2010. Multilocus species 941

43
identification and fungal DNA barcoding: Insights from blue stain fungal symbionts of the 942
mountain pine beetle. Mol. Ecol. Resour. 10, 946–959. 943
Roy M.S., 1997. Recent diversification in African greenbuls (Pycnonotidae: Andropadus) 944
supports a montane speciation model. Proc. Roy. Soc. Lond. B. 264, 1337–1344. 945
Rozen S., Skaletsky H., 2000. Primer3 on the WWW for general users and for biologist 946
programmers. Methods Mol. Biol. 132, 365–386. 947
Scheen A.-C., Pfeil B.E., Petri A., Heidari N., Nylinder S., Oxelman B., 2012. Use of allele-948
specific sequencing primers is an efficient alternative to PCR subcloning of low-copy 949
nuclear genes. Mol. Ecol. Resour. 12, 128–135. 950
Seroussi Y., Seroussi E., 2007. TraceHaplotyper: using direct sequencing to determine the phase 951
of an indel followed by biallelic SNPs. Biotech. 43, 452–456. 952
Sorenson M.D., DaCosta J.M., 2011. Genotyping HapSTR loci: Phase determination from direct 953
sequencing of PCR products. Mol. Ecol. Resour. 11, 1068–1075. 954
Stephens M., Smith N.J., Donnelly P., 2001. A new statistical method for haplotype 955
reconstruction from population data. Am. J. Hum. Genet. 68, 978–989. 956
Swofford D.L., 2002. PAUP*: Phylogenetic analysis using parsimony. Version 4.0b. Sunderland 957
(MA): Sinauer Associates. 958
Toews D.P.L., Brelsford A., 2012. The biogeography of mitochondrial and nuclear discordance 959
in animals. Mol. Ecol. 21, 3907–3930. 960
Watterson G.A., 1975. On the number of segregating sites in genetical models without 961
recombination. Theor. Popul. Biol. 7, 256–276. 962
Weir J.T., 2006. Divergent timing and patterns of species accumulation in lowland and highland 963
neotropical birds. Evolution. 60, 842–855. 964

44
Wiens J.J., Graham C.H., 2005. Niche conservatism: Integrating evolution, ecology, and 965
conservation biology. Annu. Rev. Ecol. Evol. Syst. 36, 519–539. 966
Yang Z., Rannala B., 2010. Bayesian species delimitation using multilocus sequence data. Proc. 967
Natl. Acad. Sci. USA. 107, 9264–9269. 968
Zhang C., Zhang D.X., Zhu T., Yang Z., 2011. Evaluation of a Bayesian coalescent method of 969
species delimitation. Syst. Biol. 60, 747–761. 970
Zink R.M., Barrowclough G.F., 2008. Mitochondrial DNA under siege in avian phylogeography. 971
Mol. Ecol. 17, 2107–2121. 972
Zwickl D., 2006. Genetic algorithm approaches for the phylogenetic analysis of large biological 973
sequence datasets under the maximum likelihood criterion. [PhD dissertation]. Austin (TX): 974
University of Texas at Austin. 975
976
Acknowledgements 977
978
We thank Keith Barker, Courtney Comar, Lorissa Fujishin, and Michael Wells for 979
assistance with laboratory work. Keith Barker, Juan Diaz, and Andrew Simons provided helpful 980
comments on how to improve the manuscript. We are thankful to the many curators and 981
collection managers who loaned tissues that we used in this project, especially Michael Mares 982
and Janet Braun (Sam Noble Museum of Natural History), Joe Cook and Jon Dunnum (Museum 983
of Southwestern Biology), and Bruce Patterson and Bill Stanley (Field Museum of Natural 984
History). This work was supported by the National Science Foundation (grant numbers DEB-985
1110365 to S.A.J. and T.C.G., DEB-0743062 to S.A.J., and DEB-0743039 to R.S.V.), the 986

45
American Society of Mammalogists, the Society of Systematic Biologists, the Bell Museum of 987
Natural History, and the University of Minnesota. 988
989
Appendix A: Primers Used 990
991
992
ThyAnon61-F 5’- TGGAAGAGTTGGGGTTCAAAGTGGGT 993
ThyAnon61-R 5’- TGCTTTCCCATCCATATGCCTTTTGCC 994
ThyAnon72-F 5’- CCCAGCTAGTGAAGAGGACTGTCACC 995
ThyAnon72-R 5’- TGTGGGCTGCTGCTCTTATTGGTAGT 996
ThyAnon78-F 5’- GGGTGTGTGTTGTAATGTGTTGGACA 997
ThyAnon78-R 5’- TGCGTGAGTCTGTATGTGTCTTTATGCG 998
ThyAnon85-F 5’- ATGAGAAAGAGATGTCTTGCAAATCCTAACA 999
ThyAnon85-R 5’- AGCCTTGATTTCTTCATCAGAAAACTGTCTATT 1000
ThyAnon86-F 5’- TCTATGCACTGGGGAATATAAAGGAAGGT 1001
ThyAnon86-R 5’- TTGCTACTGCTAGTGATGCTAATACAATGTT 1002
ThyAnon89-F 5’- TGTGCAATTTTTGTGAATGAAATGTAATGCT 1003
ThyAnon89-R 5’- GGCAGGGACTGGTTTCTTTTTGCCTC 1004
ThyAnon90-F 5’- TGACAGGTGGGTCATTGAGCTATTGTT 1005
ThyAnon90-R 5’- ATGGGCAGGACTAACAAGTTGGGGAA 1006
ThyAnon94-F 5’- TCTGGGAGATGCAGTCCAAGGTTCAAA 1007
ThyAnon94-R 5’- GCCACCAACAATCACTTATGTGGCAGA 1008
ThyAnon98-F 5’- GCAGAATACATGGCACGTACCTGGG 1009
ThyAnon98-R 5’- CCTCAGACACTGTGACCCTAGGCAA 1010
ThyAnon101-F 5’- GGACCAAAGGAATGCAAGTTCAGACCC 1011
ThyAnon101-R 5’- TGGGAGCGGGAGTAAGGGAGTAAGTAA 1012
ThyAnon115-F 5’- AGTGGTATGGTTGGATCAAAGGGCA 1013
ThyAnon115-R 5’- CAGTCACTGTCGTCCACTGTCATAG 1014
ThyAnon121-F 5’- TTCACAGTGATGGTGTCAAGAGAATATCAGG 1015
ThyAnon121-R 5’- AGTTAAAATATGGCACCAGGTAAGGATCTCCA 1016
ThyAnon122-F 5’- TTGAGAAAAGGCAGGGAGGGACCAAAT 1017
ThyAnon122-R 5’- CCTAGGTTCCTCGTGGTAGACACCAAC 1018
ThyAnon128-F 5’- CTTACACCAGGCACCAACTCTGAGACA 1019
ThyAnon128-R 5’- CTCTAAACTGCCATCCCAGGGTCACTC 1020
OGT-F 5’- AAATCATTTCATCGACCTTTCTCAG 1021
OGT-R 5’- ATTCCCTGTAATGGAAAAGCAGC 1022
1023
Figure Captions 1024
1025

46
Figure 1. Map of collecting localities for specimens used in this study. Larger circles with black 1026
outlines indicate specimens for which we sequenced both CYTB and nuclear markers. Smaller 1027
circles with white outlines indicate specimens for which we only have CYTB sequences. 1028
Asterisks are placed by two collecting localities at which putative hybrid specimens were 1029
collected. Map shading reflects elevation, with dark green indicating lowlands, yellow indicating 1030
middle-elevations, and brown/white shading illustrating high/maximum elevations. 1031
1032
Figure 2. Ultrametric phylogenetic tree inferred in BEAST using the complete set of CYTB 1033
sequences from Giarla et al. (2010), illustrating relative divergence times. Tip labels correspond 1034
to tissue voucher numbers (Table 1 and Giarla et al. [2010]: Table 1). Only posterior probability 1035
values for interspecific divergences and the deepest split within each haplogroup are displayed. 1036
Percentages near some nodes reflect the uncorrected average pairwise divergence between the 1037
node’s daughter lineages. Asterisks mark two specimens that cluster with T. venustus C for 1038
CYTB but cluster with T. sponsorius for nearly all nuclear loci (Online Appendix C). 1039
1040
Figure 3. Species tree inferred in *BEAST from 14 anonymous loci and the X-linked intron 1041
OGT, with posterior probabilities at each node. Individuals were assigned to haplogroups based 1042
on the CYTB results. Two individuals of suspected hybrid origin were not included in this 1043
analysis. 1044
1045
Figure 4. Multilocus power analysis in BPP for each split of interest under Prior Scheme 1. Four 1046
randomly rarefied datasets were constructed for the 12-, 8-, 4-, and 2-locus size classes; all 15 1047
single-locus datasets were analyzed. A single complete dataset including all 15 loci together was 1048

47
independently analyzed four times. Each black circle represents the posterior probability of 1049
species delimitation based on a single random replicate dataset. Squares denote the average 1050
posterior probability value across all of the random trials for each dataset size class. 1051
1052
Figure 5. Point estimates (circles) and surrounding error estimates (lines) for the relative 1053
divergence time for the basal-most split within each species. Black dots and lines derive from the 1054
*BEAST analysis of the 15 nuclear loci; gray dots and lines are from the BEAST analysis of the 1055
cytochrome b data. In both analyses, the root node (the split between T. pallidior and T. 1056
venustus) was set at 1.0. 1057
1058
Online Appendix B. Tab-delimitted text file associating GenBank accession numbers with 1059
specimens for each loci. 1060
1061
Online Appendix C. Fifteen maximum-likelihood nuclear gene trees inferred in Garli. Colored 1062
rectangles at each tip denote the mtDNA haplogroup assigned to that individual. Stars and circles 1063
denote two individuals that cluster with T. venustus C in the CYTB tree (Fig. 2) but cluster with 1064
T. sponsorius in many of the gene trees shown here. 1065

1
TABLE 1. List of individuals sequenced and collecting localities. Haplogroup assignments are based on the results from analysis of the
mitochondrial gene cytochrome b (Fig. 2).
Tissue No. Voucher No. Species Haplogroup Country: Province/State a
NBH 76-97 FMNH 162495 pallidior A Bolivia: Tarija
NK 14721 MSB 57003 pallidior A Bolivia: Chuquisaca
NK 23533 MSB 87099 pallidior A Bolivia: Tarija
NK 96072 MSB 133108 pallidior A Chile: Tarapacá
AC 47 MLP 24.X.01.3 pallidior B Argentina: Córdoba
Arg 2690/OCGR 2153 OMNH 29957 pallidior B Argentina: Jujuy
Arg 395/OCGR 343 OMNH 23485 pallidior B Argentina: San Juan
Arg 43/OCGR 43 OMNH 23482 pallidior B Argentina: Mendoza
Arg 6392/OCGR 3957 OMNH 32559 pallidior B Argentina: Salta
Arg 6578/OCGR 7196 OMNH 34903 pallidior B Argentina: Catamarca
Arg 6683/OCGR 7279 OMNH 34908 pallidior B Argentina: Salta
Arg 687/OCGR 624 OMNH 23489 pallidior B Argentina: San Luis
LTU 77 CNP 1919 pallidior B Argentina: Buenos Aires
UP 397 CNP 1921 pallidior B Argentina: Neuquén
BDP 3309 FMNH 162507 sponsorius A Bolivia: Tarija
BDP 3345 FMNH 162505 sponsorius A Bolivia: Tarija
NK 23647 MSB 140295 sponsorius A Bolivia: Tarija
NK 23719 MSB 67009 sponsorius A Bolivia: Tarija
NK 23762 MSB 67014 sponsorius A Bolivia: Tarija
NK 23763 MSB 67015 sponsorius A Bolivia: Tarija
NK 23874 [uncataloged] sponsorius A Bolivia: Tarija
NK 23899 [uncataloged] sponsorius A Bolivia: Tarija
NK 23903 MSB 67010 sponsorius A Bolivia: Tarija
NK 23904 MSB 67012 sponsorius A Bolivia: Tarija
Arg 1449/OCGR 1346 OMNH 29967 sponsorius B Argentina: Tucumán
Arg 1466/OCGR 1363 OMNH 29965 sponsorius B Argentina: Catamarca
Arg 2233/OCGR 1860 IADIZA 4009 sponsorius B Argentina: Tucumán
Arg 2460/OCGR 2047 OMNH 32566 sponsorius B Argentina: Tucumán
Tables

2
Arg 2659/OCGR 2144 OMNH 29970 sponsorius B Argentina: Jujuy
Arg 4609/OCGR 3600 OMNH 29974 sponsorius B Argentina: Jujuy
Arg 6179/OCGR 3929 OMNH 32553 sponsorius B Argentina: Tucumán
Arg 6499/OCGR 3979 OMNH 32545 sponsorius B Argentina: Salta
Arg 6540/OCGR 3986 OMNH 32548 sponsorius B Argentina: Salta
NBH 20-20 AMNH 103761 venustus A Bolivia: Cochabamba
NK 21546 AMNH 263555 venustus A Bolivia: Chuquisaca
NK 21556 AMNH 263556 venustus A Bolivia: Chuquisaca
NK 25027 MSB 87109 venustus A Bolivia: Cochabamba
NK 30425 AMNH 275427 venustus A Bolivia: Cochabamba
NK 30437 MSB 87100 venustus A Bolivia: Cochabamba
NK 30479 AMNH 275429 venustus A Bolivia: Cochabamba
NK 12114 AMNH 260030 venustus B Bolivia: Santa Cruz
NK 22811 [uncataloged] venustus B Bolivia: Santa Cruz
NK 22813 MSB 87107 venustus B Bolivia: Santa Cruz
NK 22815 MSB 87106 venustus B Bolivia: Santa Cruz
NK 22844 AMNH 275428 venustus B Bolivia: Cochabamba
NK 22845 MSB 67001 venustus B Bolivia: Cochabamba
NK 22946 MSB 67003 venustus B Bolivia: Santa Cruz
NK 22949 [uncataloged] venustus B Bolivia: Santa Cruz
NK 22952 AMNH 275433 venustus B Bolivia: Santa Cruz
NK 22986 MSB 67004 venustus B Bolivia: Santa Cruz
Arg 1108/OCGR 1007 b OMNH 29966 venustus C Argentina: Tucumán
Arg 2496/OCGR 2071 OMNH 29952 venustus C Argentina: Jujuy
NK 12575 AMNH 261245 venustus C Bolivia: Chuquisaca
NK 12637 AMNH 261254 venustus C Bolivia: Chuquisaca
NK 21237 MSB 63260 venustus C Bolivia: Santa Cruz
NK 21368 MSB 63262 venustus C Bolivia: Chuquisaca
NK 21516 MSB 63269 venustus C Bolivia: Chuquisaca
NK 23023 MSB 67005 venustus C Bolivia: Santa Cruz
NK 23392 MSB 67008 venustus C Bolivia: Tarija
NK 23992 b MSB 67392 venustus C Bolivia: Tarija

3
a Precise locality information can be found in Giarla et al. (2010)
b Thylamys venustus C individuals with a possible history of introgression with T. sponsorius B

4
TABLE 2. Prior schemes tested in BPP. Assuming a mutation rate of 10-9
substitutions per site per year (Kumar and Subramanian,
2002) divergence depths indicated as “Shallow” imply a prior with a mean ~0.1 Ma, “Moderate” implies a prior with a mean ~1.0 Ma,
and “Deep” implies a prior with a mean ~10.0 Ma. For effective population sizes within haplogroups, “Large” assumes θ ~ 0.1 and
small assumes θ ~ 0.001. Scheme 1 τ’s were derived from Jansa et al.’s (submitted) divergence time estimates. Priors were modeled as
diffuse gamma distributions G(α, β), where the prior mean = α/β and its variance = α/β2
Scheme Name Divergence Depth (τ) Effective Population Size (θ) Gamma Distribution for prior
Scheme 1 Estimated from other data Estimated from Anon. Locus Data θ ~ G(2, 500) and τ ~ G(2, 3000)
Scheme 2 Shallow Large θ ~ G(1, 10) and τ ~ G(2, 20000)
Scheme 3 Shallow Small θ ~ G(2, 2000) and τ ~ G(2, 20000)
Scheme 4 Moderate Large θ ~ G(1, 10) and τ ~ G(2, 2000)
Scheme 5 Moderate Small θ ~ G(2, 2000) and τ ~ G(2, 2000)
Scheme 6 Deep Large θ ~ G(1, 10) and τ ~ G(1, 10)
Scheme 7 Deep Small θ ~ G(2, 2000) and τ ~ G(1, 10)

5
TABLE 3. Characteristics of nuclear loci used in this study. Exemplar sequences from each locus were mapped to the published
genome sequence of the distantly related didelphid Monodelphis domestica using the best hit from a BLAT search (Kent, 2002).
Locus Name M. domestica Genome Locus Size (bp) Mol. Clock? a Substitution Model
b Tajima's D
b,c W
b
Anon-61 Chromosome 5 546 Yes HKY -0.1912 0.007852
Anon-72 Chromosome 8 675 No K80+G -0.0266 0.01315
Anon-78 Chromosome 2 656 Yes HKY 0.3668 0.005446
Anon-85 Chromosome 3 549 Yes HKY 0.6177 0.004229
Anon-86 Unknown 716 Yes HKY -0.8977 0.005291
Anon-89 Unknown 650 Yes TrN 1.3097 0.004102
Anon-90 Unknown 704 Yes TrN+I -0.7208 0.007745
Anon-94 Chromosome 3 752 Yes HKY+I+G 0.361 0.010313
Anon-98 Chromosome 6 523 Yes TrNef+I -0.2023 0.015538
Anon-101 Chromosome 1 457 Yes HKY+I+G -0.2983 0.021272
Anon-115 Chromosome 1 550 Yes HKY+I 0.6816 0.012835
Anon-121 Chromosome 1 543 Yes K80 1.4407 0.005932
Anon-122 Chromosome 5 723 No TPM1+I+G 0.008 0.019701
Anon-128 Chromosome 4 724 Yes TPM1+I -0.2977 0.005554
OGT X-Linked Intron 653 Yes HKY 0.222 0.003246
a “Yes” denotes that the molecular clock cannot be rejected.
b Measured or fitted across all sequences sampled within T. pallidior, T. sponsorius, and T. venustus combined.
c All values are non-significant.
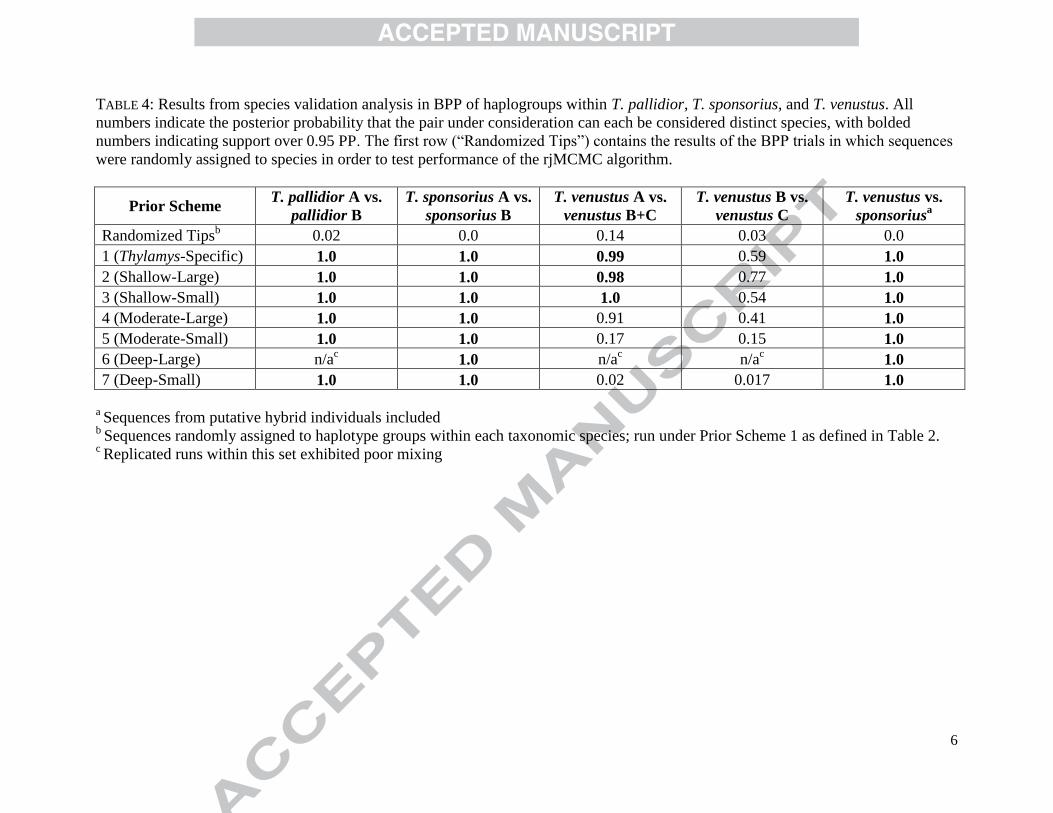
6
TABLE 4: Results from species validation analysis in BPP of haplogroups within T. pallidior, T. sponsorius, and T. venustus. All
numbers indicate the posterior probability that the pair under consideration can each be considered distinct species, with bolded
numbers indicating support over 0.95 PP. The first row (“Randomized Tips”) contains the results of the BPP trials in which sequences
were randomly assigned to species in order to test performance of the rjMCMC algorithm.
Prior Scheme T. pallidior A vs.
pallidior B
T. sponsorius A vs.
sponsorius B
T. venustus A vs.
venustus B+C
T. venustus B vs.
venustus C
T. venustus vs.
sponsoriusa
Randomized Tipsb 0.02 0.0 0.14 0.03 0.0
1 (Thylamys-Specific) 1.0 1.0 0.99 0.59 1.0
2 (Shallow-Large) 1.0 1.0 0.98 0.77 1.0
3 (Shallow-Small) 1.0 1.0 1.0 0.54 1.0
4 (Moderate-Large) 1.0 1.0 0.91 0.41 1.0
5 (Moderate-Small) 1.0 1.0 0.17 0.15 1.0
6 (Deep-Large) n/ac 1.0 n/a
c n/a
c 1.0
7 (Deep-Small) 1.0 1.0 0.02 0.017 1.0
a Sequences from putative hybrid individuals included
b Sequences randomly assigned to haplotype groups within each taxonomic species; run under Prior Scheme 1 as defined in Table 2.
c Replicated runs within this set exhibited poor mixing

7
TABLE 5. Results from the species validation test in SpeDeSTEM. For each model of lineage splitting, haplogroup combinations are
clustered with “+” symbols and separated from other such clusters with “ | ” symbols. The models are ranked from top to bottom
according to AICc score. The absolute difference between the AICc score for the given model and the best-fitting one is listed under
the column labeled “i” and the model weighting is listed under the column labeled “wi.” Only results from the analysis in which θ
was set to 0.05 are shown. Results from larger θ values were very similar, whereas smaller θ values caused the program to fail.
Species Models Avg. –lnL
(100 reps) AICc i
Model-
likelihood wi
palA+palB | spoA+spoB | venA+venC | venB 666.58 666.58 0.00 1.00 0.52
palA+palB | spoA | spoB | venA+venC | venB 668.47 668.47 1.89 0.39 0.20
palA | palB | spoA+spoB | venA+venC | venB 668.48 668.48 1.90 0.39 0.20
palA | palB | spoA | spoB | venA+venC | venB 670.37 670.37 3.79 0.15 0.08
palA+palB | spoA+spoB | venA+venB+venC 707.60 707.60 41.02 0.00 0.00
palA+palB | spoA+spoB | venA+venB | venC 709.42 709.42 42.84 0.00 0.00
palA | palB | spoA+spoB | venA+venB+venC 709.50 709.50 42.92 0.00 0.00
palA+palB | spoA | spoB | venA+venB+venC 709.51 709.51 42.92 0.00 0.00
palA+palB | spoA+spoB | venA | venB+venC 709.57 709.57 42.99 0.00 0.00
palA | palB | spoA+spoB | venA+venB | venC 711.32 711.32 44.74 0.00 0.00
palA+palB | spoA | spoB | venA+venB | venC 711.35 711.35 44.77 0.00 0.00
palA+palB | spoA+spoB | venA | venB | venC 711.40 711.40 44.82 0.00 0.00
palA | palB | spoA | spoB | venA+venB+venC 711.41 711.41 44.82 0.00 0.00
palA | palB | spoA+spoB | venA | venB+venC 711.47 711.47 44.89 0.00 0.00
palA+palB | spoA | spoB | venA | venB+venC 711.47 711.47 44.89 0.00 0.00
palA | palB | spoA | spoB | venA+venB | venC 713.25 713.25 46.66 0.00 0.00
palA | palB | spoA+spoB | venA | venB | venC 713.30 713.30 46.72 0.00 0.00
palA+palB | spoA | spoB | venA | venB | venC 713.33 713.33 46.75 0.00 0.00
palA | palB | spoA | spoB | venA | venB+venCa 713.37 713.37 46.79 0.00 0.00
palA | palB | spoA | spoB | venA | venB | venC 715.23 715.23 48.65 0.00 0.00
a Model supported by BPP analyses

*
*
pallidior A
pallidior B
venustus A
venustus B
venustus C
sponsorius A
sponsorius B
Fig. 1 Color image in print
Argentina
Paraguay
Bolivia
Peru
Chile

T. pallidior A
T. pallidior B
T. sponsorius B
T. sponsorius A
T. venustus A
T. venustus C
T. venustus B
3.9%
0.02 substitutions/site
NK21515
NK14721
NK21516
Arg2690
Arg5350
NK12114
NK23647
Arg5714
NK21367
Arg6703
Arg2659
Arg4603
NK23992
NK22811
Arg1449
UMMZ155836
MVZ115634
NK21655
Arg2233Arg2460
NK21664
NK22946
NK23763
NK25027
NK23874
Arg6392
Arg4037
Arg43
NK30760
NK22986
AMNH186948
RDS18525
NK21620
Arg6540
NK23904
AMNH248705
NK12642
MVZ173937
NK30437
NK23023
Arg6499
NK12575
NK96072
Arg6821
NK21815
LTU77
NK10879
Arg4961
Arg4609
NK23903
Arg1108
NK12552
Arg522
NK23899
NK21368
NK21546
NK22952
Arg996
NBH2020
Arg281
NK21556
Arg2496
NK12638
AMNH185323
NK23730
NK23533
Arg4425
NK21237
NK22813
Arg6876
UP397
NK23392
NK21621
Arg374
MVZ143696
NK22845
Arg6683
Arg687
Arg1466
NK21622
NK23901
NK30761
NK23347
NK23762
NBH7697
BDP3309
Arg6179
FMNH29170
AMNH248704
NK22844
Arg6578
Arg395
AC47
NK30479
MVZ145531
NK30425
NK22949
NK12637
Arg6572
BDP3345
NK23719
NK22815
0.99
1.0
1.0
1.0
1.0
0.92
1.0
1.0
1.0
1.0
1.0
1.0
1.0
**
Figure 2: in color online-only
5.0%
2.5%
5.4%

1.0
1.0
1.0
1.0
0.95
0.0005 substitutions/site
T. sponsorius B
T. venustus A
T. venustus B
T. pallidior B
T. venustus C
T. sponsorius A
T. pallidior A
Figure 3

0
0.1
0.2
0.3
0.4
0.5
0.6
0.7
0.8
0.9
1
0 1 2 3 4 5 6 7 8 9 10 11 12 13 14 15
T. venustus A vs. B+C
0
0.1
0.2
0.3
0.4
0.5
0.6
0.7
0.8
0.9
1
0 1 2 3 4 5 6 7 8 9 10 11 12 13 14 15
T. venustus B vs. C
(a) (b)
(c) (d)
0
0.1
0.2
0.3
0.4
0.5
0.6
0.7
0.8
0.9
1
0 1 2 3 4 5 6 7 8 9 10 11 12 13 14 15
T. sponsorius A vs. B
0
0.1
0.2
0.3
0.4
0.5
0.6
0.7
0.8
0.9
1
0 1 2 3 4 5 6 7 8 9 10 11 12 13 14 15
T. pallidior A vs. B
Number of Loci
Prob
abili
ty o
f Spe
cies
Del
imita
tion
Figure 4 Power Analysis

sponsorius venustus pallidior
00.
20.
40.
60.
81.
0
rela
tive
dive
rgen
ce ti
me
Fig. 5
Figure 5 Divergence Times

pallidior A
pallidior B
venustus A
venustus B
venustus C
sponsorius A
sponsorius B Argentina
Paraguay
Bolivia
Peru
Chile
15 nuclear loci
Not
Gen
etic
ally
Isol
ated
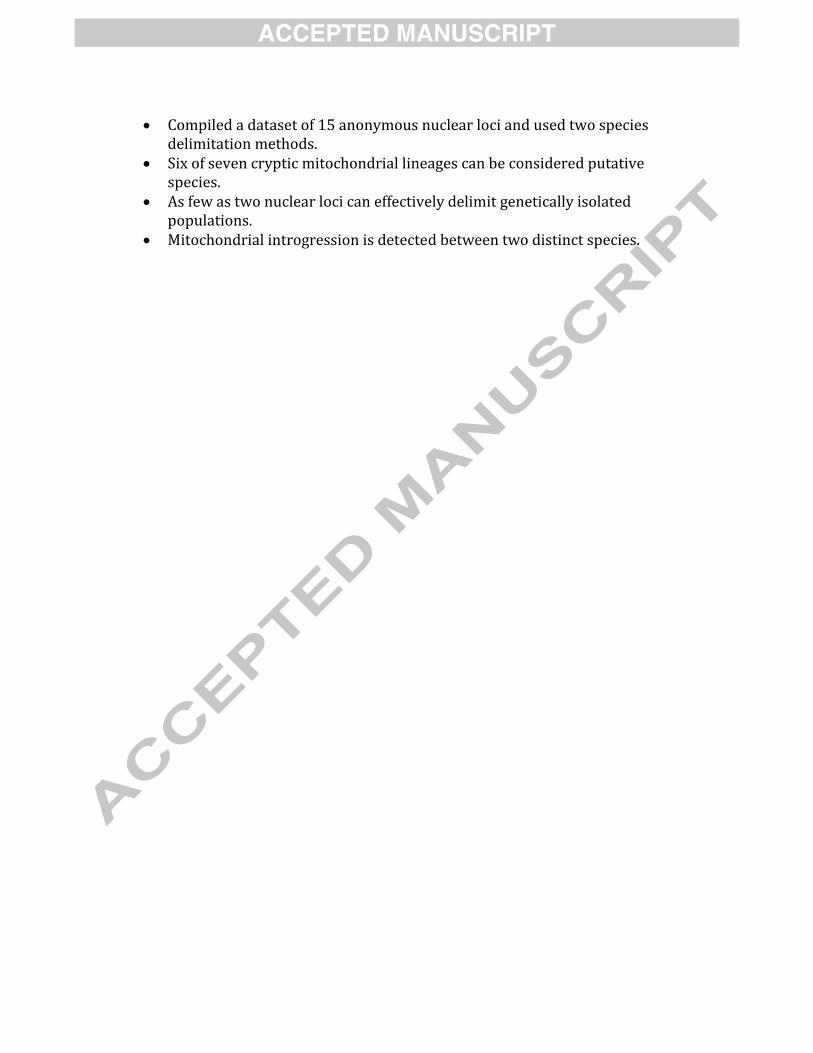
Compiled a dataset of 15 anonymous nuclear loci and used two species
delimitation methods. Six of seven cryptic mitochondrial lineages can be considered putative
species. As few as two nuclear loci can effectively delimit genetically isolated
populations. Mitochondrial introgression is detected between two distinct species.