hidden markov models, hmm’s morten nielsen, cbs, department of systems biology, dtu
TRANSCRIPT

Hidden Markov Models, HMM’s
Morten Nielsen,CBS,
Department of Systems Biology,
DTU
Objectives
• Introduce Hidden Markov models and understand that they are just weight matrices with gaps
• How to construct an HMM• How to “align/score” sequences to HMM’s
– Viterbi decoding– Forward decoding– Backward decoding– Posterior Decoding
• Use and construct Profile HMM– HMMer

SLLPAIVEL YLLPAIVHI TLWVDPYEV GLVPFLVSV KLLEPVLLL LLDVPTAAV LLDVPTAAV LLDVPTAAVLLDVPTAAV VLFRGGPRG MVDGTLLLL YMNGTMSQV MLLSVPLLL SLLGLLVEV ALLPPINIL TLIKIQHTLHLIDYLVTS ILAPPVVKL ALFPQLVIL GILGFVFTL STNRQSGRQ GLDVLTAKV RILGAVAKV QVCERIPTIILFGHENRV ILMEHIHKL ILDQKINEV SLAGGIIGV LLIENVASL FLLWATAEA SLPDFGISY KKREEAPSLLERPGGNEI ALSNLEVKL ALNELLQHV DLERKVESL FLGENISNF ALSDHHIYL GLSEFTEYL STAPPAHGVPLDGEYFTL GVLVGVALI RTLDKVLEV HLSTAFARV RLDSYVRSL YMNGTMSQV GILGFVFTL ILKEPVHGVILGFVFTLT LLFGYPVYV GLSPTVWLS WLSLLVPFV FLPSDFFPS CLGGLLTMV FIAGNSAYE KLGEFYNQMKLVALGINA DLMGYIPLV RLVTLKDIV MLLAVLYCL AAGIGILTV YLEPGPVTA LLDGTATLR ITDQVPFSVKTWGQYWQV TITDQVPFS AFHHVAREL YLNKIQNSL MMRKLAILS AIMDKNIIL IMDKNIILK SMVGNWAKVSLLAPGAKQ KIFGSLAFL ELVSEFSRM KLTPLCVTL VLYRYGSFS YIGEVLVSV CINGVCWTV VMNILLQYVILTVILGVL KVLEYVIKV FLWGPRALV GLSRYVARL FLLTRILTI HLGNVKYLV GIAGGLALL GLQDCTMLVTGAPVTYST VIYQYMDDL VLPDVFIRC VLPDVFIRC AVGIGIAVV LVVLGLLAV ALGLGLLPV GIGIGVLAAGAGIGVAVL IAGIGILAI LIVIGILIL LAGIGLIAA VDGIGILTI GAGIGVLTA AAGIGIIQI QAGIGILLAKARDPHSGH KACDPHSGH ACDPHSGHF SLYNTVATL RGPGRAFVT NLVPMVATV GLHCYEQLV PLKQHFQIVAVFDRKSDA LLDFVRFMG VLVKSPNHV GLAPPQHLI LLGRNSFEV PLTFGWCYK VLEWRFDSR TLNAWVKVVGLCTLVAML FIDSYICQV IISAVVGIL VMAGVGSPY LLWTLVVLL SVRDRLARL LLMDCSGSI CLTSTVQLVVLHDDLLEA LMWITQCFL SLLMWITQC QLSLLMWIT LLGATCMFV RLTRFLSRV YMDGTMSQV FLTPKKLQCISNDVCAQV VKTDGNPPE SVYDFFVWL FLYGALLLA VLFSSDFRI LMWAKIGPV SLLLELEEV SLSRFSWGAYTAFTIPSI RLMKQDFSV RLPRIFCSC FLWGPRAYA RLLQETELV SLFEGIDFY SLDQSVVEL RLNMFTPYINMFTPYIGV LMIIPLINV TLFIGSHVV SLVIVTTFV VLQWASLAV ILAKFLHWL STAPPHVNV LLLLTVLTVVVLGVVFGI ILHNGAYSL MIMVKCWMI MLGTHTMEV MLGTHTMEV SLADTNSLA LLWAARPRL GVALQTMKQGLYDGMEHL KMVELVHFL YLQLVFGIE MLMAQEALA LMAQEALAF VYDGREHTV YLSGANLNL RMFPNAPYLEAAGIGILT TLDSQVMSL STPPPGTRV KVAELVHFL IMIGVLVGV ALCRWGLLL LLFAGVQCQ VLLCESTAVYLSTAFARV YLLEMLWRL SLDDYNHLV RTLDKVLEV GLPVEYLQV KLIANNTRV FIYAGSLSA KLVANNTRLFLDEFMEGV ALQPGTALL VLDGLDVLL SLYSFPEPE ALYVDSLFF SLLQHLIGL ELTLGEFLK MINAYLDKLAAGIGILTV FLPSDFFPS SVRDRLARL SLREWLLRI LLSAWILTA AAGIGILTV AVPDEIPPL FAYDGKDYIAAGIGILTV FLPSDFFPS AAGIGILTV FLPSDFFPS AAGIGILTV FLWGPRALV ETVSEQSNV ITLWQRPLV
Weight matrix construction

PSSM construction
• Calculate amino acid frequencies at each position using– Sequence weighting– Pseudo counts
• Define background model– Use background amino acids frequencies
• PSSM is

More on scoring
Probability of observation given Model
Probability of observation given Prior (background)

Hidden Markov Models
• Weight matrices do not deal with insertions and deletions
• In alignments, this is done in an ad-hoc manner by optimization of the two gap penalties for first gap and gap extension
• HMM is a natural framework where insertions/deletions are dealt with explicitly

Why hidden?
• Model generates numbers– 312453666641
• Does not tell which die was used
• Alignment (decoding) can give the most probable solution/path (Viterbi)– FFFFFFLLLLLL
• Or most probable set of states– FFFFFFLLLLLL
1:1/62:1/63:1/64:1/65:1/66:1/6Fair
1:1/102:1/103:1/104:1/105:1/106:1/2Loaded
0.95
0.10
0.05
0.9
The unfair casino: Loaded die p(6) = 0.5; switch fair to load:0.05; switch load to fair: 0.1

HMM (a simple example)
ACA---ATGTCAACTATCACAC--AGCAGA---ATCACCG--ATC
• Example from A. Krogh• Core region defines the
number of states in the HMM (red)
• Insertion and deletion statistics are derived from the non-core part of the alignment (black)
Core of alignment

.2
.8
.2
ACGT
ACGT
ACGT
ACGT
ACGT
ACGT.8
.8 .8.8
.2.2.2
.2
1
ACGT
.2
.2
.4
1. .4 1. 1.1.
.6.6
.4
HMM construction (supervised learning)
ACA---ATGTCAACTATCACAC--AGCAGA---ATCACCG--ATC
• 5 matches. A, 2xC, T, G• 5 transitions in gap region• C out, G out• A-C, C-T, T out• Out transition 3/5• Stay transition 2/5
ACA---ATG 0.8x1x0.8x1x0.8x0.4x1x1x0.8x1x0.2 = 3.3x10⁻²

Scoring a sequence to an HMM
ACA---ATG 0.8x1x0.8x1x0.8x0.4x1x0.8x1x0.2 = 3.3x10⁻²
TCAACTATC 0.2x1x0.8x1x0.8x0.6x0.2x0.4x0.4x0.4x0.2x0.6x1x1x0.8x1x0.8 = 0.0075x10⁻² ACAC--AGC = 1.2x10⁻²
Consensus:ACAC--ATC = 4.7x10⁻², ACA---ATC = 13.1x10⁻²
Exceptional:TGCT--AGG = 0.0023x10⁻²

ACA---ATG = 3.3x10⁻²
TCAACTATC = 0.0075x10⁻² ACAC--AGC = 1.2x10⁻²
ACAC--ATC = 4.7x10⁻² ConsensusACA---ATC = 13.1x10⁻²
ExceptionTGCT--AGG = 0.0023x10⁻²
ACA---ATG = 4.9
TCAACTATC = 3.0 ACAC--AGC = 5.3AGA---ATC = 4.9ACCG--ATC = 4.6Consensus:ACAC--ATC = 6.7 ACA---ATC = 6.3Exceptional:TGCT--AGG = -0.97
Align sequence to HMM - Null model
• Score depends strongly on length
• Null model is a random model. For length L the score is 0.25L
• Log-odds score for sequence S
• Log( P(S)/0.25L)• Positive score means
more likely than Null model
• This is just like we did for PSSM log(p/q)!
Note!

Aligning a sequence to an HMM
• Find the path through the HMM states that has the highest probability– For alignment, we found the path through the
scoring matrix that had the highest sum of scores
• The number of possible paths rapidly gets very large making brute force search infeasible – Just like checking all path for alignment did not
work
• Use dynamic programming– The Viterbi algorithm does the job

The Viterbi algorithm
• Model generates numbers– 312453666641
1:1/62:1/63:1/64:1/65:1/66:1/6Fair
1:1/102:1/103:1/104:1/105:1/106:1/2Loaded
0.95
0.10
0.05
0.9
The unfair casino: Loaded dice p(6) = 0.5; switch fair to load:0.05; switch load to fair: 0.1

Model decoding (Viterbi)
• Example: 566. What was the series of dice used to generate this output?
• Use Brute force
1:1/62:1/63:1/64:1/65:1/66:1/6Fair
1:1/102:1/103:1/104:1/105:1/106:1/2Loaded
0.95
0.10
0.05
0.9
FFF = 0.5*0.167*0.95*0.167*0.95*0.167 = 0.0021
FFL = 0.5*0.167*0.95*0.167*0.05*0.5 = 0.00333
FLF = 0.5*0.167*0.05*0.5*0.1*0.167 = 0.000035
FLL = 0.5*0.167*0.05*0.5*0.9*0.5 = 0.00094
LFF = 0.5*0.1*0.1*0.167*0.95*0.167 = 0.00013
LFL = 0.5*0.1*0.1*0.167*0.05*0.5 = 0.000021
LLF = 0.5*0.1*0.9*0.5*0.1*0.167 = 0.00038
LLL = 0.5*0.1*0.9*0.5*0.9*0.5 = 0.0101

Or in log space
• Example: 566. What was the series of dice used to generate this output?
Log(P(LLL|M)) = log(0.5*0.1*0.9*0.5*0.9*0.5) = log(0.0101)
orLog(P(LLL|M)) = log(0.5)+log(0.1)+log(0.9)+log(0.5)+log(0.9)+log(0.5)
= -0.3 -1 -0.046 -0.3 -0.046 -0.3 = -1.99
1:-0.782:-0.783:-0.784:-0.785:-0.786:-0.78
Fair
1:-12:-13:-14:-15:-16:-0.3
Loaded
-0.02
-1
-1.3
-0.046Log model

Model decoding (Viterbi)
• Example: 566611234. What was the series of dice used to generate this output?
5 6 6 6 1 1 2 3 4
F -1.08
L -1.30
1:-0.782:-0.783:-0.784:-0.785:-0.786:-0.78
Fair
1:-12:-13:-14:-15:-16:-0.3
Loaded
-0.02
-1
-1.3
-0.046Log model
F = 0.5*0.167
log(F) = log(0.5) + log(0.167) = -1.08
L = 0.5*0.1
log(L) = log(0.5) + log(0.1) = -1.30

Model decoding (Viterbi)
• Example: 566611234. What was the series of dice used to generate this output?
5 6 6 6 1 1 2 3 4
F -1.08
L -1.30
1:-0.782:-0.783:-0.784:-0.785:-0.786:-0.78
Fair
1:-12:-13:-14:-15:-16:-0.3
Loaded
-0.02
-1
-1.3
-0.046Log modelFF = 0.5*0.167*0.95*0.167
Log(FF) = -0.30 -0.78 – 0.02 -0.78 = -1.88
LF = 0.5*0.1*0.1*0.167
Log(LF) = -0.30 -1 -1 -0.78 = -3.08
FL = 0.5*0.167*0.05*0.5
Log(FL) = -0.30 -0.78 – 1.30 -0.30 = -2.68
LL = 0.5*0.1*0.9*0.5
Log(LL) = -0.30 -1 -0.046 -0.3 = -1.65

Model decoding (Viterbi)
• Example: 566611234. What was the series of dice used to generate this output?
5 6 6 6 1 1 2 3 4
F -1.08 -1.88
L -1.30 -1.65
1:-0.782:-0.783:-0.784:-0.785:-0.786:-0.78
Fair
1:-12:-13:-14:-15:-16:-0.3
Loaded
-0.02
-1
-1.3
-0.046Log model
FFF = 0.5*0.167*0.95*0.167*0.95*0.167 = 0.0021
FLF = 0.5*0.167*0.05*0.5*0.1*0.167 = 0.000035
LFF = 0.5*0.1*0.1*0.167*0.95*0.167 = 0.00013
LLF = 0.5*0.1*0.9*0.5*0.1*0.167 = 0.00038
FLL = 0.5*0.167*0.05*0.5*0.9*0.5 = 0.00094
FFL = 0.5*0.167*0.95*0.167*0.05*0.5 = 0.00333
LFL = 0.5*0.1*0.1*0.167*0.05*0.5 = 0.000021
LLL = 0.5*0.1*0.9*0.5*0.9*0.5 = 0.0101

Model decoding (Viterbi)
• Example: 566611234. What was the series of dice used to generate this output?
5 6 6 6 1 1 2 3 4
F -1.08 -1.88 -2.68
L -1.30 -1.65 -1.99
1:-0.782:-0.783:-0.784:-0.785:-0.786:-0.78
Fair
1:-12:-13:-14:-15:-16:-0.3
Loaded
-0.02
-1
-1.3
-0.046Log model
FFF = 0.5*0.167*0.95*0.167*0.95*0.167 = 0.0021
Log(P(FFF))=-2.68
LLL = 0.5*0.1*0.9*0.5*0.9*0.5 = 0.0101
Log(P(LLL))=-1.99

Model decoding (Viterbi)
• Example: 566611234. What was the series of dice used to generate this output?
5 6 6 6 1 1 2 3 4
F -1.08 -1.88 -2.68
L -1.30 -1.65 -1.99
1:-0.782:-0.783:-0.784:-0.785:-0.786:-0.78
Fair
1:-12:-13:-14:-15:-16:-0.3
Loaded
-0.02
-1
-1.3
-0.046Log model

Model decoding (Viterbi)
• Example: 566611234. What was the series of dice used to generate this output?
5 6 6 6 1 1 2 3 4
F -1.08 -1.88 -2.68
L -1.30 -1.65 -1.99
1:-0.782:-0.783:-0.784:-0.785:-0.786:-0.78
Fair
1:-12:-13:-14:-15:-16:-0.3
Loaded
-0.02
-1
-1.3
-0.046Log model

Model decoding (Viterbi)
• Example: 566611234. What was the series of dice used to generate this output?
5 6 6 6 1 1 2 3 4
F -1.08 -1.88 -2.68 -3.48
L -1.30 -1.65 -1.99
1:-0.782:-0.783:-0.784:-0.785:-0.786:-0.78
Fair
1:-12:-13:-14:-15:-16:-0.3
Loaded
-0.02
-1
-1.3
-0.046Log model

Model decoding (Viterbi)
• Now we can formalize the algorithm!
1:-0.782:-0.783:-0.784:-0.785:-0.786:-0.78
Fair
1:-12:-13:-14:-15:-16:-0.3
Loaded
-0.02
-1
-1.3
-0.046Log model
New match Old max score Transition

Model decoding (Viterbi). Can you do it?• Example: 566611234. What was the
series of dice used to generate this output?
• Fill out the table using the Viterbi recursive algorithm– Add the arrows for backtracking
• Find the optimal path
1:-0.782:-0.783:-0.784:-0.785:-0.786:-0-78
Fair
1:-12:-13:-14:-15:-16:-0.3Loaded
-0.02
-1
-1.3
-0.046Log model
5 6 6 6 1 1 2 3 4
F -1.08 -1.88 -2.68 -3.48
L -1.30 -1.65 -1.99

Model decoding (Viterbi). Can you do it?• Example: 566611234. What was the series
of dice used to generate this output?• Fill out the table using the Viterbi recursive
algorithm– Add the arrows for backtracking
• Find the optimal path1:-0.782:-0.783:-0.784:-0.785:-0.786:-0-78
Fair
1:-12:-13:-14:-15:-16:-0.3Loaded
-0.02
-1
-1.3
-0.046Log model
5 6 6 6 1 1 2 3 4
F -1.08 -1.88 -2.68 -3.48 -4.92 -6.53
L -1.30 -1.65 -1.99 -3.39 -6.52
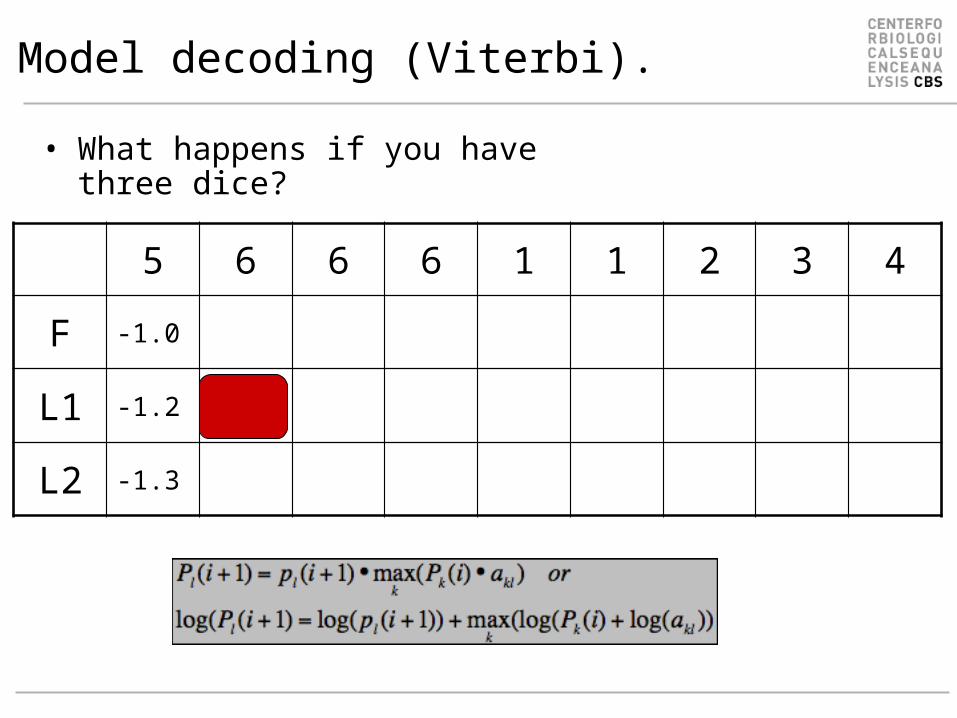
Model decoding (Viterbi).
• What happens if you have three dice?
5 6 6 6 1 1 2 3 4
F -1.0
L1 -1.2
L2 -1.3

The Forward algorithm
• The Viterbi algorithm finds the most probable path giving rise to a given sequence
• One other interesting question would be– What is the probability that a given
sequence can be generated by the hidden Markov model• Calculated by summing over all path giving
rise to a given sequence

The Forward algorithm
• Calculate summed probability over all path giving rise to a given sequence
• The number of possible paths is very large making (once more) brute force calculations infeasible– Use dynamic (recursive) programming

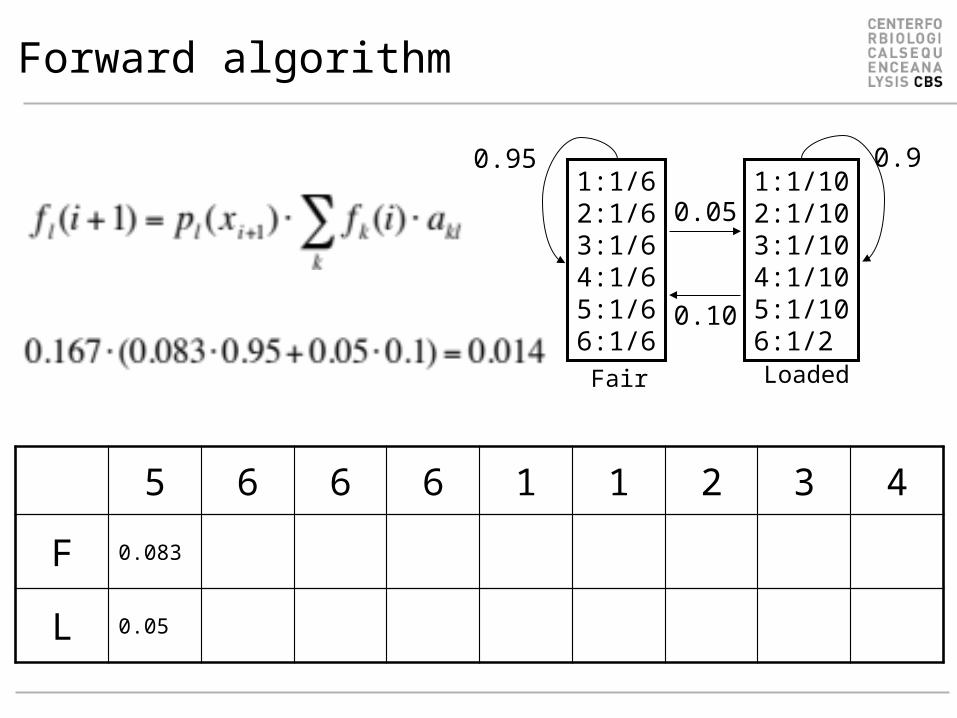
The Forward algorithm
• Say we know the probability of generating the sequence up to and including xi ending in state k
• Then the probability of observing the element i+1 of x ending in state l is
• where pl(xi+1) is the probability of observing xi+1 is state l, and akl is the transition probability from state k to state l
• Then

Forward algorithm
1:1/62:1/63:1/64:1/65:1/66:1/6Fair
1:1/102:1/103:1/104:1/105:1/106:1/2Loaded
0.95
0.10
0.05
0.9
5 6 6 6 1 1 2 3 4
F
L

Forward algorithm
1:1/62:1/63:1/64:1/65:1/66:1/6Fair
1:1/102:1/103:1/104:1/105:1/106:1/2Loaded
0.95
0.10
0.05
0.9
5 6 6 6 1 1 2 3 4
F 8.3e-2
L 5e-2

Forward algorithm
1:1/62:1/63:1/64:1/65:1/66:1/6Fair
1:1/102:1/103:1/104:1/105:1/106:1/2Loaded
0.95
0.10
0.05
0.9
5 6 6 6 1 1 2 3 4
F 8.3e-2
L 5e-2
Forward algorithm
1:1/62:1/63:1/64:1/65:1/66:1/6Fair
1:1/102:1/103:1/104:1/105:1/106:1/2Loaded
0.95
0.10
0.05
0.9
5 6 6 6 1 1 2 3 4
F 0.083
L 0.05

Forward algorithm
1:1/62:1/63:1/64:1/65:1/66:1/6Fair
1:1/102:1/103:1/104:1/105:1/106:1/2Loaded
0.95
0.10
0.05
0.9
5 6 6 6 1 1 2 3 4
F 0.083 0.014
L 0.05

Forward algorithm.Can you do it yourself?
1:1/62:1/63:1/64:1/65:1/66:1/6Fair
1:1/102:1/103:1/104:1/105:1/106:1/2Loaded
0.95
0.10
0.05
0.9
5 6 6 6 1 1 2 3 4
F 8.30e-2 2.63e-3 6.08e-4 1.82e-4 3.66e-5 1.09e-6 1.79e-7
L 5.00e-2 2.46e-2 1.14e-2 4.71e-4 4.33e-5 4.00e-7 4.14e-8
Fill out the empty cells in the table!What is P(x)?

The Posterior decoding (Backward algorithm)
• One other interesting question would be– What is the probability that an observation
xi came from a state k given the observed sequence x

The Backward algorithm
5 6 6 6 1 1 2 3 4
F ?
L
The probability of generation the sequence up to and including xi ending in state kForward algorithm!
The probability of generation the rest of the sequence starting from state kBackward algorithm!

The Backward algorithm
Forward algorithm
Backward algorithm
Forward/Backward
algorithm
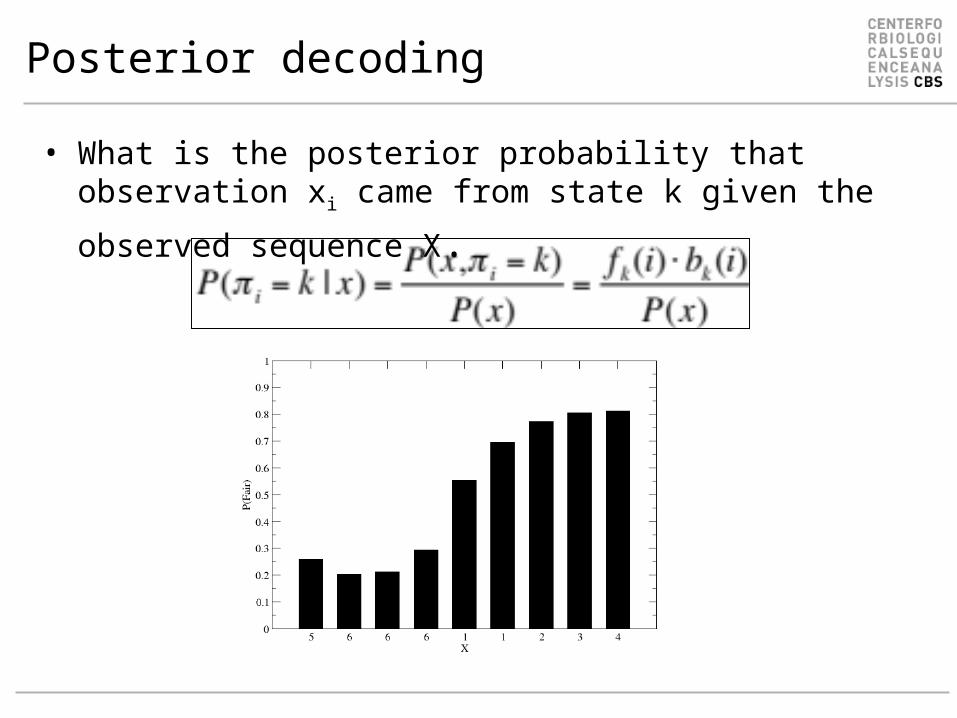
• What is the posterior probability that observation xi
came from state k given the observed sequence X.
Posterior decoding

Posterior decodingThe p
robabili
ty is
conte
xt
dependent

Training of HMM
• Supervised training– If each symbol is assigned to one state, all
parameters can be found by simply counting number of emissions and transitions as we did for the DNA model
• Un-supervised training– We do not know to which state each
symbol is assigned so another approach is needed
– Find emission and transition parameters that most likely produces the observed data
– Baum-Welsh does this

.2
.8
.2
ACGT
ACGT
ACGT
ACGT
ACGT
ACGT.8
.8 .8.8
.2.2.2
.2
1
ACGT
.2
.2
.4
1. .4 1. 1.1.
.6.6
.4
Supervised learning
ACA---ATGTCAACTATCACAC--AGCAGA---ATCACCG--ATC
• 5 matches. A, 2xC, T, G• 5 transitions in gap region• C out, G out• A-C, C-T, T out• Out transition 3/5• Stay transition 2/5
ACA---ATG 0.8x1x0.8x1x0.8x0.4x1x1x0.8x1x0.2 = 3.3x10⁻²

Un-supervised learning
3124536666414566675435666663331234
1:e112:e123:e134:e145:e156:e16Fair
1:e212:e223:e234:e245:e256:e26Loaded
a11
a21
a12
a22

Baum-Welsh
• Say we have a model with initial transition akl and emission ek(xi) probabilities. Then the probability that transition akl is used at position i in sequence x is
fk(i) : probability of generating the sequence up to and including xi ending in state k
bl(i+1) : probability of generating the sequence xi+2....xL starting from state l
el(xi+1) : emission probability of symbol xi+1 in state lP(x) : Probability of the sequence x (calculated using forward algorithm)

Backward algorithm
• What is the probability that an observation xi came from a state k given the observed sequence x

Baum-Welsh (continued)
• The expected number of times symbol b appears in state k is
where the inner sum is only over positions i for which the symbol emitted is b
• Given Akl and Ek(b) new model parameters akl and ek(b) are estimated and the procedure iterated
• You can implement Baum-Welsh as the 3-week course project

HMM’s and weight matrices
• In the case of un-gapped alignments HMM’s become simple weight matrices
• To achieve high performance, the emission frequencies are estimated using the techniques of – Sequence weighting– Pseudo counts

Profile HMM’s
• Alignments based on conventional scoring matrices (BLOSUM62) scores all positions in a sequence in an equal manner
• Some positions are highly conserved, some are highly variable (more than what is described in the BLOSUM matrix)
• Profile HMM’s are ideal suited to describe such position specific variations
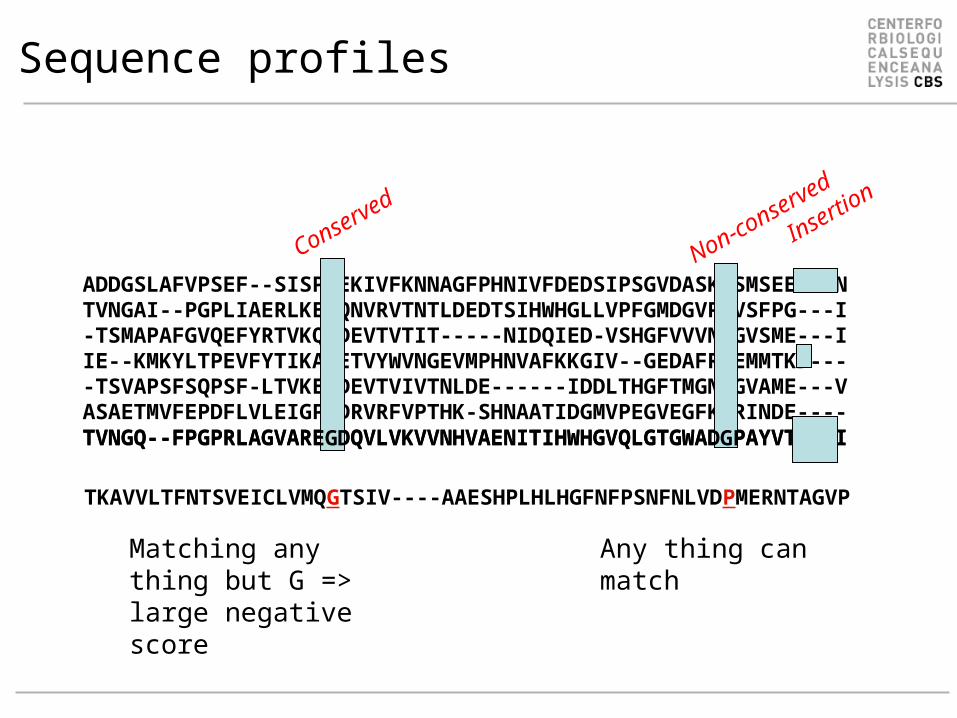
ADDGSLAFVPSEF--SISPGEKIVFKNNAGFPHNIVFDEDSIPSGVDASKISMSEEDLLN TVNGAI--PGPLIAERLKEGQNVRVTNTLDEDTSIHWHGLLVPFGMDGVPGVSFPG---I-TSMAPAFGVQEFYRTVKQGDEVTVTIT-----NIDQIED-VSHGFVVVNHGVSME---IIE--KMKYLTPEVFYTIKAGETVYWVNGEVMPHNVAFKKGIV--GEDAFRGEMMTKD----TSVAPSFSQPSF-LTVKEGDEVTVIVTNLDE------IDDLTHGFTMGNHGVAME---VASAETMVFEPDFLVLEIGPGDRVRFVPTHK-SHNAATIDGMVPEGVEGFKSRINDE----TVNGQ--FPGPRLAGVAREGDQVLVKVVNHVAENITIHWHGVQLGTGWADGPAYVTQCPI
Sequence profiles
Conserved
Non-conserved
Matching any thing but G => large negative score
Any thing can match
TKAVVLTFNTSVEICLVMQGTSIV----AAESHPLHLHGFNFPSNFNLVDPMERNTAGVP
TVNGQ--FPGPRLAGVAREGDQVLVKVVNHVAENITIHWHGVQLGTGWADGPAYVTQCPI
Insertion

HMM vs. alignment
• Detailed description of core– Conserved/variable positions
• Price for insertions/deletions varies at different locations in sequence
• These features cannot be captured in conventional alignments

Profile HMM’s
All M/D pairs must be visited once
L1- Y2A3V4R5- I6
P1D2P3P4I4P5D6P7

Profile HMM
• Un-gapped profile HMM is just a sequence profile
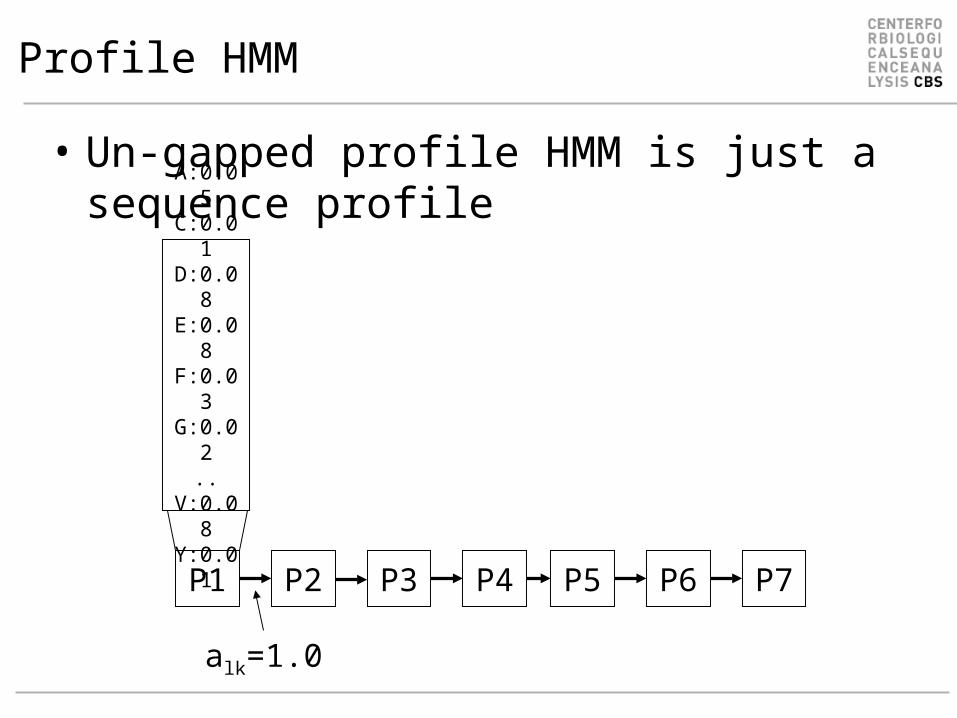
Profile HMM
• Un-gapped profile HMM is just a sequence profile
P1 P2 P3 P4 P5 P6 P7
A:0.05C:0.0
1D:0.0
8E:0.08F:0.03G:0.0
2..
V:0.08Y:0.01
alk=1.0

Example. Where is the active site?
• Sequence profiles might show you where to look!• The active site could be around• S9, G42, N74, and H195

Profile HMM
• Profile HMM (deletions and insertions)

Profile HMM (deletions and insertions)
QUERY HAMDIRCYHSGG-PLHL-GEI-EDFNGQSCIVCPWHKYKITLATGE--GLYQSINPKDPSQ8K2P6 HAMDIRCYHSGG-PLHL-GEI-EDFNGQSCIVCPWHKYKITLATGE--GLYQSINPKDPSQ8TAC1 HAMDIRCYHSGG-PLHL-GDI-EDFDGRPCIVCPWHKYKITLATGE--GLYQSINPKDPSQ07947 FAVQDTCTHGDW-ALSE-GYL-DGD----VVECTLHFGKFCVRTGK--VKAL------PAP0A185 YATDNLCTHGSA-RMSD-GYL-EGRE----IECPLHQGRFDVCTGK--ALC------APVP0A186 YATDNLCTHGSA-RMSD-GYL-EGRE----IECPLHQGRFDVCTGK--ALC------APVQ51493 YATDNLCTHGAA-RMSD-GFL-EGRE----IECPLHQGRFDVCTGR--ALC------APVA5W4F0 FAVQDTCTHGDW-ALSD-GYL-DGD----IVECTLHFGKFCVRTGK--VKAL------PAP0C620 FAVQDTCTHGDW-ALSD-GYL-DGD----IVECTLHFGKFCVRTGK--VKAL------PAP08086 FAVQDTCTHGDW-ALSD-GYL-DGD----IVECTLHFGKFCVRTGK--VKAL------PAQ52440 FATQDQCTHGEW-SLSE-GGY-LDGD---VVECSLHMGKFCVRTGK-------------VQ7N4V8 FAVDDRCSHGNA-SISE-GYL-ED---NATVECPLHTASFCLRTGK--ALCL------PAP37332 FATQDRCTHGDW-SLSDGGYL-EGD----VVECSLHMGKFCVRTGK-------------VA7ZPY3 YAINDRCSHGNA-SMSE-GYL-EDD---ATVECPLHAASFCLKTGK--ALCL------PAP0ABW1 YAINDRCSHGNA-SMSE-GYL-EDD---ATVECPLHAASFCLKTGK--ALCL------PAA8A346 YAINDRCSHGNA-SMSE-GYL-EDD---ATVECPLHAASFCLKTGK--ALCL------PAP0ABW0 YAINDRCSHGNA-SMSE-GYL-EDD---ATVECPLHAASFCLKTGK--ALCL------PAP0ABW2 YAINDRCSHGNA-SMSE-GYL-EDD---ATVECPLHAASFCLKTGK--ALCL------PAQ3YZ13 YAINDRCSHGNA-SMSE-GYL-EDD---ATVECPLHAASFCLKTGK--ALCL------PAQ06458 YALDNLEPGSEANVLSR-GLL-GDAGGEPIVISPLYKQRIRLRDG---------------
Core
Insertion Deletion

The HMMer program
• HMMer is a open source program suite for profile HMM for biological sequence analysis
• Used to make the Pfam database of protein families– http://pfam.sanger.ac.uk/

A HMMer example
• Example from the CASP8 competition• What is the best PDB template for
building a model for the sequence T0391>T0391 rieske ferredoxin, mouse, 157 residuesSDPEISEQDEEKKKYTSVCVGREEDIRKSERMTAVVHDREVVIFYHKGEYHAMDIRCYHSGGPLHLGEIEDFNGQSCIVCPWHKYKITLATGEGLYQSINPKDPSAKPKWCSKGVKQRIHTVKVDNGNIYVTLSKEPFKCDSDYYATGEFKVIQSSS

A HMMer example
• What is the best PDB template for building a model for the sequence T0391
• Use Blast– No hits
• Use Psi-Blast– No hits
• Use Hmmer
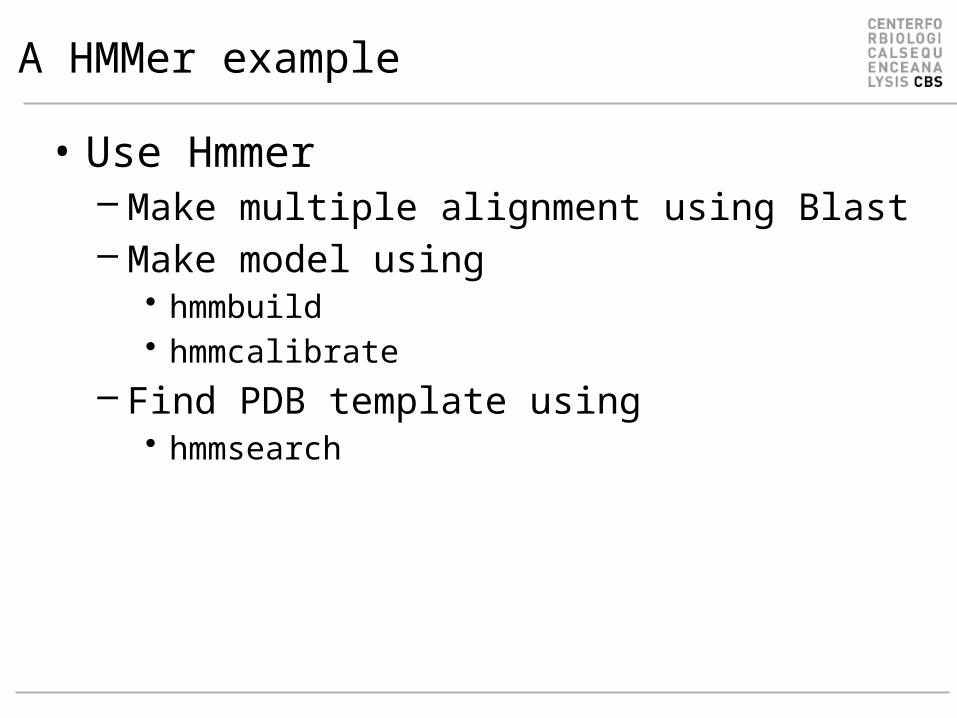
A HMMer example
• Use Hmmer– Make multiple alignment using Blast– Make model using
• hmmbuild• hmmcalibrate
– Find PDB template using• hmmsearch

A HMMer example
• Make multiple alignment using Blastblastpgp -j 3 -e 0.001 -m 6 -i T0391.fsa -d sp -b
10000000 -v 10000000 > T0391.fsa.blastout• Make Stockholm format
# STOCKHOLM 1.0QUERY DPEISEQDEEKKKYTSVCVGREEDIRKS-ERMTAVVHD-RE--V-V-IF--Y-H-KGE-Y
Q8K2P6 DPEISEQDEEKKKYTSVCVGREEDIRKS-ERMTAVVHD-RE--V-V-IF--Y-H-KGE-Y Q8TAC1 ----SAQDPEKREYSSVCVGREDDIKKS-ERMTAVVHD-RE--V-V-IF--Y-H-KGE-Y
• Build HMMhmmbuild T0391.hmm T0391.fsa.blastout.sto
• Calibrate HMM (to estimate correct p-values)hmmcalibrate T0391.hmm
• Search for templates in PDBhmmsearch T0391.hmm pdb > T0391.out

A HMMer example
Sequence Description Score E-value N -------- ----------- ----- ------- ---3D89.A mol:aa ELECTRON TRANSPORT 178.6 2.1e-49 12E4Q.A mol:aa ELECTRON TRANSPORT 163.7 6.7e-45 12E4P.B mol:aa ELECTRON TRANSPORT 163.7 6.7e-45 12E4P.A mol:aa ELECTRON TRANSPORT 163.7 6.7e-45 12E4Q.C mol:aa ELECTRON TRANSPORT 163.7 6.7e-45 12YVJ.B mol:aa OXIDOREDUCTASE/ELECTRON TRANSPORT 163.7 6.7e-45 11FQT.A mol:aa OXIDOREDUCTASE 160.9 4.5e-44 11FQT.B mol:aa OXIDOREDUCTASE 160.9 4.5e-44 12QPZ.A mol:aa METAL BINDING PROTEIN 137.3 5.6e-37 12Q3W.A mol:aa ELECTRON TRANSPORT 116.2 1.3e-30 11VM9.A mol:aa ELECTRON TRANSPORT 116.2 1.3e-30 1

A HMMer example
HEADER ELECTRON TRANSPORT 22-MAY-08 3D89
TITLE CRYSTAL STRUCTURE OF A SOLUBLE RIESKE FERREDOXIN FROM MUS
TITLE 2 MUSCULUS
COMPND MOL_ID: 1;
COMPND 2 MOLECULE: RIESKE DOMAIN-CONTAINING PROTEIN;
COMPND 3 CHAIN: A;
COMPND 4 ENGINEERED: YES
SOURCE MOL_ID: 1;
SOURCE 2 ORGANISM_SCIENTIFIC: MUS MUSCULUS;
SOURCE 3 ORGANISM_COMMON: MOUSE;
SOURCE 4 GENE: RFESD;
SOURCE 5 EXPRESSION_SYSTEM: ESCHERICHIA COLI;
This is the structure we are trying to predict

Validation. CE structural alignment
CE 2E4Q A 3D89 A (run on IRIX machines at CBS)
Structure Alignment Calculator, version 1.01, last modified: May 25, 2000.
CE Algorithm, version 1.00, 1998.
Chain 1: /usr/cbs/bio/src/ce_distr/data.cbs/pdb2e4q.ent:A (Size=109)Chain 2: /usr/cbs/bio/src/ce_distr/data.cbs/pdb3d89.ent:A (Size=157)
Alignment length = 101 Rmsd = 2.03A Z-Score = 5.5 Gaps = 20(19.8%) CPU = 1s Sequence identities = 18.1%
Chain 1: 2 TFTKACSVDEVPPGEALQVSHDAQKVAIFNVDGEFFATQDQCTHGEWSLSEGGYLDG----DVVECSLHMChain 2: 16 TSVCVGREEDIRKSERMTAVVHDREVVIFYHKGEYHAMDIRCYHSGGPLH-LGEIEDFNGQSCIVCPWHK
Chain 1: 68 GKFCVRTGKVKS-----PPPC---------EPLKVYPIRIEGRDVLVDFSRAALHChain 2: 85 YKITLATGEGLYQSINPKDPSAKPKWCSKGVKQRIHTVKVDNGNIYVTL-SKEPF

HMM packages
• HMMER (http://hmmer.wustl.edu/)– S.R. Eddy, WashU St. Louis. Freely available.
• SAM (http://www.cse.ucsc.edu/research/compbio/sam.html)– R. Hughey, K. Karplus, A. Krogh, D. Haussler and others, UC Santa
Cruz. Freely available to academia, nominal license fee for commercial users.
• META-MEME (http://metameme.sdsc.edu/)– William Noble Grundy, UC San Diego. Freely available. Combines
features of PSSM search and profile HMM search.
• NET-ID, HMMpro (http://www.netid.com/html/hmmpro.html)– Freely available to academia, nominal license fee for commercial
users.– Allows HMM architecture construction.
• EasyGibbs (http://www.cbs.dtu.dk/biotools/EasyGibbs/)– Webserver for Gibbs sampling of proteins sequences