hierarchical clustering analysis - partek · hierarchical clustering is considered an unsupervised...
TRANSCRIPT
Partek User’s Guide: Hierarchical Clustering Analysis
Hierarchical Clustering Analysis
What is Hierarchical Clustering?
Hierarchical clustering is used to group similar objects into “clusters”. In the
beginning, each row and/or column is considered a cluster. In hierarchical
clustering, the two most similar clusters are combined and continue to combine
until all objects are in the same cluster. Hierarchical clustering produces a tree
(called a dendogram) that shows the hierarchy of the clusters. This allows for
exploratory analysis to see how the microarrays group together based on similarity
of features. Hierarchical clustering is considered an unsupervised clustering
method. Unsupervised clustering does not take any of the experimental variables
such as treatment, phenotype, tissue, etc. into account while clustering, whereas
supervised clusters does consider experimental variables when clustering. Partek
offers an alternative to Hierarchical clustering in the form of K-Means clustering
and Self-Organizing Map. You can read a more in depth description of how Partek
performs these different forms for clustering analysis in Chapter 8 Hierarchical &
Partitioning Clustering of the Partek Manual. The Partek user’s manual is
embedded in Partek GS under Help > On-Line Help.
A Case Study
In the following examples, a hierarchical clustering is constructed based on a gene
list, which was created from the Down syndrome data set (see the Affymetrix Down
Syndrome Study Data for Gene Expression Tutorial available from the Partek
Tutorial web page). The gene list that was created shows 26 genes with a p-value
significant with an FDR of 0.10 between normal and Down syndrome patients. In
the Gene Expression workflow, go to the Visualization section, and select cluster
based on significant genes. Partek will generate the Cluster the Significant Genes
dialog box, from which you will select Hierarchical Clustering as the type of
clustering to perform. Select the spreadsheet you want to use for the hierarchical
clustering as well as the expression normalization you would like to use. By default,
the expression of each gene will be standardized to mean 0 and standard deviation
of 1. Genes, which are unchanged, are displayed as a value of zero and colored
grey. Up-regulated genes have positive values and displayed as red. Down-
regulated genes have negative values and are displayed as blue. Partek will generate
the hierarchical clustering (Figure 1). The resulting graph illustrates the
standardized gene expression level of each gene in each sample.
Partek User’s Guide: Hierarchical Clustering Analysis
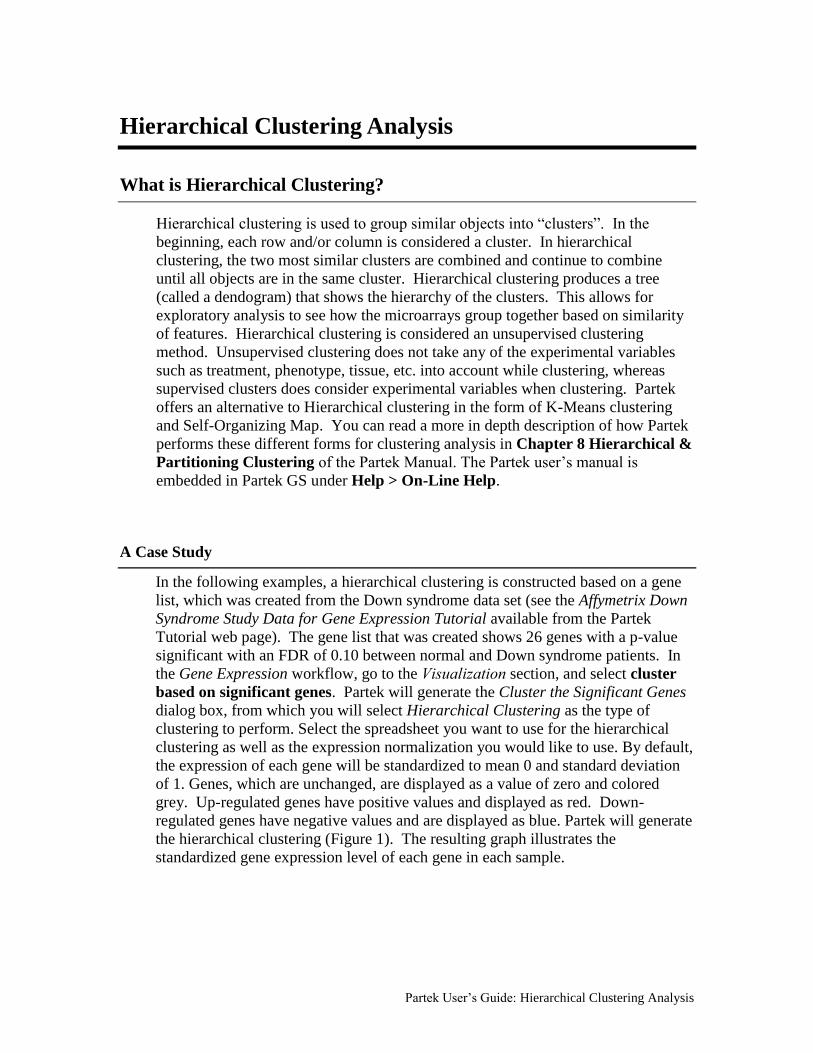
Figure 1: Hierarchical clustering of 26 differentially expressed genes between
Down syndrome patients and normal patients
The right-section (main panel) of the “Hierarchical Clustering” window is the
heatmap for the 26 differentially expressed genes. This heatmap can be configured
through the properties panel at the left-section.
In the main panel, the samples are represented in rows and the probes/genes are
represented in columns. By default, the dendrograms for samples and genes are
shown in the left and top of the main panel. The gene symbol is shown as the x-
axis. The gene symbol will be shown if and only if there is enough space to show
all the genes. The sample attribute/annotation is shown on the y-axis. The samples
will be grouped base on the first sample categorical attribute found in the
spreadsheet. The same category samples will be shown as one color. In this case,
the “Down Syndrome” samples are shown as blue and the “Normal” samples are
shown as green color.
In the properties panel on the left, there are different tabs to configure the heatmap
in the main panel. General configuration for the heatmap is shown in the “Heat
Map” tab. Dendrogram configuration for the heatmap is shown in the
“Dendrogram” tab. “Title” tab contains configuration for giving the title for the
heatmap. The “Rows” tab is used to configure the “Rows” of the heatmap. And
finally the “Columns” tab is used to configure the “Columns” of the heatmap. By
default, rows refer to samples and columns refer to genes, unless the heatmap has
been transposed.
Partek User’s Guide: Hierarchical Clustering Analysis
Common Edits and Manipulation of the Hierarchical Clustering Plot
The rest of the tutorial will describe how to make common edits and features in the
Partek hierarchical clustering view.
Label Sample Attributes in the Heat Map
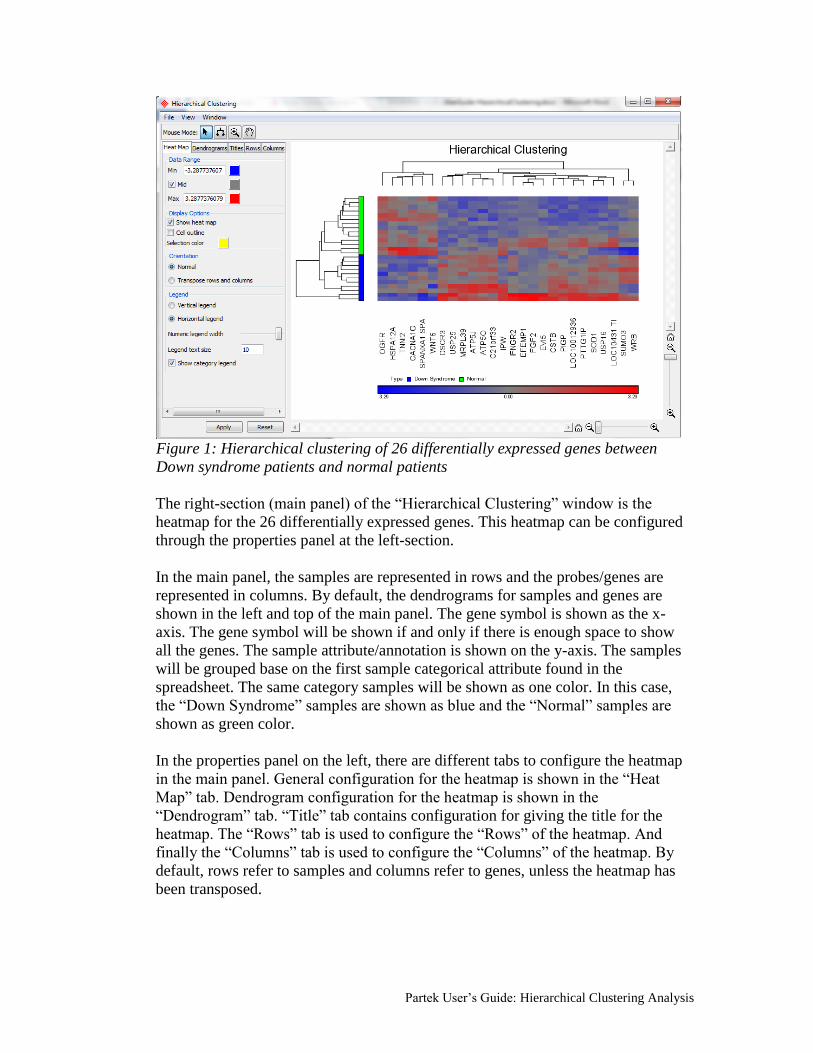
In order to label the sample attributes in the heat map instead of just a color box,
please follow these steps:
Please choose the “Rows” tab. Make sure that “Type” appears in the
“Annotation Box”.
Change the “Width (in pixels)” to 25. This will increase the width of the box to
put the attribute’s name.
Please ensure that you “check” the “Show Label”.
Change the “Text size” to 12, “Text angle” to 90. This will ensure the text is
written in vertical way.
Please select “Apply” to apply the change.
The result should be the same as Figure 2 shown below.
Figure 2: Label sample attributes in heat map
Annotation Box
Partek User’s Guide: Hierarchical Clustering Analysis
Adding another Sample Attribute in the Heat Map
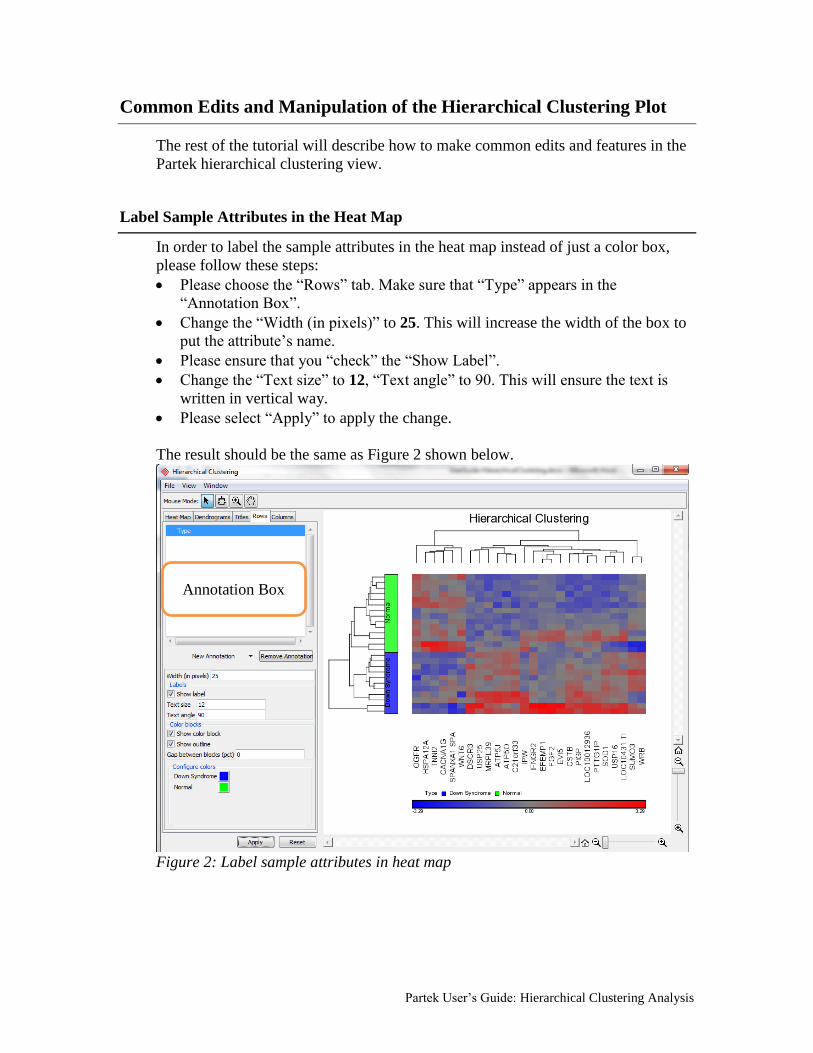
It is possible to add another sample attribute to describe the samples in the heat
map. This will allow the plot to show multiple categorical groups on the samples in
the heat map.
Let’s say that we would like to add the “Tissue” description to the samples in the
heatmap, please follow these steps:
Please ensure the “Rows” tab is still chosen.
Please select on “New Annotation” dropdown list and choose “Tissue”.
Please select “Apply” to apply the change.
Figure 3: Adding Additional Sample Attribute
You will notice that a new color block has been added to describe the samples’
tissues in the heat map (Figure 3).
Change the Orientation of the Rows and Columns
By default, as described previously, Partek® will list the samples on rows and the
genes on columns in the hierarchical cluster. To easily transpose the plot to show
the genes on rows and the samples on row, please follow these steps:
Please select the “Heat Map” tab.
Under the “Orientation” section, please select “Transpose rows and columns”.
Please select “Apply” to apply the change.
Partek User’s Guide: Hierarchical Clustering Analysis
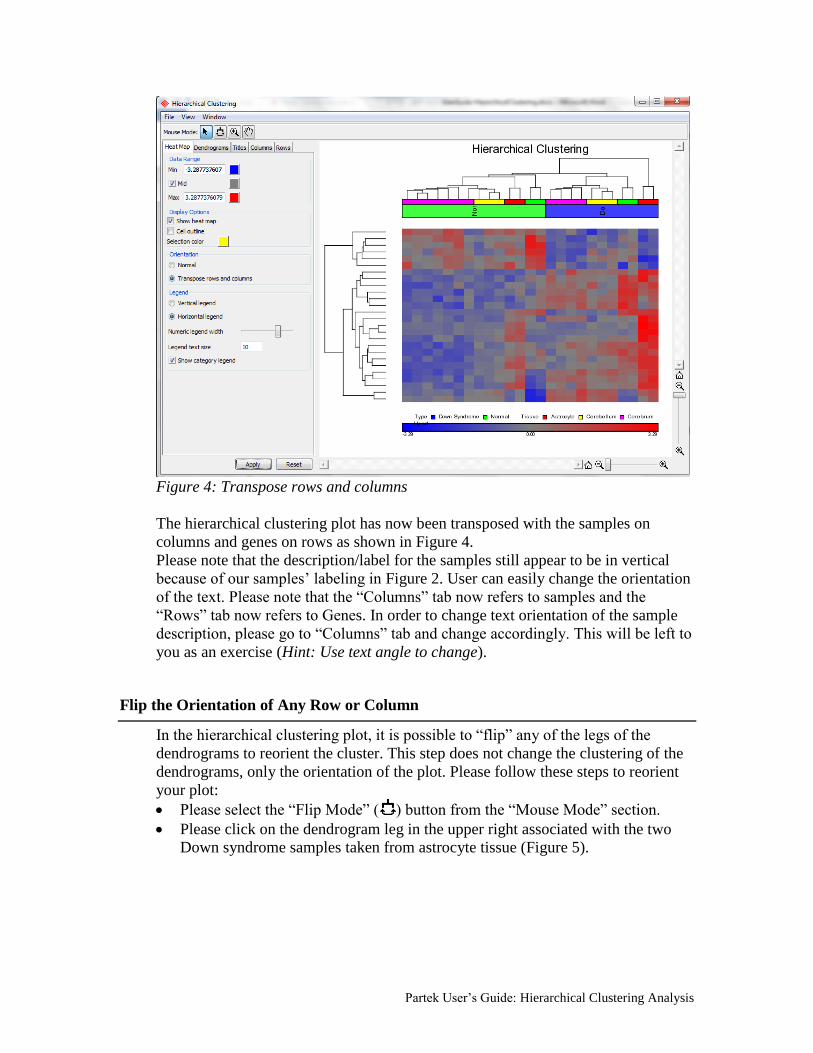
Figure 4: Transpose rows and columns
The hierarchical clustering plot has now been transposed with the samples on
columns and genes on rows as shown in Figure 4.
Please note that the description/label for the samples still appear to be in vertical
because of our samples’ labeling in Figure 2. User can easily change the orientation
of the text. Please note that the “Columns” tab now refers to samples and the
“Rows” tab now refers to Genes. In order to change text orientation of the sample
description, please go to “Columns” tab and change accordingly. This will be left to
you as an exercise (Hint: Use text angle to change).
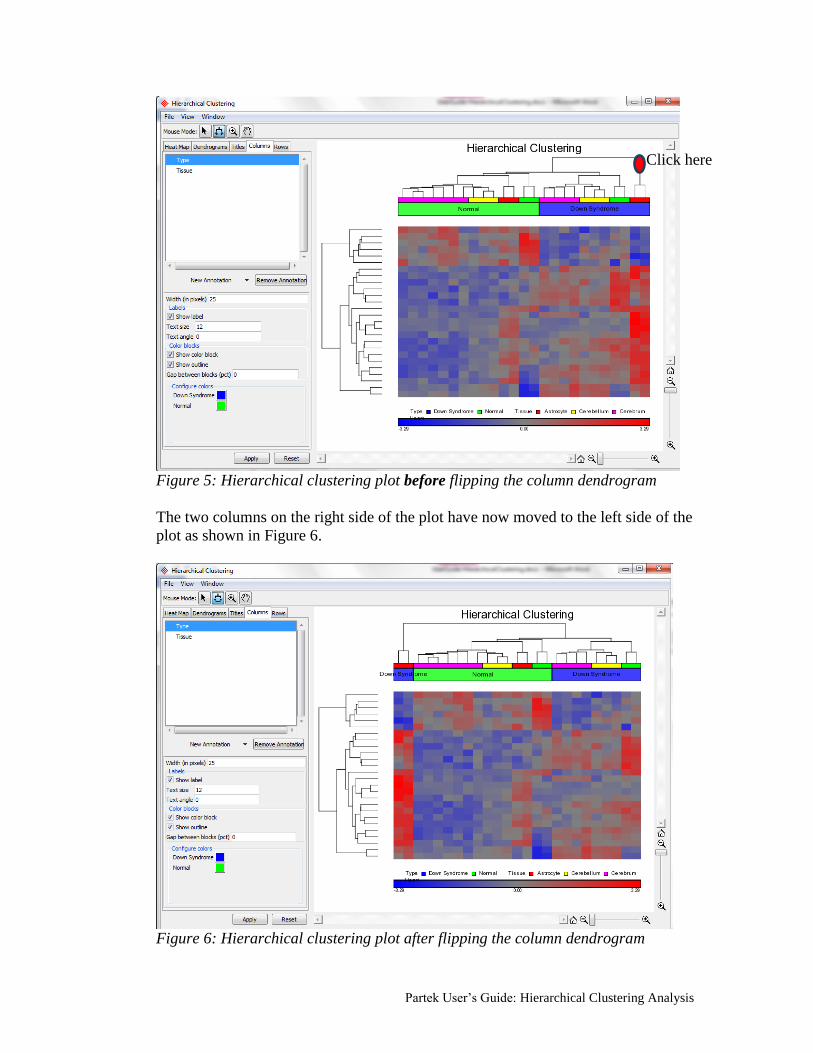
Flip the Orientation of Any Row or Column
In the hierarchical clustering plot, it is possible to “flip” any of the legs of the
dendrograms to reorient the cluster. This step does not change the clustering of the
dendrograms, only the orientation of the plot. Please follow these steps to reorient
your plot:
Please select the “Flip Mode” ( ) button from the “Mouse Mode” section.
Please click on the dendrogram leg in the upper right associated with the two
Down syndrome samples taken from astrocyte tissue (Figure 5).
Partek User’s Guide: Hierarchical Clustering Analysis
Figure 5: Hierarchical clustering plot before flipping the column dendrogram
The two columns on the right side of the plot have now moved to the left side of the
plot as shown in Figure 6.
Figure 6: Hierarchical clustering plot after flipping the column dendrogram
Click here
Partek User’s Guide: Hierarchical Clustering Analysis
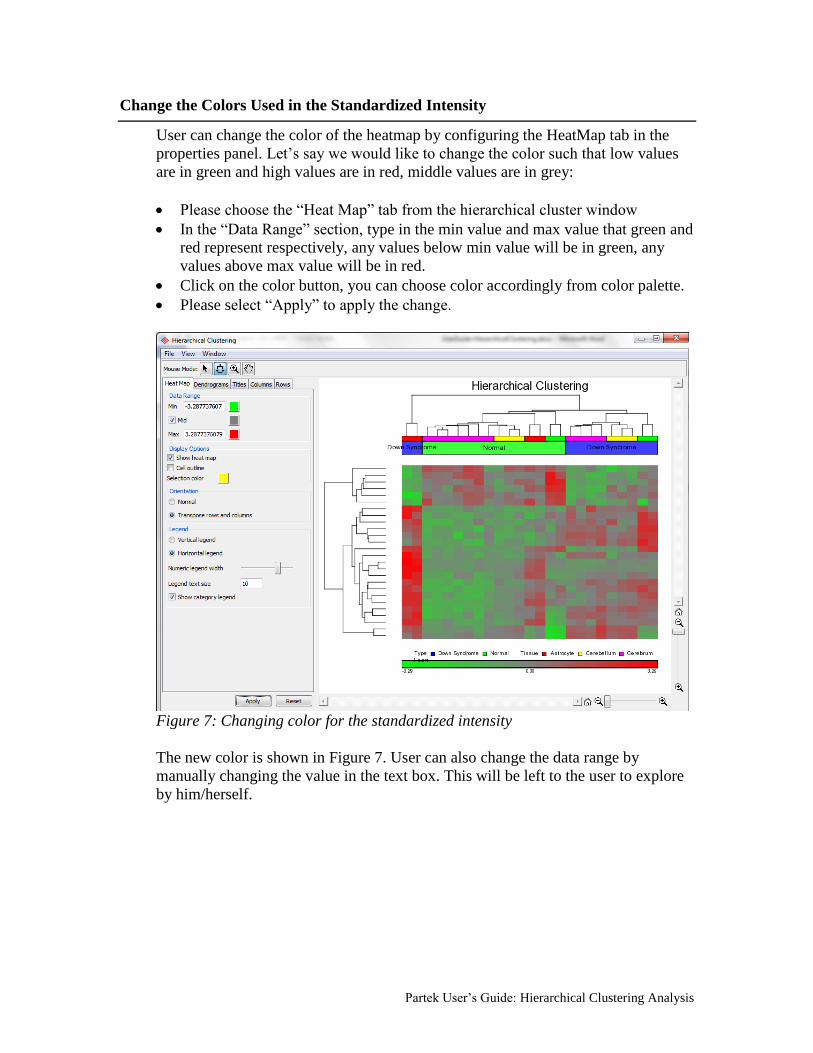
Change the Colors Used in the Standardized Intensity
User can change the color of the heatmap by configuring the HeatMap tab in the
properties panel. Let’s say we would like to change the color such that low values
are in green and high values are in red, middle values are in grey:
Please choose the “Heat Map” tab from the hierarchical cluster window
In the “Data Range” section, type in the min value and max value that green and
red represent respectively, any values below min value will be in green, any
values above max value will be in red.
Click on the color button, you can choose color accordingly from color palette.
Please select “Apply” to apply the change.
Figure 7: Changing color for the standardized intensity
The new color is shown in Figure 7. User can also change the data range by
manually changing the value in the text box. This will be left to the user to explore
by him/herself.
Partek User’s Guide: Hierarchical Clustering Analysis
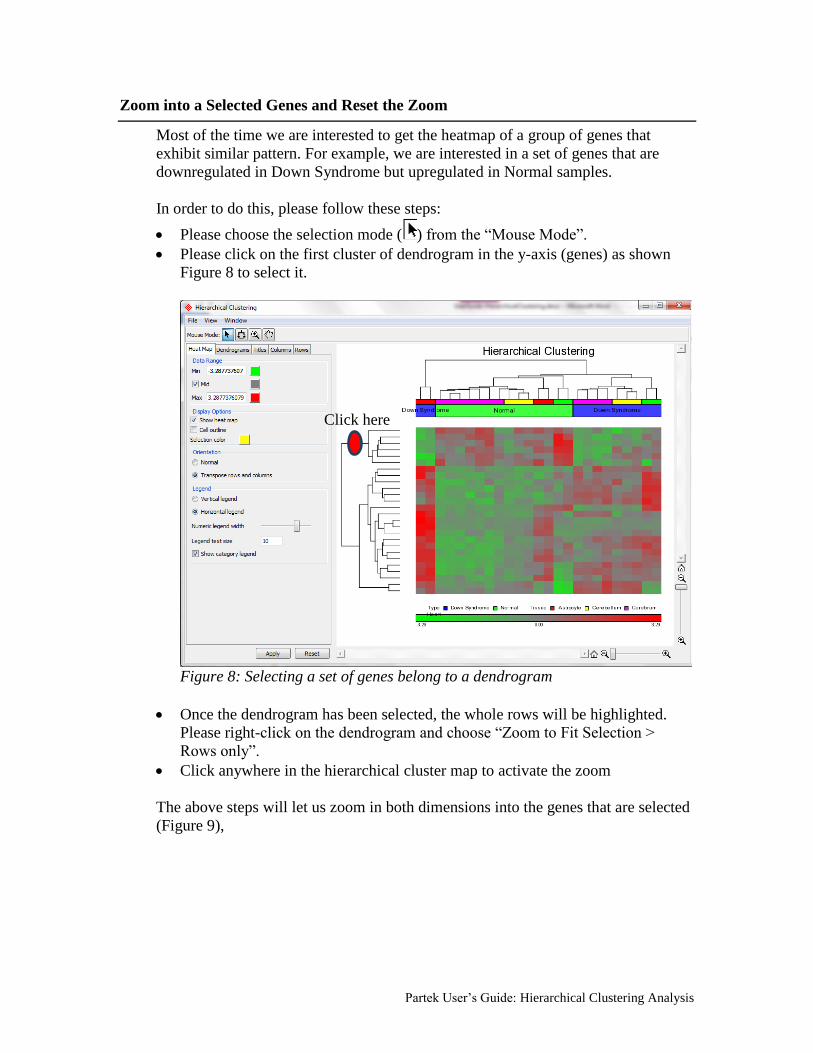
Zoom into a Selected Genes and Reset the Zoom
Most of the time we are interested to get the heatmap of a group of genes that
exhibit similar pattern. For example, we are interested in a set of genes that are
downregulated in Down Syndrome but upregulated in Normal samples.
In order to do this, please follow these steps:
Please choose the selection mode ( ) from the “Mouse Mode”.
Please click on the first cluster of dendrogram in the y-axis (genes) as shown
Figure 8 to select it.
Figure 8: Selecting a set of genes belong to a dendrogram
Once the dendrogram has been selected, the whole rows will be highlighted.
Please right-click on the dendrogram and choose “Zoom to Fit Selection >
Rows only”.
Click anywhere in the hierarchical cluster map to activate the zoom
The above steps will let us zoom in both dimensions into the genes that are selected
(Figure 9),
Click here
Partek User’s Guide: Hierarchical Clustering Analysis
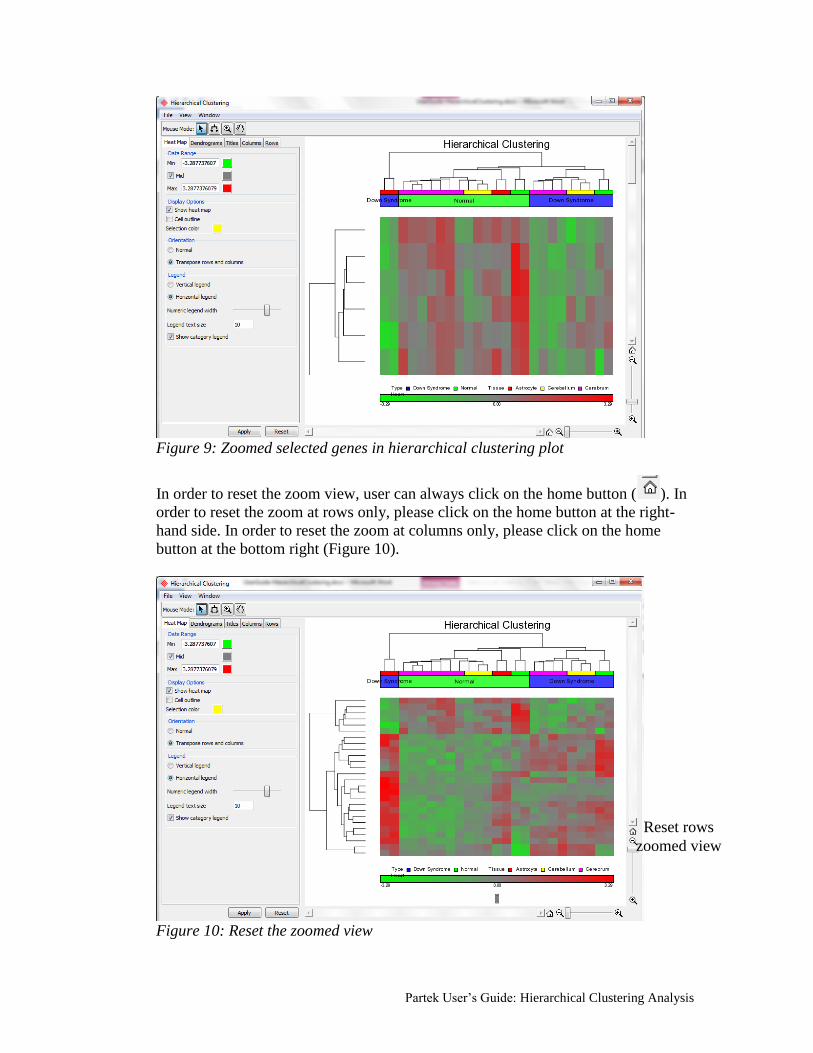
Figure 9: Zoomed selected genes in hierarchical clustering plot
In order to reset the zoom view, user can always click on the home button ( ). In
order to reset the zoom at rows only, please click on the home button at the right-
hand side. In order to reset the zoom at columns only, please click on the home
button at the bottom right (Figure 10).
Figure 10: Reset the zoomed view
Reset rows
zoomed view
Partek User’s Guide: Hierarchical Clustering Analysis
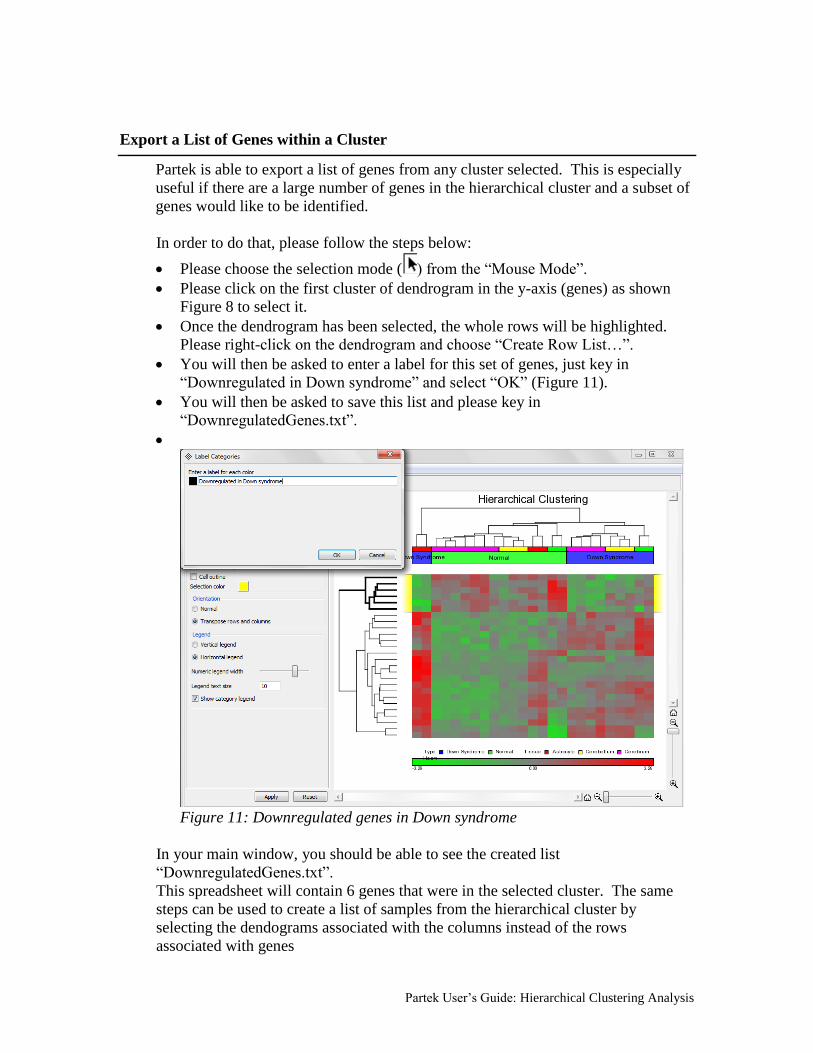
Export a List of Genes within a Cluster
Partek is able to export a list of genes from any cluster selected. This is especially
useful if there are a large number of genes in the hierarchical cluster and a subset of
genes would like to be identified.
In order to do that, please follow the steps below:
Please choose the selection mode ( ) from the “Mouse Mode”.
Please click on the first cluster of dendrogram in the y-axis (genes) as shown
Figure 8 to select it.
Once the dendrogram has been selected, the whole rows will be highlighted.
Please right-click on the dendrogram and choose “Create Row List…”.
You will then be asked to enter a label for this set of genes, just key in
“Downregulated in Down syndrome” and select “OK” (Figure 11).
You will then be asked to save this list and please key in
“DownregulatedGenes.txt”.
Figure 11: Downregulated genes in Down syndrome
In your main window, you should be able to see the created list
“DownregulatedGenes.txt”.
This spreadsheet will contain 6 genes that were in the selected cluster. The same
steps can be used to create a list of samples from the hierarchical cluster by
selecting the dendograms associated with the columns instead of the rows
associated with genes
Partek User’s Guide: Hierarchical Clustering Analysis
Note: To deselect the cluster of genes, just click anywhere in the hierarchical
cluster plot
Increase the Width of the Dendrogram
It is possible to make the dendrogram line width wider in Partek.
Please follow these directions to increase the width of the dendrogram:
Please select the “Dendrograms” tab from the Hierarchical Clustering window.
Under the “Row” or “Column”, there is a width horizontal bar for the
adjustment. Please select and drag to adjust the width and click on “Apply” to
make the change.
This will be left to the user to adjust accordingly.
Export the Hierarchical Cluster Plot Image
To export the hierarchical cluster plot image so that the image can be included in a
presentation or publication follow these steps:
From the hierarchical cluster plot, go to File > Save Image As…
A new dialog box will appear requesting a name, location, and type of file
the image should be saved as
Please select Desktop as the location
Please key in “image” as the File name
In the pull-down menu for Save as type select TIFF Image
(*.tiff,*.tif,*.TIFF,*.TIF)
Select Save
End of User Guide
This is the end of the user guide. If you need additional assistance, you may call our
technical support staff at +1-314-878-2329 or email [email protected].