hierarchical knowledge based … grow near the bhaga river owing to suitable temperature and...
TRANSCRIPT

Pecora 20 - Observing a Changing Earth; Science for Decisions— Monitoring, Assessment, and Projection
November 13-16, 2017 Sioux Falls, SD
HIERARCHICAL KNOWLEDGE BASED CLASSIFICATION (HKBC) ON SENTINEL-
2A DATA FOR GLACIER MAPPING OF BHAGA RIVER BASIN, NORTHWEST
HIMALAYA.
Aayushi Pandey, MSc intern; Aman Rai, MSc intern
Sharad Kumar Gupta, PhD Scholar
Dericks P. Shukla, Assistant Professor
School of Engineering,
Indian Institute of Technology, Mandi,
Himachal Pradesh, India
ABSTRACT
Morphological changes to glaciers and their mapping has always been one of most important scientific studies. Taking
into consideration the extent and isolation of glaciers, remote sensing acts as a valuable tool for regular mapping,
monitoring and dynamic studies of glaciers. The aim of this study was to map the areal extant of Glaciated classes
(Snow, Ice and Ice Mixed with Debris) and surrounding non-glaciated classes (Vegetation, Water bodies,
Debris/Outwash and Valley Rock) using different techniques in Bhaga Basin covering 1640.54 Km2 in Chenab valley
in North Western Himalayas. Various image classification techniques i.e. Image Ratios, Spectral Indices, Supervised
classification using Maximum Likelihood classifier (MLC), and Hierarchical Knowledge Base Classification (HKBC)
were applied on high-resolution Sentinel-2A level-1c satellite data of October, 22, 2016. Here NIR/SWIR ratio with
a threshold value of 1.9 was found to be most suitable for masking glaciers from other non-glaciated terrain classes.
SWIR/BLUE ratio image was used with a threshold value of >0.25 and slope <24 for mapping debris while value>
0.25 was used with slope >24. Validation was performed using a High Resolution (2 meters) Worldview Image using
400 stratified random points. The overall accuracy of MLC was 66% while that of HKBC was 89.50 %. According to
HKBC, total areal extent of glaciers (Snow, Ice and IMD) in Bhaga basin was 343.34 km2, nearly 20.9 % of study area
comprising of 12.48% Snow covered area, 6.48% Ice and 1.76% IMD covered area. Non-glaciated classes (vegetation,
water, debris/outwash plain and valley rock) covered 79.1% of the total area out of which valley rock is dominant
with 61.29% coverage followed by debris/outwash plain covering 13.96% of the area in Bhaga Basin. Hence, HKBC
is a better technique for mapping various glaciated terrain and using higher resolution data like Sentinel 2 can increase
the efficiency of mapping.
KEYWORDS: Glacier mapping; Sentinel-2 satellite image; Maximum Likelihood Classifier (MLC); Hierarchical
Knowledge Base Classification (HKBC); Bhaga River Basin; North Western Himalaya
INTRODUCTION
Mountain glaciers are essential part of the cryosphere and one of the most important constituents of the Earth’s
natural system. Himalayan glaciers covers the largest continental area of mountain glaciers and hence feeds three major
river systems namely Indus, Ganges and Brahmaputra in the Indian sub-continent. The youngest and highest mountain
chain of the world, Himalaya covering an area of 37,466 km2 has around 9575 glaciers within the boundary of India
(Kaul, 1999; Sangewar et al., 2009). Therefore mapping of the glaciated terrain is vital for estimation of snow cover in
the studies of mass balance, runoff modelling of melt water and prediction modelling of snow related hazard on a local
scale (Berthier 2007). While this estimation of snow cover is needed for hydrological modelling on a regional scale
(Fukushima et al., 1991; Khromova et al., 2006) and energy exchange & climate variations on global scale due to high
albedo (Wang et al., 2003; Oerlemans et al., 2007).
Glaciated terrain mapping can be described based on the scale of mapping (large, medium, small), electromagnetic
spectrum region (ultraviolet, visible, infrared, or microwave), sensor used (Landsat TM, IRS LISS-III, ASTER) and

Pecora 20 - Observing a Changing Earth; Science for Decisions— Monitoring, Assessment, and Projection
November 13-16, 2017 Sioux Falls, SD
image information extraction techniques. Mapping and monitoring through the conventional techniques for the study of
Himalayan glaciers is challenging as it is situated in harsh environment and it covers a vast region. A combined approach
of remote sensing data along with field investigation is one of the best approaches for mapping which requires long term
time consuming field investigations in harsh weather and remote locations in high mountain glaciers. Hence remote
sensing works as an effective technology for the regular mapping of glaciers in a comprehensive manner (Gratton et al.,
1990; Raina and Srivastava, 2008; Bolch et al., 2010; Bhambri et al., 2011; Paul and Mölg, 2014; Shukla and Ali, 2016).
Remote sensing data from Landsat satellite images have been used for glacier mapping since late 1970’s as Landsat data
is freely available and while other satellite data of higher spatial resolution is costly and many times are unavailable. Due
to high cost of commercial satellite data and medium resolution of freely available satellite data, precise mapping and
monitoring of glaciers have been a challenging task. With the launch of European Copernicus Sentinel-2A satellite in
June 2015, comparatively better spatial resolution (10m & 20m) in many spectral bands with 10 days temporal resolution,
good quality of free data is available for glacier mapping (Kääb et al., 2016). Using higher spatial, temporal and spectral
resolution data improves the accuracy of results.
In this study various land use and land cover features were extracted within the areal extant of glaciated classes (Ice
Mixed with Debris, Ice and snow) and their surrounding non-glaciated classes (Vegetation, Water bodies, Debris/
Outwash and Valley Rock). Various methods such as Image Ratios, Spectral Indices were used to extract some features
and based on the threshold the image was classified using Maximum Likelihood classifier, a supervised classification
technique, and Hierarchical Knowledge Based Classification on a high resolution Sentinel 2A satellite dataset of Bhaga
River Basin, North West Himalaya, India.
STUDY AREA
Bhaga River basin is a sub basin of Chenab river basin
situated in Lahaul-Spiti district of Himachal Pradesh, India. It is
located between 32°28’12’’ N - 32°59’45” N latitude and
76°56’45” E - 77°24’58” E longitude. This basin is main formed
of U-shaped valleys developed due to incessant glacial activity,
thus creating highly rugged topography with glacier cladded high
peaks as shown in figure 1. It receives heavy snowfall in winter
season and most of the terrain is devoid of vegetation cover,
however during ablation period sparse vegetation and small
grasses grow near the Bhaga River owing to suitable temperature
and moisture conditions. The elevation ranges between 2856 m to
6507 m above sea level. Some of the important glaciers of Bhaga
basin are Lady of Keylong, Mulkila, Milang and Gangstang. Two
famous lakes namely Suraj Tal and Patsio are also situated in this
basin.
DATA USED
Availability of cloud free data and season of data acquisition is important for glacier mapping. Sentinel 2A Level 1c
dataset of 22nd Oct 2016 was selected as primary data source. There are 13 Bands in sentinel 2 datasets from visible to
shortwave infrared but no thermal bands are available. 6 Bands out of 13 bands of Sentinel 2 satellite have been used in
this study (table 1). Band 4 (RED), 8 (NIR) & 11 (SWIR) are the most important bands for mapping and monitoring
glaciers. Shuttle Radar Topography Mission (SRTM) digital elevation model (DEM) of 30 meter resolution was also
used. For the validation purpose, high resolution (2 meters) worldview image data has been used.
Figure 1. Bhaga River Basin (in FCC, Bands 11,
8, 4) located in Himachal Pradesh, India.
Table 1. Details of the Sentinel-2 Bands used in this study
Band
Number Band
name Resolution
(meters) Central
wavelength (nm)
2 Blue 10 490
3 Green 10 560
4 Red 10 665
8 NIR 10 842
11 SWIR 20 1610
12 SWIR 20 2190
Pecora 20 - Observing a Changing Earth; Science for Decisions— Monitoring, Assessment, and Projection
November 13-16, 2017 Sioux Falls, SD
METHODOLOGY
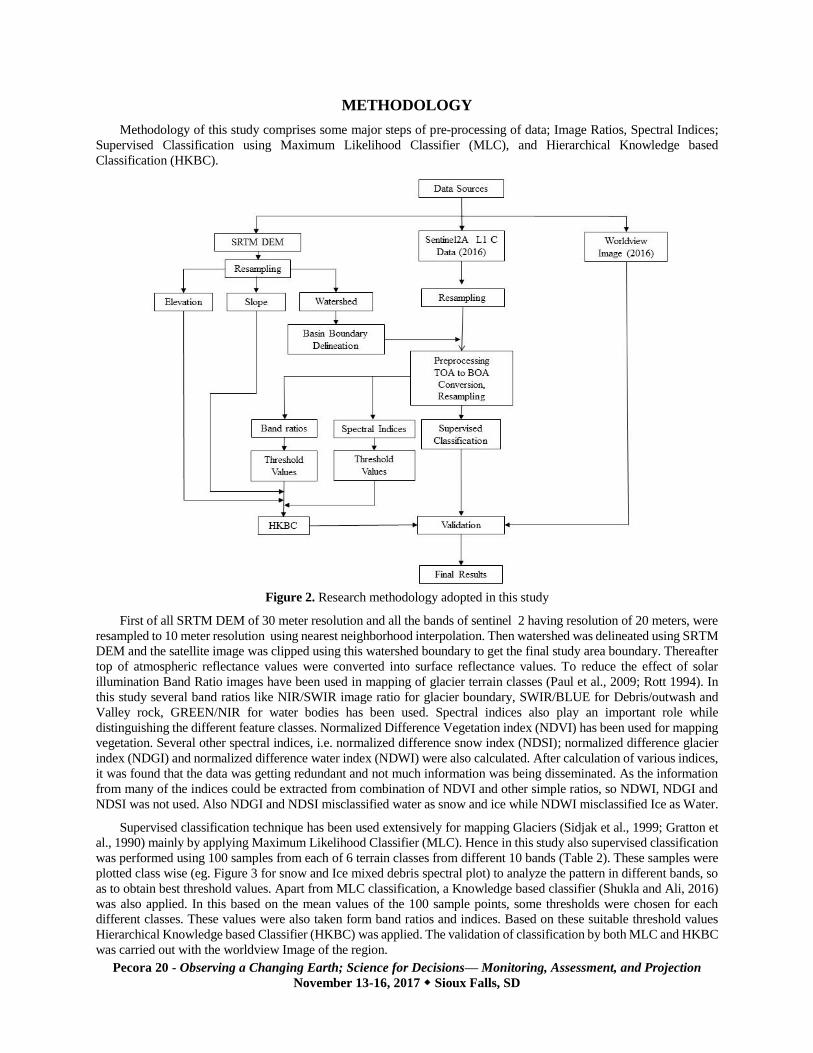
Methodology of this study comprises some major steps of pre-processing of data; Image Ratios, Spectral Indices;
Supervised Classification using Maximum Likelihood Classifier (MLC), and Hierarchical Knowledge based
Classification (HKBC).
Figure 2. Research methodology adopted in this study
First of all SRTM DEM of 30 meter resolution and all the bands of sentinel 2 having resolution of 20 meters, were
resampled to 10 meter resolution using nearest neighborhood interpolation. Then watershed was delineated using SRTM
DEM and the satellite image was clipped using this watershed boundary to get the final study area boundary. Thereafter
top of atmospheric reflectance values were converted into surface reflectance values. To reduce the effect of solar
illumination Band Ratio images have been used in mapping of glacier terrain classes (Paul et al., 2009; Rott 1994). In
this study several band ratios like NIR/SWIR image ratio for glacier boundary, SWIR/BLUE for Debris/outwash and
Valley rock, GREEN/NIR for water bodies has been used. Spectral indices also play an important role while
distinguishing the different feature classes. Normalized Difference Vegetation index (NDVI) has been used for mapping
vegetation. Several other spectral indices, i.e. normalized difference snow index (NDSI); normalized difference glacier
index (NDGI) and normalized difference water index (NDWI) were also calculated. After calculation of various indices,
it was found that the data was getting redundant and not much information was being disseminated. As the information
from many of the indices could be extracted from combination of NDVI and other simple ratios, so NDWI, NDGI and
NDSI was not used. Also NDGI and NDSI misclassified water as snow and ice while NDWI misclassified Ice as Water.
Supervised classification technique has been used extensively for mapping Glaciers (Sidjak et al., 1999; Gratton et
al., 1990) mainly by applying Maximum Likelihood Classifier (MLC). Hence in this study also supervised classification
was performed using 100 samples from each of 6 terrain classes from different 10 bands (Table 2). These samples were
plotted class wise (eg. Figure 3 for snow and Ice mixed debris spectral plot) to analyze the pattern in different bands, so
as to obtain best threshold values. Apart from MLC classification, a Knowledge based classifier (Shukla and Ali, 2016)
was also applied. In this based on the mean values of the 100 sample points, some thresholds were chosen for each
different classes. These values were also taken form band ratios and indices. Based on these suitable threshold values
Hierarchical Knowledge based Classifier (HKBC) was applied. The validation of classification by both MLC and HKBC
was carried out with the worldview Image of the region.

Pecora 20 - Observing a Changing Earth; Science for Decisions— Monitoring, Assessment, and Projection
November 13-16, 2017 Sioux Falls, SD
Table 2. Mean reflectance of 100 samples from each class in different bands. The threshold values for various band ratios
are marked as bold red.
Bands 2 3 4 5 6 7 8 11 12 8A
Snow 0.801 0.807 0.860 0.874 0.872 0.863 0.852 0.088 0.095 0.849
Ice 0.455 0.465 0.504 0.512 0.507 0.489 0.476 0.047 0.048 0.471
IMD 0.395 0.413 0.446 0.455 0.450 0.432 0.418 0.062 0.059 0.414
Water 0.106 0.120 0.109 0.113 0.096 0.096 0.082 0.094 0.076 0.092
Outwash 0.153 0.185 0.224 0.236 0.241 0.248 0.247 0.312 0.257 0.249
Valley rock 0.099 0.126 0.161 0.173 0.182 0.191 0.192 0.271 0.230 0.199
Hierarchical Knowledge based Land cover classification
Glaciated classes: The ratio image of NIR/SWIR with a threshold value of 1.9 was found to be most suitable for
masking glaciers from other non-glaciated terrain classes. While observing the spectral curves for different land cover
classes it was noticed that in visible bands, the reflectance values of shadow zones were less than 0.1. This threshold
value was used with elevation of > 5400 m to classify snow in shadow and < 5400m for Ice Mixed Debris in shadow
Snow: In this study glaciated terrain classes were mapped using RED Band with suitable threshold values. Upper
limit of the ice which was obtained from the statistical analysis (mean + 2 standard deviation (SD)) and was used as
the lower limit for categorizing snow. Therefore the threshold value of elevation > 5400 m or RED band < 0.1 or RED
band > 0.67 for Bhaga basin were found to be the most suitable for extracting the snow.
Ice: The lower and upper limits were decided on the basis of (mean – 2SD) and (mean+2SD) respectively. Hence
extraction of ice from other terrain classes was done by using red band with threshold values of > 0.35 and < 0.67 for
Bhaga basin.
Ice Mixed Debris (IMD): IMD has lower reflectance than ice therefore the lower limit of ice, were taken as the higher
limit of the ice mixed with debris and lower limit of ice mixed with debris was obtained from (mean-2SD). Therefore ice
mixed with debris was also Mapped using the RED band with threshold values of elevation < 5400 or RED band < 0.1and
> 0.25 and < 0.35 for Bhaga Basin.
Debris/Outwash and Valley rock: It was found that debris/outwash and valley rock showed higher reflectance in
SWIR band and lowest in Blue band. Slope can be used as threshold to discriminate valley rock from debris (Paul et al.,
2004; Karimi et al., 2012). Therefore SWIR/BLUE > 0.25 and slope < 24 was applied for Debris/ outwash and
SWIR/BLUE > 0.25 and slope > 24 is used for valley rock.
Vegetation: Vegetation shows high reflectance in the near infrared region and low reflectance in red band. Threshold
value of NDVI > 0.21 was found to be most useful for mapping vegetation cover in Bhaga basin.
Water: Water bodies show high reflectance in green band and low reflectance in near infrared band therefore the band
ratio of Green and NIR band was used for discriminating the water bodies from other classes. Threshold value of
GREEN/NIR > 1.5 was found to be the best for classifying water bodies in this basin.
Figure 3. Mean reflectance values of 100 samples from snow (left) and Ice Mixed Debris (right) in different bands

Pecora 20 - Observing a Changing Earth; Science for Decisions— Monitoring, Assessment, and Projection
November 13-16, 2017 Sioux Falls, SD
RESULTS AND DISCUSSIONS
Bhaga Basin covering an area of 1640.54 km2 was classified using MLC and HKBC techniques. The results are
shown as map in figure 4. Just by looking at those map is could be seen that very less area is classified as snow by MLC
as compared to HKBC. Similarly vegetation areas seems to be coving a lager area according to MLC classification as
compared to HKBC classification. Detailed results ar presented below:
Results of MLC Method
Results from MLC method indicate total glaciated portion covers an area of 300.60 km2, which is 18.32 % of the
total study area as given in table 3. Glaciated portion is comprised of snow, ice, and IMD which are found to be 3.75%,
5.32% and 9.25% respectively. Thus mere 61.52 km2 (3.75%) is classified as snow while nearly 2.5 times of snow
covered area is classified as IMD (151.81 km2). This indicates that during the October month (winter month) the IMD
class is very high and snow covered regions are very less. Non Glaciated area covered nearly 81.68% of the total area.
Vegetation, water, debris/ outwash plain and valley rock comes under non glaciated regions. According to MLC, valley
rocks cover 50.42% of the study area and debris/outwash covers 15.50% of the total area. Interestingly, MLC classified
10.34% of the total area as vegetation and 5.41% is classified as water body. This is clearly visible in the map in figure
4. It seems that MLC gives higher estimates of vegetated and water covered areas. Many of the moraines are misclassified
as water class by MLC.
Results of HKBC Method
According to HKBC, total areal extent of glaciated
region (Snow, Ice and IMD) comes out to be 343.35 km2,
nearly 20.9% of the whole study area as shown in table 3.
While remianing 80.1% of the area falls under non glaciated
classes i.e. vegetation, water, debris/outwash and valley
rocks. Among the glaciated class, snow covers the highest
area with 204.80 km2 approximately 12.48% of the whole
study area while IMD has least area of 28.90 km2 (1.76% of
the study area). Out of the non glaciated regions, valley rock
alone covers about 61.29% followed by debris/ outwas
plain covering approximately 13.96% area. Interestingly
according to HKBC just 0.03% is classified as water body
and 3.79% as vegetation. Visually these classifiactions can
be clearly seen in figure 4 where HKBC has more area
under snow, and less area in IMD and vegetation with least
being the water body identified as 2 lakes in this area.
Generally in glacier mapping studies, only glaciated and non-glaciated areas are classified. So considering this, it is
seen that both MLC and HKBC classified 18.32% and 20.9% respectively of the area as glaciated and remaining as non-
glaciated. Both these method have just a difference of little more than 2.5% while classifying glaciated area. However
when this region is classified as snow, ice and IMD, HKBC present a more realistic classification where IMD has least
area and snow covers the most area; while MLC classified just the opposite (IMD maximum and snow least area). Similar
observations were made in case of water and vegetation in non-glaciated region. HKBC was more realistic in classifying
vegetation and water to be covering 62.19 km2 and 0.51 km2 respectively in comparison to 16.64 km2 and 88.82 km2
respectively as classified by MLC. MLC misclassified lot of valley rock and IMD as water and vegetation. It is evident
that in high mountainous region which receives less rainfall but more snowfall, the amount of vegetation will be very
less mainly found near the river channels. Hence in such an environment more than 10% area being classified as
vegetation is very rare. Similarly more than 5% area being classified as water bodies seems unrealistic. Hence MLC
seems to have misclassified a lot whereas HKBC overcame these misclassification errors. As per HKBC, water bodies
covers 0.03% of the total area, which indicates correct mapping and classification of many small lakes in this area.
In contrast, HKBC was able to classify the image in a better and more realistic way. This could be attributed to the
fact that HKBC classificatio was caried out based on the thresholds defined by some statistical measures and earlier
published information. These threshold reduced the effect of shadow and other misclssifications. The threshold defined
for slope > 24 was very effective in discriminating valley and debris/Outwash and it showed satisfactory results.
Table. 3 The areal estimates of glacial terrain classes
in Bhaga Basin derived from classified images Using
HKBC and MLC techniques
Class Names MLC HKBC
Area in sq. km. Area in sq. km.
Snow 61.5208 204.8021
Ice 87.2675 109.6558
IMD 151.8130 28.8958
Vegetation 169.6404 62.1864
Water 88.8189 0.5067
Debris/Outwash 254.3483 229.0896
Valley Rock 827.1354 1005.408
Total Area 1640.544 1640.544

Pecora 20 - Observing a Changing Earth; Science for Decisions— Monitoring, Assessment, and Projection
November 13-16, 2017 Sioux Falls, SD
Figure 4. Classified image of Bhaga Basin prepared using Maximum Likelihood Classifier (MLC) left side and Hierarchical Knowledge based Classification
(HKBC). In right side.

Pecora 20 - Observing a Changing Earth; Science for Decisions— Monitoring, Assessment, and Projection
November 13-16, 2017 Sioux Falls, SD
Accuracy Assessment
Accuracy assessment is very important for validation
of the work done. Therefore accuracy assessment was
performed keeping high resolution (2 m) image of
Worldview 2 as reference data to assess the accuracy of
classified images. 400 random stratified points are used to
assess the accuracy of MLC and HKBC classified image.
The overall accuracy of MLC was 66.75% with a
kappa coefficient of 0.44, while that of HKBC was found
to be 89.50% with a kappa coefficient of 0.81. The
accuracy values of MLC (user’s and producer’s accuracies)
range from 20% to 100% while that for HKBC varies from
60% to 100%. In the MLC classified image the lowest
producer’s accuracy was observed in snow (30.77%) followed by ice (43.33%) and debris/ outwash (43.64%) while
the lowest user’s accuracy was seen in water (20.83%), snow (40.00%) and vegetation (46.67%). Whereas in HKBC
image, ice showed the least producer’s (60.00%) and user’s accuracy (70.59%), followed by lower producer’s
accuracy for IMD (64.29%) and lower user’s accuracy for debris/ outwash (76.71%). Water bodies showed the highest
user’s accuracy and producer’s accuracy of100% in HKBC image, whereas according to MLC it has 100% producer’s
accuracy but only 20.83% user accuracy. Valley rock has comparatively higher producer’s and user’s accuracy for
both MLC and HKBC image.
Results obtained for MLC image showed misclassification of snow into IMD and IMD is misclassified as
debris/outwash due to similar spectral response of debris and IMD. Lower individual accuracy of MLC indicates that
large parts of most of the classes mapped via MLC were misclassified. Overall accuracy of all the features were higher
in HKBC classified image than MLC image. Hence, it clearly indicates that efficiency of images derived from HKBC
was higher than MLC images. Most of the areas covered by glaciers were mapped correctly according to HKBC
method. Individual glaciated classes (Snow, Ice and IMD) indicated misclassification of one class into another class
due the similar spectral responses. Some of the points that needs to be addressed while carrying out glacier
classification studies are:
• Shadow is one of the major problems while mapping the glaciated terrain.
• Debris/Outwash was misclassified as IMD due to presence of shadow.
• Debris/Outwash near glaciers was also misclassified as valley rock due to the similar spectral response of
Debris and Valley rock.
• Some areas in Debris/outwash were misclassified as water due to higher moisture content available in debris
and outwash near IMD.
• Water bodies can be mapped more accurately using HKBC rather than MLC method.
CONCLUSION
HKBC outperformed MLC in glacier mapping and classification of nearly all classes present in the high mountainous
region of Bhaga River Basin. Some classes were misclassified by HKBC while most of the classes were misclassified by
MLC method. Most of the misclassification in HKBC happened for the classes that have similar spectral characteristics
i.e. between debris & valley rock; IMD & Debris and Snow & Ice.
The overall accuracy of HKBC (89.50%) and MLC (66.75%) indicates that HKBC is the most effective method for
mapping various glacier terrain classes while the accuracy of MLC can be increased if other inputs (i.e. thermal bands
and topographically corrected images) are applied. However, HKBC is more time consuming than supervised
classification but it is more accurate than MLC. Band ratio of different combinations of bands have effectively reduced
the shadow effect. Slope value of < 24 is most suited for discriminating valley rock and debris/outwash despite the fact
that it misclassified valley rock as debris in some parts of basin where this threshold might not be as effective. Utilization
of Sentinel 2A satellite data in mapping and classification is highly recommended due to its higher spatial and spectral
resolution. However with addition of thermal data debris and outwash can be discriminated based on their temperature
difference irrespective of their similar spectral response and slope. This requires multi sensor image fusion and detailed
research study to suggest its effectiveness in glacier mapping.
Class Name
MLC HKBC
Producer’s
Accuracy
User’s
Accuracy
Producer’s
Accuracy
User’s
Accuracy
Snow 30.77% 40.00% 78.26% 81.82%
Ice 43.33% 68.42% 60.00% 70.59%
IMD 45.45% 26.32% 64.29% 81.82%
Vegetation 61.76% 46.67% 89.47% 100.00%
Water 100.00% 20.83% 100.00% 100.00%
Debris/outwash 43.64% 51.06% 90.32% 76.71%
Valley rock 77.38% 82.63% 93.65% 94.40%
Table 5. Producer’s and User’s accuracy of seven
glacial terrain classes

Pecora 20 - Observing a Changing Earth; Science for Decisions— Monitoring, Assessment, and Projection
November 13-16, 2017 Sioux Falls, SD
References
Berthier, E., Arnaud, Y., Kumar, R., Ahmad, S., Wagnon, P., and Chevallier, P.,2007.Remote sensing estimates
of glacier mass balances in the Himachal Pradesh (Western Himalaya, India),Remote Sensing of Environment, 108(3),
327–338.
Bhambri R, Bolch T and Chaujar R. K, 2011. Mapping of debris covered glaciers in the Garhwal Himalayas using
ASTER DEMs and thermal data. Int. J. Remote Sens., 32, 8095–8119
Bolch T, Menounos B and Wheate R., 2010. Landsat-based glacier inventory of western Canada, 1985–2005.
Remote Sens. Environ, 114, 127–137 (doi: 10.1016/j.rse.2009.08.015)
Fukushima, Y., Watanabe, O., Higuchi, K., 1991. Estimation of Stream flow change by global warming in a
glacier-covered high mountain area of the Nepal Himalaya, In Proceedings of Bergmann, H., Lang, H. P., Frey, W.,
Issler, D., and Salm, B. (eds.), International symposium snow, hydrology and forests in high alpine areas Vienna,
August 11 –24, 1991. International association of hydrological sciences. IAHS/AISH Publication. 205, pp. 181–188.
Gratton, D. J., Howarth, P. J., Marceau, D. J., 1990.Combining DEM Parameters with Landsat MSS and TM
Imagery in a GIS for Mountain Glacier Characterization, IEEE Transactions on Geoscience and Remote Sensing
28,766−769.
Kääb, A.; Winsvold, S.H.; Altena, B.; Nuth, C.; Nagler, T. and Wuite, J., 2016. Glacier Remote Sensing using
Sentinel-2. Part I: Radiometric and geometric performance, application to ice velocity. Remote Sens.,
doi:10.3390/rs8070598.
Karimi N, Farokhnia A, Karimi L, Eftekhari M, and Ghalkhani H., 2012. Combining optical and thermal remote
sensing data for mapping debris-covered glaciers (Alamkouh Glaciers, Iran). Cold Reg. Sci. Technol., 71, 73–83
(doi:10.1016/j.coldregions.2011.10.004
Kaul M. K, 1999.Inventory of Himalayan Glacier, Geological Survey of India, Special Publication 34.
Khromova, T. E., Osipova, G. B., Tsvetkov, D. G., Dyurgerov, M. B., and Barry, R. G., 2006. Changes in glacier
extent in the eastern Pamir, Central Asia, determined from historical data and ASTER imagery. Remote Sensing of
Environment, 102 (1–2), 24–32.
Oerlemans, J., Dyurgerov, M., and Van de Wal, R. S. W., 2007. Reconstructing the glacier contribution to sea-
level rise back to 1850. The Cryosphere Discuss, www.the-cryospherediscuss.net/1/77/2007/, 1: 77–97
Paul F and Mölg, 2014. Hasty retreat of glaciers in northern Patagonia from 1985 to 2011. J. Glaciol, 60(224), 1033–
1043 (doi: 10.3189/2014JoG14J104)
Paul F, Huggel C and Kääb A, 2004. Mapping of debris-covered glaciers using multispectral and DEM
classification techniques. Remote Sens. Environ., 89, 510–518 (doi: 10.1016/j.rse.3003.11.007
Paul, F., Barry, R. G., Cogley, J. G., Frey, H., Haeberli, W. A., Ohmura, C. S. L., Ommanney, B., Raup, A.,
Rivera, Zemp, M., 2009. Recommendations for the Compilation of Glacier Inventory Data from Digital Sources,
Annals of Glaciology, 50: 119–126.
Raina V. K, and D. Srivastava, 2008. Glacier Atlas of India. Bangalore: Geological Society of India.
Rott, H., 1994. Thematic Studies in Alpine Areas by Means of Polarimetric SAR and Optical Imagery, Advances
in Space Research, 14: 217–226.
Sangewar C. V., Shukla S. P., 2009.Inventory of the Himalayan Glaciers: A Contribution to the International
Hydrological Programme, An Updated Edition, Kolkata: Geological Survey of India (Special Publication 34).
Shukla, A., Ali, I., 2016. A hierarchical knowledge-based classification for glacier terrain mapping: a case study
from Kolahoi Glacier, Kashmir Himalaya, Annals of Glaciology, 57(71), 1-10.
Sidjak, R. W., Wheate,R. D., 1999.Glacier Mapping of the Illecillewaet Ice field, British Columbia, Canada,
Using Landsat TM and Digital Elevation Data, International Journal of Remote Sensing, 20: 273−284.
Wang, J., Li, W., 2003. Comparison of methods of snow cover mapping by analyzing the solar spectrum of
satellite remote sensing data in China, International Journal of Remote Sensing,24(21), 4129–4136.